HIV AND AIDS UGANDA COUNTRY PROGRESS REPORT; 2013
←
→
Page content transcription
If your browser does not render page correctly, please read the page content below
HIV AND AIDS UGANDA COUNTRY
      PROGRESS REPORT; 2013

Plot 1-3 Salim Bey Road, Ntinda Nakawa Division;
P.O. Box 10779, Kampala- Uganda Tel: +256-414-288065
Fax: +256-41-347447 Email: uac@uac.go.ug
Website: http://www.aidsuganda.org

                                        31st March, 2014

2013 Uganda HIV and AIDS Country Progress report           Page i
ABBREVIATIONS AND ACRONYMS

ACP          AIDS Control Program
AIDS         Acquired Immune Deficiency Syndrome
AIS          AIDS Indicator Survey
ANC          Antenatal care
ART          Antiretroviral Therapy or Treatment
ARVs         Antiretroviral Drugs
BCC          Behaviour Change Communication
CDC          Centres for Disease Control
CPHL         Central Public Health Laboratory
CSO          Civil Society Organization
DHS          Demographic and Health Survey
EID          Early Infant Diagnosis
eMTCT        Elimination of Mother-to-Child Transmission (of HIV)
FBO          Faith Based Organization
FP           Family Planning
GARPR        Global AIDS Response Progress Report
GFATM        Global Fund to Fight AIDS, Tuberculosis and Malaria
GOU          Government of Uganda
HBC          Home Based Care
HC           Health Centre
HCT          HIV Counselling and Testing
HIV          Human Immunodeficiency Virus
HMIS         Health Management Information System
HRH          Human Resources for Health
IRCU         Inter Religious Council of Uganda
JAR          Joint AIDS Annual Review
JMS          Joint Medical Stores
M&E          Monitoring and Evaluation
MAAIF        Ministry of Agriculture, Animal Industry and Fisheries
MARPs        Most-at-Risk Populations
MDGs         Millennium Development Goals
MEEPP        Monitoring and Evaluation of PEPFAR Progress
MOES         Ministry of Education and Sports
MOFEP
MOGLD        Ministry of Gender Labour and Social Development
MOH          Ministry of Health
MOIA         Ministry of Internal Affairs
MOLG         Ministry of Local Government
MSM          Men who have Sex with Men
MTCT         Mother to Child Transmission
MTR          Mid-Term Review
NACWOLA      National Community of Women Living with HIV/AIDS
NAFOPHANU    National Forum of People with HIV/AIDS Network in Uganda
NASA         National AIDS Spending Assessment
NDP          National Development Plan
NGO          Non-Governmental Organization
NMS          National Medical Stores

2013 Uganda HIV and AIDS Country Progress report                        Page ii

NPAP         National Priority Action Plan (for HIV/AIDS)
NSP          National Strategic Plan (for HIV/AIDS)
NTLP         National TB and Leprosy Control Program
NTRL         National TB Reference Laboratory
OI           Opportunistic Infection
OVC          Orphans and Vulnerable Children
PACE         Program for Accessible health, Communication and Education
PCR          Polymerase Chain Reaction
PEP          Post-Exposure Prophylaxis
PEPFAR       US Presidential Emergency Fund for AIDS Relief
PITC         Provider Initiated HIV Testing and Counselling
PLHIV        People Living with HIV
PMTCT        Prevention of Mother To Child Transmission (of HIV)
PNC          Post Natal Care
PREFA        Protecting Families Against HIV/AIDS
PrEP         Pre-Exposure Prophylaxis
QPPU         Quantification and Procurement Planning Unit
SCM          Supply Chain Management
SRH          Sexual and Reproductive Health
STI          Sexually Transmitted Infection
SWs          Sex Workers
TASO         The AIDS Support Organization
TB           Tuberculosis
THETA        Traditional and Modern Heath Practitioners Together against AIDS
TWG          Technical Working Group
UAC          Uganda AIDS Commission
UNAIDS       Joint United Nations Program on HIV/AIDS
UNFPA        United Nations Population Fund
UNICEF       United Nations Children’s Fund
UPDF         Uganda People’s Defence Force
USAID        United States Agency for International Development
VCT          Voluntary Counselling and Testing
VHT          Village Health Team
WHO          World Health Organization

2013 Uganda HIV and AIDS Country Progress report                                Page iii

Table of Contents
ABBREVIATIONS AND ACRONYMS .................................................................................................................................. ii
Executive Summary .............................................................................................................................................................. vii
Indicators Summary Table ................................................................................................................................................. xi
1.0 Introduction and Overview of the AIDS Epidemic in Uganda........................................................................ 1
  1.1 HIV Prevalence ............................................................................................................................................................. 1
     1.1.1 HIV prevalence among key populations .................................................................................................... 4
     1.1.2 HIV burden ............................................................................................................................................................ 4
  1.2 HIV Incidence ................................................................................................................................................................ 5
     1.2.1 Key Drivers of HIV Incidence ......................................................................................................................... 5
2.0 National response to the AIDS epidemic in 2013 ............................................................................................... 6
  2.1 Overview ......................................................................................................................................................................... 6
  2.2 Prevention ...................................................................................................................................................................... 7
     2.2.1 Delivery of HIV prevention services in 2013 .......................................................................................... 9
  2.3 Treatment and Care.................................................................................................................................................. 21
     2.3.1 ART ......................................................................................................................................................................... 22
  2.4 Support for PLHIV, HIV-affected families and other vulnerable households ................................... 26
  2.5 System Strengthening.............................................................................................................................................. 33
     2.5.1 Leadership and governance ......................................................................................................................... 34
     2.5.2 Resources to support HIV service delivery ............................................................................................ 34
     2.5.3 Direct investments to HIV service delivery systems .......................................................................... 39
     2.5.4 Community systems strengthening........................................................................................................... 40
3.0 Best practices ................................................................................................................................................................... 41
  3.1 Best Practice Examples in Policy and Political leadership ....................................................................... 41
  3.2 Best Practice examples in scale-up of effective prevention programmes ......................................... 41
  3.3 Best Practices in scale-up of care, treatment and/or support programmes .................................... 43
  3.4     Best Practice Examples in System Strengthening................................................................................. 43
4.0 Major challenges and remedial actions................................................................................................................. 44
  4.1Progress made on key challenges reported in the 2012 Country Progress Report........................ 44
  4.2     Challenges in 2013 and remedial actions for 2014.............................................................................. 47
5.0 Support from AIDS development partners.......................................................................................................... 51
  5.1 Key support received from ADPs ........................................................................................................................ 51
     5.1.1 Targeted ADP support to HIV prevention .............................................................................................. 53
     5.1.2 Targeted ADP support examples in treatment, care and support ................................................ 53
     5.1.3 ADP support to system strengthening governance and human rights ....................................... 54
  5.2 Key concerns in relation to ADP support ........................................................................................................ 55
  5.3 Actions that need to be taken by ADPs to ensure achievement of targets ........................................ 56
6.0 Monitoring and evaluation environment ............................................................................................................. 57
  6.1 Overview of the current monitoring and evaluation (M&E) system ................................................... 57
     6.1.1 Functioning of the M&E system in 2013 ................................................................................................. 58
     6.1.2 Best Practices in Monitoring and evaluation......................................................................................... 60
  6.2 Challenges faced in the implementation of a comprehensive M&E system ...................................... 63
  6.3 Remedial actions planned to overcome the challenges............................................................................. 64
  6.4 Need for M&E technical assistance and capacity-building....................................................................... 65
ANNEX 1: Consultation and preparation process for the country report ............ Error! Bookmark not
defined.
ANNEX 2: National Commitments and Policy Instrument (NCPI) results ..................................................... 66
ANNEX 3: Objectives and Targets of the 2011-2013 HIV National Priority Action Plan ......................... 67

2013 Uganda HIV and AIDS Country Progress report                                                                                                                             Page iv
LIST OF TABLES Table 1: Indicators summary table ........................................................................................................... xi Table 2: Trends in HIV Prevalence 2004 and 2011 AIS ........................................................................... 2 Table 3: Trends in HIV Prevalence by Marital Status – 2004 and 2011 AIS ........................................... 3 Table 4: HIV Prevalence in Key Populations – Sub-national studies....................................................... 4 Table 5: Trends in HIV Incidence 2010–2013 using mathematical modelling ...................................... 5 Table 6: Persons ever tested for HIV and received results – DHS 2000 to 2011 ................................... 9 Table 7: Sexual experience among adolescents 15-19 years – DHS 1995 to 2011 .............................. 13 Table 8: Prevalence of multiple sexual partnerships ............................................................................. 14 Table 9: Condom use for HIV prevention ................................................................................................ 15 Table 10: Annual reach with behaviour change interventions – PEPFAR-supported programs ....... 15 Table 11: Relative reach of PEPFAR-supported behaviour change interventions – by region ........... 16 Table 12: Provision of adult and paediatric ART by health facility categories – Sep 2013 ................. 22 Table 13: Trend of ART coverage – 2011 to 2013 .................................................................................. 23 Table 14: Experiences of internal stigma by PLHIV ............................................................................... 30 Table 15: PLHIV knowing their rights; and confronting stigma ............................................................ 31 Table 16: Policies and Strategies developed and reviewed in 2013 ..................................................... 34 Table 17: External financing for HIV and AIDS – 2011/2012 to 2014/2015 (US$ million) ............... 35 Table 18: Total HIV/AIDS funding by source (2008/9 and 2009/10).................................................. 36 Table 19: HIV/AIDS funding by source – 2008/09 and 2009/10 ......................................................... 36 Table 20: Details of spending by AIDS Spending Categories (2008/09 and 2009/10) ....................... 37 Table 21: Staffing levels in district health services – trends in positions filled 2011 to 2013............ 38 Table 22: Government recruitment of health personnel in 2013 ......................................................... 38 Table 23: Progress in addressing challenges from 2012 GARPR and the June 2013 MTR.................. 44 Table 24: Challenges in 2013 and planned remedial actions in 2014 and 2015 ................................. 47 Table 25: ADP actions on priorities identified in the 2012 GARPR....................................................... 51 Table 26: Financing Projections for Implementing the Investment Case – 2014 to 2018 .................. 56 Table 27: Key components of the one M&E system for a national AIDS response .............................. 57 LIST OF FIGURES Figure 1: Change in HIV Prevalence by age and sex - 2004/05 and 2011 ....................................................... 2 Figure 2: Proportion received HCT in previous 12 months ................................................................................. 10 Figure 3: Proportion had non-marital sex in previous 12 months ................................................................... 17 Figure 4: Proportion used a condom at last non-marital sex .............................................................................. 18 Figure 5: Number of children on ART 2006-2013 ................................................................................................... 24 Figure 6: Sources of funding for HIV/AIDS in Uganda (2008/9 and 2009/10) – UGX Billions ............ 35 Figure 7: Sources of funding for HIV/AIDS in Uganda – further disaggregated .......................................... 36 Figure 8: Expenditure by AIDS Spending Categories – 2008/9 and 2009/10 ............................................. 37 Figure 9: Trend in EID testing – 2011 to 2013 .......................................................................................................... 42 Figure 10: Categories of mapped organizations – 2013 online mapping ...................................................... 61 Figure 11: Distribution of mapped organizations – by district .......................................................................... 61 2013 Uganda HIV and AIDS Country Progress report Page v
2013 Uganda HIV and AIDS Country Progress report Page vi
Executive Summary

HIV Prevalence: The HIV epidemic in Uganda continues to be generalized, and has not changed
pattern in the last three decades. The country achieved impressive success in the control of HIV
during the 1990’s, bringing down HIV prevalence among adults aged 15-49 years from a national
average of 18.5% in 1992 to 6.4% as reported in the 2005 sero-survey. The 2011 AIDS Indicator
Survey in Uganda reported HIV prevalence at a national average of 7.3% and important variations
by sex and in specific regions. HIV prevalence in Uganda has consistently been higher among
women compared to men since the early years of the epidemic. Between the 2004/2005 and 2011
AIS, there was notable decline in HIV prevalence among women in Kampala, Eastern and Central
Eastern regions. These improvements may be a reflection of penetration of effective HIV
prevention interventions across communities in the respective regions. However, the overall
picture is of increased prevalence nationally and across the sexes.

HIV Burden: The total burden of HIV in Uganda, as represented by the number of persons in the
country that are living with HIV, has continued to increase. This is a result of continuing spread of
HIV, and increased longevity among persons living with HIV. Between 2007 and 2013, the
estimated number of people living with HIV increased from 1.2 million to 1.6 million. In 2012, the
PLHIV constituted 93% adults 15 years and above, women being 56% of these adults. The MOH
projections based on Spectrum indicate a total of 1,618,233 people living with HIV in 2013;
comprising of 1,441,285 adults, and 176,948 children below 15 years. The same source indicates a
decline in AIDS-related deaths between 2011 and 2013; from 72,928 in 2011, 70,262 in 2012, and
61,298 in 2013.

HIV Incidence: Although Uganda continues to experience a high rate of new HIV infections; the
trend over the last three years shows a decline, from an estimated 162,294 in 2011 and 154,589 in
2012, to 140,908 in 2013. However, HIV incidence increased in adults from 134,634 in 2011 to
139,178 in 2012, and only declined to 131,279 in 2013. Decline in incidence has been more
pronounced among children; from 27,660 in 2011, to 15,411 in 2012; and further down to 9,629 in
2013. The key drivers of HIV incidence in Uganda include: a) Personal understanding of and
attitude towards HIV; b) Awareness about personal and/or partner HIV status; and c) high risk
sexual behaviors including early sexual debut, multiple sexual relationships, limited and
inconsistent condom use; and transactional, cross-generational and commercial sex. Other factors
include: sexual relations accompanied by alcohol drinking; high fertility rate because of low
utilization of family planning; and low utilization of ANC and delivery services.

National AIDS Response: The Uganda AIDS response has evolved over the last three decades
through a 3-phase cycle: a) Aggressive response to an evident threat, mainly through mobilization
for a combined and supported action (from 1984 to 1989); b) Concerted and coordinated action
that yielded good results (especially in the early 1990s); and c) Change in the context and in the
response; which compromised the good results (beginning in the 1990s, through 2000 to 2009).
The years between 2010 and 2013 were characterized by a revitalized response to a new threat – a
clear reversal in the long experienced decline in HIV prevalence and incidence. At policy level, the
National AIDS Policy 2010; the National Strategic Plan (NSP) 2011-2015, the National Prevention
Strategy (NPS) 2011-2015, and the Health Sector Strategic Investment Plan (HSSIP) 2011-2015
were important milestones and a basis for other policies, strategies and guidelines to guide and
strengthen specific elements in the AIDS response. Coordination of the national response was
bolstered through a review and reconstitution of the UAC Board and Secretariat; and of the Uganda
AIDS Partnership Mechanism. Key elements and results from 2013 are presented below, along the

2013 Uganda HIV and AIDS Country Progress report                                            Page vii
GARPR 10 targets. The detailed results for the listed GARPR and Universal Access indicators are presented in Table 1 below this Executive Summary. Target 1: Reduce sexual transmission of HIV by 50% by 2015: Over all there has been a reduction in new HIV infections; with Spectrum projections at 162,294 in 2011; 154,589 in 2012 and 140,908 in 2013. Coverage with key prevention services between October 2012 and September 2013 included: 1,639,649 individuals reached with behavioral change interventions; including 287,302 targeted with MARPs interventions; and 1,352,347 reached through ABC interventions for the general population (including 760,185 specifically targeted with AB only). 8,208,188 individuals received HCT; 91.5 percent of them adults 15 years and above. Two- thirds (65.4 percent) of the adults 15-49 years old that received HCT were women; 801,678 males were reached with SMC, contributing to a cumulative total of 1,411,798; 187 million male and 5.8 million female condoms procured into the country; 525,495 adults on ART and thus contributing to ‘treatment for prevention’. Over 3,000 sex workers, MSM and related key populations received a comprehensive prevention and care package for STI/HIV services through the MARPI clinic in Mulago Hospital, and other sites in Kampala. A cumulative total of 280 MARPs have been enrolled on ART at a dedicated ART clinic within the MARPI services, operational since July 2013. Target 3: Eliminate new HIV infections among children by 2015 and substantially reduce AIDS-related maternal deaths A remarkable reduction in new infections among children was achieved; from 27,660 in 2011; 15,411 in 2012, and 9,629 in 2013. The elimination of Mother-to-Child Transmission (eMTCT) Option B+ approach was scaled up country-wide. It reached 1,726,177 mothers of known and documented HIV sero-status; 123,754 of them (7.2 percent) HIV positive. While 71.7 percent of the positive mothers received ARVs for eMTCT; only 36.7 percent of the exposed infants received ARVs for eMTCT. Target 4: Reach 15 million people living with HIV with lifesaving antiretroviral treatment by 2015 By 30 Sept 2013; a cumulative total of 793,893 PLHIV were enrolled on ART; and 570,373 were active on treatment. This achievement underpinned the sustained drop in AIDS-related deaths; from 72,928 in 2011; 70,262 in 2012 and 61,298 in 2013. Based on the 2010 WHO guidelines for ART, the proportion of all ART-eligible PLHIV that were on treatment by the end of September 2013 was 69.4 percent. However, this proportion falls to only 40.0 percent if the 2013 WHO guidelines for ART eligibility are used. A total of 162,232 eligible PLHIV were enrolled on ART between October 2012 and September 2013; higher than the estimated 140,908 new infections in 2013 Target 5: Reduce tuberculosis deaths in people living with HIV by 50% by 2015 Between 1 July and 30 Sept 2013, 668,203 HIV positive clients under care (76.1% of a total 877,486 attending in the quarter) were assessed clinically for TB. Over the same period, 4,121 HIV positive clients that had active TB were started on TB treatment. Overall, the estimated proportion of HIV positive incident TB cases that received treatment for both TB and HIV was 53.4 percent. 2013 Uganda HIV and AIDS Country Progress report Page viii
Target 7: Eliminating gender inequalities
PEPFAR-supported programs reached:
543,833 individuals with interventions that explicitly addressed GBV and coercion.
609,020 individuals with interventions and services that addressed legal rights and protection
of women and girls impacted by HIV.
943,964 individuals with interventions that explicitly addressed norms about masculinity
related to HIV
Service delivery promotion and support in private sector workplaces achieved:
353, 575 people reached with HIV prevention messages
4,638,942 pieces of condoms distributed in private sector companies and organizations.
31 Abstinence Clubs were formed and trained in company supported schools.
2,805 people were put on ART and care in company supported clinics.
15,488 people reached with HCT.
528 were provided with SMC services.
113 mothers received with EMTCT services in company supported clinics
MOGLSD disseminated and promoted implementation of 9 laws and policies related to GBV; and
trained 28 regional trainers and 128 key duty bearers on the revised Police Form 3. A total of 300
cultural leaders in 9 cultural institutions trained in community dialogue and supported to conduct
dialogue and community planning to address HIV, GBV, and SRH. Religious leaders and community
leaders were mobilized and trained on GBV, HIV and SRH through the Catholic Church (nationally)
and IRCU (in Busoga region)
Target 8: Eliminating stigma and discrimination
The 2013 stigma index study in Uganda reported experiences of both external and internal stigma.
External stigma was mainly experienced as gossip (by 60.5 percent of total surveyed); verbal
harassment (by 35.9 percent); and sexual rejection (by 21.5 percent). The forms of internal stigma
commonly experienced include: low self-esteem (reported by 35.4 percent); self-blame (by 36.8
percent); shame (by 30.6 percent); guilt (by 28.8 percent); and blaming others (by 25.2 percent).
Experiences of all forms of internal stigma were higher among females compared to their male
counterparts.
High level advocacy was undertaken by civil society, ADPs and other stakeholders, with particular
focus on the Anti-Homosexuality and the HIV Prevention and Control bills. This process contributed
to the major revisions to the Anti-Homosexuality bill; as reflected in the Act that was passed in
2013.
Target 10: Strengthening HIV integration
School attendance among orphans and non-orphans aged 10–14: Education sector reports indicate
that 14.7 percent of all children enrolled in primary school in 2013 were orphans. The proportion is
similar for boys and girls (15.3% and 14.5%). It compares closely with the 13.9% of children 5-14
years old reported to have one or both parents dead in the 2011 DHS.
District-based surveys in 2013 in 66 districts with USG-supported OVC-support programs reported
12% of the poorest households as reached with external economic support in the previous 12
months.
2013 Uganda HIV and AIDS Country Progress report Page ixStrengthen governance and leadership of the HIV response at all levels
UAC Institutional Review: was finalized; a zonal coordination sub-structure was instituted and
initiated in 3 of the 8 planned zones; staff were recruited and deployed in 11 positions at national
and zonal level.
Partnership Mechanism Review: was conducted in 2013; results were used to restructure and re-
vitalize the mechanism; with three main coordination clusters – civil society; decentralized and
district-based response, and central government sectors.
HIV-related policy and strategy development, review and implementation: nine key policies
and strategies were developed or reviewed in 2013: the National Youth Policy; School Health
Policy; The Uganda National Plan for eMTCT; National SRH/HIV Linkages and Integration strategy;
National Condom Strategy 2013-2015; National Comprehensive Condom Programming Strategy;
Revised guidelines and Strategic Plan 2013-2015 for TB-HIV collaboration; Leadership Advocacy
Strategy on HIV and AIDS; and Guidelines for HIV/AIDS Coordination at Decentralized levels in
Uganda, 2013
Target 6: Close the global AIDS resource gap by 2015 and reach annual global investment of
US$ 22–24 billion in low- and middle-income countries
Sustained financing for the national AIDS response was realized for 2013; and applied to key
elements of the service delivery system:
Human Resources: staffing level in district health services increased from 55% in 2012 to
61% in 2013; with recruitment of 7,211 staff; training of staff at all levels (service delivery,
supervision and management, etc.)
Strengthening Supply Chain Management (SCM) for HIV-related commodities: rationalizing
quantification, supply planning, procurement and distribution of HIV commodities; and
strengthening district and service-point capacity (projection, ordering, storage and managed
utilization)
Improving laboratory services: initiated construction of the national health laboratory; and
further development of the hub-based laboratory referral and communication system
(especially for EID)
Community systems strengthening: strengthening the capacity of CBOs as service delivery
partners; improving local level partnership, coordination and capacity sharing
Establish a coordinated and effective national system for management of strategic
information for the HIV response
Upgrade and revisions in key service delivery MIS: in health sector (DHIS2, Web-based ARV
ordering and reporting, open MRS, PMTCT mTrac); social development sector (OVC-MIS)
Strengthening coordination and consolidated national-level reporting: online mapping of
district-based stakeholders in HIV services; JAR used for in-depth reporting by SCEs; assessment
and revitalization planning for the National AIDS Documentation and Information Centre
2013 Uganda HIV and AIDS Country Progress report Page xIndicators Summary Table
Table 1: Indicators summary table
Targets and Indicators Status as at December 2013
Target 1: Reduce sexual transmission of HIV by 50% by 2015
General population
1.1 Percentage of young women and men aged 15-24 who correctly Women – 38.6%
identify ways of preventing the sexual transmission of HIV and who Men – 39.3%
reject major misconceptions about HIV transmission Total – 38.9%
Source: AIS 2011
1.2 Percentage of young women and men aged 15-24 who have had Women – 13.1%
sexual intercourse before the age of 15 Men – 11.9%
Total – 12.6%
Source: AIS 2011
1.3 Percentage of adults aged 15-49 who have had sexual intercourse Women – 3.0%
with more than one partner in the past 12 months Men – 18.7%
Total – 13.3%
Source: AIS 2011
1.4 Percentage of adults aged 15-49 who had more than one sexual Women – 15.8%
partner in the past 12 months who report the use of a condom during Men – 14.8%
their last intercourse Total – 15.0%
Source: AIS 2011
1.5 Percentage of women and men aged 15-49 who received an HIV test 59.3%
in the past 12 months and know their results (7,120,069/12,000,450)
HMIS (Oct 2012 – Sep 2013)
1.6 Percentage of young people aged 15-24 who are living with HIV Women – 4.9%
Men – 2.1%
Total – 3.7%
Source: AIS 2011
Sex workers
1.7 Percentage of sex workers reached with HIV prevention No data
programmes
1.8 Percentage of sex workers reporting the use of a condom with their 66%
most recent client Source: CRANE 1 study in greater
Kampala – 2008/09 (n=947)
1.9 Percentage of sex workers who have received an HIV test in the past Ever tested – 54%
12 months and know their results Source: CRANE study in greater
Kampala – 2008/09 (n=947)
1.10 Percentage of sex workers who are living with HIV 34.2%
Source: CRANE study in greater
Kampala – 2008/09 (n=866)
Men who have sex with men
1.11 Percentage of men who have sex with men reached with HIV No data
prevention programmes
1.12 Percentage of men reporting the use of a condom the last time they Casual partner – 43%
had anal sex with a male partner Steady Partner – 50%
Source: CRANE study in greater
Kampala – 2008/09 (n=306)
2013 Uganda HIV and AIDS Country Progress report Page xiTargets and Indicators Status as at December 2013
1.13 Percentage of men who have sex with men that have received an Ever tested – 44%
HIV test in the past 12 months and know their results Source: CRANE study in greater
Kampala – 2008/09 (n=306)
1.14 Percentage of men who have sex with men who are living with HIV 13.2%
Source: CRANE study in greater
Kampala – 2008/09 (n=306)
Testing and Counselling
1.16 HIV Testing in 15+ 7,512,048
Number of women and men aged 15 and older who received HIV testing HMIS (Oct 2012 – Sep 2013)
and counselling in the last 12 months and know their results
1.16.1 Rapid test kits stock-outs 44%
Percentage of health facilities dispensing HIV rapid test kits that (1303/ 2,987)
experienced a stockout in the last 12 months HMIS (Oct 2012 – Sep 2013)
Sexually Transmitted Infections
1.17 Sexually Transmitted Infections (STIs)
1.17.1 Percentage of women accessing antenatal care (ANC) services who 15.5%
were tested for syphilis (234,310/1,516,130)
HMIS (Oct 2012 – Sep 2013)
1.17.2 Percentage of antenatal care attendees who were positive for 2.0%
syphilis (30,018/1,516,130)
HMIS (Oct 2012 – Sep 2013)
1.17.3 Percentage of antenatal care attendees positive for syphilis who No data
received treatment
1.17.4 Percentage of sex workers with active syphilis No data
1.17.5 Percentage of men who have sex with men with active syphilis No data
1.17.6 Number of adults reported with syphilis (primary/secondary and No data
latent/unknown) in the past 12 months
1.17.7 Number of reported congenital syphilis cases (live births and No data
stillbirth) in the past 12 months
1.17.8 Number of men reported with gonorrhoea in the past 12 months No data
1.17.9 Number of men reported with urethral discharge in the past 12 73,153
months HMIS (Oct 2012 – Sep 2013)
1.17.10 Number of adults reported with genital ulcer disease in the past 12 125,282
months HMIS (Oct 2012 – Sep 2013)
Male circumcision
1.22 Male circumcision, prevalence 26.4%
(AIS 2011 among men 15 to 49
years)
1.23 Number of men circumcised last year 801,678
HMIS (Oct 2012 – Sep 2013)
Target 2: Reduce transmission of HIV among people who inject Not tracked in Uganda
drugs by 50% by 2015
Target 3: Eliminate new HIV infections among children by 2015
and substantially reduce AIDS-related maternal deaths
3.1 Percentage of HIV-positive pregnant women who receive anti- 71.7%
retrovirals to reduce the risk of mother-to-child transmission (88,792/123,754)
HMIS (Oct 2012 – Sep 2013)
3.1a Percentage of women living with HIV receiving antiretroviral No data
medicines for themselves or their infants during breastfeeding
3.2 Percentage of infants born to HIV-positive women receiving a 41.9%
virological test for HIV within 2 months of birth (42,667/101,907)
HMIS (Oct 2012 – Sep 2013)
3.3 Estimated percentage of child HIV infections from HIV-positive 9.2%
2013 Uganda HIV and AIDS Country Progress report Page xiiTargets and Indicators Status as at December 2013
women delivering in the past 12 months (9,625/105,059)
Spectrum Estimates; 2013
3.4 Pregnant women who were tested for HIV and received their results 93.0%
Percentage of pregnant women who know their HIV status (1,410,598/1,516,130)
HMIS (Oct 2012 – Sep 2013)
3.5 Percentage of pregnant women attending antenatal care whose male 19.7%
partner was tested for HIV in the last 12 months (298,254/1,516,130)
HMIS (Oct 2012 – Sep 2013)
3.6 Percentage of HIV-infected pregnant women assessed for ART 71.1%
eligibility through either clinical staging or CD4 testing (53,650/75,430)
HMIS (Oct 2012 – Sep 2013)
3.7 Percentage of infants born to HIV-infected women provided with ARV 36.7%
prophylaxis to reduce the risk of early mother-to-child transmission in the (37,423/101,907)
first 6 weeks HMIS (Oct 2012 – Sep 2013)
3.9 Percentage of infants born to HIV-infected women started on co- 30.1%
trimoxazole (CTX) prophylaxis within two months of birth (30,655/101,907)
HMIS (Oct 2012 – Sep 2013)
3.10 Distribution of feeding practices for infants born to HIV-infected No data
women at DPT3 visit
3.11 Number of pregnant women attending ANC at least once during the 1,516,130
reporting period HMIS (Oct 2012 – Sep 2013)
Target 4: Reach 15 million people living with HIV with lifesaving
antiretroviral treatment by 2015
4.1 Percentage of adults and children currently receiving antiretroviral 69.4%
therapy (570,373/821,721)
(Based on CD4 < 350)
HMIS (Oct 2012 – Sep 2013)
4.2a Percentage of adults and children with HIV known to be on 83.0%
treatment 12 months after initiation of antiretroviral therapy (30,602/36,860)
HMIS (Oct 2012 – Sep 2013)
4.2b HIV Treatment: 24 months retention No data
4.2c HIV Treatment: 60 months retention No data
4.3 Health facilities that offer antiretroviral therapy
4.3.a Number of health facilities that offer antiretroviral therapy (ART) 1,478
4.3.b Number of health facilities that offer paediatric antiretroviral 834
therapy (ART) HMIS (Oct 2012 – Sep 2013)
4.4 ARV stock-outs
Percentage of health facilities dispensing ARVs that experienced a stock- 6%
out of at least one required ARV in the last 12 months SPARS Quarterly survey (Jul-Sep
2013)
4.6 HIV care
4.6.a Total number of people enrolled in HIV care at the end of the 883,736
reporting period
4.6.b Number of adults and children newly enrolled in HIV care during 162,232
the reporting period HMIS (Oct 2012 – Sep 2013)
(2013)
4.7 Viral Load No data
4.7 a) percentage of people on ART tested for viral load (VL) who have
an undetectable viral
load in reporting period (2013)
4.7 b) percentage of people on ART tested for viral load (VL) with VL
2013 Uganda HIV and AIDS Country Progress report Page xiiiTargets and Indicators Status as at December 2013
level below ≤ 1,000 copies after 12 months of therapy (2013)
Target 5: Reduce tuberculosis deaths in people living with HIV by
50% by 2015
5.1 Percentage of estimated HIV-positive incident TB cases that received 53.4%
treatment for both TB and HIV (17,926/33,589)
HMIS (Oct 2012 – Sep 2013)
5.2 Percentage of people living with HIV (PLHIV) newly enrolled in care No data
who are detected having active TB disease (new)
5.3 Percentage of adults and children newly enrolled in HIV care starting No data
isoniazid preventive therapy (IPT)
5.4 Percentage of adults and children enrolled in HIV care who had TB 76.4%
status assessed and recorded during their last visit (675,373/883,736)
HMIS (Oct 2012 – Sep 2013)
Target 6: Close the global AIDS resource gap by 2015 and reach
annual global investment of US$ 22–24 billion in low- and middle-
income countries
6.1 Domestic and international AIDS spending by categories and Refer to Table 17 and Figure 6 in the
financing sources main report for financing sources;
and Table 20 and Figure 8 for
spending categories)
Target 7: Eliminating gender inequalities
7.1 Proportion of ever-married or partnered women aged 15-49 who 33.3%
experienced physical or sexual violence from a male intimate partner in (Source: DHS 2011)
the past 12 months
Target 8: Eliminating stigma and discrimination
8.1 Discriminatory attitudes towards people living with HIV Proportion with accepting attitudes
on all 4 standard indicators
Percentage of women and men aged 15-49 who report discriminatory
attitudes towards people living with HIV (on 1 or more of the 4 Women – 80.3%
standard indicators for accepting attitudes) Men – 68.9%
Total – 75.3%
(Source: AIS 2011)
Target 10: Strengthening HIV integration
10.1 Current school attendance among orphans and non-orphans aged
10–14
10.1a Percent of children 10-14 years with both parents not alive that are 83.5%
attending school
10.1b Percent of children 10-14 years with both parents alive, living with 95.6%
at least one parent, who are currently attending school
Ratio of 10.1a to 10.1b 0.87
(Source: DHS 2011)
10.2 Proportion of the poorest households who received external 12%
economic support in the last 3 months. (Source: District-based surveys in 66
districts)
2013 Uganda HIV and AIDS Country Progress report Page xiv1.0 Introduction and Overview of the AIDS Epidemic in Uganda
Uganda is party to the 2011 United Nations Political Declaration on HIV and AIDS, which commits
all countries involved to “provide to the General Assembly an annual report on progress achieved in
realizing the commitments made in the Declaration”. To meet this commitment, Uganda developed
this Global AIDS Response Progress Report (GARPR) for 2014; which focuses on progress in the
national HIV response as realized during 2013. The process to develop this report was based on
the UN Guidelines for the 2014 GARPR process. The guidelines provide for a three-part process for
developing the report: a) consolidation of progress and results from 2013 activities as captured in
the ‘one M&E system’ for the HIV response; b) completion of a two-part National Commitments and
Policies Instrument (NCPI); Part A for government sectors and Part B for civil society and AIDS
Development Partners (ADPs); and c) a consensus meeting to review and agree on the drafted
report from the two processes.
The report writing process was coordinated by the National HIV/AIDS Monitoring and Evaluation
Technical Working Group (TWG) at Uganda AIDS Commission (UAC). The process was highly
participatory and included separate consultative meetings with civil society, ADPs and government
sectors. The respective parts of the NCPI were circulated on e-mail to 9 civil society stakeholder
institutions; the ADP group, and 10 government sectors. Necessary follow up was done by e-mail,
telephone, and physical visits; to ensure completion and timely return. Consolidation of results
from the 2013 HIV response was based on the following key documents and databases:
a) The reports presented by different stakeholder constituencies at the 2013 Joint Annual Review
(JAR) for the national HIV response; and the UAC Annual Report for 2013
b) Management Information Systems (MIS) in the health, social development and education
sectors
c) The Annual Health Sector Review Report for 2013, and the 2013 Mid-Term Review Report for
the Health Sector Strategic Investment Plan (HSSIP)
d) The 2013 Investment Case for HIV, and the accompanying HIV and AIDS Situation Analysis for
2013
e) The Uganda CCM Request for Interim Funding to the Global Fund of September 2013
The first draft of the report was reviewed and approved by the TWG for M&E at UAC. An improved
version of the report was presented, discussed and adopted at a 1-day consensus meeting at which
38 persons from 22 stakeholder institutions and agencies participated.
1.1 HIV Prevalence
Uganda has experienced a generalized HIV epidemic for more than two decades. The country
achieved impressive success in the control of HIV during the 1990’s, bringing down HIV prevalence
among adults aged 15-49 years from a national average of 18.5% in 1992 to 6.4% in 2004/2005.
However, the 2011 AIDS Indicator Survey in Uganda reported HIV prevalence at a national average
of 7.3%. The HIV epidemic in Uganda continues to disproportionately affect young women; but
overall prevalence shifted to the older age groups between the 2004-05 and 2011 surveys (Figure 1
below)
2013 Uganda HIV and AIDS Country Progress report Page 1Figure 1: Change in HIV Prevalence by age and sex - 2004/05 and 2011
14 14.0
12.1 12.1
12 12.0 11.0 11.0 10.711.3
10.510.2
9.9 9.8
9.2 9.3 9.1
10 8.7 8.4 10.0
8.1 8.2
6.9 7.1
Percent
8
Percent
6.3 8.0
5.9
6 6.0
4.0
4 2.6 2.4 4.0 3.0 2.8
1.7
2 2.0
0.3
0 0.0
15-19 20-24 25-29 30-34 35-39 40-44 45-49 15-19 20-24 25-29 30-34 35-39 40-44 45-49
2004-05 Females 2004-05 Males 2011 Females 2011 Males
HIV prevalence in males and females varied by region; as demonstrated in the two surveys (2004-
05 and 2011 AIS) and illustrated in Table 2.
Table 2: Trends in HIV Prevalence 2004 and 2011 AIS
2004-05 Prevalence 2011 Prevalence Progress
Region
Female Male Total Female Male Total Female Male Total
Central 10.2 6.6 8.5 11.1 8.2 9.8 -0.9 -1.6 -1.3
Kampala 11.8 4.5 8.5 9.5 4.1 7.1 2.3 0.4 1.4
East Central 7.5 5.2 6.5 6.7 4.8 5.8 0.8 0.4 0.7
Eastern 6.2 4.4 5.3 4.4 3.8 4.1 1.8 0.6 1.2
Northeast 3.6 3.2 3.5 5.3 5.2 5.3 -1.7 -2.0 -1.8
North
9.0 7.1 8.2 10.1 6.3 8.3
Central -1.1 0.8 -0.1
West Nile 2.7 1.9 2.3 4.7 5.0 4.9 -2.0 -3.1 -2.6
Western 7.8 5.7 6.9 9.1 7.1 8.2 -1.3 -1.4 -1.3
Southwest 7.1 4.4 5.9 9.0 6.6 8.0 -1.9 -2.2 -2.1
Total (15-49
7.5 5.0 6.4 8.3 6.1 7.3
yrs.) -0.8 -1.1 -0.9
Key:
Decreased incidence by 1.0% or more
Decreased incidence by less than 1.0%
Increased incidence by less than 1.0%
Increased incidence by 1.0% or more
The epidemic was consistently higher among women compared to men across all regions except in
West Nile. In the capital city of Kampala, HIV prevalence among women was more than twice that
for men in both the 2004/2005 and 2011 surveys. Although the ‘prevalence gap’ between women
and men has narrowed between the two surveys; it remains above 30 percent nationally and in five
of the nine regions. This difference has been consistently smallest in the northeast region.
Between the 2004/2005 and 2011 surveys, there was notable decline in HIV prevalence among
women in Kampala, Eastern and Central Eastern regions. A smaller decline was noted among men
in the same regions, and also in the north central region. These improvements may be a reflection
2013 Uganda HIV and AIDS Country Progress report Page 2of penetration of effective HIV prevention interventions across communities in the respective
regions.
Other notable differentials in HIV prevalence reflected in the 2004/2005 and 2011 AIS include:
Residence: prevalence in 2011 was much higher among women resident in urban areas
compared to those in rural areas (10.7 percent and 7.7 percent respectively); but similar for
men resident in both settings (6.1 percent). The prevalence rate among urban women declined
by 2.1 percentage points, from 12.8 percent in 2004-05 to 10.7 percent in 2011. In contrast, the
rate among rural women increased by 1.2 percentage points over the same period; from 6.5
percent in 2004-05 to 7.7 percent in 2011. Over the same period, the prevalence among men
evened out from 6.7 percent in urban residents and 4.7 percent in rural residents in 2004-05, to
6.1 percent in both settings.
Education: Among both men and women, prevalence in the 2011 survey was lowest among
those who have had at least secondary education (6.4 percent in women; 4.9 percent in men).
However, prevalence has increased in all education status categories for both men and women,
except among women with at least secondary education (reduced from 7.6 percent to 6.4
percent); and in women that completed primary education (slight decline from 9.8 percent to
9.7 percent).
Wealth: HIV prevalence was highest among women in the highest wealth quintile in both
surveys; at 11.0 percent in the 2004/2005 survey and 9.9 percent in the 2011 survey. There is
a clear trend of higher HIV prevalence with greater wealth status among women; more
pronounced in the 2011 survey compared to the 2004/2005 survey. A similar but less
pronounced trend was observed among men, with respect to the second, middle and fourth
quintiles.
Marital status: In both the 2004/2005 and the 2011 surveys, HIV prevalence was highest
among women and men that are widowed, closely followed by those who are divorced or
separated. Further details on prevalence by marital status are presented in Table 3 below.
Table 3: Trends in HIV Prevalence by Marital Status – 2004 and 2011 AIS
Marital status Prevalence 2004/2005 Prevalence 2011
Female Male Total Female Male Total
Never married 2.7 0.8 1.6 3.9 2.0 2.8
Married/Living together 5.9 6.8 6.3 7.2 7.6 7.4
Divorced/separated 16.0 10.8 13.9 17.8 14.9 16.9
Widowed 31.2 32.2 31.4 32.4 31.4 32.3
Total (15-49 yrs.) 7.5 5 6.4 8.3 6.1 7.3
Discordant couples: the proportion among men and women living together and in sexual union
that had one party HIV positive and the other negative increased from 4.5 percent in the
2004/2005 survey to 6.2 percent in the 2011 survey. This increase was larger with respect to
HIV positive women (from 1.8 percent in 2004/2005 to 3.0 percent in 2011); compared to the
HIV positive men (from 2.8 percent in 2004/2005 to 3.2 percent in 2011). The HIV negative
parties in these couples are at high risk of getting infected, especially because of limited mutual
knowledge of each other’s HIV status, and inadequate specific action to reduce the risk.
2013 Uganda HIV and AIDS Country Progress report Page 31.1.1 HIV prevalence among key populations
In line with global UNAIDS guidance, the Uganda National HIV/AIDS Strategic Plan (NSP) and
National HIV Prevention Strategy (NPS) 2011/12 – 2014/15 define several population groups that
are important in the national AIDS response because of a combination of high HIV prevalence and
extensive sexual networks. These populations include: sex workers and their sexual partners,
fishing communities, uniformed services, mobile populations such migrant workers, men who have
sex with men, and persons with disability. It is recognized that specific individuals may belong to
more than one among such population groups, and thus be at heightened risk of acquiring and/or
transmitting HIV. The prevalence of HIV in these key populations as estimated in recent years is
presented in Table 4 below.
Table 4: HIV Prevalence in Key Populations – Sub-national studies
Population Group HIV Prevalence Study year and Geographical
coverage
Female sex workers 33% CRANE 1 2008/2009; Greater Kampala
region
Male partners of female sex 17.5% CRANE 1 2008/2009; Greater Kampala
workers region
Men that have sex with men 13.2% CRANE 1 2008/2009; Greater Kampala
region
Fishing communities 37.1% MOH 2012; Kalangala District (6
Males 32.4% sampled landing sites)
Females 42.3%
Plantation workers 6.8% MOH 2010; 4 sites in Bugiri, Jinja,
Males 13.4% Kalangala and Mubende Districts (Rice,
Females 4.5% Sugar, Palm Oil, Coffee estates)
A study in Kampala in 2012 contracted out by the MARPs Network found HIV prevalence at 35.7
percent among sex workers (n=503); 16.7 percent among injecting drug users (n=54); 9.3 percent
in fisher folk (n=321); 9.1 percent in MSM (n=398), 6.6 percent in truckers (n=213), and 1.9 percent
in uniformed forces (n=415).
A number of studies to map and estimate the size of key populations in the greater Kampala area
were conducted in 2012 and 2013. However, these have not yet established agreed projection of
the size of specific population groups such as sex workers, MSM, people that inject drugs, etc.
1.1.2 HIV burden
The total burden of HIV in Uganda, as represented by the number of persons in the country that are
living with HIV, has continued to increase. This is a result of continuing spread of HIV, and
increased longevity among persons living with HIV. Between 2007 and 2013, the estimated number
of people living with HIV increased from 1.2 million to 1.5 million. In 2012, the PLHIV was
constituted by 93% adults who are +15 years, women being 56% of these adults. MOH projections
based on Spectrum indicate a total of 1,618,233 people living with HIV in 2013; including 1,441,285
2013 Uganda HIV and AIDS Country Progress report Page 4adults, and 176,948 children below 15 years. The same source indicates a decline in AIDS-related deaths between 2011 and 2013; from 72,928 in 2011, 70,262 in 2012, and 61,298 in 2013. 1.2 HIV Incidence Although Uganda continues to experience a high rate of new HIV infections; the trend over the last three years shows a decline, from 162,294 in 2011 and 154,589 in 2012, to 140,908 in 2013. Table 5 below shows the incidence trend among adults and children between 2010 and 2013 Table 5: Trends in HIV Incidence 2010–2013 using mathematical modelling Population group 2010 2011 2012 2013 Adults ≥15 years 129,133 134,634 139,178 131,279 Children < 15 years 27,139 27,660 15,411 9,629 Total 156,272 162,294 154,589 140,908 Source: 2013 MOH Spectrum estimates Close to half (43 percent) of new infections projected in the 2008 Modes of Transmission (MOT) model were among persons in mutually monogamous heterosexual relationships; while another 46 percent were among persons in multiple sexual unions. Another 11 percent of the new infections were projected to be among sex worker clients, partners of sex workers, and sex workers themselves. The MOT report is appended to this report for further details. 1.2.1 Key Drivers of HIV Incidence The main drivers of HIV incidence in Uganda as documented by MOT and other studies are: Ones level of knowledge and understanding of HIV, and especially its relationship to perceived personal risk of HIV infection; and its influence on negative and stigmatizing attitudes towards persons living with HIV (PLHIV) Knowledge of one’s HIV sero-status, as established through HIV Counseling and Testing (HCT); and associated willingness for mutual disclosure of that status between sexual partners Risky sexual behavior – including adolescent sex, multiple and concurrent sexual relationships, transactional and cross-generational sex, and unprotected sex Level of male circumcision Alcohol drinking – especially to levels of getting drunk; and closely associated with sexual activity These factors underpin the national efforts to prevent new infections, and are discussed further in Section 2.0 of this report alongside the specific HIV prevention strategies. Other contextual factors that have a bearing on HIV transmission and prevention include: a) High fertility rate; low utilization of family planning; b) Low utilization of ANC and delivery services; and c) Coverage and utilization of media and communication channels such as radio and cell phones. 2013 Uganda HIV and AIDS Country Progress report Page 5
2.0 National response to the AIDS epidemic in 2013

2.1 Overview

The Uganda AIDS response has evolved over the last three decades through a 3-phase cycle:
a) Aggressive response to an evident threat, mainly through mobilization for a combined and
   supported action (in 1984 to 1989);
b) Concerted and coordinated action that yielded good results (especially in the early 1990s);
c) Change in the context and in the response; which compromised the good results (beginning in
   the 1990s, through 2000 to 2009).

The years between 2010 and 2013 were characterized by a revitalized response to a new threat – a
clear reversal in the long experienced decline in HIV prevalence and incidence. At policy level, the
National AIDS Policy 2010; the revised NSP 2011-2015, the NPS 2011-2015, and the HSSIP 2011-
2015 were important milestones and a basis for other policies, strategies and guidelines to guide
and strengthen specific elements in the AIDS response. Coordination of the national response was
bolstered through a review and reconstitution of the UAC Board and Secretariat; and of the Uganda
AIDS Partnership Mechanism. The 2011 UN General Assembly, and its resolution 65/277: Political
Declaration on HIV and AIDS: Intensifying Our Efforts to Eliminate HIV and AIDS, were a true
reflection and timely support to these on-going efforts in Uganda.

Implementation of the current Uganda NSP is based on two-year priority action plans; developed
and implemented in a participatory and multi-sectoral approach. The objectives and targets in the
2011/2012 – 2012/2013 National Priority Action Plan (NPAP) (as Annexed to this report) formed
the key basis for all HIV response activities in 2013. The following sections (2.2 to 2.5) discuss the
design, focus and results from these activities, under the four thematic areas of focus in the NSP and
NPAP.

2013 Uganda HIV and AIDS Country Progress report                                              Page 6
2.2 Prevention
KEY 2013 ACHIEVEMENTS ON HIV PREVENTION
Target 1: Reduce sexual transmission of HIV by 50% by 2015:
Over all there has been a reduction in new HIV infections; with Spectrum
projections at 162,294 in 2011; 154,589 in 2012 and 140,908 in 2013. Coverage
with key prevention services between October 2012 and September 2013 included:
8,208,188 individuals received HCT; 91.5 percent of them adults 15 years and
above. Two-thirds (65.4 percent) of the adults 15-49 years old that received
HCT were women;
801,678 males were reached with SMC, contributing to a cumulative total of
1,411,798;
187 million male and 5.8 million female condoms procured into the country;
525,495 adults on ART and thus contributing to ‘treatment for prevention’.
Target 3: Eliminate new HIV infections among children by 2015 and substantially
reduce AIDS-related maternal deaths
A remarkable reduction in new infections among children was achieved; from
27,660 in 2011; 15,411 in 2012, and 9,629 in 2013. The elimination of Mother-to-
Child Transmission (eMTCT) Option B+ approach was scaled up country-wide. It
reached 1,726,177 mothers of known and documented HIV sero-status; 123,754 of
them (7.2 percent) HIV positive. While 71.7 percent of the positive mothers
received ARVs for eMTCT; only 36.7 percent of the exposed infants received ARVs
for eMTCT.
The Uganda 2013 NPAP targets are fully aligned to the global prevention targets 1 and 3. Persons
that inject drugs do not contribute significantly to new HIV infections; and are therefore not
explicitly targeted in the UGANDA HIV response. Focus for HIV prevention in 2013 was on service
delivery scale up and concerted communication for demand creation; within the broad framework
of combination prevention, with a focus on:
Scaled up HCT – as a key entry point and first service in eMTCT, SMC, and promotion of safer
sex (especially condom use)
Accelerated roll-out of Option B+ for eMTCT to attain service coverage in all 112 districts in
the country
Specific targeted interventions in key populations such as fishing communities; migrant
workers in the transport industry, roads and mining sectors, and in plantation agriculture; sex
workers and their clients
Revitalized delivery of SMC services through public and private health facilities
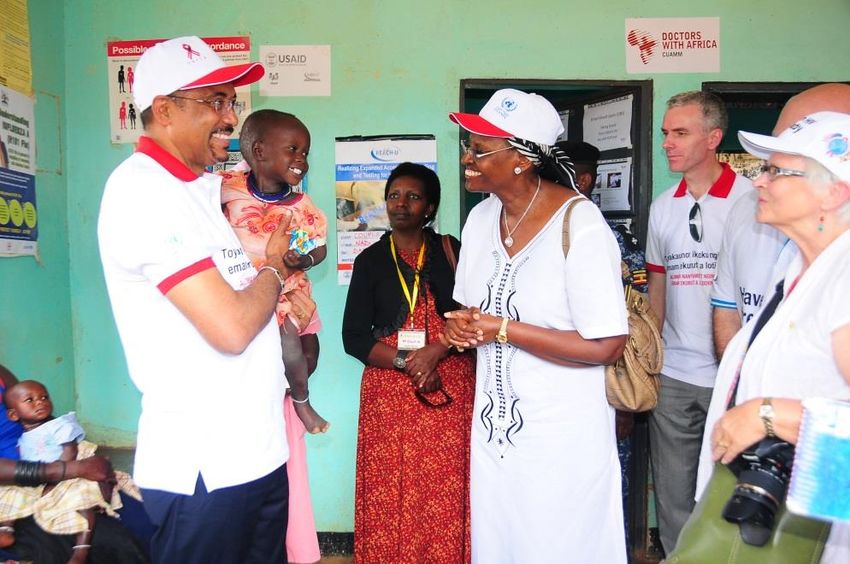
High level advocacy through and targeting political and cultural leaders were vital and especially
effective in the 2013 HIV prevention effort. Highlights in this regard include: a) the First Lady
playing the lead role as Champion in eMTCT promotion across the country – a process personally
2013 Uganda HIV and AIDS Country Progress report Page 7You can also read