Northern Territory PHN Primary Health Care Workforce Needs Assessment - NOVEMBER 2019 YEAR 2: ALLIED PRIMARY HEALTH WORKFORCE
←
→
Page content transcription
If your browser does not render page correctly, please read the page content below
Northern Territory PHN
Primary Health Care Workforce
Needs Assessment
NOVEMBER 2019
YEAR 2: ALLIED PRIMARY HEALTH WORKFORCE

                                          1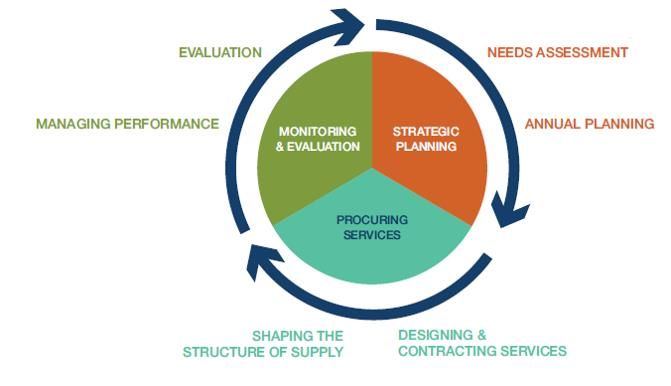
2
CONTENTS
 1. EXECUTIVE SUMMARY .................................................................................................................... 6
 2. INTRODUCTION ............................................................................................................................... 8
    Background ..................................................................................................................................... 8
    Scope 9
    Needs Assessment Process ............................................................................................................. 9
    2.1      Geographic Priorities .......................................................................................................... 10
    2.2      Engagement and Consultation ............................................................................................ 11
    2.3      Data ..................................................................................................................................... 11
 3. WORKFORCE SUPPLY AND DEMAND BY ALLIED HEALTH DISCIPLINE ........................................... 14
    Summary ....................................................................................................................................... 14
    Oral Health Practitioners............................................................................................................... 15
    Occupational Therapists................................................................................................................ 15
    Pharmacists ................................................................................................................................... 16
    Physiotherapists ............................................................................................................................ 18
    Podiatrists...................................................................................................................................... 18
    Psychologists ................................................................................................................................. 19
    Dietitians ....................................................................................................................................... 20
    Optometry ..................................................................................................................................... 20
    Audiologists ................................................................................................................................... 22
    Speech Pathologists ...................................................................................................................... 23
 4. RURAL AND REMOTE CHALLENGES ............................................................................................... 29
 5. ATTRACTION AND RECRUITMENT ................................................................................................. 30
    Attraction ...................................................................................................................................... 30
    Recruitment................................................................................................................................... 31
    Rural Background and Experience ................................................................................................ 31
 6. RETENTION .................................................................................................................................... 33
    6.1      Local and Aboriginal and Torres Strait Islander Support Staff ............................................ 33
    6.2      Professional Resilience........................................................................................................ 34
    6.3      Job Setting ........................................................................................................................... 34
    6.4      Community Engagement .................................................................................................... 35
    6.5      Leadership and Management ............................................................................................. 35
    6.6      Job Security ......................................................................................................................... 36

                                                                                                                                                        3
6.7 Experience........................................................................................................................... 36
6.8 Retention Framework ......................................................................................................... 36
6.9 Incentives and Supports...................................................................................................... 37
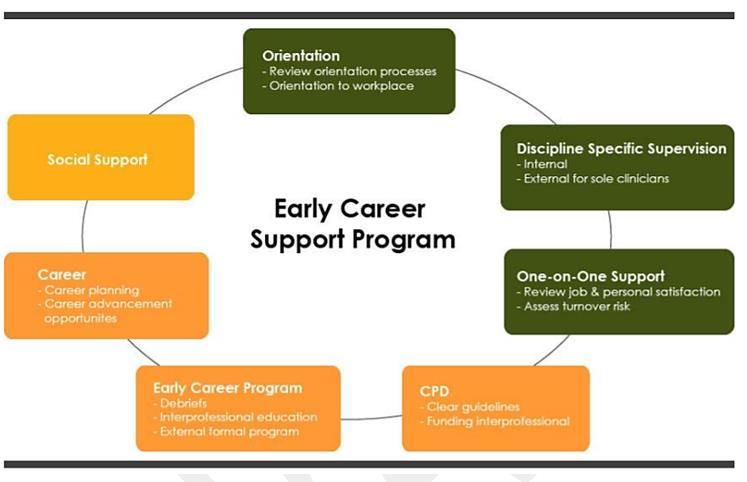
6.10 Early Years Mentoring Supervision and Support ................................................................ 37
6.11 System Capability ................................................................................................................ 39
7. PROFESSIONAL DEVELOPMENT .................................................................................................... 39
7.1 Maximising service responsiveness .................................................................................... 40
7.2 Rural and Remote Skills and Specialisation ........................................................................ 40
7.3 Recognition ......................................................................................................................... 41
8. WORKFORCE MODELS ................................................................................................................... 41
8.1 Cross Sectoral Collaboration ............................................................................................... 41
8.2 Outreach ............................................................................................................................. 42
8.3 Telehealth ........................................................................................................................... 43
8.4 Skill Sharing ......................................................................................................................... 44
8.5 Rural Generalism................................................................................................................. 44
8.6 Recruitment of overseas trained professionals .................................................................. 44
9. DEMAND........................................................................................................................................ 44
9.1 Disease Burden ................................................................................................................... 44
9.2 Service Delivery Model ....................................................................................................... 44
Private Health Insurance ..................................................................................................... 45
Medicare ............................................................................................................................. 45
Government Initiatives ....................................................................................................... 46
9.3 Scope of Practice................................................................................................................. 46
9.4 National Disability Insurance Scheme (NDIS) ..................................................................... 47
10. ABORIGINAL AND TORRES STRAIT ISLANDER ALLIED HEALTH PROFESSIONALS ..................... 48
11. EMERGING ROLES .................................................................................................................... 50
11.1 Allied Health Rural Generalists ........................................................................................... 50
11.2 Allied Health Assistants....................................................................................................... 52
11.3 Audiometrists...................................................................................................................... 53
12. TERTIARY PATHWAYS............................................................................................................... 54
1.1 Tertiary Course Content...................................................................................................... 55
12.1 Student Placement.............................................................................................................. 56
13. WORKFORCE SOLUTIONS AND PROGRAMS ............................................................................ 57
413.1 Peer support and development .......................................................................................... 57
13.2 Recruitment and relocation support .................................................................................. 57
13.3 Innovative workforce models & cross sectoral collaboration ............................................ 57
13.4 School-based Initiatives ...................................................................................................... 57
13.5 Rural Pharmacy Workforce Programs................................................................................. 58
13.6 Indigenous Allied Health Career Promotion and Support Programs .................................. 59
13.7 Workforce Incentive Program............................................................................................. 60
13.8 NDIS and Aged Care Initiatives ........................................................................................... 60
13.9 Regional University Centres ................................................................................................ 60
13.10 Undergraduate placement programs ................................................................................. 61
13.11 Scholarships and Bursaries ................................................................................................. 61
13.12 NT PHN student clinics ........................................................................................................ 61
14. CONSULTATION........................................................................................................................ 61
14.1 Individual interviews and Submissions ............................................................................... 61
14.2 Stakeholder Group Members ............................................................................................. 62
14.3 Broad Consultation ............................................................................................................. 62
14.4 Solutions Workshops .......................................................................................................... 62
15. PRIORITIES AND OPTIONS ........................................................................................................ 64
16. REFERENCES ............................................................................................................................. 66
51. EXECUTIVE SUMMARY
The Northern Territory PHN Health Workforce Needs Assessment is a living document that will
continually improve and develop with input from stakeholders. It informs activities undertaken by
Northern Territory Primary Health Network incorporating Rural Workforce Agency Northern
Territory (Northern Territory PHN) under the Australian Government funded Rural Health Workforce
Support Activity for the Northern Territory (NT).
The Health Workforce Needs Assessment (HWNA) commenced in 2017–18 with a focus on general
practitioners, remote area nurses and Aboriginal and Torres Strait Islander health practitioners. It
formed the basis for broad consultation with the primary health care sector and was expanded in
2018–19 to include allied health professionals. The HWNA 2018–19 was developed from a review of
available literature, data and interviews with key stakeholders. Allied health is rapidly evolving and
includes many disciplines that can work in multidisciplinary teams or operate as individual providers.
It includes those disciplines registered with national registration and accreditation schemes as well
as those that are self-regulated. There are potentially some 22 professions which can be considered
as allied health.[1] Given such breadth of subject matter, this HWNA will be further developed in
2019–20 to continue building a comprehensive understanding of the of the primary care sector in
the NT by June 2020.
While the NT currently has less allied health professionals per capita than other states and
territories, over time there has still been an increase in the figures across professions, except for
psychologists. Historically, trends in the number of allied health professionals are sensitive to
government policy and funding. Allied health professionals are concentrated in Darwin and Alice
Springs with limited numbers in other regional centres where allied health care is predominantly
delivered through outreach services. Allied health professionals in the NT tend to be younger and
less experienced and very few are unemployed.
Specific challenges associated with rural and remote practice are evident across the entire NT, with
contributors including small discipline-specific professional workforces, personal and professional
isolation and poor service viability resulting from diverse and fragmented funding and small
economies of scale. Recruitment difficulties relate particularly to the ability to attract experienced
allied health professionals, and without these experienced professionals, the inability to support
early years careers allied health professionals. Addressing recruitment and retention challenges
involves addressing capacity across the entire pipeline and requires creativity, collaboration,
integration of resources, careful selection of candidates, in addition to understanding and promoting
the value proposition of remote work and focusing on ‘growing our own.’
Increasingly stakeholders are looking to focus less on recruitment and more on retention. This
includes the need to address the quality of leadership and management, job security, professional
experience, career development opportunities, access to professional networks, professional
resilience, community engagement and public recognition, incentives and support, mentoring and
supervision capacity. While several workforce initiatives currently exist, it is important that these are
integrated and utilised to maximise outcomes. There remain significant gaps in the rural pipeline and
recruitment and retention capacity of the sector.
6Innovative workforce models are critical to workforce sustainability, including approaches that
utilise the right mix of cross sectoral collaboration, telehealth, outreach, skills sharing and rural
generalism, as well as the recruitment and support of overseas trained allied health professionals.
The current number of Aboriginal and Torres Strait Islander allied health practitioners does not
reflect the NT population. Increasing these roles will be critical to health and workforce outcomes.
New and emerging roles will enable allied health professionals to work at the top of their scope of
practice and assist in addressing workforce maldistribution, shortages and poor economies of scale
in remote communities. These roles include allied health rural generalists and allied health
assistants.
Tertiary pathways to allied health careers in the NT are limited, thus affecting the rural pipeline.
Challenges exist to increase our ability to grow our own, to maintain connection with NT students
studying interstate to maximise NT employment outcomes and to provide positive Territory
experiences for interstate students and allied health professionals.
Demand for allied health professionals is set to increase due to the burden of disease, increasing
access to Medicare rebates for allied health professionals, more government initiatives driven by
allied health roles, expanded role of allied health in primary care, expanded scopes of practice, the
implementation of the National Disability Insurance Scheme (NDIS) and recent changes to aged care.
72. INTRODUCTION
Background
The HWNA is an activity under the Rural Health Workforce Support Activity funded by the Australian
Government Department of Health and managed by Northern Territory PHN.
The Rural Health Workforce Strategy Activity spans 1 July 2017 to 30 June 2020. NT funding is
$13,222,019 for the three years, with approximately $3.8 million allocated for each financial year to
be spent across three broad activity areas:
• health workforce access;
• improving workforce quality; and
• building a sustainable workforce.
The overarching objective of the Activity is to contribute to addressing health workforce
maldistribution, quality and shortages in regional, rural and remote Australia.
In order to develop the evidence base for the distribution of funding, a needs assessment is
undertaken to identify the priority populations, geography, professions and systems to be supported
by this funding. This ongoing activity takes place in consultation with the Health Workforce
Stakeholder Group. The group is made up of industry representatives and experts that guide the
development of the HWNA and subsequent planning and implementation of activities to address
identified needs.
In 2017, it was agreed at a national level that the first year of the program would focus on general
practitioners and the remote primary health care workforce including Aboriginal and Torres Strait
Islander health practitioners and remote area nurses. The HWNA 2017–18 was completed in line
with that scope in February 2018, with subsequent prioritisation and Activity Work Plan
development. The HWNA 2017–18 contains significant background material on the demographic,
health and policy environment within the NT, which remains valid throughout the three-year cycle of
the Activity. This material is not reproduced here but includes the identification of national and local
health priorities, sociodemographic challenges, a summary of service provision models within the NT
and a description of the policy environment within which the health workforce is recruited,
employed and trained.
The agreed scope for 2018–19 is allied health professionals. Focus is placed on identification of the
challenges and opportunities for sustaining an appropriate primary health workforce; including
demand, attraction and recruitment, retention, professional development, workforce models,
emerging roles, tertiary pathways and current workforce solutions and programs addressing these
challenges.
A first draft of the HWNA 2018–19 was presented to the Health Workforce Stakeholder Group in
December 2018 for discussion and consideration of potential priorities and strategies. Based on this
document, a needs assessment report was submitted to the Australian Government Department of
Health in February 2019. This document was then circulated broadly for comment and contribution
from the primary health care sector and this final report reflects the feedback received.
8Scope
The scope of this needs assessment was defined by the Health Workforce Stakeholder Group in July
2018. The scope aimed to broadly cover allied health professionals. While data covers allied health
professionals working across the sector, the focus of qualitative information is on those working in
Aboriginal community controlled health services (ACCHSs), private practice, community health care
services and government primary health care services. While much of the information provided
applies broadly to all disciplines, the following disciplines have been specifically addressed:
• dental practitionersa
• occupational therapists
• optometrists
• pharmacists
• physiotherapists
• podiatrists
• psychologists
• dietitians
• audiologists
• speech pathologists.
While data has been provided on medical radiation practitioners,b this discipline was not included in
further investigations. Nutritionists, social workers and paramedics are also not covered due to a
lack of data available during the needs assessment process.
Needs Assessment Process
Northern Territory PHN is committed to an evidence-based approach to help ensure that people in
the NT enjoy their best health and wellbeing. Needs assessments are a systematic way of identifying
the health and wellbeing outcomes of a population in order to plan systems and services to meet
these needs. It is a collaborative approach underpinned by principles that guide governance,
engagement and data. This process informs the strategic planning phase of the commissioning
process, as outlined in Figure 1.
a
Includes dentists, dental hygienists, oral health therapists, dental therapists, dental prosthetists
b
There are three divisions of practice for medical radiation practitioners: nuclear medicine technology,
radiation therapy and diagnostic radiography.
9Figure 1: PHN Commissioning Framework
The recommendations developed from the needs assessment process for 2017–2018 and 2018–
2019 have informed the Workforce Activity Work Plans for 2019–20.
2.1 Geographic Priorities
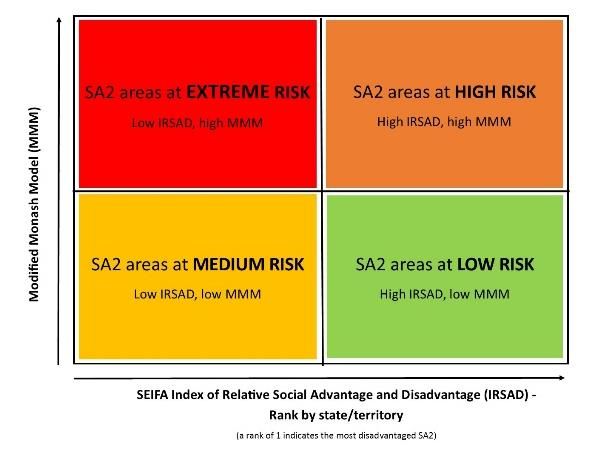
As reported in the HWNA 2017–18, apart from Darwin and surrounds, most localities within the NT
fall within the ‘Extreme Risk’ and ‘High Risk’ quadrants illustrated in Figure 2. These communities
also tend to have high proportions of Aboriginal and Torres Strait Islander residents and a high
proportion of both young children and people with complex chronic conditions.
10Figure 2: Community risk matrix
The communities with the most extreme risk (largely due to very low Index of Relative Social
Advantage and Disadvantage (IRSAD) scores), are in the vicinity of Katherine and in the north
western region of East Arnhem Land.
It is difficult to further identify ‘hot spots’ of need without examining data at a community level.
Rather, it is better to acknowledge all locations outside of the Darwin and Darwin rural areas as
having equally high priority for allied health, with specific communities’ subject to higher priority at
times of particular workforce shortages or other local considerations.
2.2 Engagement and Consultation
A series of semi-structured interviews were conducted with a cross section of health organisations,
service providers and university representatives with expertise in the area of allied health. The
resulting review of data gathered has contributed valuable information to building understanding of
the challenges and opportunities for workforce development in the NT’s allied health context,
although not all industries (e.g. aged care) nor all allied health professions were able to be
represented at this time. Broad consultation then occurred with open circulation of the draft
document to stakeholders across the NT. Stakeholders were provided with a range of vehicles
through which feedback could be provided. This feedback was collated and considered in the
compilation of this report.
2.3 Data
Data on the number, distribution and characteristics of many allied health professionals is available
through the Australian Government Department of Health’s National Health Workforce Dataset
(NHWDS), which is built from registration and survey data captured by the Australian Health
Practitioner Regulation Agency (AHPRA) each year. For those disciplines registered through AHPRA,
this was the key data source. For other disciplines, data was obtained directly through professional
11bodies and Australian labour market reports. Additionally, data from Northern Territory PHN has
been accessed to explore patterns of recruitment and vacancies.
Limitations
Comprehensive data on the availability and employment of allied health professionals on a regional
basis is not readily available. The statistics presented here are taken primarily from the NHWDS. The
data presented is drawn from reporting of each practitioner’s main place of practice in the previous
week. This is therefore a snapshot which is not able to account for more variable working
arrangements such as intermittent outreach practice or locum arrangements. For example, where
practitioner numbers are already low, the presence or absence of a visiting health professional in the
week prior to their annual registration could potentially have a large impact on the statistical picture
for a local area. As such, this data should be viewed as an indicator only of the availability of the
selected professions within a given region.
It should also be noted that these estimations do not consider the high rates of staff turnover and
temporary workforce models that are known to impact the stability of service in many locations
throughout the NT. While the workforce figures provide a useful baseline to discuss workforce
distribution, the actual situation in many communities is far more complex than can be represented
by standard data collections, especially as many allied health services are provided on an outreach
basis.
Particularly for professions with low numbers of practitioners such as podiatrists and optometrists,
percentage estimates can be quite volatile from year to year despite only small changes in actual
numbers.
Current data on outreach services, while improving, is not adequate for us to understand the true
distribution of the allied health workforce across the NT. Improvements in our ability to understand
the full extent of outreach services will provide a better picture of the distribution of this workforce
in the NT.
Demand Estimates
The complex nature of allied health service delivery in the NT provides a challenging environment for
estimating the number of health professionals required. A large portion of allied health services in
metropolitan areas are delivered through private health insurance in which case demand is driven by
insurance coverage. Meanwhile, in the remote context, a large amount of allied health services are
delivered through Australian Government funded programs, which means that demand is driven by
program funding and supply. Lastly, the unique nature of health needs in the NT, characterised by
remoteness and high Aboriginal and Torres Strait Islander populations, makes national comparisons
or benchmarks inappropriate. Stakeholders were concerned that the focus this needs assessment
takes on vacant positions and comparisons with national per capita supply rates masks true demand.
It was suggested that work needs to be undertaken to develop needs-based benchmarks like the
core ‘basket of primary health care services’ that consumers in rural and remote communities
should expect to access. [2] However, while place-based need should drive demand, this is currently
not well understood. The process will have to be quantified and funding models adapted before it
reflects workforce supply and demand that is truly responsive to population need. While the
12assessment of population need and the design of funding models is beyond the scope of this needs
assessment, it is acknowledged that the sector will need to be flexible to respond to emerging
evidence and potential resource redistribution.
Discipline Data
Available data from the NHWDS has been collated for:
• dental practitionersc
• occupational therapists
• optometrists
• pharmacists
• physiotherapists
• podiatrists
• psychologists.
Data for the following disciplines was obtained directly from professional associations:
• dietitians
• audiologists
• speech pathologists.
Key statistics are presented in Tables 1 (pg 24) and 2 (pg 25) and Figure 2 (pg 27) and are discussed
in subsequent sections.
c
Includes dentists, dental hygienists, oral health therapists, dental therapists, dental prosthetists
133. WORKFORCE SUPPLY AND DEMAND BY ALLIED HEALTH DISCIPLINE
Summary
As shown in Table 1, the NT experienced a growth in all allied health disciplines between 2013 and
2017, with the exception of a decline in medical radiation professionals (-3%) and, notably,
psychologists (-12%). Increases were less than 10% for most disciplines with the exception of
occupational therapists (+35%) and podiatrists (+39%).
As outlined in Table 2, the NT has proportionately less health professionals per capita than the
national average in all disciplines, particularly podiatry (rate ratio 0.53), psychology (rate ratio 0.65),
physiotherapy (rate ratio 0.66) and medical radiation practitioners (rate ratio 0.67). The rate ratio for
podiatrists has increased since 2013 (from 0.43 to 0.53), however most others have decreased –
most notably psychology dropping from a ratio of 0.81 to only 0.65.
Internet vacancy data for the NT is available in Figure 1 for some disciplines for the period 2007 to
2018. This shows the demand for dietitians, occupational therapists and speech pathologists peaking
around 2009–10, dipping around 2013 and increasing again after that to 2018. d This trend is likely a
reflection of the Northern Territory National Emergency Response Act which commenced in 2007
and was repealed in 2012. This highlights how government initiatives can significantly impact
workforce demand.
Figure 3 illustrates the number of vacancies in each profession and the average number of days
taken to fill positions for recruitments managed by Northern Territory PHN. The professions
represented in this data set are different to those available through the NHWDS. This data
represents all activity from 2013 through to the present. It should be noted that Northern Territory
PHN does not handle all vacancies throughout the NT, however, this snapshot still provides an
indication of the recruitment environment in the NT. All average vacancy times were more than 130
days. While the highest number of vacancies advertised were for physiotherapists, the average
vacancy time for these roles was one of the lowest. Psychologists were both recruited often and had
one of the highest average vacancy times.
Overall, there is an obvious concentration of practitioners in the Darwin region (including
Palmerston and the rural area). Shown in Figure 2, this is particularly high for occupational therapists
and psychologists and somewhat lower for podiatrists. However, these differences tend to be
balanced by the proportion of practitioners in Alice Springs, indicating a consistently low distribution
outside of these two areas.
There is a relatively young workforce in many professions, with over 50% of practitioners aged under
35 in many disciplines. Pharmacy and physiotherapy have the highest proportion of this younger age
cohort (62% and 60% respectively), while psychology is notable for having only 22% of the workforce
under 35 years of age, a figure which has declined from a high of 27% in 2016. Generally, the NT
d
The IVI is based on a count of online job advertisements newly lodged on SEEK, CareerOne and Australian
JobSearch during the month. As such, the IVI does not reflect the total number of job advertisements in the
labour market.
14workforce is younger than the workforce nationally, with the exception of optometrists and
podiatrists.
Approximately one-third of the workforce in most disciplines have five years or less of experience.
This is higher for physiotherapists (39%) and occupational therapists (37%), while the optometrist
and psychologist cohorts are more experienced. Some disciplines, notably oral health, have a
comparatively high proportion of practitioners whose original qualifications were obtained overseas
(15%). Around 90% of allied health professionals registered in the NT work in their registered
profession and very few are unemployed (0-2%).
Allied health practitioners work within a range of settings across the NT. There are a high proportion
in private practice, particularly optometrists (73%). Medical radiation practitioners tend to practice
predominantly in the tertiary environment (hospital and outpatients, 70%).
Oral Health Practitioners
The NHWDS shown in Table 1 records 141 oral health practitionerse as registered in the NT in 2017,
18 more than there was in 2013. In 2017 there were 57 oral health practitioners in the NT per
100,000 population compared with 78.4 per 100,000 nationally, outlined in Table 2. The NT has
fewer oral health practitioners per 100,000 than any other state or territory in Australia. 85% are
based in Darwin or Alice Springs. While more than half of all oral health practitioners in the NT work
in private practice, the NT has the highest proportion of oral health practitioners working in public
health. 38% are 35 years of age or under, compared with 34% nationally. 35% have been working in
oral health for fewer than five years. Fewer than 4% identify as Aboriginal or Torres Strait Islander
and 15% were trained overseas (Table 1).
The Australian Dental Association reports that nationally, the current dental workforce is in
oversupply.[3] A rapid increase in the number of dental practitioners over the past 20 years is
resulting in increasing underemployment and unemployment rates. There has been a sharp increase
in the number of dental practitioner students and seven new dental practitioner training
institutions. For the foreseeable future, Australia will be training more dental practitioners than it
needs.[3] While nationally there is excess capacity in the dental workforce, maldistribution continues
to affect accessibility in rural and remote areas.[4] This additional capacity refers to current supply in
relation to current demand, rather than unmet need. Significant unmet need stemming from limited
public dental services remains.
The Australian Dental Association policy recommends that governments place a moratorium on
dental training places, restrict migration of dentists to Australia, implement targeted incentives to
encourage dentists to practise in regional and remote areas, and develop models to provide
treatment in those areas unable to support a permanent workforce.[3]
Occupational Therapists
The NHWDS in Table 1 records 145 occupational therapists as being registered and working as a
clinician in the NT in 2017, a figure which has grown by 41 since 2013. In 2017, there were 58.6
e
Includes dentists, dental hygienists, dental prosthetists, dental therapists, oral health therapists
15occupational therapists in the NT per 100,000 population, compared with 61.3 per 100,000
nationally, shown in Table 2. 93% are based in Darwin or Alice Springs, and 17% work in private
practice. 55% are 35 years of age or under, compared with 53% nationally, and 37% have been
working as an occupational therapist for fewer than five years. Fewer than 4% identify as Aboriginal
or Torres Strait Islander and 5% were trained overseas (Table 1).
The Australian Government Department of Employment, Skills, Small and Family Business’ 2019
labour market rating identifies a shortage of occupational therapists in the NT, citing location of
employment as the key factor affecting recruitment and retention. The skills shortage report states
that 71 employers had unfilled vacancies. 56% of vacancies were filled during the report period and
each vacancy received two applicants on average.[5]
Pharmacists
The NHWDS records 157 pharmacists as registered and working as a clinician in the NT in 2017, a
growth of 15 from 2013. In 2017, there were 63.4 pharmacists in the NT per 100,000 population
compared with 88 per 100,000 nationally. 82% are based in Darwin or Alice Springs, and more than
half (57%) work in community settings. 62% are 35 years of age or under compared with 47%
nationally, and 34% have been working as a pharmacist for fewer than five years. Only Fewer than
4% identify as Aboriginal or Torres Strait Islander and 9% were trained overseas, an increase from
5% in 2016.
The Department of Employment, Skills, Small and Family Business’ 2019 labour market rating
identifies a shortage of pharmacists in the NT, with location of employment the key factor affecting
recruitment and retention. The skills shortage report shows 57% of vacancies were filled during the
report period, a decrease from 73% in 2017. Vacancies received, on average, three applicants and
less than one suitable applicant in metropolitan areas of the NT, while regional areas attracted less
than one applicant and less than one suitable applicant per vacancy. Employers conduct multiple
recruitment rounds and take up to three months to fill vacancies with locality and remuneration
being the largest influences on outcomes.[6]
According to the NT branch of the Pharmacy Guild, NT community pharmacy services experience
high turnover rates (an annual average of 50% turnover has been reported by the industry) as a
result of the general transience of the NT workforce and the relative youth of the profession in the
NT. In addition, wage and benefits disparities between the private and public sector see an ongoing
movement of pharmacists out of private practices and into the public sector.
This combined with the number of overseas born and/or trained pharmacists in the NT highlights the
burden on employers to recruit, retain, and provide orientation and induction programs. The need
for professional support and local, easily accessible continuing education opportunities is particularly
important in this environment.
Community pharmacies are located in Darwin, Palmerston, Alice Springs, Nhulunbuy, Katherine and
Tennant Creek. In addition, these community pharmacies provide access to medicines under Section
100 of the Remote Area Aboriginal Health Services (RAAHS) Program for residents of remote
communities. In the NT, the work of a community pharmacist is reflective of the broad range of skills
16required in rural practice. Community pharmacists provide pharmacy services in a broad range of
settings including the local community, aged care facilities, hospital outpatients, ACCHSs, NT
Government remote health sites, renal services, dialysis units, community health centres, opiate
replacement programs, chemotherapy programs, community clozapine dispensing services, and
tobacco, alcohol and other drugs services. They are also liaising with GP surgeries and hospital
doctors regarding prescriptions and patient medication safety issues and providing National
Diabetes Services Scheme (NDSS) access point services. Pharmacists routinely work as part of an
interdisciplinary care team that includes GPs, community health nurses, hospital prescribers, and
ACCHSs or health clinic staff, and utilise telehealth and digital solutions to overcome the geographic
dispersion of care providers. They work extended hours throughout the week, remaining open after
hours. Many community pharmacies are also available over the weekend to address community
health needs when access to other health providers is limited.
Pharmacy associations identified that while there was adequate supply of pharmacists,
maldistribution contributed to ongoing shortages in rural and remote areas. The NT branch of the
Pharmacy Guild of Australia acknowledged the importance of providing pathways for local people
into pharmacy careers and noted the significant impact that the cessation of Charles Darwin
University’s pharmacy course will have on future recruitment and retention.
The impact of government funding and initiatives on demand for pharmacists was noted along with
its unpredictability. Demand for pharmacists is expected to increase as a result of changing models
of care and work settings, increasing numbers of pharmacists working as part of primary health care
teams, an expanding scope of practice, ageing population and an increasing prevalence of chronic
disease.[7]
Recent examples of the expanded scope of practice include:
• Pharmacist vaccination: in 2013, the pharmacy board included vaccination in the scope of
practice for pharmacists. In 2017, the NT government released guidelines for immunisations
at pharmacy premises in the NT;
• Registered nurses, accredited practising dietitians, registered medical practitioners,
registered pharmacists, podiatrists, accredited exercise physiologists and registered
physiotherapists are currently eligible to become credentialed diabetes educators. In 2019,
with support from Northern Territory PHN, pharmacists in the NT are undertaking the
required training to become diabetes educators;
• Under the Fair Work Act 2009, pharmacists have authority to issue Absence from Work
Certificates as proof of legitimate absence from work.
The NT branch of the Pharmacy Guild of Australia have identified other areas of potential expanded
scope of practice such as provision of asthma education, cardiac education, smoking cessation and
support, wound care and transition care coordination including assisting patients to understand
their medication regimen post-discharge.
The increasing integration of pharmacists into the primary health care team is exemplified in the NT
through the recent implementation of the Integrating Models of Pharmacists Across Care Teams
17(IMPACT) Framework developed by Northern Territory PHN to guide the integration of pharmacists
into primary health care services and the inclusion of a pharmacist role in the Maningrida Remote
Primary Health Care Service Team. While the critical and vital role of community pharmacy in
medication education and management through remote primary health services is well recognised,
sustainable funding models for these services remain elusive. Pharmacists and remote health
services are advocating for recognition and formalisation of funding for sustainable remote
medication education and management services. If successful, this will have an impact on both
demand for workforce and desirable skills.
The NT branch of the Pharmacy Guild of Australia suggest that the provision of information on locally
specific topics such as rheumatic heart disease, skin disorders such as scabies, cultural awareness,
working remotely, tropical conditions, common skin conditions and wound healing in the tropics and
social determinants of health is important in ensuring the quality of pharmacy services and retention
outcomes for pharmacists who are new to the NT.
Physiotherapists
The NHWDS in Table 1 records 154 physiotherapists as registered and working as a clinician in the
NT in 2017, which is 13 more than in 2013. In 2017, there were 62.2 physiotherapists in the NT per
100,000 population compared with 94.8 per 100,000 nationally, as outlined in Table 2. 81% are
based in Darwin or Alice Springs, and 40% work in private practice. 60% are 35 years of age or under
compared with 50% nationally, and 39% have been working as a physiotherapist for fewer than five
years. Fewer than 4% identify as Aboriginal or Torres Strait Islander and 9% were trained overseas
(Table 1).
The Department of Employment, Skills, Small and Family Business’ 2019 labour market rating
identifies a shortage of physiotherapists in the NT. Employers reported difficulties in attracting
experienced applicants and were unlikely to employ graduates as they lack the capacity to provide
adequate supervision and support. With most applicants being from interstate, location was a key
factor impacting on recruitment outcomes. The skills shortage report shows 61% of vacancies were
filled during the report period. Vacancies received, on average, 0.7 suitable applicants and around
40% of employers reported no applicants or inadequately qualified applicants for their vacancies.
Increasing demand is expected to result from an ageing Australian population and NDIS
implementation in the NT, while the lack of local training programs will impact on supply.
Stakeholders also reported an adequate supply of graduate and early career physiotherapists,
however greater difficulty recruiting to senior and specialist roles and extreme difficulties recruiting
to rural and remote areas due to maldistribution. Clinical placement and supervision for graduates
was identified as a critical issue in ensuring a sustainable future workforce. Again, an ageing
population, increased prevalence of chronic disease and movement towards an extending scope of
practice were also identified as likely to increase demand for this discipline.[9]
Podiatrists
The NHWDS in Table 1 records 23 podiatrists as registered and working as a clinician in the NT in
2017, which is 7 more than in 2013. In 2017, there were 9.3 podiatrists in the NT per 100,000
population compared with 17.4 per 100,000 nationally, shown in Table 2. 83% are based in Darwin
18or Alice Springs, a decrease of 4% since 2016, and 57% work in private practice. 57% are 35 years of
age or under, an increase from 42% in 2016, compared with 47% nationally. 26% have been working
as a podiatrist for fewer than five years. Fewer than 4% identify as Aboriginal or Torres Strait
Islander and 0% (15% in 2016) were trained overseas (Table 1).
Maldistribution of workforce continues as a theme in relation to the podiatrist workforce. Obtaining
clinical placements recurred as a challenge, along with increasing demand due to an ageing
population and increasing chronic disease, and the need to provide access to services for Aboriginal
and Torres Strait Islander communities.[10]
Psychologists
The NHWDS in Table 1 records 152 psychologists as registered and working as a clinician in the NT in
2017, which is 21 less roles than was recorded in 2013. Table 2 shows that in 2017, there were 61.4
psychologists in the NT per 100,000 population, a decrease from 66.4 in 2016, compared with 94.8
per 100,000 nationally. 91% are based in Darwin or Alice Springs, and 38% work in private practice,
which is a decrease of 9% since 2016. 22% are 35 years of age or under, a 5% decrease since 2016,
compared with 21% nationally. 18% have been working as a podiatrist for fewer than five years,
which has increased by 8% since 2016. Fewer than 4% identify as Aboriginal or Torres Strait Islander
and 11% were trained overseas (Table 1).
The psychologist workforce, unlike other disciplines, stands out as older, decreasing, Darwin-centric
and more likely to work in non-clinical roles. No data is available in the NHWDS to indicate whether
psychologists hold a general registration or are clinical psychologists. Registrant data from the
Psychology Board of Australia for 1 July 2018 – 30 September 2018 indicates that of the 207
practicing registrants who indicated their principal place of practice as the NT,f 38 (18%) were
endorsed for clinical psychology with a further two endorsed for neuropsychology. This compares to
30% nationally.
The increased scope of practice of clinical psychologists, along with their research and supervisory
capabilities, make them a valuable resource in the provision of mental health services. It is clear that
the NT has an under-supply compared to other jurisdictions.
Demand for psychologists has increased as a result of access to Medicare benefits and psychologists
taking on generalist mental health roles including case management. A substantial investment by the
Australian Government into mental health and wellbeing programs in the NT has also considerably
influenced demand. Lower salaries, increased supervision requirements and fewer career
progression opportunities are moving psychologists towards private sector careers. Limited places
for master’s degree students and internship pathways to registration are affecting the career path
for psychologists. Increasing demand and ‘bottlenecks’ in the pathway are likely to affect workforce
sustainability. Maldistribution of workforce continues as a theme in this discipline.[11]
f
These figures differ from those in Table 1 due to both the different time period, and the reporting of principal
place of practice vs main location of practice in the previous week
19Dietitians
Dietitians Association of Australia (DAA) members in the NT include 58 Accredited Practicing
Dietitians (APD) and one student while there are 6142 nationally.[12] This equates to 25 dietitians in
the NT per 100,000 population compared with 26 per 100,000 nationally. 21 APDs across Australia
identify as being Aboriginal or Torres Strait Islander, with one of these APDs practicing in the NT.
The supply of qualified dietitians was identified as being adequate, if not oversupplied. However,
there is concern around a shortage of experienced dietitians to fill management and specialist roles.
Maldistribution was again identified, with difficulties reported in recruiting to regional and remote
locations. Demand is again likely to be impacted by an increasing prevalence of chronic disease.[13]
The DAA report that greater recognition of the contribution of nutrition to mental and physical
health, and the increasing incidence of chronic diseases including obesity, cardiovascular, diabetes
and renal disease, is contributing to greater investment in, and demand for, nutrition care across
acute, community and public health settings. This is particularly the case for Aboriginal and Torres
Strait Islander people. The ageing population, implementation of the NDIS and the role of dietitians
in the nutrition needs of these cohorts was also identified as a key potential contributor to
increasing demand. However, it was noted that both need and recognition of this in allocation of
program funding is required before impact on demand for health professionals is realised.
As in many other allied health professions, the breadth of professional practice of dietitians is
expanding. APDs may expand their scope of practice through additional training. Opportunities for
expansion of scope of practice include diabetes education, insertion of nasogastric tubes, care of
percutaneous endoscopic gastrostomy tubes and swallowing assessments.[14] Further changes to
scope of practice currently being considered may provide dietitians with scope to adjust insulin
(currently nurse-led) and carry out swallowing assessments (currently speech therapist-led).[13]
Legislative change may be required to enable these amendments, while there will be a need for
upskilling to enable clinicians to undertake this expanded scope of practice.[15]
In their submission to this needs assessment, key messages from the Dietitians Association of
Australia included:
• APDs in the NT work across different settings and practice areas;
• the number of dietitians identifying as Aboriginal or Torres Strait Islander is low;
• trends in increasing incidence of chronic disease are reason for greater investment in
nutrition care across acute, community and public health settings;
• recruitment and retention of dietitians to the NT requires greater investment; and
• current models of care restrict access to APDs.[14]
Stakeholders raised concerns about the lack of dietitians and diabetes educators given that diabetes
causes a significant burden of disease among Aboriginal and Torres Strait Islander people in the NT.
Optometry
The NHWDS in Table 1 records 33 optometrists as registered and working as a clinician in the NT in
2016, an increase of 3 since 2013. In 2017, there were 13.3 optometrists in the NT per 100,000
20population compared with 18.7 per 100,000 nationally, outlined in Table 2. 88% are based in Darwin
or Alice Springs, a 4% decrease since 2016. 73% work in private practice, a decrease of 11%, This is
accounted for by the growing proportion of optometrists working in Aboriginal health settings,
which has risen to 18%. 39% are 35 years of age or under compared with 36% nationally and 21%
have been working as an optometrist for fewer than five years, an increase from 10% in 2016. Fewer
than 4% identify as Aboriginal or Torres Strait Islander and 9% were trained overseas (Table 1).
Optometry Australia has argued that since 2016, based on studies undertaken on their behalf,
graduation numbers have increased the local workforce resulting in adequate supply of optometrists
within Australia[16]. A 2015 study undertaken by Monash University on behalf of Optometry
Australia indicated that supply would outweigh demand by 2016[17]. These projections take into
account key factors impacting supply such as the opening of two new optometry schools, expecting
to more than double the number of graduates, and on demand including:
• an increasing trend in the use of optometry services per capita;
• the potential that new treatments will minimise the need for spectacles; and
• new treatments that decrease the need to monitor conditions.
These factors were cumulatively expected to increase demand per capita by as much as 20% by
2036.
NT-specific modelling of the optometry workforce identified that that demand would continue to
outweigh supply in some scenarios where larger growth and less patient contact hours per fulltime
equivalent (FTE) were assumed. However, as New South Wales, Victoria, Western Australia, the
Australian Capital Territory and Queensland would all be oversupplied at this time, any undersupply
in the NT would be considered to be an issue of maldistribution rather than undersupply.[17]
The modelling acknowledged the assumption that the proportion of graduates in optometry to
reside and work in rural and remote locations was a ‘potential source of error’ based on difficulties
experienced by other health professions in encouraging graduates to practise in remote locations.
The modelling raised concerns that an oversupply of optometrists may come with its own concerns
regarding the availability of experienced professionals to place students and supervise graduates.
While it identified the seemingly obvious benefit of addressing undersupply in rural and remote
communities, it also noted that oversupply in other health professions historically did not
automatically address supply issues in rural and remote locations.[17]
Consultation with Optometry Australia identified that there may be slightly more optometrists in the
NT (35) than the data in Table 1 suggests. In addition, Optometry Australia noted that many
outreach optometry services are conducted in the NT and it is not uncommon for these services to
be provided by optometrists from outside of the NT, suggesting that the actual workforce is larger
than data indicates. Optometry Australia confirm that demand is ‘close to balanced nationally’
however note that ‘there is likely still an undersupply of optometrists in the NT.’ Optometry
Australia noted that poor access to continuing professional development (CPD) was a significant
challenge for NT optometrists.
21Audiologists Audiology Australia lists 21 accredited audiologists in the NT,[18] representing 9.2 per 100,000 population. Audiology Australia estimates another 10 audiologists provide visiting services, and in addition to this, it is likely that not all audiologists are accredited with this organisation. Many of these providers are involved with outreach services to remote communities. 2011 Census data identified 1489 audiologists in Australia, representing 6.9 per 100,000 population. Australian Hearing provides government funded services and lists practices in Casuarina, Palmerston, Coolalinga, Katherine, Tennant Creek and Alice Springs. Arafura/Alice Audiology list practices in Darwin and Alice Springs, while additional audiology services are provided by the Audiology Department at the Royal Darwin Hospital. Outreach audiology services are provided to Aboriginal children and young people (
graduation before an audiologist is considered competent to practice independently. The complexity
of clinical presentations in regional and remote areas was also identified, with the need for more
training and webinars to assist in the development of associated competencies. Audiology Australia
recognises that Aboriginal and Torres Strait Islander health is a significant component of audiology
services in Australia and is working to improve student awareness of both Aboriginal and Torres
Strait Islander health and cultural awareness, respect and responsiveness. They are also working
with Indigenous Allied Health Australia (IAHA) to promote the profession to Aboriginal and Torres
Strait Islander people.

Speech Pathologists
The Australian Bureau of Statistics (ABS) grouping of speech pathologists with audiologists and the
lack of AHPRA regulation makes reporting on the speech pathology workforce difficult. In 2014,
Speech Pathology Australia reported a membership of just over 6000, estimating that this
represented 70% of the workforce. This workforce has been steadily increasing with growth
between 2006 and 2011 reported as 37%.[24] In 2011, only 29 of 5295 speech pathologists in
Australia were located in the NT, representing just 18.4 per 100,000 residents compared to 23.7 per
100,000 residents nationally.

The NT Branch of Speech Pathology Australia listed 9 employers of speech pathologists in the Darwin
region in 2016. Approximately 0.7% of members are Aboriginal or Torres Strait Islander. Around 25
FTE are in government and non-government services, while around six FTE are estimated in private
practice. There are two employers identified in the top end remote region representing between
three and four FTE. The Katherine region has three employers with a total of around 3.5 FTE, while
seven employers in the Alice Springs and Central Australia region make up around 10.5 FTE. Private
practices are located in Darwin, Katherine and Alice Springs.[25]

These estimates suggest that in 2016 there were around 45 speech pathologists in the NT,
representing 18.4 per 100,000 population.[25] While the 2016 number of speech pathologists
nationally is unknown, this is well below the 2011 national average of 23.7.

The Department of Jobs and Small Business expect job openings for speech pathologists to increase
by 32.6% over the five years to May 2022.[20] A 2014 Senate report suggested the demand for
speech pathology services in Australia outweighs supply of these services.[24]

                                                                                                 23
You can also read