Service Industrialization, Employment and Wages in the US Information Economy
←
→
Page content transcription
If your browser does not render page correctly, please read the page content below
Foundations and Trends® in Technology,
                   Information and Operations Management
         Service Industrialization,
 Employment and Wages in the US
            Information Economy
Suggested Citation: Hiranya Nath, Uday Apte and Uday Karmarkar (2020), “Service
Industrialization, Employment and Wages in the US Information Economy”, Foundations
and Trends® in Technology, Information and Operations Management: Vol. 13, No. 4,
pp 250–343. DOI: 10.1561/0200000050.

                                                                     Hiranya Nath
                                                        Sam Houston State University
                                                                          Huntsville
                                                                          TX 77341
                                                                               USA
                                                                            Uday Apte
                                                              Naval Postgraduate School
                                                                              Monterey
                                                                              CA 93943
                                                                                   USA
                                                         Uday Karmarkar
                                       UCLA Anderson School of Management
                                                                Los Angeles
                                                                  CA 90095
                                                                      USA

This article may be used only for the purpose of research, teaching,
and/or private study. Commercial use or systematic downloading
(by robots or other automatic processes) is prohibited without ex-
plicit Publisher approval.
                                                                         Boston — Delft
Contents
1 Introduction 252
2 Literature Review 256
3 Service Industrialization 262
4 Major Trends in the US Economy 267
4.1 Broad Sectoral Changes . . . . . . . . . . . . . . . . . . . 268
4.2 Broad Changes in Employment and Wages . . . . . . . . . 269
5 Service Industrialization, Jobs and Wages 277
5.1 Automation . . . . . . . . . . . . . . . . . . . . . . . . . 278
5.2 Outsourcing and Off-Shoring . . . . . . . . . . . . . . . . 279
5.3 Operations Shifting and Self Service . . . . . . . . . . . . 281
5.4 Process Redesign and New Services . . . . . . . . . . . . . 285
5.5 New Market Mechanisms and Exchanges . . . . . . . . . . 285
5.6 Sector Disruption . . . . . . . . . . . . . . . . . . . . . . 287
5.7 The “Gig” and Freelance Economy . . . . . . . . . . . . . 290
5.8 Asset Sharing, Micro-Markets, and
Matching Platforms . . . . . . . . . . . . . . . . . . . . . 2916 Aggregate Changes in Employment and Wage Bill Shares 292
6.1 Employment and Wage-Bill Share Changes for
Sectors and Occupations . . . . . . . . . . . . . . . . . . 295
7 Observations and Conclusions 299
7.1 Service Industrialization . . . . . . . . . . . . . . . . . . . 300
7.2 Demography . . . . . . . . . . . . . . . . . . . . . . . . . 302
7.3 Other Factors . . . . . . . . . . . . . . . . . . . . . . . . 303
8 Implications for Management and Public Policy 305
9 Future Research 308
Appendices 310
A Measuring the Double Dichotomy of the US Economy:
Data, Methodology, and Major Findings 311
A.1 GNP Decomposition . . . . . . . . . . . . . . . . . . . . . 311
A.2 Employment and Wage Bill Decomposition . . . . . . . . . 326
B Job and Wage Bill Shares by Sectors and Occupations 329
References 338Service Industrialization,
Employment and Wages in the US
Information Economy
Hiranya Nath1 , Uday Apte2 and Uday Karmarkar3
1 Sam Houston State University, Huntsville, TX 77341, USA;
eco_hkn@shsu.edu
2 Naval Postgraduate School, Monterey, CA 93943, USA;
umapte@nps.edu
3 UCLA Anderson School of Management, Los Angeles, CA 90095,
USA; uday.karmarkar@anderson.ucla.edu
ABSTRACT
The US economy has undergone significant shifts towards
services and towards information intensive industries. The
latter trend has been driven by advances in information tech-
nology. These advances have concurrently led to substantial
changes in the production and delivery of services, especially
notable in information-intensive sectors. We examine these
changes from the perspective of “service industrialization”,
since they are similar in many ways to the historical indus-
trialization of goods production. We focus on the effect of
industrialization on employment and wages, and identify
certain important consequences of this direction. One major
consequence is the impact on the customer facing services
and the “front office” in addition to the effect on service pro-
cesses in the “back room”. An important aggregate result is a
decline in white collar jobs in both those categories. A larger
effect is at the sector level, with significant disruptions in
Hiranya Nath, Uday Apte and Uday Karmarkar (2020), “Service Industrialization,
Employment and Wages in the US Information Economy”, Foundations and Trends®
in Technology, Information and Operations Management: Vol. 13, No. 4, pp 250–343.
DOI: 10.1561/0200000050.251
some sectors leading to their substantial restructuring. Such
disruptions are likely to occur in other information intensive
sectors as well.
Keywords: information economy; service industrialization; US
economy; jobs; employment; job and employment trends; information
intensive services.1
Introduction
There appear to be wide-spread popular and professional concerns
about jobs, employment, and wages in the US. This is visible in articles
in the popular press, in political positions across the spectrum, as
well as in the academic and research literature. The concerns relate
to job availability and the growing inequality in incomes and wealth.
The reasons underlying the concerns include the loss of jobs to other
countries, the effects of globalization and trade (including the “China
effect”), differential productivity levels, and the threat of technology and
automation replacing humans in jobs. To these underlying factors we
could add the effects of demographics and changes in the working and
dependent populations, global competition, shortcomings in education,
technology-enabled restructuring of industry, and the impact of national
policies in areas such as immigration and trade.
Our emphasis in this paper is on “service industrialization”. This
term refers to the recent and ongoing changes in the economy, and in
industry sectors, markets, companies, processes and organizations, which
have been enabled or created by new information technologies related
to computers and telecommunications. These changes are especially
concentrated in information intensive service sectors, but are also very
252253
apparent in physical services such as retailing and transportation. They
are also directly and indirectly affecting many aspects of manufacturing.
Our perspective of “industrialization” is based on the traditional view
of that term, as applied to manufacturing and products, but expanded
to include the impact of modern information technologies, which affect
consumer behavior, markets, interactive communications, and social
structure.
The paper has three main research objectives
• Study the impact of service industrialization on employment and
wages in the US and understand the forces driving them,
• Using national income and labor data until 2017, update our earlier
study of the size, structure, and trends in the US Information
economy in a way of presenting a macroeconomic context for our
analysis of employment and wages, and
• Identify implications of the above for management and public
policy.
Our main conclusions regarding employment and wages are that
• Technology driven service industrialization has had and continues
to have a substantial impact on the structure of the US economy,
with the largest effect being a growth in the GNP, job and wage
shares of information intensive industries
• Service industrialization has had a negative impact on jobs through
automation, offshoring, outsourcing, large scale disruption, and
process changes in processing and delivery. These effects are ame-
liorated by a growth in physical services such as food services,
personal services and health care, so that there are enough jobs
and unemployment has been and is likely to remain low.
• A major current effect of service industrialization on jobs is the
recent decline of white collar jobs (such as Sales and related, and
Office and Administrative Support) in terms of employment share
and wage share.254 Introduction
• There have been increases in employment in the occupational
categories of Management, Business and Financial Operations,
Computer and Mathematical occupations. The wage shares in
these occupations have also increased, since these are all high-wage
job categories.
• The preceding two effects are increasing income inequality among
white collar workers.
• Industry sectors showing declines in employment and wage share
due to service industrialization include Retail Trade, Wholesale
Trade, and Finance and Insurance.
• While the Arts, Entertainment and Recreation sector is holding up
in share, specific subsectors such as music distribution and news
publishing have seen severe disruptions, which do not show up in
the aggregate sector figures. We believe that these disruptions will
soon spread to other content delivery subsectors such as publishing
and broadcast entertainment.
• Managers in many, if not all sectors need to pursue service indus-
trialization strategies, or risk being overtaken by new entrants, or
left behind as service sectors restructure
• There are significant policy implications from these shifts, arising
from the impacts on jobs, and employment shifts, which directly
affect wage distribution and inequality of income.
In the next section, we present a brief review of relevant literature. In
the third section we discuss service industrialization and the “services
revolution”. We then present an update of the major trends in the US
economy up to 2017, in the fourth section. As in our past work (Apte
et al., 2008 and 2012) we examine the structure of the US economy in
terms of the breakdown of GNP and GNP shares along two dimensions:
products vs. services, and material intensive vs. information intensive
activities. This aggregate view clearly shows the two major trends along
those dimensions: a move from products to services and from material to
information. We also look at the trends in jobs and employment share,255 and in shares of the total wage bill. In the fifth section, we identify and discuss the forces including service industrialization that are driving the changes in the economy with an emphasis on the employment and job effects. The sixth section presents a more detailed breakdown of jobs based on SOC (Standard Occupational Classification) codes, and wages by sectors based on NAICS (North American Industrial Classification System) codes. We present the distribution of job shares and wage bill shares along these two dimensions. This gives a clear picture of the sectors and job categories that contribute the most in terms of jobs and wages, which though correlated, are not the same. We present data on how job and wage bill shares have changed over the period from 2002 to 2017. There are clear patterns that emerge, and we relate these to the previous discussion of the factors driving the trends in the economy. We then present other important observations and conclusions regarding service industrialization and demographic changes in the seventh section. In the eighth section, we discuss the implications of the trends discussed earlier for managers and policy makers to address the issues that are being faced at all levels of the economy. Finally, we present our concluding remarks about the potential for future research in the ninth section.
2
                       Literature Review

This section presents a brief review of the literature that studies employ-
ment and wages either in the broad context of the structural changes
of the economy and the trend to the dominance of information (or
knowledge) services, or in relation to some of the service industrial-
ization processes that have been taking place. For example, there are
studies that examine employment patterns along the information versus
material (non-information) dichotomy that have been observed and doc-
umented. Osberg et al. (1989) identify three broad occupational sectors
within modern advanced economies like the US and Canada: the goods
sector comprising occupations that directly involve the manipulation
or transformation of goods; the personal service sector consisting of
occupations that involve service to other individuals; and the informa-
tion sector that involves the production or manipulation of symbolic
information. They argue that labor productivity in goods and data
production grows steadily over time due to increasing capital intensity
of production and the impact of advances in information and com-
munication technologies (ICT). In contrast, labor productivity in the
personal services and knowledge sectors does not tend to increase over
time, as labor time is the output in personal services occupations and

                                   256
257
the human creativity essential to knowledge production demonstrates
little tendency to increase over time.1 These differences in productivity
growth explain the relative increase in the employment of personal ser-
vice and knowledge workers. They analyze occupational data between
1960 and 1980 in the US to demonstrate a relative shift in employment
towards knowledge-based occupations. Wolff (2006) extends this analy-
sis and finds that information workers (knowledge producers and data
processors) increased from 37 percent of the workforce in 1950 to 59
percent in 2000 in the United States. His analysis further shows that
the growth of information workers is not attributable to a change in
tastes for information-intensive goods and services. According to him,
changes in production technology that make it possible to substitute
goods and service workers for information workers and differential rates
of productivity movements among the industries of the economy are
responsible for this growth. Thus, these developments seem to fit the
framework of unbalanced growth. Using a slightly different classification
scheme, Apte et al. (2008 and 2012) also examine employment and
wages of information and non-information workers in the product and
service sector from 1999 to 2007 in the US and observe a trend toward
employment and wage growth for information workers, primarily in the
service sectors.
Cortada (1998) includes an eclectic mix of articles that present
historical, economic, and sociological perspectives on the rise of the
“knowledge workers” – the fastest growing segment of the workforce
in the world today. There are some interesting observations made in
this volume. First, the emergence of knowledge workers was invariably
linked to the advances in technologies. That is, knowledge workers
emerged wherever technologies were advanced. Second, the shift to
knowledge work began in earnest before World War I and by the end
of the 1920s it became a major trend. Third, the ability of a woman
to work in professional careers was made possible mainly by the rise
of knowledge work rather than through any altruistic change in the
1
In case of personal services (e.g., childcare workers, security guards), it is the
labor time of the worker that the consumer purchases. In that sense, the labor time
is an output.258 Literature Review
attitude of male managers. Freeman (2002) further discusses various
labor market outcomes of ICT extension to economic activity.
There has been a plethora of speculations and research-based pre-
dictions about the effects of artificial intelligence (AI) in particular and
ICT in general on jobs in the United States (Brynjolfsson and McAfee,
2014; Ford, 2015). The predictions of job loss range from 45–57% (Chui
et al., 2015; Frey and Osborne, 2017; World Bank, 2016) to little or
no effect at all (Autor, 2014, 2015). While the technology pessimists
seem to focus narrowly on AI, the optimists tend to acknowledge and
take cognizance of wide-ranging ICT-induced and enabled changes in
examining the impacts of ICT on employment and wages. They do not
deny that automation will prove disruptive in the short run. However,
alluding to historical episodes of rapid technological change that created
more jobs than they had destroyed, they argue that a resilient, adaptable
economy would again overcome the threat of technological unemploy-
ment. Technology-induced income growth would raise demand for labor
in sectors that produce non-automatable goods and for workers that
perform manual-intensive tasks; higher productivity would stimulate
investment throughout the economy in cooperating capital inputs; and
while automation would render some jobs obsolete, it would comple-
ment many others, especially jobs that place a premium on creativity,
flexibility, and abstract reasoning.
The recent literature has overwhelmingly noted the polarization
of the US labor market, a phenomenon of rising employment of high
and low skilled jobs together with a decline in middle skill jobs. This
polarization has also led to rising wage inequality. Researchers have
proposed several theoretical models to explain these empirical observa-
tions. One such model that has been widely used (Autor et al., 1998,
2008; Carneiro and Lee, 2009; Katz and Murphy, 1992), referred to
as the canonical model, operationalizes the supply and demand for
skills by assuming two distinct skill groups (high and low skill) that
perform two different and imperfectly substitutable tasks or produce
two imperfectly substitutable goods. It assumes that technology takes a
factor-augmenting form and, by complementing either high or low skill
workers, it can generate skill biased demand shifts. Although this frame-
work helps explain the increase in demand for and wages of high-skilled259
workers due to skill-biased technological progress, i.e., advances in com-
puter technology or broadly, ICT, it does not adequately explain job
polarization. Nor does it explain significant declines in real wages of
low skill workers, new technologies directly substituting capital for la-
bor in tasks previously performed by moderately skilled workers, and
technology-enabled offshoring that allows foreign labor to substitute for
domestic workers specific tasks.
These failures have led researchers (Acemoglu and Autor, 2011)
to propose an alternative task-based framework that incorporates in-
teractions among worker skills, job tasks, evolving technologies, and
shifting trading opportunities. They assume that there are three types
of skills—low, medium, and high—and each worker is endowed with one
of these types of skills. Workers have different comparative advantages.
Given the prices of different tasks and the wages for different types of
skills in the market, firms and workers choose the optimal allocation of
skills to tasks. In this framework, technological change can alter both
the productivity of different types of workers in all tasks and also in
specific tasks, thus changing their comparative advantages. In general,
this model treats skills (embodied in labor), technologies (embodied in
capital), and trade or offshoring as offering competing inputs for ac-
complishing various tasks. Thus, which input (labor, capital, or foreign
inputs supplied via trade) is applied in equilibrium to accomplish which
tasks depends in a rich but intuitive manner on cost and comparative
advantage. This model is referred to as the Ricardian model of the labor
market and presents a richer understanding of the current trends in the
US labor market.
Extending this task-based framework further, Acemoglu and Restrepo
(2018) have recently proposed a model in which technological progress
proceeds on two fronts: automation and the creation of new more com-
plex tasks that only human labor can perform. A representative agent
invests in AI capital that serves as a perfect substitute for labor in a
subset of potentially automatable tasks. In this model, endogenous di-
rected technological change drives the economy onto a balanced growth
path with automation and the creation of complex, new AI-immune
tasks advance at the same rate, provided labor supply is increasing in
the ratio of the wage to capital income. Ceteris paribus, advances in260 Literature Review
automation then reduce the demand for labor relative to capital if the
elasticity of substitution between tasks that produce the final good is
close to the elasticity of substitution between task-specific intermediate
inputs and labor services. The short- and medium-run impact on ab-
solute labor demand is unclear, but in the long run, after the capital
stock fully adjusts, the real wage increases and labor’s share in national
income returns to its original level. When labor is divided into high- and
low-skill workers, the same restrictions ensure that the skill premium
increases in the short run but not the long run.
Assuming that robot capital is different from traditional capital in
its degree of substitutability with human labor and that only capitalists
and skilled workers save, Berg et al. (2018) present another model that
shows that while automation is good for growth it is bad for equality,
particularly in the short run. Despite these attempts at modeling AI and
automation, as Frank et al. (2019) argue, a lack of empirically informed
models of key micro level processes, and insufficient understanding of
how cognitive technologies interact with broader economic dynamics
and institutional mechanisms is a formidable barrier to measuring the
effects of AI and automation on the future of work. A lack of high-quality
data about the nature of work is another challenge.
Furthermore, most studies on the impacts of automation do not
seem to differentiate between software, robotics, and AI. However, as
Muro et al. (2019) note, these technologies may have very different
impacts on the labor market outcomes. In particular, the impact of
AI technology and its potential applications on productivity and labor
market outcomes is delayed due to complementary investments and
innovations (Ericsson, 2018). In a recently published working paper,
Webb (2020) makes the distinctions between the technologies subsumed
under automation. Applying a new method that uses the overlap between
the text of job task descriptions and the text of patents, he constructs
a measure of the exposure of tasks to these different technologies for
the US. The analysis presented in the study predicts that, in contrast
to software and robots, AI is directed at replacing high-skilled tasks. As
one of the implications of this the author reports that AI will reduce
90:10 wage inequality but will not affect the top 1%.261
There is a literature that examines the effects of offshoring on em-
ployment and wages. Some studies (e.g., Apte and Mason, 1995; Mithas
and Whitaker, 2007) look at these issues through the lens of global
disaggregation of information-intensive services that have been made
possible largely by the advances in ICT. Apte and Mason (1995) develop
a classification framework to identify the services and jobs, which are
most amenable to service disaggregation. Building on this classification
scheme, Mithas and Whitaker (2007) propose and empirically validate
a theory of service disaggregation, which argues that a service with
high information-intensity jobs makes it relatively more amenable for
disaggregation. Their analysis shows that high information-intensive
occupations requiring higher skill levels have experienced high growth
in employment but a decline in salary growth. Furthermore, occupa-
tions with a higher need for physical presence have also experienced
higher employment growth and lower wage growth. However, the scope
of these changes in production and delivery of services (particularly,
information-intensive services) is far greater than just spatial disag-
gregation of the supply chain, as noted by Karmarkar (2004). Along
the same line, Blinder (2007) uses the US labor data to estimate that
somewhere between 22% and 29% of the US jobs are or would be poten-
tially offshorable within the following decade or so. However, as Barbe
and Riker (2018) point out, the effects of offshoring on employment
depends on a number of factors, such as skills and type of offshoring.
Some studies tend to present evidence of adverse effects of offshoring on
low-skill workers and of positive effects on high-skill workers. Similarly,
different types of offshoring have either positive or negative impacts on
employment in the home country. Given this heterogeneity, it is often
difficult to assess the overall impact on employment in the economy.
When considered separately, these industrialization strategies seem
to have significant negative impacts on employment. However, few
studies examine the overall impacts of these strategies together. For
some of these strategies (e.g., self-service, sharing economy), it is difficult
to quantify the impacts as they may not impact a particular job in its
entirety but may affect only certain aspects or tasks associated with
the job leading to reorganization of tasks or re-engineering of processes
(Brynjolfsson et al., 2018).3
Service Industrialization
By service industrialization we mean technology driven changes in
the industrial processes by which information goods and services are
produced and delivered.1 The purpose is to identify the drivers of process
changes, and the consequences for industry structure, competition, jobs,
and wages. Industrialization itself is driven by many decisions, for the
most part made locally and internally, by managers and decision makers
in order to improve the competitive performance and profits of their
firms and organizations.
There are analogies between the industrial revolution of the late 18th
and 19th centuries, and the recent and ongoing changes in information
economy. For manufacturing, industrialization was driven by a set of
complementary factors including the application of sources of power
such as water, steam and electricity, the mechanization and automation
of processes to leverage human ability, and increases in the efficiency of
transportation and logistics using rail, roads, and shipping. Important
facilitating approaches included a process of standardization starting
with products, going to processes, and leading to mass production. This
1
The material in this section is partly drawn from Karmarkar (2004, 2010, 2014)
and Apte et al. (2012, 2015).
262263
required precision of specification and measurement to support product
standardization.
All the driving factors for industrialization in manufacturing have
now appeared in information production processes as well. Clearly there
have been vast increases in basic processing capability as observed
by Moore’s Law (1965). Correspondingly, the ability to automate and
leverage human capabilities in data and information processing has
increased, starting with mechanical devices such as card sorters and
calculators, and going to computers. The telegraph, telephone, radio,
and TV were big leaps in communication capabilities that occurred
decades ago. But they all had their limitations, of which one was the
inability to integrate well with computers. Major advances came quite
recently with packet switched data networks, the internet and the world-
wide web. These innovations, enabled by protocols and standards as
much as by hardware, created the explosion of information logistics in
the 1990s. What is new about modern data communications systems
is that they integrate seamlessly and digitally with the processing and
storage resources, allowing for end to end integration of information
chains and networks.
The process of standardization is also occurring in information
production for goods and services, but the path is different in that it is
associated more with processes rather than products. By and large, the
starting point has been the standardization of the way information is
represented in terms of symbols, and then bits. The next step has been
the standardization of processes. An early step was the creation of a
standardized process of production: printing with blocks or movable type.
The two together allowed for the mass production of books. Modern
computational tools of course depended upon binary arithmetic and
Boolean algebra. Production, storage and processing tools evolved from
the mechanical, to the electro-mechanical and to the electronic. So the
standardization process for information products and services can be
thought of in stylized form as
• standardization of information representation in symbolic form
• standardization of processing and processes at the machine, oper-
ating system and CPU level264 Service Industrialization
• standardization of products and services with standards for pro-
cessing, file formats and interfaces.
Just as with physical production, an eventual consequence of stan-
dardization has been process modularization. This has led to object
oriented software, client-server and multi-tier system architectures, and
distributed computing. Today we are in the middle of a new wave
of modular operation with service oriented architectures, syndication,
containers, Application Program Interface (API), and web services.
The standardization of information processes at the machine and
process level, is now visibly migrating upwards into transaction handling
and business processes. The most systematic example on the transaction
side has perhaps been in telecommunications. At a basic level, stan-
dardization of business transactions has been widespread in banking
and other financial services, and in inter-firm transactions facilitated
first with standards like Electronic Data Interchange (EDI) and later
with Extensible Markup Language (XML) and other document and
file formats. With higher level business processes, the degree of agree-
ment and standardization is far lower, but companies like SAP, IBM,
Microsoft, Amazon, and Google are competing to define standardized
business processes, though often in proprietary forms.
Industrialization could as well be thought of in large part as the
creation and application of new technologies. Whether it is in the en-
hancement of processing power (computers), or in more effective logistics
(telecommunications), new technologies are involved. The process of
creating, commercializing and adopting technologies is a part and parcel
of industrialization, and inseparable from it. Issues like standardization
(for example, communications protocols) enable commercialization and
adoption of technologies, just as they support industrialization. We
might say that technology development and adoption processes are a
major part of industrialization, though not all of it.
In manufacturing, industrialization was associated with scale eco-
nomies and increased centralization of processing. But for information
intensive processes, especially in recent decades, the trend has been
towards miniaturization, low power, mobility, and the dispersion of
processing. There are indeed scale economies associated with some265
aspects of processing as with server farms, telecom fiber lines, digital
switches and network equipment. However, advances in technology
as exemplified for many decades by Moore’s Law have meant that
productive capacity has advanced faster than physical scale even in
these cases. Rapid, cheap, and ubiquitous transport has enabled efficient
sharing of centralized processing, storage and logistics resources as
services thereby reducing fixed costs and capital expenses for many
users while improving the utilization of assets. The trend to everything-
as-a-service (XaaS) and the growth of third party services has greatly
reduced fixed costs for firms, and moved capital expenses to operating
expenses. The end result is that the costs of entry and operations
have dropped dramatically in information intensive sectors, thereby
intensifying competition.
The “pull” aspect of industrialization, as with technological devel-
opment, comes from the actions of firms both established and new, to
compete more effectively and to create markets and profits. In practice,
service firms industrialize to compete more effectively, and to increase
or maintain profitability. The service industrialization that we observe
at the level of process decisions (Apte et al., 2015; Karmarkar, 2004;
and Karmarkar and Apte, 2007) include
• Automation
• Off-shoring
• Outsourcing
• Process restructuring
• “Servicization” or “Servitization”
• New Markets and Exchanges, including asset sharing markets and
micro-markets
• Social communication and interactive networks
• Operations shifting (within processes)
• Self-service (shifting operations to the customer)266 Service Industrialization Many of these strategies are analogous to factors in the industrialization of manufacturing, though some such as self-service and social networks are much more prevalent with information intensive services. There are also substantial new policy issues that arise in areas such as regulation, security, and contracting, as well as in the creation and operation of infrastructure (as with the internet), the assignment of rights (as with the radio spectrum and intellectual property), educational policy and taxation. However, our focus in this paper is mainly on service industrialization and its consequences for jobs, employment and wages.
4
             Major Trends in the US Economy

The major structural changes at the macro level provide the broad con-
text for service industrialization. We observe two relevant developments
over past half of a century. The first is the gradual shift from products
to services (see Chase and Apte, 2007). The service sector has become
the dominant sector generating most of the wealth and employment
in the economy.1 The second development involves a shift of economic
activities from material to the information domain of the economy.
Machlup (1962) and Porat (1977) were among the first to identify and
quantify this shift. Although there are methodological issues with both
studies, they were followed and replicated in subsequent years.2 Porat’s
(1977) method of measuring information economy is consistent with the
conventional national income accounting (NIA) framework and therefore
the measures can easily be compared with the government-published
national income and product accounts measures. According to Apte
et al. (2012), the share of the information economy in the US GNP grew

    1
      Sociologists refer to this stage of society’s development as the post-industrial
society, a term popularized by Daniel Bell (1973).
    2
      For example, see Machlup (1980), Rubin and Taylor (1981), OECD (1986), Apte
and Nath (2007), Apte et al. (2008 and 2012).

                                        267
268 Major Trends in the US Economy
from about 46.3 percent in 1967 to about 60 percent in 2007. An update
of these measures places this share at about 62 percent in 2017.3
4.1 Broad Sectoral Changes
Apte et al. (2008) juxtapose the two broad trends discussed above to
propose a conceptual framework for analyzing the structural changes in
the US economy. The “double dichotomy”, as they call it, divides the
economy into four super sectors: material products, material services,
information products, and information services. This decomposition
and its evolution over time are extremely important for understanding
service industrialization. There seems to be an endogenous relationship
between the changes in the industrial and business processes involving
production and delivery of information goods and services – which
we have called service industrialization – and the evolution of the
information services sector.
In terms of value addition to the US economy, the information
services super sector is identified as the largest and fastest growing
segment of the economy over a three decade period until the beginning
of the 21st century. According to Apte et al. (2012), while it is still
the largest super-sector, its relative growth has been somewhat slower
in recent years. We update the calculations of Apte et al. (2012) for
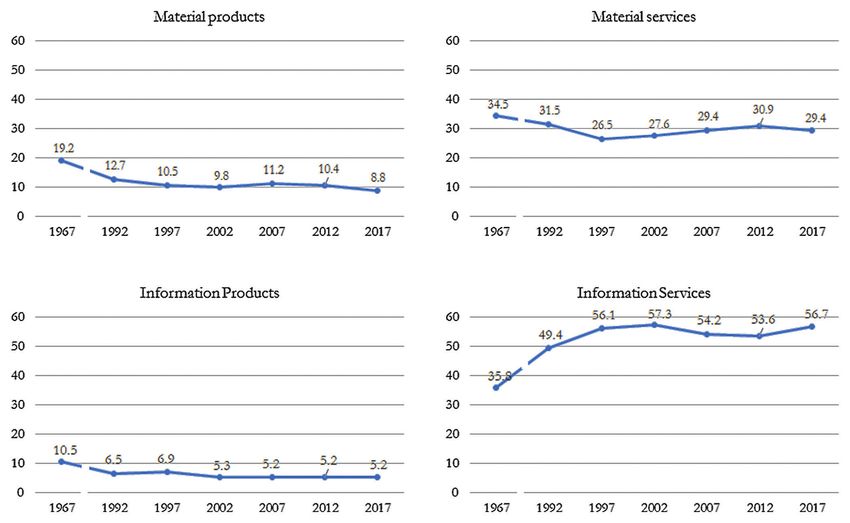
2012 and 2017, and present the summary in Figure 4.1.4 As the figure
illustrates, the contribution of information services to the US GNP
increased from about 36 percent in 1967 to more than 49 percent in
1992, the very beginning of the Internet era. These services grew faster
than the other segments of the economy until the turn of the century,
then slowed down, and finally have been growing faster again since 2012,
Consequently, after a decline in its relative GNP share from about 57
percent in 2002 to less than 54 percent, it has grown to about 57 percent
again in 2017. While cyclical fluctuations of the economy may have
something to do with the slower growth, a spurt in industrialization
activities after the great recession may be intricately related to this
3
Appendix A includes a brief description of the methods and the updated
measures.
4
For details, see Appendix A.4.2. Broad Changes in Employment and Wages 269
Figure 4.1: 2 × 2 decomposition of GNP in 1967, 1992, 1997, 2002, 2007, 2012,
and 2017 (vertical axes represent percent share in GNP). Detailed data tables are
included in Appendix A.
growth of the information services. However, these conjectures need
formal validation, which is beyond the scope of this paper.
4.2 Broad Changes in Employment and Wages
As Apte et al. (2008 and 2012) argue, when a task-based classification
of employment into information and non-information (material) is su-
perimposed over the traditional products versus services classification of
industries, it gives a new perspective that is pertinent to an understand-
ing of the potential impacts of service industrialization on employment
and wages.
Table 4.1 presents the 2×2 decomposition of total employment, wage
bill, and average wages in the US economy for 1999, and at five-yearly
intervals between 2002 and 2017.5 Note that it included the year right
after the 2001 recession, the time periods just before and after the great
5
For a brief discussion on the methods, see Appendix A.Table 4.1: 2 × 2 decomposition of employment, wage bill, and average wages in the US economy: 1999–2017
270
Percentage Shares Percentage Shares Average Annual
of Employment of Wage Bill Wage (in Current USD)
Products Services Total Products Services Total Products Services Total
1999
Non- 10.00 45.15 55.15 Non- 8.63 37.46 46.09 Non- 27,061 26,039 26,224
information information information
workers workers workers
Information 4.00 40.86 44.85 Information 6.21 47.70 53.91 Information 48,793 36,629 37,713
workers workers workers
Total 14.00 86.00 100.00 Total 14.84 85.16 100.00 All Workers 33,264 31,070 31,377
2002
Non- 8.48 43.73 52.21 Non- 7.35 36.12 43.47 Non- 30,796 29,362 29,595
information information information
workers workers workers
Information 3.11 44.68 47.79 Information 4.76 51.77 56.53 Information 54,402 41,187 42,047
workers workers workers
Total 11.59 88.41 100.00 Total 12.10 87.90 100.00 All Workers 37,127 35,338 35,545
2007
Non- 7.54 44.70 52.23 Non- 6.37 36.83 43.20 Non- 34,419 33,529 33,658
information information information
workers workers workers
Information 2.80 44.96 47.77 Information 4.31 52.49 56.80 Information 62,691 47,502 48,392
workers workers workers
Total 10.34 89.66 100.00 Total 10.69 89.31 100.00 All Workers 42,077 40,536 40,696
Continued.
Major Trends in the US EconomyTable 4.1: Continued
Percentage Shares Percentage Shares Average Annual
of Employment of Wage Bill Wage (in Current USD)
Products Services Total Products Services Total Products Services Total
2012
Non- 6.23 47.45 53.68 Non- 5.02 37.86 42.88 Non- 36,862 36,534 36,572
information information information
workers workers workers
Information 2.94 43.38 46.32 Information 4.62 52.50 57.12 Information 71,946 55,412 56,462
workers workers workers
Total 9.17 90.83 100.00 Total 9.64 89.46 100.00 All Workers 48,109 45,551 45,785
2017
Non- 5.87 48.33 54.20 Non- 4.66 38.44 43.10 Non- 40,198 40,261 40,254
4.2. Broad Changes in Employment and Wages
information information information
workers workers workers
Information 2.77 43.03 45.80 Information 4.28 52.62 56.90 Information 78,144 61,901 62,884
workers workers workers
Total 8.64 91.36 100.00 Total 8.94 91.06 100.00 All Workers 52,367 50,452 50,618
Note: The figures for 1999, 2002, and 2007 are taken from Apte et al. (2012). For 2012 and 2017, authors’ calculations based on OES data
from BLS.
271272 Major Trends in the US Economy
recession, and finally the year when the US economy seemed to have
completely recovered from the great recession.
For each year, the distribution of employment and wage bill in terms
of percentage shares among the four categories of workers is indicated by
a combination of the descriptions along the relevant rows and columns.
For example, in 2017, non-information workers in the products sector
accounted for 5.87% of the total employment and only 4.66% of total
wage bill in the US economy. The last column and the last row also
present the total for the categories under each dimension of the double-
dichotomy. Thus, workers in the products sector accounted for 8.64% of
total employment and approximately 8.94% of total wage bill in 2017,
while workers in the services sector accounted for the remaining 91.36%
and 91.06% of employment and wages, respectively. In contrast, non-
information workers constituted about 54.2% of total employment and
about 43.1% of total wage bill in that year. Correspondingly, information
workers accounted for about 45.8% and 56.9% of employment and wages,
respectively. The figures under the “average wage” column represent
average wages (in current dollars) of the four categories of workers.
For example, a non-information worker in the products sector earned
an average income of USD 40,198 in 2017. The table also presents
average wages by broad categories. Thus, a worker in the products
sector, on average, earned USD 52,367, while he/she earned USD 50,452
in the services sector in 2017. In contrast, a non-information worker, on
average, earned USD 40,254, while an information worker earned USD
62,884 per year in the same year.
Figures 4.2 and 4.3 present the employment and wage-bill shares
of information and non-information workers by product and service
industries. In Figure 4.4, we show the evolution of average real wages
(deflated by annual consumer price index–CPI–data with 1982–84 as
the base year compiled by BLS) by these four categories of workers.
We note that the average real wage for the information workers in the
service industries increased more rapidly than that for other categories
of workers from 2007 to 2017 although average real wage was the
highest for information workers in product industries throughout the
period.4.2. Broad Changes in Employment and Wages 273
Non-info workers in products Non-info workers in services
50 50 45.15 44.7 47.45 48.33
45 45 43.73
40 40
35 35
30 30
25 25
20 20
15 10 8.48 15
10 7.54 6.23 5.87 10
5 5
0 0
1999 2002 2007 2012 2017 1999 2002 2007 2012 2017
Info workers in products Info workers in services
50 50 44.68 44.96
45 45 40.86 43.38 43.03
40 40
35 35
30 30
25 25
20 20
15 15
10 4 10
3.11 2.8 2.94
5 2.77 5
0 0
1999 2002 2007 2012 2017 1999 2002 2007 2012 2017
Figure 4.2: 2 × 2 decomposition of employment by types of workers and industries
(vertical axes represent percent share in total employment).
We make the following observations from the data analysis presented
in the table and the figures. First, a majority of all workers were
employed in the services sector. The share of services employment
had increased from 86% in 1999 to approximately 91% in 2017. Within
services, non-information workers were the largest constituent for almost
all years with about 45% of total employment in 1999 and about 48%
in 2017. The employment share of information workers rose from about
41% in 1999 to about 45% in 2007, becoming the largest category of
workers in the economy. However, the share declined subsequently to
about 43% in 2017. In the products sector, the employment shares of
both information and non-information workers have been steadily falling.
Along the information–non-information dichotomy, the non-information
workers accounted for about 55% of total employment in 1999, and
this share dropped to about 52% in 2007 but then it climbed up to
about 54%.274 Major Trends in the US Economy
Non-info workers in products Non-info workers in services
55 55
50 50
45 45
40 37.46 36.12 36.83 37.86 38.44
40
35 35
30 30
25 25
20 20
15 8.63 7.35 15
10 6.37 5.02 4.66 10
5 5
0 0
1999 2002 2007 2012 2017 1999 2002 2007 2012 2017
Info workers in products Info workers in services
55 55 47.7 51.77 52.49 52.5 52.62
50 50
45 45
40 40
35 35
30 30
25 25
20 20
15 15
10 6.21 4.76 4.31 10
4.62 4.28
5 5
0 0
1999 2002 2007 2012 2017 1999 2002 2007 2012 2017
Figure 4.3: 2 × 2 decomposition of wage bill by types of workers and industries
(vertical axes represent percent share in total wage bill).
Second, services workers received the largest share of the total wage
bill in the US, and this share increased from about 85% in 1999 to
about 91% in 2017. Within services, information workers received the
largest share, accounting for about 48% of total wage bill in 1999. This
share rose steadily to 53% in 2017. The wage bill share of the products
workers steadily declined, with slight fluctuations for information and
non-information workers over that period. Furthermore, the overall
share of information workers in the total wage bill increased from
about 54% in 1999 to more than 57% in 2012, and then it declined
slightly.
Third, average wages were higher in the products sector. Within
this sector, information workers in 2017, on average had earnings about
1.94 times higher than non-information workers. In the services sector,
information workers earnings were about 1.54 times higher than those4.2. Broad Changes in Employment and Wages 275
Non-info workers in products Non-info workers in services
31000 31000
29000 29000
27000 27000
25000 25000
23000 23000
21000 21000
19000 17118 19000
16243 16503 16055 16401 16321 16174 15912 16426
17000 17000 15630
15000 15000
1999 2002 2007 2012 2017 1999 2002 2007 2012 2017
Info workers in products Info workers in services
31882
30240 30242 31335 31000
31000 29288
29000
29000
27000 25255
27000
25000 24134
25000 22894 22915
23000 21986
23000
21000 21000
19000 19000
17000 17000
15000 15000
1999 2002 2007 2012 2017 1999 2002 2007 2012 2017
Figure 4.4: Average real wage by types of workers and industries (vertical axes
represent average real wage at 1982–84 constant prices).
of non-information workers. Overall, the average wage of information
workers was 1.56 times greater than that of non-information workers.
However, there are sectoral differences in the earnings of information
workers. On average, they earned about 1.04 times higher in the products
sector than their counterparts in the services sector in 2017. This ratio
has declined over the years. Higher average wages in the products sector
appeared to be a reflection of the fact that most information workers
in the products sector were engaged in “high-end” information jobs,
while a large number of information workers in the service sector were
engaged in “low-end” information jobs.6 We also observes that the
6
By “high-end” information jobs, we refer to those jobs that require high cognitive
skills and innovative ideas, such as managerial jobs, scientists, designers, etc., and
by “low-end” information jobs, we refer to those jobs that are routine or repetitive
in nature and do not require very high cognitive skills or innovative ideas, such as
travel agent, customer service representative, etc.276 Major Trends in the US Economy wage differences in average wages for non-information workers between products and services industries have disappeared in most recent years.
5
     Service Industrialization, Jobs and Wages

In this section we examine the impact of service industrialization at a
detailed level including specific occupations. In the following section,
we consider the effects at an aggregate level of industry sectors and
occupational categories. A major source here as in the following section,
is the Occupational Employment Statistics (OES) database from the
Bureau of Labor Statistics (BLS) that provides data on employment and
wages for various SOC categories of occupations by NAICS categories
of industries (sectors). Industrialization strategies are implemented via
decisions and choices made by managers in companies, so as to improve
profitability and competitiveness as summarized in Section 3 above.
Some of the mechanisms that we discuss are also visible in aggregate at
the sector or occupation level as described in the next section. However
some effects are not, even when they are seemingly obvious to the
casual observer at a company and job level. It is apparent, for example,
that there are fewer tellers serving customers, and that retail banking
is moving to automated online and mobile transactions quite rapidly.
However it is not always easy to see significant movement in occupational
categories at the industry and sector level. In some cases, there are
other changes that can hide certain effects – for example, deregulation

                                  277
278 Service Industrialization, Jobs and Wages
of banking resulted in a pattern of growth in bank branches that tended
to hide the ongoing automation of teller functions. As an example,
an FDIC report in 2014 noted that the number of bank and thrift
offices actually grew about 23% from 1995 to 2009 despite substantial
implementation of computers.1 As a result, the number of teller jobs
did not decline till after 2007. After 2009, there was a decline in the
number of branches of almost 5% till 2014, but the cause of that was
not clear and could have been the recession rather than technological
change. In other words, in many cases following historical trends for
aggregate data does not always provide clear evidence of the changes
actually underway at the detailed job category and sector level.
In the remainder of this section we discuss the effects of industrial-
ization strategies, and look for specific examples of leading indications of
shifts in employment. These shifts can happen with dismaying rapidity
with little time for adjustment by management or workers.
5.1 Automation
An aspect of industrialization that has received considerable atten-
tion in the past is the substitution of capital for labor in the form
of automation including both soft and hard technologies, applied to
production processes and the delivery of both goods and services. While
the motivation for implementing automation is usually the reduction of
recurring labor costs, automation can also improve quality, especially in
the sense of conformance and reliability, and provide improved spatial
and temporal access. Automation tends to apply typically at the level
of operations, and occasionally at the level of processes. Automation,
often anthropomorphized as the replacement of workers by “robots”,
has received considerable attention recently. We have discussed this
literature in Section 2. Most of the studies in this literature deal with
analytical models of substitution for labor; a few include data analyses.
The automation and mechanization of information related operations
began a long time ago with printing, broadcasting and telecommunica-
tions, and later with equipment such as typewriters, cash registers, and
1
https://thefinancialbrand.com/50382/fdic-branch-mobile-behavior-report/
(accessed September 15, 2019).5.2. Outsourcing and Off-Shoring 279
calculators. Productivity and efficiency increased, but the employment
effects were largely positive in the aggregate. However, modern comput-
ers started a wave of automation that had a negative impact on certain
jobs. In particular, many back-room tasks ranging from data manage-
ment, recording, word processing, internal transactions and computation
have been affected, and clerical, secretarial and accounting jobs are all
impacted. The next wave of automation, still in process, includes what
might be called “front office automation” affecting jobs in customer
response, counter service, transaction handling and sales. One of the
current shifts in service processes is the automation of transactions such
as airline check-in and grocery check-out. The next level of automation
includes tasks with more interaction and information processing, such
as bank teller services. The employment of bank tellers (SOC code
43-3017) declined by over 52,000 between 2012 and 2017 and by over
107,000 between 2007 and 2017. Between 2012 and 2017, employment
of Financial Clerks (SOC code 43-3000), a category that includes tellers
as well as certain backroom data related tasks, declined by over 102,000.
BLS studies forecast that bank teller employment (SOC code 43-3071)
will decline by over 42,000 between 2016 and 2026.2 Figure 5.1 presents
a graph of teller employment from 2002 to 2018, and Figure 5.2 shows
the same data in terms of job share. The patterns are basically similar.
It is interesting that the employment numbers actually grew till about
2005, after which there has been a steady decline.
5.2 Outsourcing and Off-Shoring
Outsourcing of work to onshore providers may or may not always reduce
jobs in the aggregate. However, with work that has economies of scale
due to pooling effects, process efficiencies or capital substitution, job
numbers can well be reduced. Off-shoring or the movement of jobs to
other countries is typically employed to reduce labor costs, as when call
centers are moved from the US to Asian locations such as the Philippines
and India. Much software development has gone off-shore. Offshoring
of course reduces employment. It also affects tax revenues, and the
2
https://www.bls.gov/emp/tables/occupations-largest-job-declines.htm
(accessed September 15, 2019).280 Service Industrialization, Jobs and Wages
700000
Employment (No. of jobs) 600000
500000
400000
300000
200000
100000
0
2000 2005 2010 2015 2020
Ye ar
Figure 5.1: Employment of tellers (banking), number of jobs (2002–18).
multiplier effects of expenditures by wage earners. An early paper on
the technology enabled disaggregation and geographical dispersion of
jobs is Apte and Mason (1995). Other recent work on the impact of
off-shoring includes the papers by Apte and Karmarkar (2007), Blinder
(2007), and Blinder and Krueger (2013).
Call centers are a well-known example of outsourcing and off-shoring.
Many countries are involved in off-shore provisioning of business services,
0.5
0.45
Employment (% s of Jobs)
0.4
0.35
0.3
0.25
0.2
0.15
0.1
0.05
0
2000 2002 2004 2006 2008 2010 2012 2014 2016 2018 2020
Year
Figure 5.2: Job share of tellers (banking) as % of total private employment
(2002–18).5.3. Operations Shifting and Self Service 281
with India, China and Malaysia being the leading locations in 2019.3
India was the leader for call center services for the US for a period but
was overtaken by the Philippines in 2011.4 In 2011, the Philippines had
over 400,000 workers in call centers and India still had over 350,000
agents. These numbers by implication are indicative of the substantial
impact on US employment.
Another consequence of outsourcing and off-shoring is the continued
decline of jobs for computer programming, even as the information
economy has grown. Employment for programmers (OCC code 15-1131)
declined by 69,600 from 2012 to 2017. The Bureau of Labor Statistics
(BLS) forecasts that employment in that category will decline by over
21,000 from 2016 to 2026.5
5.3 Operations Shifting and Self Service
Operations shifting refers to the movement of a task from one part of
a process to another. It often results in the elimination of a process
step and the associated job(s). For example, a significant proportion
of document formatting now gets done at the point of creation of a
document by the author, with the use of the automated capabilities of
word processing software.
In 1984, “Secretary” was the leading occupation in almost all states
in the US. By 1990, this was no longer the case, and after 2000 it
was true for just a few states.6 The jobs that were done by secretaries
historically included document preparation, document filing, phone
response, calendar maintenance, scheduling, office administration and
sundry tasks for managers and other office personnel. Many of these
tasks and operations have shifted to the personnel served, so that most
managers now answer their own phones, work on their own documents,
respond to calls, and manage their own schedules. The employment
3
https://www.statista.com/statistics/329766/leading-countries-in-offshore-
business-services-worldwide/ (accessed September 15, 2019).
4
https://www.nytimes.com/2011/11/26/business/philippines-overtakes-india-
as-hub-of-call-centers.html (accessed September 15, 2019).
5
https://www.bls.gov/emp/tables/occupations-largest-job-declines.htm, op.cit.
6
https://www.npr.org/sections/money/2015/02/05/382664837/map-the-most-
common-job-in-every-state (accessed September 15, 2019).282 Service Industrialization, Jobs and Wages
4500000
4000000
Total
Employment (No. of Jobs)
3500000
3000000
2500000
General
2000000
1500000
Executive
1000000
500000 Medical
Legal
0
2000 2002 2004 2006 2008 2010 2012 2014 2016 2018 2020
Year
Figure 5.3: Employment of secretaries (total, general, executive, medical, and legal),
number of jobs (2002–18).
of Secretaries and Administrative Assistants (OCC code 43-600) has
dropped by over 16,000 from 2012 to 2017. BLS forecasts suggest that
those jobs will decline by over 192,000 in the period from 2016 to 2026.7
Figure 5.3 shows the number of secretarial jobs over the period 2002–
2018. The total across all categories is flat till about 2008, and then
drops steadily. Looking at the breakdown of the total across categories,
we see that executive secretary jobs are the major factor in the decline
of the total number, dropping sharply after 2008. Legal secretary jobs
show a steady decline over this period, while medical secretary jobs
increase. The “all other” or general category of secretaries actually
shows gains till 2016, and then begins to decline. Figure 5.4 presents
the same data in terms of employment share as a percentage of total
private sector employment.
Self-service is a major form of operations shifting; there are many
examples related to transactional services such as sales, e-commerce
and retail banking, which are increasingly done by customers and
clients interfacing with an automated system. Such shifts can increase
productivity and efficiency by reducing communications and transactions
in the system, or by using more efficient and lower cost resources. The
secretarial jobs mentioned above partly involve self-service by managers
7
https://www.bls.gov/emp/tables/occupations-largest-job-declines.htm, op.cit.You can also read