Solent Authorities Devolution and the future of local government - Test Valley Borough Council
←
→
Page content transcription
If your browser does not render page correctly, please read the page content below
www.pwc.co.uk    Final

                Solent Authorities
                Devolution and the
                future of local
                government
Confidential

November 2016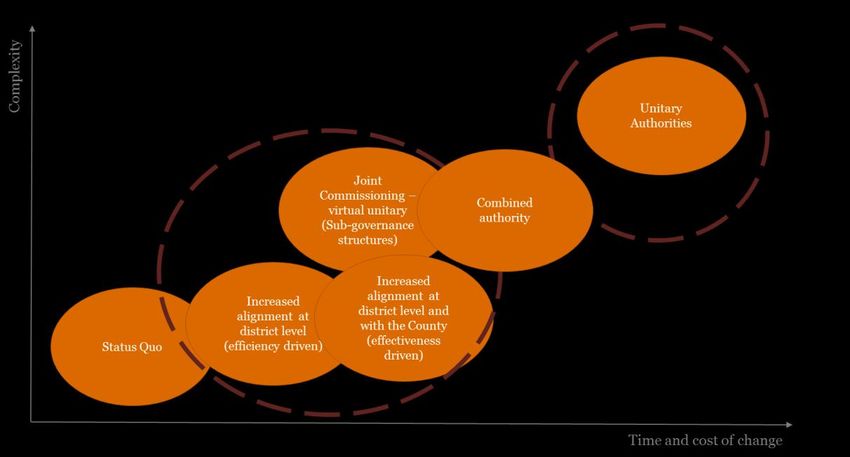
Devolution and the future of local government in the Solent                                                                             Final

Contents
Important notice .......................................................................................................................... 1

Executive summary..................................................................................................................... 2

1. Introduction .......................................................................................................................... 11

1.1.    Purpose of this report                                                                                                            11
1.2.    Hampshire and the Isle of Wight                                                                                                   11
1.3.    Solent authorities                                                                                                                13
1.4.    Local Economies                                                                                                                   14
1.5.    Local government in Hampshire and the Isle of Wight                                                                               17
1.6.    The recent evolution of local government                                                                                          19
1.7.    The case for change and the Solent Devolution Deal                                                                               23
1.8.    The path to devolution                                                                                                           24

2. Unitary authority options ......................................................................................................27

2.1.    The unitary authority options considered                                                                                         27
2.2.    Status quo (baseline)                                                                                                            28
2.3.    Three unitary authorities                                                                                                        28
2.4.    Five unitary authorities                                                                                                         29
2.5.    Commentary                                                                                                                       30

3. Providing value for money and delivering positive outcomes ............................................... 31

3.1.    Approach                                                                                                                          31
3.2.    Baseline                                                                                                                          31
3.3.    Disaggregation of County Council income and expenditure                                                                          33
3.4.    Economy and efficiency                                                                                                           34
3.5.    Summary Results                                                                                                                  35
3.6.    Payback period                                                                                                                   37
3.7.    Council tax harmonisation                                                                                                        38
3.8.    Summary and conclusions from value for money and cost of transition analysis                                                     38

4. Strong local leadership and accountability........................................................................... 40

4.1.    Local government reform and the opportunity to strengthen leadership and accountability                                          40
4.2.    Clarifying accountability                                                                                                        40
4.3.    Ensuring simplicity                                                                                                              46
4.4.    A Mayoral combined authority                                                                                                     46
4.5.    Summary and conclusions                                                                                                          46
Devolution and the future of local government in the Solent                                                            Final

5. Strong local leadership and accountability........................................................................... 48

5.1.   Introduction                                                                                                     48
5.2.   Current baseline position                                                                                        48
5.3.   Future opportunity                                                                                               49
5.4.   Developing the better service tests                                                                              50
5.5.   Appropriate scale                                                                                                52
5.6.   Citizen centricity                                                                                               53
5.7.   Connected government                                                                                             55
5.8.   Empowered to deliver                                                                                             56
5.9.   Delivering the promise                                                                                           58
5.10. Continuously innovate                                                                                             59
5.11. Summary                                                                                                           59

6. Summary of findings and key conclusions ............................................................................ 61

6.1.   Summary of findings                                                                                              61
6.2.   Key conclusions                                                                                                  63

Appendix A: Technical financial information ........................................................................... 64

A.1.   Three unitary option                                                                                             64
A.2.   Five unitary option                                                                                              66
A.3.   Council tax harmonisation                                                                                        68
A.4    Disaggregation of Revenue Support Grant (RSG)                                                                    76
Devolution and the future of local government in the Solent                                                  Final

Important notice
This document has been prepared by PricewaterhouseCoopers LLP (“PwC”) for Basingstoke & Deane Borough
Council acting on behalf of Portsmouth City Council, Southampton City Council, Isle of Wight Council, East
Hampshire District Council, Eastleigh Borough Council, Fareham Borough Council, Gosport Borough Council,
Havant Borough Council (all collectively referred to as the “Solent authorities”) in accordance with the order
form (CGP47) dated 02 June 2016, as varied by the order variation form (001) dated 08 August 2016.
Accordingly, the contents of this document are strictly private and confidential.
This paper contains information obtained or derived from a variety of sources as indicated within this
document. PwC has not sought to establish the reliability of those sources or verified the information so
provided. Accordingly no representation or warranty of any kind (whether express or implied) is given by PwC
to any person (except to the Solent authorities under the relevant terms of the Engagement) as to the accuracy
or completeness of the report. Moreover the report does not absolve any third party from conducting its own
due diligence in order to verify its contents. For the avoidance of doubt this Engagement is not an assurance
engagement and PwC is not providing assurance nor are the services being performed in accordance with the
International Standard on Assurance Engagements 3000 (ISAE 3000).
PwC accepts no duty of care to any person (except to the Solent authorities) for the preparation of this report.
Accordingly, regardless of the form of action, whether in contract, tort or otherwise, and to the extent permitted
by applicable law, PwC accepts no liability of any kind and disclaims all responsibility for the consequences of
any person (other than the Solent authorities on the above basis) acting or refraining to act in reliance on the
briefing or for any decisions made or not made which are based upon such report.
In the event that, pursuant to a request which the Solent authorities have received under the Freedom of
Information Act 2000 or the Environmental Information Regulations 2004 (as the same may be amended or
re-enacted from time to time) or any subordinate legislation made there under (collectively, the “Legislation”),
the Commissioning Councils are required to disclose any information contained in this report, it will notify PwC
promptly and will consult with PwC prior to disclosing such report. The Commissioning Council agrees to pay
due regard to any representations which PwC may make in connection with such disclosure. If, following
consultation with PwC, the Council discloses this document or any part thereof, it shall ensure that any
disclaimer which PwC has included or may subsequently wish to include in the information is reproduced in full
in any copies disclosed.

Private and Confidential                                                                                         1
Devolution and the future of local government in the Solent Final
Executive summary
Devolution and future of local government in the Solent
Across Hampshire and the Isle of Wight local government is at risk of turning inward as a result of fallout from
failed discussions on a devolution settlement for the Hampshire & the Isle of Wight area, which sought to
devolve power from Whitehall. This has brought to the surface tensions which are symptomatic of concerns
about the longer term sustainability of existing arrangements for local government. Since then the parties
involved in the previous Hampshire and the Isle of Wight devolution prospectus have been considering their
next steps as follows:
Hampshire County Council has developed and consulted on its own options for unitary solutions;
Solent authorities are focussed on securing a combined authority to bring new funding and new powers
to support the economy of the area as the first step on their devolution journey; and
Heart of Hampshire authorities want to ensure their residents and businesses have the same opportunity
to benefit from devolution as the rest of Hampshire.
Purpose of this document
This document was commissioned by the Solent authorities, who have sought advice on options for the most
effective and efficient form of local government in the context of opportunities for devolution, combined
authorities and the prospect of further unitarisation. The authorities intend to establish a strong case for
improved governance and devolution which will support the delivery of sustainable services and improved
outcomes for local residents.
In this report we have provided an independent assessment of various options for unitary solutions across the
Solent. The report does not make specific recommendations but it offers views on the suitability of
arrangements for the Solent authorities.
The provision of local government in the Solent needs to be addressed as part of a 'whole system’ of local
government in the area which extends across the existing geography covered by Hampshire County Council and
the 11 district councils. This report is part of a suite of reports using common methodology that analyses the
impact of potential unitary authority options across the geography.
The analysis within this report supports the following conclusions:
Business as usual does not look sustainable from a financial viewpoint for the majority of councils. This
exacerbates the case for change.
When you add the benefits from reorganisation and transformation the budgets are hugely improved,
however some configurations still display deficits.
Status quo without a recalibration of district and Hampshire County Council relationships is undesirable.
An enhanced status quo utilising a combined authority for Solent would be an attractive outcome and
would provide a strong foundation for joint working and accountability to improve the design and
delivery of services for residents
If any future unitary configuration is desired, the 3 unitary authority options appears to have the most
strengths and least weaknesses.
On devolution, the Heart of Hampshire authorities support the ambition of the Solent combined authority. It is
clear that all of the councils would be stronger working together on a local consensus to secure devolved
powers, control and resources from national to local bodies, while respecting the differences within Hampshire
and the Isle of Wight. Any solution will require local consensus and it is clear relationships need to be
strengthened to enable a focus on better serving residents and businesses. All parties agree the status quo needs
to change.
Private and Confidential 2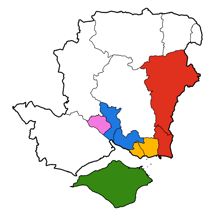
Devolution and the future of local government in the Solent Final
The case for change
The Solent area currently has three unitary authorities within its geography; Isle of Wight Council,
Southampton City Council and Portsmouth City Council. The remainder of the districts in the geography
operate in a two tier1 structure with the districts responsible for a number of services, and Hampshire County
Council responsible for a select few services across the county.
The district and county system of local government across the UK has inherent tensions that have been
exacerbated by increasing financial challenges in recent years. Whilst neither tier of council has any jurisdiction
over the other, conflicting priorities regarding the funding of services and the needs of local people have created
dis-alignment and inefficiencies between service design, decision making and delivery. As a result of this
disconnect, nationally nearly half of the original two tier areas have been replaced in successive rounds of
reorganisation during the 1990s and in 2009. Locally, there are several additional drivers for change to the
status quo in Hampshire, including:
Recognition that future funding of local government will be increasingly dependent on economic
performance, with a greater emphasis on enabling economic growth.
Underlying pressure for local government to continue to find efficiency savings including through
creating greater economies of scale and an expectation to redesign and prioritise services to address local
need.
Differential priorities requiring ways of working that achieve benefits of scale but respect local
requirements around individuals, communities and districts within Hampshire and the Isle of Wight.
The need to enhance democratic accountability in order to take up the opportunity to secure a devolution
deal for the residents and businesses within the Solent.
It is recognised by the Solent authorities that there are several options on the spectrum between the status quo
and complete local government reorganisation into unitary authorities. These options can be designed to
optimise the drivers as far as possible, but they vary on the complexity, time and cost continuum.
Preferred route is a combined authority with an ‘enhanced’ or recalibrated relationship
between county and districts
For many of the Solent authorities, reorganisation is considered a distraction from the immediate goal of
starting to secure devolved powers and resources. There is agreement that the current unitary, district and
county status in Hampshire is legitimate but equally that there is a desire to ‘recalibrate’ the relationship
between the districts and Hampshire County Council.
The exact nature of this recalibration needs to be defined in due course, with all parties around the table, but
there is general consensus that it could involve further investigation of the following principles. The first two
principles are particularly relevant to the county/district relationship, whereas the latter points are relevant to
both two tier and unitary.
Readdress how some services are allocated between county and district where synergies and rationale for
coordination exists, e.g. pot holes, highways and street cleaning
Enable greater influence over decisions made by the County Council so that decisions better reflect the
needs of communities
Allow different levels of service depending on need and where residents wish to pay more
Build services to become more citizen-centric, and restructure services to fit around the person
Practice and encourage mutual trust, respect, understanding and open communication across different
delivery partners to best enhance outcomes for the customer
Solent authorities believe strongly that any recalibration of working between districts and the county should not
only focus on service delivery but also on cultural change, behavioural change and ultimately on relationships.
It is also important to consider that several Solent districts contain a third tier of local government in the form
1 It
should be noted that in some cases, there are three tiers of Government with parishes and town councils being the third tier. However,
for the purposes of this report, we have assumed two tier incorporates these.
Private and Confidential 3Devolution and the future of local government in the Solent Final
of parish and town councils so the relationship (and these principles) have the potential to go beyond two tier,
to three tiers.
The future relationships should be built around an ability to enable decision making to be as close to local
communities as possible and to recognise that different areas need different solutions. It should also be flexible
enough to provide for more effective outcomes as a result of designing services around citizens and planning
and managing delivery at the appropriate scale as part of an integrated approach.
However, the Solent authorities recognise that such options for an enhanced status quo arrangement would
only work with the establishment of a combined authority where parties co-operate fully on the basis of trust
and respect, and can hold each other to account. Crucially, it would also provide an impetus for change.
Combined authorities
Combined authorities are being established as the vehicle from which to develop and implement a whole
systems strategic approach collaboratively, to take on devolved powers and funding, and be the mechanism for
effective strategic decision making, streamlined accountability and joined up services.
As noted above and explored as part of a separate report, the neighbouring Heart of Hampshire authorities are
also pursuing the notion of an enhanced status quo as a precursor to a combined authority and devolution deal
for their geography.
Local government re-organisation – alternative options
Despite the recognition of the strengths of the District and County structure in Hampshire, it is acknowledged
that underlying tensions between the authorities are likely to remain, especially in the context of declining
funding over the next decade. Where those conditions deteriorate the ability to deliver effective joint working
can rapidly diminish to the detriment of all parties. Following the public consultation regarding local
government re-organisation by Hampshire County Council, it is right for the Solent to consider alternatives.
Two different unitary authority options are considered in this report, along with the status quo:
Table 1 Unitary Authority options
Option Overview
1 Three unitary This option would include three unitary authorities for the Solent area.
authorities
Greater Portsmouth (comprising Portsmouth City Council, East Hampshire District
Council, Fareham Borough Council, Gosport Borough Council and Havant Borough
Council) with a combined geographical area of 759 km².
Greater Southampton (comprising Southampton City Council and Eastleigh Borough
Council with a geographical area of 142 km²)
Isle of Wight (comprising the existing Isle of Wight unitary with a geographical area of
395 km²)
2 Five unitary This option would include five unitary authorities for the Solent area.
authorities
Gosport & Portsmouth (comprises Gosport Borough Council and Portsmouth City
Council with a geographical area of 88 km²)
Southampton (comprises existing Southampton City Council unitary with a
geographical area of 56 km²)
Isle of Wight (comprises existing Isle of Wight Council unitary with a geographical area
of 395 km²)
East Hampshire & Havant (comprises East Hampshire District Council and Havant
Borough Council with a geographical area of 594 km²)
Eastleigh & Fareham (comprises Eastleigh Borough Council and Fareham Borough
Council with a geographical area of 163 km²)
Assessment methodology for assessing re-organisation options
The report assesses potential options for local government re-organisation against a set of four quantitative and
qualitative criteria as agreed with the Department for Communities and Local Government (DCLG), being:
Private and Confidential 4Devolution and the future of local government in the Solent Final Providing value for money (quantitative) Delivering positive outcomes in terms of the cost of the transition (quantitative) Ensuring strong and accountable local leadership and governance (qualitative) Delivering better public services (qualitative) Within this study we have defined local government reorganisation to include changes to local authority organisational status such as moving towards a unitary authority configuration. By local government reform we refer to fundamentally changing the way things are done, such as through service redesign. Reform also includes changes to boundaries which are assumed outside the scope of this report. There has also been an expressed desire from the Solent authorities for the range of criteria applying to local government review to be extended to include the suitability any changes to local authority organisational boundaries in enabling economic growth and prosperity in the area, in a similar manner than occurs when the suitability for a Combined Authority is evaluated. This would involve assessing options against a ‘5th test’ which would encompass the ability of an area, singularly and collectively, to fulfil its economic potential. We have considered this within our analysis and include narrative on the economic functionality throughout this report A short summary of the economic issues relating to unitarisation is included in section 5 (within the discussion on ‘appropriate scale’). Proving value for money and cost of the transition In order to evaluate the value for money case for each of the unitary authority options, we undertook analysis against the two quantitative tests outlined above. This included an assessment of the financial status quo of the authorities that make up the Solent, including Hampshire County Council, as well as recalculated income and expenditure accounts and the council tax harmonisation process for each unitary authority option. There is significant disparity between the existing authorities with regards to current income and expenditure and financial positions. This is the case for the three existing unitaries and the districts. The scale at which Hampshire County Council operates and their associated expenditure far exceeds the activity of the district councils. Education, Adult Social Care and Children’s Social Care account for the majority of spend (84%) incurred by Hampshire County Council. However, Hampshire County Council has limited influence over the way in which schools spend the funding they receive. Social care expenditure is particularly vulnerable to demographic shifts and the imposition of financial constraints, which create considerable pressures for the continued future successful delivery of these respective services. Using the 2016/17 General Fund Revenue Account data, a baseline income and expenditure budget has been calculated for each unitary option under consideration with Hampshire County Council income and expenditure apportioned to each district council where necessary using a series of ‘disaggregation factors’. We have not conducted any disaggregation for the three current unitary authorities (since they already provide all services independently). The income and expenditure accounts and the net surplus/deficit positions that have been calculated for each unitary authority option provide an indication of each authority’s ability to assume and provide existing county services. Our financial analysis has been presented for the baseline year (2016/17) and for 2021/22 both before and after the savings and efficiencies association with re-organisation are taken into account. The results are displayed in Table 2. The analysis conducted is at a high level, and if any of the options are to be taken forward, then further analysis would need to undertaken including the disaggregation of RSG and Business Rates and the level transformation savings. A more detailed disaggregation of RSG and Business Rates would result in some rebalancing effect of reducing deficits for relatively deprived areas and reducing surpluses in relatively more prosperous areas. See Appendix A.4 for further details. Private and Confidential 5
Devolution and the future of local government in the Solent                                                             Final

Table 2 Financial analysis per option

                                   Surplus/            Surplus/       Surplus/                   Surplus/          Surplus/
                                    (deficit)           (deficit)      (deficit)                  (deficit)         (deficit)
                                    2016/17             2021/22 2020/21 as % of                   2021/22       2021/22 post
                                    (£’000)             (£’000)       total net                 assuming                  re-
                                                                        current             funding gap is     organisation*
                                                                   expenditure                      closed          (£’000)
                                                                                                  (£’000)

Three UA Option

Greater Portsmouth                   (27,881)              (56,901)            (6.03%)             (27,745)            8,220

Greater Southampton                      4,677             (23,904)            (3.79%)               4,580            22,250

Isle of Wight                                -             (22,377)            (8.07%)                   --            8,358

Five UA Option

Gosport and Portsmouth               (14,443)              (43,864)            (9.63%)             (14,708)             2,729

Southampton                                  -             (28,484)            (6.12%)                   --            10,873

Isle of Wight                                -             (22,377)            (8.07%)                   --            8,358

East Hampshire and                   (16,333)              (15,325)            (4.38%)             (15,325)           (6,572)
Havant
Eastleigh and Fareham                    7,563                6,868             2.26%               66,868            18,834

It should be noted that there would be an element of rebalancing, if the disaggregation of RSG and Retained
Business Rates were refined further. See Appendix A.4 for further details.
In tandem with organisational change there is the potential opportunity for transformational change. The costs
of re-organisation and potential transformation savings are shown in Table 3 below. Transition costs include
employee severance costs and costs associated with project and change management, business management
and ICT integration. Transformation savings relate to reduction in staffing costs, democratic costs and office
space rationalisation.
Table 3 Reorganisation and transformation savings

                               Year 1            Year 2           Year 3           Year 4            Year 5           Total
                                 £m                £m               £m                £m               £m              £m
Three Unitary Option

Total costs                     (15.2)            (15.2)              (15.2)             0.6             0.6         (44.2)

Total savings                     21.3             41.3                61.4              61.4           61.4         246.7

Total net savings                  6.1            26.2                46.2           62.0              62.0          202.4

Five Unitary Option

Total costs                     (15.4)            (15.4)              (15.4)             0.4             0.4         (45.5)

Total savings                     19.5             38.2                57.0          57.0               57.0         228.7

Total net savings                  4.1            22.8                 41.6          57.4              57.4           183.3

Combining district authorities into unitary authorities will require the convergence of council tax rates. We
have adopted the approach that the lowest rate inherited within the configuration should be increased at the
highest annual percentage increase available for a unitary authority and that all other rates should be increased

Private and Confidential                                                                                                      6
Devolution and the future of local government in the Solent Final
by the required percentages so that council tax rates are identical at the end of a specific convergence period.
Table 4 below presents the year five financial position of each unitary authority once the effects of re-
organisation and council tax harmonisation have been considered.
Our council tax analysis indicates that there will be a degree of mismatch between the proposed unitary
authorities with regards the level to which they will be able to raise council tax income. In the 3UA option,
Greater Portsmouth would be able to generate additional income, but Greater Southampton would not. Isle of
Wight position would remain as current. In the 5 unitary authority option, all new unitary authorities would be
able to generate additional income, apart from Gosport and Portsmouth which would generate additional costs.
This is presented in more detail in section 3 of the main report.
Table 4 Surplus/deficits of options pre and post Reorganisation and transformation
Surplus/deficit Surplus/deficit Surplus/deficit Surplus/deficit
2021/22 2021/22 2021/22 post re- 2021/22 post re-
(£’000) assuming funding organisation organisation and
gap is closed (£’000)* CT
(£’000) harmonisation
(£’000)*
Three UA option
Greater Portsmouth (56,901) (27,745) 8,220 9,861
Greater Southampton (23,904) 4,580 22,250 20,989
Isle of Wight (22,377) - 8,358 8,358
Five UA option
Gosport & Portsmouth (43,864) (14,708) 2,729 2,651
Southampton (28,484) - 10,873 10,873
Isle of Wight (22,377) - 8,358 8,358
East Hampshire and Havant (15,325) (15,325) (6,572) (5,086)
Eastleigh and Fareham 6,868 6,868 18,834 19,877
Table 5 Summary of Value for money assessment
Summary of Value for Money assessment
Status Quo No upfront costs needed for reorganisation and transformation.
Unsustainable from a budget perspective for the majority of councils. Something needs to
change.
No net savings achievable through reorganisation and transformation.
3 UA Generates most favourable baseline budget surplus/deficit positions overall.
Achieves greatest savings from reorganisation and transformation (both cumulatively and in
annual terms).
Assuming projected funding gaps are closed, Greater Portsmouth, Greater Southampton and Isle
of Wight generate financial surpluses once the effects of reorganisation and council tax
harmonisation are taken into account.
5 UA Provides most favourable council tax impact (in terms of potential to generate additional council
tax income).).
All unitaries, barring East Hampshire and Havant, expected to generate a financial surplus in
2021/22 once the effects of reorganisation and council tax harmonisation are taken into account.
Generates least favourable baseline (2016/17) budget surplus/deficit position.
Disparity between the proposed authorities.
Private and Confidential 7Devolution and the future of local government in the Solent Final
Ensuring strong and accountable local leadership and governance
The second set of criteria for examining the unitary authority options focuses on their ability to ensure strong
and accountable local leadership and governance.
One of the challenges of the Hampshire County Council/district local government arrangement is the multiple
points of accountability, which can result in residents, businesses, public sector partners and sometimes even
staff being unsure which authority is responsible for a particular issue. Under unitary authority arrangements,
the local authority is responsible and accountable for all of the local government services that are provided in
that community.
Furthermore, unitary authorities are best placed to achieve a role as a ‘place leader’ by being clear about their
ambitions for the residents they serve, building consensus with partners and the public and distributing their
power. A unitary authority would have oversight of the local authority services provided to residents and would
reduce the number of public sector organisation trying to work together in partnership to deliver shared aims.
This is of course already an operational arrangement in existence within the Solent areas. In terms of the
analysis, both proposed unitary authority options therefore have an advantage over the status quo in clarifying
accountability, given that the total geography would then be covered by unitary authorities (and not just the
three existing ones).
However, a new unitary authority must not be too large that it is unresponsive or unrepresentative to the needs
of the communities it services (which is one criticism widely made about some County Councils and one of the
reasons why DCLG informally advise an optimum population size of 300,000 to 700,000).
The number of Members across the Solent area and Electorate per Member statistics would vary depending on
the number of unitary authorities. Democratic representation will be influenced by the Boundary Commission’s
review and without pre-determining the outcome of a review, it is difficult to find a differentiator between the
options on democratic representation by ward or electorate. There are examples from other recently established
unitary authorities of enhanced representation of local communities through Area Boards as an example, as
well as enhancing the role of town and parish councils.
A summary of the strengths and weaknesses of each of the Solent unitary authority options is summarised in
the table below.
Table 6 Summary of Local Leadership assessment
Summary of Local Leadership assessment
Status Quo 354 members
Single point of accountability already offered by the three existing unitary authorities
No single point of accountability in the districts currently
3 UA 286 (estimated) members
Single point of accountability could be improved via creation of unitary authorities across whole
Solent areas
Ratio of population to senior unitary authority cabinet member would be lower than the 5 unitary
authority option which may be a challenge for representativeness
May be greatest need for Area Boards, Community Networks and Parish, Town, Community
councils to improve representativeness
5 UA 286 (estimated) members
Single point of accountability could be improved via creation of unitary authorities across whole
Solent areas
Greater potential for representativeness than the 3unitary authority option
Delivering better public services
Local government in the Solent has been successful in finding efficiencies and adapting to a new reality of lower
central government funding. However, further efficiencies are needed. Another major driver for change in the
Solent is to achieve a devolution deal which facilitates improved productivity and a realisation of the potential
Private and Confidential 8Devolution and the future of local government in the Solent Final
economic growth, while protecting the competitive advantages that come from its natural environment and
attractive communities.
There are also opportunities to address the multiple points of accountability, dispersed customer insight and
duplicated support costs associated with district and county structures which could lead to more effective and
efficient delivery of services across the area.
Our assessment of whether options would deliver against the better public services criteria is centred around six
sub-criteria, based on our work about the future role of public bodies. The sub-criteria we have used and their
rationale are presented below, as well as a summary of our results.
Table 7 Delivery of better public services
Sub-Criteria Rationale
Scale DCLG have informally suggested that they would expect any reorganisation to result in authorities
with an optimum population size in the range of 300,000 to 700,000.
This is not a hard test but any proposal outside of this range would need to have a strong rationale.
Citizen centricity There is no single citizen. What they want will depend on their specific requirements at specific
times, both of which will change over time.
We have made a judgement on how well the options will be able to provide local leadership,
both for services and activities that are under direct control and those activities beyond their
control.
Unlike previous local government reorganisations, the current opportunity is being stimulated
by devolution. There is a real opportunity to design and create local services around the specific
needs of different communities.
Connected There is a clear benefit from a clear framework of accountability and responsibility for public services.
government
But local government is only part of the complex ecosystem of public service commissioners and
delivery bodies.
Co-terminosity with other public authorities is recognised as important but our assessment
recognises integrated public services are much more complex than is often portrayed.
This suggests a need to consider integration at a variety of scales depending on whether
alignment is for strategic outcomes, operational delivery or human scale impact.
Empowered A clear ‘offer’ to Government that the alignment should be supported by devolution of powers
authorities and resources that would empower authorities to deliver.
Our criteria assume that proposals that use new mechanisms to enable devolution deals to be
agreed would be better placed. The establishment of a Combined Authority and the agreement of
a deal would provide the platform for greater collaboration, public service reform and the
authority and framework to make it happen.
Deliver the A reorganisation of local government would need to demonstrate it could deliver public services
promise better.
Our criteria consider both the potential ability to manage transition to new corporate structures
and the ability to transform delivery of public services as distinct.
To be successful the options will need to demonstrate strong programme and change
management capability.
Continuously Any authority should be capable of establishing an innovative culture and striving for continuous
improve and improvement. Our criteria considers the likelihood that each option would take bold and
innovate imaginative steps to innovate and improve public services.
It is important to note that we have contrasted the two unitary options against the status quo,
but have not included in this assessment the potential of enhancing the status quo through
changes to working practices or behaviours that might be achievable without reorganisation,
nor have we included comparison with a combined authority (which could happen alongside
reorganisation).
Private and Confidential 9Devolution and the future of local government in the Solent Final
Table 8 Summary results of better public services delivery
Summary of Better Public Services assessment
Status Quo Current arrangement of shared services and functions is well developed and could be enhanced
This option performs worst of the three options overall on the ‘better public services’ sub-criteria
3 UA Strongest option overall against the sub-criteria
Closest alignment with DCLG thresholds on population ranges within UAs (exc. IOW which
remains on its own in all options and which is far lower even accounting for population growth by
2032).
Strongest performer on the criteria of ‘citizen centricity’, ‘empowered to deliver’ and ‘delivering the
promise’ sub-criteria.
5 UA Strongest performer on the criteria of ‘connected government’ and ‘continuously innovate’
Medium performance on the sub-criteria
Key conclusions
The analysis per option within this report supports the following conclusions:
Business as usual does not look sustainable from a financial viewpoint for the majority of councils.
Neither does it improve dramatically under reconfigured unitary authorities with disaggregation of
county spend and budget projections to 2020/21. This exacerbates the case for change. 2
When one adds the benefits from reorganisation and transformation the budgets are hugely improved,
however some configurations still display deficits.
Status quo without a recalibration of district and Hampshire County Council relationships is undesirable
and will not achieve Solent authorities’ aspirations and ambitions surrounding greater support of
business and citizens. Current challenges around dispersed and disconnected services will be expected to
prevail unless there are other drivers to change.
However, an enhanced status quo utilising a combined authority for Solent would be an attractive
outcome in the immediate term. This is because it would allow the authorities to seek devolved
responsibilities for local government without the delays, cost and instability associated with large scale
reorganisation. A Solent combined authority would also provide a strong foundation for joint working
and accountability to improve the design and delivery of services for residents.
Of the unitary authority options, the 3 unitary authority option appears to have the most strengths and
least weaknesses, and might provide the basis for any future unitary configuration if desired.
2 If
any option is to be taken forward, then further analysis would be required including the reallocation of RSG, Retained Business Rates
and the level of transformation savings, all of which will impact the overall financial position.
Private and Confidential 10Devolution and the future of local government in the Solent Final
1. Introduction
1.1. Purpose of this report
The five district councils in the Solent (East Hampshire District Council, Eastleigh Borough Council, Fareham
Borough Council, Gosport Borough Council and Havant Borough Council) and the 3 unitary authorities (Isle of
Wight Council, Portsmouth City Council and Southampton City Council) have commissioned PwC to provide
independent advice and appraisal in relation to the options available for the most effective and efficient form of
local government in the context of opportunities for devolution, combined authorities and unitarisation.
This report provides an evidence-based assessment of different local government reorganisation options with
an aim to identify which option achieves the right balance of saving money whilst improving services.
The assessment criteria for options concern the delivery of better public services, stronger and more
accountable local leadership and the provision of value for money. The report also provides a comprehensive
assessment of the status quo against these criteria.
In the short term, this is needed to support the Solent authorities as they reflect on their devolution proposals
to Government following the collapse of the Hampshire and Isle of Wight devolution deal in February 2016.
Following the collapse the authorities involved in Hampshire and Isle of Wight have fragmented into three
parties:
Hampshire County Council which has developed and consulted on its own options for unitary solutions;
Solent authorities who are primarily focussed on securing a Solent combined authority as the first step on
their devolution journey; and
Heart of Hampshire3 authorities who want to ensure their residents and businesses have the same
opportunity to benefit from devolution.
This report provides a robust consideration of options for change within the Solent to support them on their
journey to devolution.
The sub-sections that follow outline the socioeconomic characteristics of the Solent area that are relevant to
reorganisation. We then give a description of the local government baseline (from which to assess options), and
gives a brief overview of the recent evolution of local government in the area to set the context and outline the
devolution aspirations.
1.2. Hampshire and the Isle of Wight
Hampshire and the Isle of Wight are traditional ceremonial
counties, covering 4168 km sq 4 (1609.5 square miles) and
bordering Dorset and Wiltshire to the West, Berkshire to the
North and Surrey and West Sussex to the East. In the South
sit the cities of Southampton and Portsmouth with the
Solent separating the mainland from the Isle of Wight,
which is the largest island in England.
Population overview
The total population of Hampshire and the Isle of Wight is
approaching nearly two million, predominately based within
urban areas, of which five major urban areas; being
3The ‘Heart of Hampshire’ authorities are the six districts of Basingstoke & Deane Borough Council, Hart District Council, New Forest
District Council, Rushmoor Borough Council, Test Valley Borough Council and Winchester City Council.
4 Area of 416,879 hectares or 1609.5 square miles https://www.iwight.com/azservices/documents/2552-Isle-of-Wight-Demographic-and-
Population-2014-15-Final.pdf, http://www3.hants.gov.uk/abouthnt.html, https://www.portsmouth.gov.uk/ext/the-council/policies-and-
strategies/city-of-portsmouth-geographical-area.aspx, http://www3.hants.gov.uk/planning/factsandfigures/key-facts/kf-
southampton.htm
Private and Confidential 11Devolution and the future of local government in the Solent Final
Portsmouth, Southampton, Basingstoke, Farnborough and Aldershot make up 82% of the total urban
population5.
Populations of the individual authorities, to the nearest hundred range from 84,700 in Gosport to 249,5006 in
Southampton, with an average of 139,600 per local authority. Together the built up area of South Hampshire is
the seventh most populous urban area in the UK, larger than Tyneside. However, 85% of Hampshire county
landmass is defined as rural and over a third of the county’s area is within National Parks or Areas of
Outstanding Natural Beauty7.
Socioeconomic overview
The economic coherence of local government is an issue that has come up repeatedly in stakeholder
consultations throughout Hampshire and the Isle of Wight. It is therefore worth discussing the economic
baseline. In 2013 Hampshire County Council reported on the overall competitiveness of the Hampshire
Economic Area in their Hampshire Economic Assessment 8 using the UK Competitiveness Index (UKCI)9. This
assessment includes the Isle of Wight. The UKCI uses economic factors such as GVA per capita, unemployment
rates, productivity and full time weekly median pay in determining the relative national competitiveness of
authorities. This report highlighted that the performance of Hampshire and Isle of Wight is similar when
compared with the rest of the UK on most economic indicators, however there are significant variances.
Gross Value Added: Gross Value Added per head generally declines from the North to South across
the Hampshire and Isle of Wight NUTS 2 (Nomenclature of territorial units for statistics) area. This is
reflected in the most recent Gross Value Added per head figures in 2014, where North and Central
Hampshire are 121.7 and 112.7 against a UK base of 100, and Portsmouth, Southampton, South
Hampshire, and the Isle of Wight are 104.5, 95.8, 93.7 and 70.2 respectively 10. The South East average is
109.7.
Employment: Unemployment rates are highest in the South Hampshire and Isle of Wight areas of
Portsmouth, Southampton, Isle of Wight and Havant with more than 5% unemployed. 11 Unemployment
rates are lowest in Winchester, Test Valley and Hart with less than 3% unemployed. The North and South
Hampshire divide is also reflected in the residential gross weekly median pay, where Isle of Wight has
median weekly pay of £479 against the highest reported in Hart of £708 (average of £563 for Hampshire
and Isle of Wight)12
Education: Educational attainment indicators within the UK Competitiveness Index, show Gosport,
Portsmouth and Southampton having less than 86% with NVQ (National Vocational Qualifications) 1 and
above. This is lower than the 94% and above reported in Test Valley, Hart and Fareham. The average for
the UK is 84.9%.
Health: Hampshire and the Isle of Wight is one of 44 geographical footprints in England which are
currently developing a Sustainability and Transformation Plan (STP) to identify priorities needed to
achieve sustainable NHS services as part of the Five Year Forward View. The aim of the plan is to enable
local health and social care partners to work at scale where this is appropriate to realise solutions that
can transform the health and well-being of their populations13. For the Hampshire and the Isle of Wight
STP this means closing an expected gap of £540m - £610m by 2020/21 – a shortfall of £305 per person.
While the plan is still in development there is recognition of ‘unwarranted variation across Hampshire
and the Isle of Wight’. Male healthy life expectancy varies from 61.6 years in Southampton, 62.3 years in
Portsmouth, 64.3 years in Isle of Wight to 67.4 years in Hampshire, against a regional average of 65.9
years. Female healthy life expectancy varies from 62.9 years in Isle of Wight, 63.0 years in Portsmouth,
63.7 years in Southampton, to 67.3 years in Hampshire, against a regional average of 66.6 years. Across
health outcomes there is significant variation within the area reflecting the different pressures and
priorities in different parts of Hampshire and the Isle of Wight.
5 http://www3.hants.gov.uk/spatial_synthesis.pdf
6 Office for National Statistics – Population Estimates for UK, England and Wales, Scotland and Northern Ireland – Mid 2015
7 http://www3.hants.gov.uk/factsandfigures/keyfactsandfigures/factsabouthampshire.htm
8 An update of the economic areas for the Hampshire Economic Area and its functional geography, Hampshire County Council, June 2013.
9 http://documents.hants.gov.uk/Economy/Theme1OverallCompetitiveness.pdf
10 https://www.ons.gov.uk/economy/grossvalueaddedgva/datasets/regionalgrossvalueaddedincomeapproach
11 www.nomis.co.uk
12 www.nomis.co.uk
13 Thereis no intention or suggestion that the STP footprints have any relevance to appropriate boundaries for local government reform.
Indeed, the key drivers for their boundaries relate to the health economies of the major hospitals many of which are cross county
boundaries.
Private and Confidential 12Devolution and the future of local government in the Solent Final
In summary, it is clear that Hampshire and Isle of Wight is a very large, diverse area and economy, with a
population with variations in demographics and health, educational attainment and employment.
More detail on both population and socioeconomic characteristics is considered in greater detail in section 1.3
and 1.4 below.
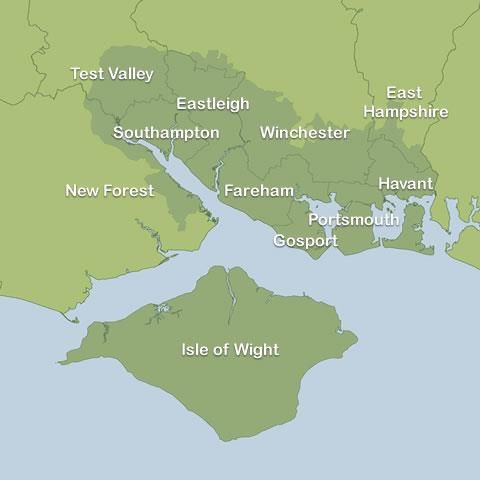
1.3. Solent authorities
The Solent, representing the district councils of East Hampshire District Council, Eastleigh Borough Council,
Fareham Borough Council, Gosport Borough Council and Havant Borough Council and three unitary
authorities (Isle of Wight Council, Portsmouth City Council and Southampton City Council) covers an area of
1,218 km sq (470 miles sq) and has a population of 1,170,19214, representing approximately 60% of the total
Hampshire and Isle of Wight population.
Map 1 Solent Authorities
Detailed population analysis
As can be seen in Graph 1 below, there is a large population variation between the district authorities and
unitary authorities currently within the Solent area, although (to note) none of the districts individually is
currently above the indicative minimum size for a unitary authority currently suggested by Department for
Communities and Local Government (DCLG) of 300,000 residents15.
Southampton, with a 2015 population of 249,500, is the largest of the eight authorities; three times the size of
the smallest district, Gosport which has a population of 84,700. Population densities vary hugely over the
Solent area, but Portsmouth City is the most densely populated city in the UK outside of London 16. Eastleigh is
projected to experience the largest population growth (in percentage terms) over the period to 2032, during
which its population is projected to increase by 14% from 129,000 to 150,100. Gosport is projected to
experience the smallest growth over the same period with its population increasing by 5%. Projected population
data for 2032 is shown for illustrative purposes and is based on past trends. The net financial impact of these
population changes have not been analysed as part of this report 17.
14 Office for National Statistics – Population Estimates for UK, England and Wales, Scotland and Northern Ireland – Mid 2015.
15 DCLG has previously indicated informally to other authorities that a new unitary authority should preferably be within 300,000 to 700,ooo residents
http://www.neighbourhood.statistics.gov.uk/HTMLDocs/dvc134_c/index.html
16
17 This
is because there are no long-term (past 2021) budget projections for the local authorities in Solent, and this, coupled with an
unknown future of the local government finance system means that any modelling would be of limited value as it would be reliant on too
many overlaid assumptions.
Private and Confidential 13Devolution and the future of local government in the Solent Final
Graph 1 Population within 2015 and projections of population by 2032 (based on past trends)
Total Population 2015 & Total Population 2032
East Hampshire DC 118,077 128,800
Eastleigh BC 129,027 150,100
Fareham BC 114,799 126,800
Gosport BC 84,672 89,400
Havant BC 122,927 132,100
Isle of Wight Unitary 139,395 150,700
Portsmouth Unitary 211,758 233,700
Southampton Unitary 249,537 278,200
- 40,000 80,000 120,000 160,000 200,000 240,000 280,000
In terms of population composition (shown in Graph 2 below) the Isle of Wight has the lowest proportion of
working age adults (18-64) with 55% and the highest proportion of individuals 65 and over (27%). In contrast,
those 65 and over account for only 13% of Southampton’s population, whilst its working age population is the
largest, in percentage terms of the six districts, making up 67% of its total population.
Graph 2 Population composition in 2015
Population Composition - 2015
East Hampshire DC 24,464 67,369 26,244
Eastleigh BC 27,658 77,363 24,006
Fareham BC 22,169 66,624 26,006
Gosport BC 17,990 50,401 16,281
Havant BC 24,699 69,965 28,263
Isle of Wight Unitary 25,314 77,034 37,047
Portsmouth Unitary 43,766 138,307 29,685
Southampton Unitary 49,152 167,437 32,948
0% 10% 20% 30% 40% 50% 60% 70% 80% 90% 100%
Population U18 Population 18-64 Population 65+
1.4. Local Economies
Whilst the Solent area has a fairly mixed economy, it’s coastal location and clustering of education and business
puts it at the heart of the UK marine and maritime economy. Solent also has a number of key economic assets
with three universities, two ports and an airport. There is relatively good international connectivity with trading
partners through the major ports located in Southampton and Portsmouth and an international airport in
Eastleigh. The two ports complement each other, with Southampton focusing on containers and cruise ships,
and Portsmouth focusing on passenger and goods traffic. Within Solent there are also 3 major universities:
Southampton Solent University, University of Southampton and University of Portsmouth. Southampton and
Portsmouth are both Key Cities in the UK 18, playing a significant role in the UK’s regional economy.
Across Hampshire & the Isle of Wight there are two Local Enterprise Partnerships (LEPs) – Solent and
Enterprise M3 - both with the same ambition of fostering growth, but with different emphases reflecting the
diversity of the areas they seek to support.
Solent LEP includes all of the Solent authorities, although only part of East Hampshire, plus parts of New
Forest District Council, Test Valley Borough Council and Winchester City Council.
18 Key Cities Group
Private and Confidential 14Devolution and the future of local government in the Solent Final
Enterprise M3 includes seven of the Hampshire districts – all of the Heart of Hampshire plus the
remaining area of East Hampshire District Council in addition to seven further authorities within
Berkshire and Surrey.
In terms of competitiveness and the UKCI indicator outlined above, Enterprise M3 LEP performs in the top
20% nationally, while the Solent LEP has two of the least competitive districts in the UK (Gosport and Isle of
Wight are in the lowest 20% nationally) 19.
Travel to Work Areas
Economic flows often overlap local authority boundaries which means that the ‘functional economic market
areas’ (FEMAs) will not necessarily adhere to administrative boundaries. The most widely accepted approach to
identifying FEMAs is by reference to Travel to Work Areas (TTWAs). TTWAs are defined to approximate self-
contained local labour market areas, where the majority of an area’s resident workforce work (usually 75%), and
where the majority of the workforce live, with the prime areas in Hampshire and the Isle of Wight being
Andover, Basingstoke, Southampton, Portsmouth and the Isle of Wight. They have been declining in number
over time from 304 in 1981 to 228 in 201120 as commuting distances increase. In PwC’s recent Good Growth for
Cities 2015 index21, Southampton and Portsmouth were rated as 5th and 11th respectively, out of 42 UK city
travel to work areas analysed, and have been rising through the ranks since 2011.
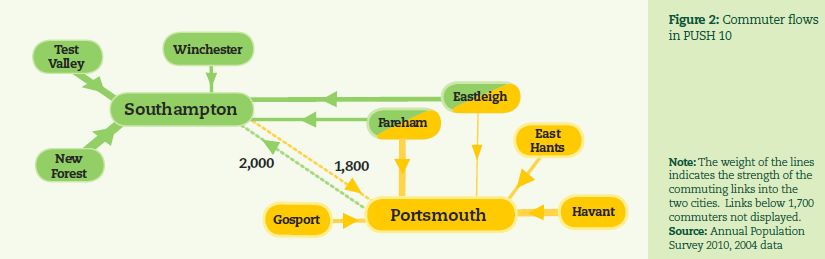
Figure 1 below shows the commuter flows within Hampshire and the Isle of Wight, with the thickness of the
arrows representing the volume of traffic. In South Hampshire, commuter flows to Southampton are primarily
from the following districts22; Eastleigh, Fareham, Test Valley, Winchester and New Forest. Commuter flows to
Portsmouth are primarily from Eastleigh, Fareham, Gosport, East Hampshire and Havant. Both Eastleigh and
Fareham share similarities in that they both have residents whom commute to both Southampton and
Portsmouth. Heart of Hampshire districts of Test Valley, Winchester and New Forest have strong economic ties
to Southampton23.
Figure 1 Commuter flows within Hampshire and the Isle of Wight
Source: http://www.push.gov.uk/10-03-12_push_charting_the_course.pdf
Northern Hampshire districts within Enterprise M3 LEP share a TTWA and FEMAs with non-Hampshire
districts in Enterprise M3 and perform higher in the UK Competitiveness Index (UKCI) than south Hampshire.
The reason for this is largely due to the geographical proximity of these areas to the urban areas in Berkshire
and Surrey where economic performance is greater than Hampshire.
Table 9 Travel to Work Areas (2011)
19 http://documents.hants.gov.uk/Economy/Theme1OverallCompetitiveness.pdf
20 https://census.edina.ac.uk/easy_download_data.html?data=England_ttwa_1981
http://www.ons.gov.uk/employmentandlabourmarket/peopleinwork/employmentandemployeetypes/articles/commutingtoworkchangesto
traveltoworkareas/2001to2011
21 http://www.pwc.co.uk/industries/government-public-sector/good-growth.html
22 http://www.push.gov.uk/10-03-12_push_charting_the_course.pdf
23 Note this commuting data is a little out-dated but is indicative of commuter flows.
Private and Confidential 15Devolution and the future of local government in the Solent Final
TTWA % of employed residents % of local jobs Number of
who work locally taken by local economically active
residents residents (aged 16+)
Andover 67.4 70.5 44,548
Basingstoke 66.7 66.7 133,662
Guildford & Aldershot 70.4 72.5 347,333
Isle of Wight 92.3 96.3 64,665
Portsmouth 80.9 85.0 281,594
Southampton 83.5 82.5 353,704
As shown in
Table 9 above, the TTWAs in the Solent are focused around the 2 cities of Southampton and Portsmouth, and
the island economy of the Isle of Wight. Isle of Wight has 92% of its residents employed locally and 96% of local
jobs are taken by local residents. Transport challenges with connections to the mainland are frequently cited as
an issue for the Isle of Wight economy. The island has an above average public sector presence and has seen a
value shift towards non-traditional sectors of retail, personal services, transport and communications.24 The
Solent Strategic Economic Plan (SEP) emphasises the already difficult economic conditions that prevail on the
Isle of Wight, and notes that growth will be inhibited if links between the mainland and the island are not
improved.
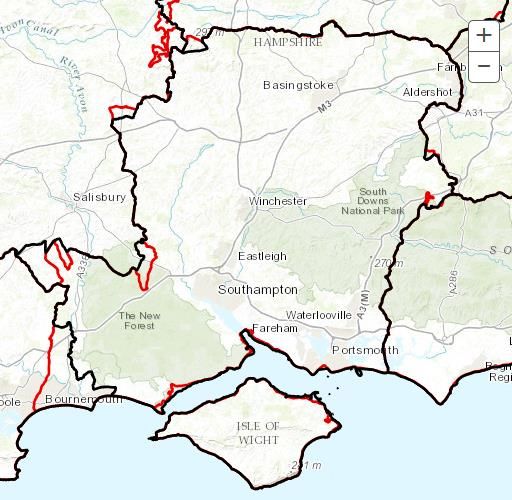
Partnership for Urban South Hampshire (PUSH), formed in 2003 following recognition of local leaders that
South Hampshire was underperforming the rest of the South East in economic terms. It is an economic
partnership in consisting of Hampshire County Council, the 3 unitary authorities, and the following districts;
Eastleigh, East Hampshire, Fareham, Gosport, Havant, New Forest, Test Valley and Winchester. It was formed
to improve the economic performance of the PUSH area and to facilitate the creation of additional homes and
jobs for the residents. It is a partnership that cuts across local authority and LEP boundaries and demonstrates
the potential for public bodies to work effectively together on common goals. From an informal meeting of
leaders it has grown in membership into a formally constituted body distributing Government money.
Map 2 Partnership for Urban South Hampshire (PUSH)
Source: http://www.push.gov.uk/partnership.htm
24 https://www.iwight.com/azservices/documents/2552-demographics-economy-february-2012-final-version-v-5.1.pdf
Private and Confidential 16You can also read