Budget Highlights - FY 2021-22 Proposed Budget - City of Chandler
←
→
Page content transcription
If your browser does not render page correctly, please read the page content below
City of Chandler

 Budget
Highlights

   FY 2021-22
Proposed Budget
Budget Highlights

                                                                                     Table of Contents

Calendar Highlights of the Budget and CIP Process ..................................................................................... 3

Statistical Information .................................................................................................................................... 4

Other Services at a Glance ............................................................................................................................ 11

Proposed Budget Summary ........................................................................................................................... 12
   Operating Budget by Function (All Funds) ............................................................................................................................................ 13

   Capital Budget by Function (All Funds).................................................................................................................................................. 13

   Departmental Comparison Summary ................................................................................................................................................... 14

   Cost Center Comparison ......................................................................................................................................................................... 15

General Fund Revenue Summaries .............................................................................................................. 18

General Fund Expenditure Summaries ........................................................................................................ 19

General Fund Expenditure – by Function..................................................................................................... 20
   Operating Budget .................................................................................................................................................................................... 20

   Capital Budget.......................................................................................................................................................................................... 20

2022-2031 Capital Improvement Program ................................................................................................... 21
   Projected Expenditure and Resource Summary ................................................................................................................................... 21

   Capital Improvement Program Impact on Operating Funds .............................................................................................................. 22

Strategic Goals, Organizational Priorities, and Priority Based Budgeting (PBB) ..................................... 23
   Focus Areas............................................................................................................................................................................................... 24

   Financial Policies ..................................................................................................................................................................................... 25

Budget Recommendations ............................................................................................................................ 45
   FY 2021-22 Recommended Budgetary Additions – General Fund ...................................................................................................... 46

   FY 2021-22 Summary of Budgetary Additions – Other Funds ............................................................................................................ 49

   FY 2021-22 Budgetary Additions Detail – General Fund ..................................................................................................................... 50

   FY 2021-22 Recommended Budgetary Additions Detail – Other Funds ............................................................................................. 57

   FY 2021-22 Action Taken on Requested Decision Packages - General Fund ..................................................................................... 59

   FY 2021-22 Action Taken on Requested Decision Packages - Other Funds ....................................................................................... 62

Personnel Summaries .................................................................................................................................... 63
   FY 2020-21 Position Reclassification Summary ................................................................................................................................... 63

   FY 2020-21 Position Reclassification Summary (continued) ............................................................................................................... 64

   Personnel Changes During Fiscal Year 2020-21 – All Funds ............................................................................................................... 64

   FY 2021-22 Position Additions – All Funds ............................................................................................................................................ 65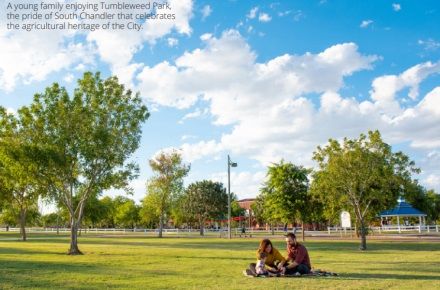
Ongoing and One-Time Personnel Costs and Budgets by Fund ......................................................................................................... 66

Employees per 1,000 of Chandler’s Population ................................................................................................................................... 66

FY 2021-22 Personnel Full Time Equivalent .......................................................................................................................................... 67

FY 2021-22 Personnel Full Time Equivalent (continued) ..................................................................................................................... 68

FY 2021-22 Personnel Full Time Equivalent (concluded) ..................................................................................................................... 69
City of Chandler
Budget Highlights                                                                        2021-22 Proposed Budget

                          Calendar Highlights of the Budget and CIP Process

Citizen Budget Survey                                                               October 5, 2020 –
                                                                                    November 15, 2020

Department Decision Packages and Fee Change Requests – Reviewed, Deliberated,       November 20, 2020 –
and Prioritized                                                                     March 9, 2021

Council Budget Kickoff – 5-Year CIP Discussion                                      December 10, 2020

CIP Coordination Team Meeting                                                       January 28, 2021

CIP Coordination Team Recommendations to City Manager                               January 29, 2021

Council Workshop #1 – Preliminary 5-Year Ongoing General Fund Forecast, PSPRS,      February 11, 2021
and CIP

Budget Input Time (BIT): Moving Forward Together                                    March 6, 2021 –
                                                                                    March 13, 2021

Departments Submit Proposed Budgets with Recommended Decision Packages              March 16, 2021

Council Workshop #2 – 5-Year One-time General Fund Forecast and CIP                 March 25, 2021

Distribute Proposed Budget and CIP Booklets to Council, City Manager’s Office and   April 9, 2021
Departments

All-day Budget Briefing                                                             April 23, 2021

Council Amendments due to Budget Office                                             May 10, 2021

Budget Amendments Introduced at City Council (Special Meeting)                      May 13, 2021

Tentative Budget Adoption                                                           May 27, 2021

Public Hearings: 2021-22 Budget and Property Tax Levy; 2022-2031 CIP                June 10, 2021
Final Budget and CIP Adoption

Property Tax Levy Adoption (must be a period of at least 14 days between            June 24, 2021
Final Adoption & Tax Levy Adoption)

                                                         3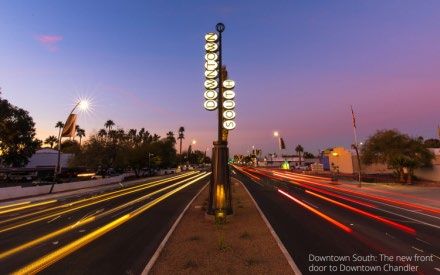
City of Chandler
Budget Highlights                                                                              2021-22 Proposed Budget

                                                 Statistical Information
                                                     Chandler Voters
                                                 August 4, 2020                November 3, 2020
                                           Primary Election – Candidate    General Election – Franchise
                     Registered Voters                           155,563                       168,598
                       Votes Cast                                 55,615                       142,350
                       Percent Voting                            35.75%                         84.43%

Source: City Clerk
                                                   Incorporated Area

                                                        Population

                                        *Official U.S. Census Bureau Population Number
Development Services provides City estimates as of July 1st annually. U.S. Census Bureau Population estimates are used
for State Shared Revenue Distribution. All City Estimates were revised based on a process change and the release of the
2015 mid-Decade U.S. Census. Estimates for 2016-2019 will be updated in the future upon release of 2020 Official U.S.
Census.

Source: Development Services

                                                             4
City of Chandler
Budget Highlights                                                                                              2021-22 Proposed Budget

                                                   Age/Gender Distribution

                                                        Racial Composition
                                                                                            Chandler (%)
                           Two or more Races                                                    4.5
                           One Race                                                             95.5
                              White                                                             67.6
                              Asian                                                             11.1
                              Hawaiian & Pacific Islander                                       0.2
                              African American                                                  5.9
                              Native American                                                   1.7
                              Other                                                             9.0
                           Hispanic/Latino Ethnicity (of any race)                              23.9

People who identify their origin as Spanish, Hispanic, or Latino may be of any race. Thus, the percent Hispanic should
not be added to percentages for racial categories.

Source: ESRI Business Analyst, 2020

                                                                Aviation
                                                                         2019-20               2020-21
                                Based Aircraft                                     443                   447
                                Air Traffic Operations                        233,213             203,595

Source: Chandler Municipal Airport

FY 2020-21 figures presented are projected through June 30, 2021, unless otherwise noted.

                                                                     5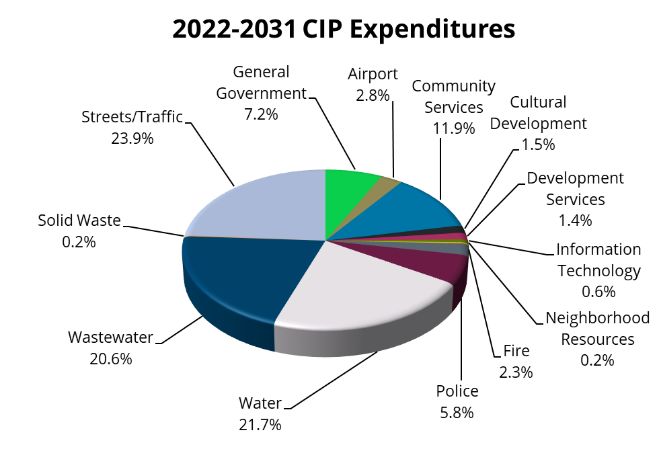
City of Chandler
Budget Highlights                                                                                        2021-22 Proposed Budget

                                                 Building Permits – All Types

Source: Development Services

                                                        Property Tax Rates
                                          Proposed Tax Rate (2021-22)
                                              Primary Tax Rate                              $0.2426
                                              Secondary Tax Rate                            $0.8700
                                              Combined                                      $1.1126
                                          Current Tax Rate (2020-21)
                                              Primary Tax Rate                              $0.2501
                                              Secondary Tax Rate                            $0.8700
                                              Combined                                      $1.1201

Property Tax calculated per $100 of assessed limited valuation as determined by the Maricopa County Assessor.

Source: Management Services

                                             Property Tax Assessed Valuation
                                                                 2020                       2021      % Change
                     Net Full Cash Value                    $4,308,417,196          $4,682,558,944      8.7%
                     Limited Property Value                 $3,243,434,243          $3,463,794,661      6.8%

Net Full Cash Value represents market value and is informational only.
Limited Property Value is used in the calculation of property tax.

Source: Maricopa County Assessor

FY 2020-21 figures presented are projected through June 30, 2021, unless otherwise noted.

                                                                     6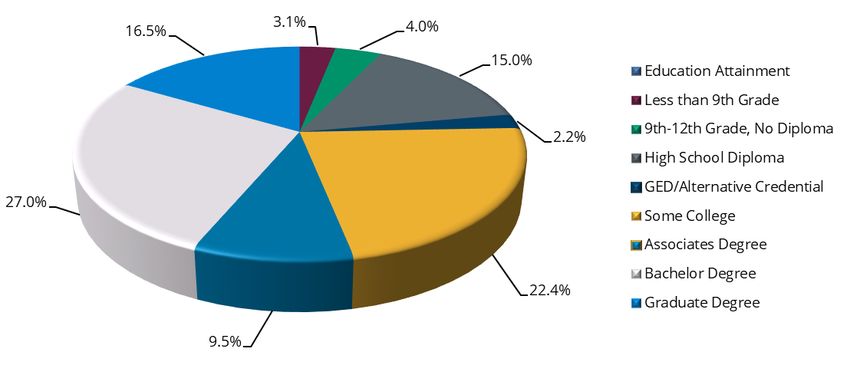
City of Chandler
Budget Highlights                                                2021-22 Proposed Budget

                                      Occupational Composition

                                         Household Income

Source: ESRI Business Analyst, 2020

                                                 7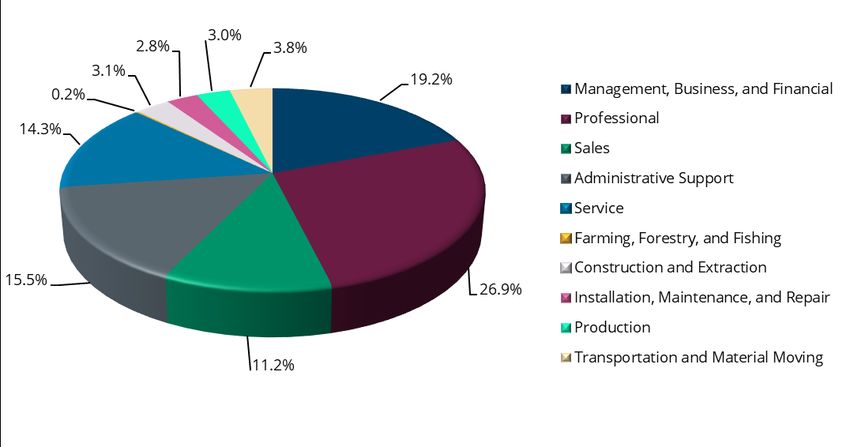
City of Chandler
Budget Highlights                                                                                                             2021-22 Proposed Budget

                                         Fiscal Year Average Unemployment Rates

COVID-19’s impact, starting in April 2020, caused the average rate to significantly increase.
* Average of July 2020 – February 2021 of the fiscal year (not seasonally adjusted).

Source: Arizona Labor & Statistics, Arizona Commerce Authority

                                                                       Libraries
                                                                                   2019-20                     2020-21
                             Library Material                                              313,087                     305,000
                             Annual Circulation                                        1,489,257                   1,200,000
                             Library Visits                                            698,269(1)                   228,395(1)
                             Registered Borrowers                                          74,145(2)                   74,000(2)
                          (1)
                                Reflects reduction resulting from COVID-19 facility closures.
                          (2)
                                Reflects active users for the past two years. Previously registered borrowers included those who had
                                not used their card in years but were still in the database.

Annual Circulation includes all materials either checked out or downloaded.

                                                                       Aquatics
                                                                                   2019-20                     2020-21
                             Swimming Pools                                            6                           6

                                                                          Parks
                                                                                   2019-20                     2020-21
                             Developed Parks                                                     67                          67
                             Acres                                                       1,520.04                      1520.04
                                Developed                                                1,281.07                      1300.67
                                Undeveloped Acres                                           238.97                      219.37
                             Lighted Fields                                                      44                          50
Source: Community Services

FY 2020-21 figures presented are projected through June 30, 2021, unless otherwise noted.

                                                                              8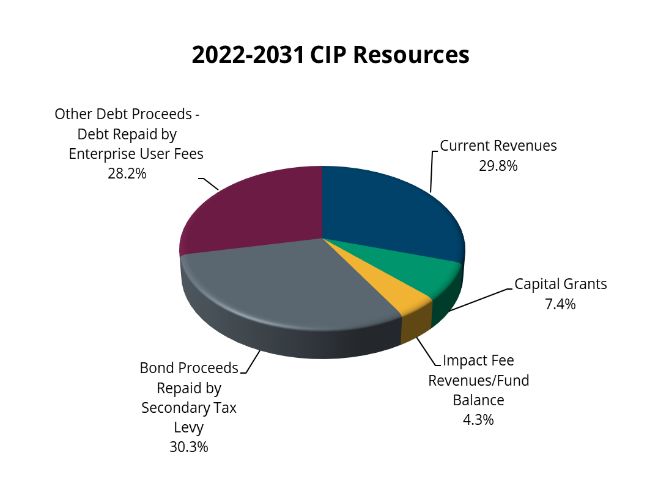
City of Chandler
Budget Highlights                                                                                                             2021-22 Proposed Budget

                                                                Recreation Centers
                                                                                             2019-20                2020-21
                            Number of Family Special Events                                              0(1)                 N/A
                            Number of Recreation Classes Offered                                   1,884(2)               1,368(2)
                            Volunteer Hours                                                      17,878(2)                2,336(2)
                            Meals Served at Senior Center                                          19,064               11,000(2)
                      (1)
                               Special events programming transferred to cost center 4559, Special Events, in the Cultural Development
                               Department and is reflected in Vision Gallery under Number of Special Events and Exhibits.
                      (2)
                               Projected numbers are down due to COVID restrictions.

Source: Community Services

                                                                          Museum
                                                                                             2019-20                2020-21
                            Number of Museum Visits                                                23,470                 4,644(1)
                            Number of Programs Provided                                                179                     187
                            Number of Exhibits                                                           30                     32
                            Volunteer Hours                                                          6,754                1,350(1)
                            Chandlerpedia Sessions                                                 12,965                  16,489
                            Exhibition Areas                                                               4                      4

                                                                     Vision Gallery
                                                                                             2019-20                     2020-21
                            Number of Gallery Visits                                               4,462(1)               2,387(1)
                            Number of Vision Kids Workshops                                            38(1)                    57
                            Participation in Vision Kids Workshops                                 1,340(1)               1,170(1)
                            Number of Special Events and Exhibits                                      22(1)                    32
                            Exhibition Areas                                                               1                      1

                                                                 Center for the Arts
                                                                                             2019-20                     2020-21
                            Number of Events and Exhibits                                              486                  300(1)
                            Attendance                                                          146,700(1)              20,650(1)
                            Volunteer Hours                                                      10,824(2)                2,460(1)
                            Theatres                                                                       3                      3
                            Exhibition Areas                                                               1                      1
                      (1)
                            Reflects reduction resulting from COVID-19 facility closures.
                      (2)
                            Reflects increase due to 30th Anniversary Season.

Source: Cultural Development

FY 2020-21 figures presented are projected through June 30, 2021, unless otherwise noted.

                                                                                 9
City of Chandler
Budget Highlights 2021-22 Proposed Budget
Sales Tax
Transaction Privilege Tax (TPT) Rates 2019-20 2020-21
Retail/Hotel/Real Property Rental 1.5% 1.5%
Restaurants/Bars 1.8% 1.8%
Utilities and Telecommunications 2.75% 2.75%
Transient Lodging 2.9% 2.9%
Source: Management Services
Climate
Average Minimum Temperature 57.4°F
Average Maximum Temperature 86.5°F
Average Annual Temperature 71.9°F
Average Annual Precipitation in Inches 9.27
Source: www.intellicast.com
Highest Education Attainment
Source: ESRI Business Analyst, 2020
10City of Chandler
Budget Highlights 2021-22 Proposed Budget
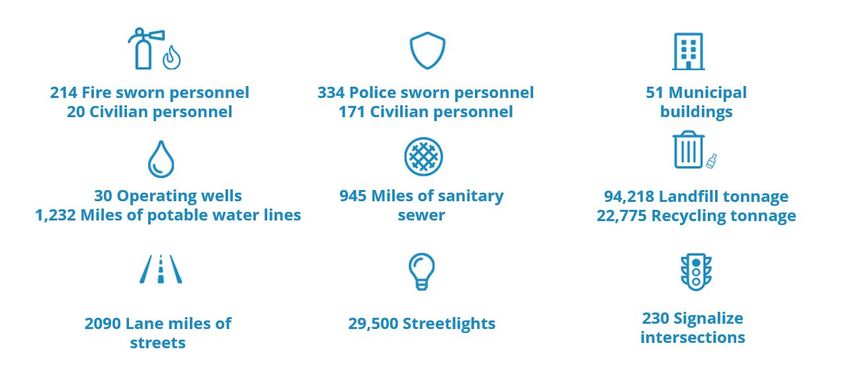
Other Services at a Glance
FY 2020-21 figures presented are projected through June 30, 2021, unless otherwise noted.
11City of Chandler
Budget Highlights 2021-22 Proposed Budget
Proposed Budget Summary
Resources
2019-20 2020-21 2021-22 % Change
Actual Adopted Proposed Adopted to
Revenues Budget Budget Proposed
Fund Balances $ - $ 407,086,010 $ 397,897,397 (2.3%)
Sale of Bonds 48,081,391 - 60,460,000 N/A
Grants 28,815,101 48,602,802 89,004,174 83.1%
Revenues 530,291,887 475,648,117 510,712,767 7.4%
Total Resources $ 607,188,379 $ 931,336,929 $ 1,058,074,338 13.6%
Encumbrance or Carryforward
from Prior Years - (214,575,475) (282,846,251)
Net Adjusted Budget $ 607,188,379 $ 716,761,454 $ 775,228,087 8.2%
Appropriations
2019-20 2020-21 2021-22 % Change
Actual Adopted Proposed Adopted to
Expenditures Budget Budget Proposed
General Government $ 40,158,883 $ 51,792,286 $ 58,889,687 13.7%
Community Services 33,241,011 52,264,026 52,550,519 0.5%
Cultural Development 4,318,507 5,574,839 5,966,638 7.0%
Development Services 7,905,210 9,850,022 14,240,159 44.6%
Information Technology 12,374,348 20,332,002 21,760,431 7.0%
Management Services 8,285,162 9,315,326 9,446,143 1.4%
Neighborhood Resources 12,827,931 19,514,526 23,539,913 20.6%
Non-Departmental 58,573,489 61,990,710 74,962,710 20.9%
Public Safety - Fire 41,806,437 45,205,677 46,756,799 3.4%
Public Safety - Police 82,430,785 84,957,575 88,311,063 3.9%
Public Works & Utilities 159,629,112 371,500,519 384,016,060 3.4%
Operations & Capital Sub-Total 461,550,876 732,297,508 - 780,440,122 6.6%
Fund Contingencies & Reserves(1) - 132,263,210 198,793,873 50.3%
Debt Service 62,587,995 59,719,660 73,753,925 23.5%
Capital/Tech/Vehicle Replacement 6,921,069 7,056,551 5,086,418 (27.9%)
Total $ 531,059,940 $ 931,336,929 $ 1,058,074,338 13.6%
Encumbrance or Carryforward from
Prior Years - (214,575,475) (282,846,251)
Net Adjusted Budget $ 531,059,940 $ 716,761,454 $ 775,228,087 8.2%
Contingency funds and reserves are one-time appropriations comprised of various funds of which the majority is restricted in their use.
(1)
These funds can be used for unanticipated revenue shortfalls or unforeseen or emergency expenditures. Use of these funds requires City
Council approval.
12City of Chandler
Budget Highlights 2021-22 Proposed Budget
Operating Budget by Function (All Funds)
2020-21 2021-22 % Change
Adopted Proposed Adopted to
Budget Budget Proposed
General Government $ 39,887,317 $ 42,055,247 5.4%
Community Services 26,956,640 27,768,898 3.0%
Cultural Development 4,199,590 4,455,141 6.1%
Development Services 9,850,022 10,186,867 3.4%
Information Technology 11,792,184 12,631,421 7.1%
Management Services 9,315,326 9,446,143 1.4%
Neighborhood Resources 19,514,526 20,639,913 5.8%
Non-Departmental 53,278,567 66,285,028 24.4%
Public Safety - Fire 38,895,433 38,231,724 (1.7%)
Public Safety - Police 78,794,164 80,105,790 1.7%
Public Works & Utilities 94,208,524 99,837,275 6.0%
Total Department Operating $ 386,692,293 $ 411,643,447 6.5%
Equip/Tech/Vehicle Replacement 7,056,551 5,086,418 (27.9%)
Debt Service 59,719,660 73,753,925 23.5%
Contingency & Reserves 132,263,210 198,778,473 50.3%
Total Operating $ 585,731,714 $ 689,262,263 17.7%
Capital Budget by Function (All Funds)
2020-21 2021-22 % Change
Adopted Proposed Adopted to
Budget Budget Proposed
General Government $ 8,905,500 $ 8,151,700 (8.5%)
Community Services 12,793,095 5,232,000 (59.1%)
Cultural Development 1,055,195 500,000 (52.6%)
Development Services - 2,031,600 N/A
Information Technology 2,328,000 1,980,725 (14.9%)
Neighborhood Resources - 2,900,000 N/A
Non-Departmental - 237,000 N/A
Public Safety - Fire 800,000 7,685,000 860.6%
Public Safety - Police 1,773,000 3,515,000 98.3%
Public Works & Utilities 123,272,400 80,867,800 (34.4%)
Total Major Capital $ 150,927,190 $ 113,100,825 (25.1%)
Capital Carryforward 194,428,025 255,461,250 31.4%
Contingency & Reserves 250,000 250,000 0.0%
Total Capital $ 345,605,215 $ 368,812,075 6.7%
Grand Total - Operating & Capital $ 931,336,929 $ 1,058,074,338 13.6%
13City of Chandler
Budget Highlights 2021-22 Proposed Budget
Departmental Comparison Summary
The following tables provide summary and detail information on the change between the adopted budget for
FY 2020-21 and the proposed budget for FY 2021-22. For operating cost centers, explanations of significant highlights for
the FY 2021-22 budgets are provided in detail within the individual departmental sections of this document. Major
capital projects information is provided at the departmental level in the Capital Budget section and in the City’s CIP
document.
2019-20 2020-21 2020-21 2020-21 2021-22 % Change
Actual Adopted Adjusted Estimated Proposed Adopted to
Expenditures Budget Budget Expenditures Budget Proposed
Mayor and Council $ 985,512 $ 1,021,237 $ 1,024,460 $ 994,250 $ 1,027,711 0.6%
Communications and Public Affairs 2,423,773 2,615,430 2,953,868 2,579,700 2,838,741 8.5%
City Clerk 1,076,113 926,189 950,107 910,580 1,197,666 29.3%
City Manager 1,171,784 1,426,082 1,447,512 1,367,914 1,491,322 4.6%
Organizational Support 23,855,574 31,382,969 43,126,927 28,931,241 37,355,042 19.0%
City Magistrate 4,444,495 4,684,074 4,674,991 4,360,791 4,996,699 6.7%
Law 6,201,633 9,736,305 10,024,688 9,618,631 9,982,506 2.5%
Community Services 33,241,011 52,264,026 50,835,632 29,543,377 52,550,519 0.5%
Cultural Development 4,318,507 5,574,839 5,535,589 4,005,983 5,966,638 7.0%
Development Services 7,905,210 9,850,022 10,232,806 9,322,091 14,240,159 44.6%
Information Technology 12,374,348 20,332,002 29,173,358 21,045,430 21,760,431 7.0%
Management Services 8,285,162 9,315,326 9,489,808 8,446,174 9,446,143 1.4%
Neighborhood Resources 12,827,931 19,514,526 33,302,487 24,416,363 23,539,913 20.6%
Non-Departmental 58,573,489 61,990,710 63,543,482 46,446,212 74,978,110 21.0%
Public Safety - Fire 41,806,437 45,205,677 45,181,486 44,241,170 46,756,799 3.4%
Public Safety - Police 82,430,785 84,957,575 88,886,746 80,683,514 88,311,063 3.9%
Public Works & Utilities 159,629,112 371,500,519 379,754,596 142,496,122 384,016,060 3.4%
Subtotal $ 461,550,876 $ 732,297,508 $ 780,138,543 $ 459,409,543 $ 780,455,522 6.6%
Fund Contingency - Operating* $ - $ 132,263,210 $ 82,938,566 $ - $ 198,778,473 50.3%
Debt Service 62,587,995 59,719,660 59,719,660 59,719,660 73,753,925 23.5%
Equipment Replacement - 288,000 575,390 - 291,283 1.1%
Technology Replacement 4,862,624 5,339,271 5,434,979 5,434,979 2,380,735 (55.4%)
Vehicle Replacement 2,058,445 1,429,280 2,529,791 1,705,873 2,414,400 68.9%
Grand Total $ 531,059,940 $ 931,336,929 $ 931,336,929 $ 526,270,055 $ 1,058,074,338 13.6%
* Contingency funds and reserves are one-time appropriations comprised of various funds of which the majority is restricted in their use.
Contingency funds can be used for unanticipated revenue shortfalls or unforeseen or emergency expenditures. Use of these funds requires
Council approval.
14City of Chandler
Budget Highlights 2021-22 Proposed Budget
Cost Center Comparison
2019-20 2020-21 2020-21 2020-21 2021-22 % Change
Actual Adopted Adjusted Estimated Proposed Adopted to
Expenditures Budget Budget Expenditures Budget Proposed
Mayor and Council $ 985,512 $ 1,021,237 $ 1,024,460 $ 994,250 $ 1,027,711 0.6%
Communications and Public Affairs
Administration $ 1,192,378 $ 1,239,675 $ 1,235,994 $ 1,223,170 $ 1,307,146 5.4%
Video Production 595,327 601,302 902,344 658,705 698,014 16.1%
Print, Mail, and Graphics 636,068 774,453 815,530 697,825 833,581 7.6%
Total Communications and Public Affairs $ 2,423,773 $ 2,615,430 $ 2,953,868 $ 2,579,700 $ 2,838,741 8.5%
General Government
City Clerk $ 1,076,113 $ 926,189 $ 950,107 $ 910,580 $ 1,197,666 29.3%
City Magistrate $ 4,444,495 $ 4,684,074 $ 4,674,991 $ 4,360,791 $ 4,996,699 6.7%
Law $ 3,790,449 $ 3,884,306 $ 3,933,966 $ 3,906,550 $ 3,915,729 0.8%
Liability Litigation 1,600,618 1,863,427 1,917,158 1,845,465 2,078,205 11.5%
Liability Litigation Claims 810,566 3,988,572 4,173,564 3,866,616 3,988,572 0.0%
Total Law $ 6,201,633 $ 9,736,305 $ 10,024,688 $ 9,618,631 $ 9,982,506 2.5%
City Manager Administration $ 1,171,784 $ 1,426,082 $ 1,447,512 $ 1,367,914 $ 1,491,322 4.6%
Organizational Support
Airport $ 897,348 $ 1,104,206 $ 1,401,274 $ 1,200,618 $ 1,599,897 44.9%
Airport Capital 2,339,469 7,684,808 8,393,791 464,441 6,384,850 (16.9%)
Buildings and Facilities 7,346,778 7,808,007 8,160,880 7,965,729 8,238,066 5.5%
Buildings and Facilities Capital 1,664,924 3,163,953 2,524,469 394,890 6,124,579 93.6%
Economic Development 1,054,234 1,098,386 11,191,789 11,071,151 1,127,103 2.6%
Economic Development Capital - 1,056,208 1,056,208 - 1,056,208 0.0%
Tourism 549,304 260,509 499,098 498,805 361,388 38.7%
Innovations 250,000 285,930 369,264 333,334 285,930 0.0%
Fleet Services 1,149,290 1,210,821 1,222,014 1,214,717 1,228,536 1.5%
Fleet Motor Pool 58,528 65,568 65,568 53,962 65,568 0.0%
Human Resources 3,146,710 3,602,651 4,047,352 3,269,900 3,630,876 0.8%
Transportation Policy 5,398,988 4,041,922 4,195,220 2,463,694 3,983,238 (1.5%)
(1)
Transportation Policy Capital - - - - 3,268,803 N/A
Total Organizational Support $ 23,855,574 $ 31,382,969 $ 43,126,927 $ 28,931,241 $ 37,355,042 19.0%
Total General Government $ 40,158,883 $ 51,792,286 $ 64,202,553 $ 48,763,107 $ 58,889,687 13.7%
Community Services
Community Services Administration $ 645,057 $ 690,786 $ 699,535 $ 616,604 $ 1,138,075 64.8%
Library 6,211,646 6,738,955 7,225,986 6,419,758 6,554,556 (2.7%)
Aquatics 3,685,449 4,127,252 4,215,482 4,140,357 4,007,173 (2.9%)
Parks Development and Operations 9,142,805 9,587,626 10,388,207 10,191,972 10,488,124 9.4%
Recreation 1,600,537 2,013,735 2,183,946 1,823,589 1,606,939 (20.2%)
Sports & Fitness Facilities 2,038,977 2,249,706 2,440,393 2,442,465 2,381,612 5.9%
Nature & Recreation Facilities 1,350,641 1,548,580 1,472,395 1,248,565 1,592,419 2.8%
Parks Capital 8,565,899 25,307,386 22,209,688 2,660,067 24,781,621 (2.1%)
Total Community Services $ 33,241,011 $ 52,264,026 $ 50,835,632 $ 29,543,377 $ 52,550,519 0.5%
Cultural Development
Cultural Development Administration $ 308,036 $ 317,096 $ 318,069 $ 313,055 $ 323,286 2.0%
Center for the Arts 1,863,109 2,470,800 2,524,097 1,949,050 2,631,076 6.5%
Downtown Redevelopment 347,290 283,628 294,855 291,361 286,505 1.0%
Cultural Development Capital 854,603 1,375,249 1,173,424 231,638 1,511,497 9.9%
Special Events 316,309 416,319 437,850 425,086 421,708 1.3%
Museum 629,160 711,747 787,294 795,793 792,566 11.4%
Total Cultural Development $ 4,318,507 $ 5,574,839 $ 5,535,589 $ 4,005,983 $ 5,966,638 7.0%
(1)
Effective July 1, 2021, the former Engineering Capital cost center transferred from Public Works and Utilities Department to the City Manager
Department and was renamed Transportation Policy Capital.
15City of Chandler
Budget Highlights 2021-22 Proposed Budget
2019-20 2020-21 2020-21 2020-21 2021-22 % Change
Actual Adopted Adjusted Estimated Proposed Adopted to
Expenditures Budget Budget Expenditures Budget Proposed
Development Services
Administration $ 1,284,623 $ 1,677,396 $ 1,726,186 $ 1,624,831 $ 1,784,188 6.4%
Planning 2,326,573 2,580,855 2,849,765 2,557,888 2,664,075 3.2%
Building Safety 2,960,749 2,504,552 2,520,807 2,208,802 2,443,328 (2.4%)
Transportation Engineering - 1,138,775 1,145,524 1,055,590 1,138,310 (0.0%)
Development Services Capital - - - - 4,053,292 N/A
Engineering 1,333,265 1,948,444 1,990,524 1,874,980 2,156,966 10.7%
Total Development Services $ 7,905,210 $ 9,850,022 $ 10,232,806 $ 9,322,091 $ 14,240,159 44.6%
Information Technology
IT Service Delivery Mgmt & Admin $ 2,255,002 $ 2,759,834 $ 3,006,056 $ 2,798,397 $ 2,612,962 (5.3%)
IT Applications & Support 4,597,359 5,361,082 6,233,142 5,758,894 5,871,895 9.5%
IT Infrastructure & Client Support 3,269,971 3,480,187 11,630,561 11,461,673 3,734,004 7.3%
IT Projects Capital 868,357 3,844,967 3,608,219 378,512 4,495,932 16.9%
ITOC Operations - 191,081 191,081 101,000 412,560 115.9%
IT Citywide Infrastructure Support Capital 1,383,659 4,694,851 4,504,299 546,954 4,633,078 (1.3%)
Total Information Technology $ 12,374,348 $ 20,332,002 $ 29,173,358 $ 21,045,430 $ 21,760,431 7.0%
Management Services
Administration $ 588,336 $ 606,127 $ 608,339 $ 581,345 $ 620,202 2.3%
Budget 741,427 770,535 770,126 781,999 775,026 0.6%
Purchasing 725,474 736,078 738,313 720,575 732,711 (0.5%)
Central Supply 423,209 407,163 411,122 346,179 440,300 8.1%
Accounting 1,727,110 1,780,865 1,799,554 1,731,609 1,815,852 2.0%
Tax and License 2,209,625 2,408,819 2,424,192 2,075,192 2,438,693 1.2%
Utility Services 1,363,932 1,457,739 1,521,597 1,411,050 1,477,408 1.3%
Environmental Management 387,834 674,800 686,368 548,185 672,751 (0.3%)
Environmental Management Liabilities 118,215 473,200 530,197 250,040 473,200 0.0%
Total Management Services $ 8,285,162 $ 9,315,326 $ 9,489,808 $ 8,446,174 $ 9,446,143 1.4%
Neighborhood Resources
Neighborhood Resources $ 338,723 $ 280,649 $ 448,590 $ 452,234 $ 288,890 2.9%
Neighborhood Preservation 1,285,823 1,572,307 1,731,015 1,430,589 1,829,801 16.4%
Community Resources - 303,424 310,322 175,289 316,696 4.4%
Housing and Redevelopment 8,354,792 13,334,522 13,457,620 10,153,927 13,845,639 3.8%
Housing and Redevelopment Capital - - - - 2,900,000 N/A
Community Development 2,848,592 4,023,624 17,354,940 12,204,324 4,358,887 8.3%
Total Neighborhood Resources $ 12,827,931 $ 19,514,526 $ 33,302,487 $ 24,416,363 $ 23,539,913 20.6%
Non-Departmental
Non-Departmental Operating $ 53,003,400 $ 53,278,567 $ 54,381,120 $ 45,893,868 $ 66,285,028 24.4%
Non-Departmental Capital 5,570,090 8,712,143 9,162,362 552,344 8,693,082 (0.2%)
Total Non-Departmental $ 58,573,489 $ 61,990,710 $ 63,543,482 $ 46,446,212 $ 74,978,110 21.0%
Public Safety - Fire
Administration $ 4,031,361 $ 4,177,864 $ 4,351,107 $ 4,382,935 $ 3,578,402 (14.3%)
Health & Medical Services 2,011,918 1,969,380 2,145,019 2,250,878 1,910,434 (3.0%)
Operations 28,964,778 30,329,952 31,873,513 31,868,000 30,334,167 0.0%
Prevention and Preparedness 1,473,086 1,430,746 1,742,945 1,539,798 1,440,624 0.7%
Fire Capital 4,405,136 6,310,244 3,973,352 3,133,277 8,525,075 35.1%
Support Services 920,157 987,491 1,095,550 1,066,282 968,097 (2.0%)
Total Public Safety - Fire $ 41,806,437 $ 45,205,677 $ 45,181,486 $ 44,241,170 $ 46,756,799 3.4%
16City of Chandler
Budget Highlights 2021-22 Proposed Budget
2019-20 2020-21 2020-21 2020-21 2021-22 % Change
Actual Adopted Adjusted Estimated Proposed Adopted to
Expenditures Budget Budget Expenditures Budget Proposed
Public Safety - Police
Administration $ 2,708,883 $ 3,004,565 $ 3,283,485 $ 2,812,778 $ 2,969,953 (1.2%)
Professional Standards 1,284,967 1,228,608 1,249,005 1,318,012 1,419,584 15.5%
Property and Evidence 501,785 478,380 480,576 374,104 461,983 (3.4%)
Forensic Services 2,425,171 2,487,527 2,544,498 2,372,973 2,494,075 0.3%
Field Operations 32,277,919 32,187,697 33,527,963 32,494,761 32,794,640 1.9%
Criminal Investigations 13,879,130 13,794,166 14,607,417 14,269,208 13,956,463 1.2%
Planning and Research 993,814 1,086,469 1,126,018 986,450 1,157,343 6.5%
Communications 4,756,898 5,341,547 5,694,142 5,521,255 5,498,905 2.9%
Police Technology 2,375,787 2,632,325 2,724,399 2,254,550 2,631,384 (0.0%)
Records 1,784,878 1,875,221 1,918,024 1,787,110 1,907,553 1.7%
Detention Services 2,041,232 2,614,890 2,629,195 2,666,518 2,639,813 1.0%
Operational Support 12,286,327 12,062,769 13,164,212 12,578,256 12,174,094 0.9%
Police Capital 5,113,993 6,163,411 5,937,812 1,247,539 8,205,273 33.1%
Total Public Safety - Police $ 82,430,785 $ 84,957,575 $ 88,886,746 $ 80,683,514 $ 88,311,063 3.9%
Public Works & Utilities
Public Works Administration $ 434,336 $ 400,947 $ 410,925 $ 374,303 $ 410,414 2.4%
Capital Projects 1,200,799 1,518,378 1,533,638 1,496,162 1,513,001 (0.4%)
Streets 10,678,729 9,603,121 11,956,932 11,104,928 10,128,782 5.5%
Streets Capital 40,147,962 139,735,844 139,687,748 36,748,478 113,433,600 (18.8%)
Traffic Engineering 6,553,374 5,615,185 5,743,017 5,548,548 5,729,503 2.0%
Street Sweeping 1,064,481 1,041,551 1,078,796 1,033,637 1,055,520 1.3%
Utilities Administration 755,913 798,561 800,375 759,226 809,823 1.4%
Solid Waste Services 13,308,276 13,440,936 13,461,707 13,712,047 14,439,947 7.4%
Solid Waste Capital 105,480 894,564 884,986 642,025 637,961 (28.7%)
Recycling Solid Waste Collection Center 1,481,030 1,671,415 1,679,024 1,495,728 1,624,829 (2.8%)
Water Distribution 4,771,422 5,326,767 5,556,538 5,033,218 5,303,129 (0.4%)
Water Capital 22,563,387 60,415,566 58,721,465 3,720,795 78,704,470 30.3%
Water Treatment Plant 5,476,197 5,547,799 6,529,991 6,058,768 5,993,310 8.0%
Environmental Resources 7,161,568 7,277,443 7,743,316 7,932,467 8,588,021 18.0%
Water Quality 1,616,773 1,793,373 1,847,423 1,704,392 1,780,233 (0.7%)
Water Systems Maintenance 6,937,082 6,598,761 6,887,288 6,681,388 6,611,002 0.2%
San Tan Vista Water Treatment Plant 1,566,061 2,082,519 3,105,207 2,253,600 2,082,519 0.0%
Meter Services 804,839 1,018,158 1,172,605 1,138,075 1,043,672 2.5%
Wastewater Collection 2,298,487 2,904,614 3,121,402 2,937,219 2,898,403 (0.2%)
Wastewater Capital 8,466,506 76,246,021 77,528,328 6,954,656 91,402,754 19.9%
Ocotillo Brine Reduction Facility 7,550,406 9,605,306 11,528,295 8,128,244 10,120,870 5.4%
Lone Butte Wastewater Treatment 640,741 1,402,209 1,422,155 1,013,522 1,413,053 0.8%
Wastewater Quality 489,393 635,462 688,270 487,059 732,944 15.3%
Airport Water Reclamation Facility 7,597,487 8,774,721 9,207,119 8,330,023 9,760,712 11.2%
Ocotillo Water Reclamation Facility 5,958,383 7,151,298 7,458,046 7,207,614 7,797,588 9.0%
Total Public Works & Utilities $ 159,629,112 $ 371,500,519 $ 379,754,596 $ 142,496,122 $ 384,016,060 3.4%
Subtotal $ 461,550,876 $ 732,297,508 $ 780,138,543 $ 459,409,543 $ 780,455,522 6.6%
Fund Contingency - Operating $ - $ 132,263,210 $ 82,938,566 $ - $ 198,778,473 50.3%
Debt Service 62,587,995 59,719,660 59,719,660 59,719,660 73,753,925 23.5%
Equipment Replacement - 288,000 575,390 - 291,283 1.1%
Technology Replacement 4,862,624 5,339,271 5,434,979 5,434,979 2,380,735 (55.4%)
Vehicle Replacement 2,058,445 1,429,280 2,529,791 1,705,873 2,414,400 68.9%
Grand Total $ 531,059,940 $ 931,336,929 $ 931,336,929 $ 526,270,055 $ 1,058,074,338 13.6%
17City of Chandler
Budget Highlights 2021-22 Proposed Budget
General Fund Revenue Summaries
The General Fund revenue categories are presented in the chart and table below. The chart provides information on
each category as a percent of the total General Fund revenues for FY 2020-21 and FY 2021-22. The table provides
information on percentage increase or decrease from the prior adopted budget. The General Fund revenue budget
includes allocations in the General Fund, General Obligation Debt Service Fund, and the General Government Capital
Projects Fund.
2020-21 2020-21 2021-22 2021-22 % Change
Adopted % of Total Proposed % of Total Adopted to
Budget Adopted Budget Proposed Proposed
Local Sales Tax & Licenses $ 127,791,752 32.2% $ 152,179,200 37.8% 19.1%
Property Tax(1) 36,529,729 9.2% 38,763,200 9.6% 6.1%
State Shared Taxes 70,770,000 17.8% 74,390,000 18.5% 5.1%
Other Revenues 25,937,214 6.5% 23,989,067 6.0% (7.5%)
Fund Balance less Transfer In/Out 136,108,244 34.3% 112,845,749 28.1% (17.1%)
Total General Fund(2) $ 397,136,939 100% $ 402,167,216 100% 1.3%
(1)
FY 2020-21 Property Tax adopted amount of $36,529,729 includes Prior Year Property Tax (Primary and Secondary) of $200,000.
FY 2021-22 Property Tax adopted amount of $38,763,200 includes Prior Year Property Tax (Primary and Secondary) of $225,000.
(2)
FY 2020-21 includes General Funds of $316,922,227 GO Debt Service Funds of $28,970,415, and General Government Capital Project Funds
of $51,174,297; FY 2021-22 includes General Funds of $306,845,101, GO Debt Service Funds of $40,479,500, and General Government
Capital Project Funds of $54,842,615.
18City of Chandler
Budget Highlights 2021-22 Proposed Budget
General Fund Expenditure Summaries
The General Fund expenditure categories are presented in the charts and table below. The charts provide information
on each category as a percent of the total General Fund expenditures for FY 2020-21 and FY 2021-22. The table provides
information on percentage increase or decrease from the prior adopted budget. The General Fund expenditure budget
includes allocations in the General Fund, General Obligation Debt Service Fund, and the General Government Capital
Projects Fund.
2020-21 2020-21 2021-22 2021-22 % Change
Adopted % of Total Proposed % of Total Adopted to
Budget Adopted Budget Proposed Proposed
General Government $ 34,306,283 8.6% $ 40,543,139 10.1% 18.2%
Community Services 32,171,090 8.1% 32,839,022 8.2% 2.1%
Cultural Development 4,618,835 1.2% 5,071,316 1.3% 9.8%
Development Services 9,113,629 2.3% 10,800,453 2.7% 18.5%
Information Technology 18,984,487 4.8% 20,315,040 5.1% 7.0%
Management Services 8,075,928 2.0% 8,206,540 2.0% 1.6%
Neighborhood Resources 3,556,968 0.9% 3,976,275 1.0% 11.8%
Non-Departmental 32,302,710 8.1% 42,095,710 10.5% 30.3%
Public Safety - Fire 39,763,770 10.0% 40,059,799 10.0% 0.7%
Public Safety - Police 84,105,520 21.2% 86,435,764 21.5% 2.8%
Public Works & Utilities 27,946,198 7.0% 23,518,358 5.8% (15.8%)
Debt Service 27,135,385 6.8% 40,144,916 10.0% 47.9%
(1)
Contingency & Reserves 75,056,136 18.9% 48,160,884 12.0% (35.8%)
(2)
Total General Fund $ 397,136,939 100% $ 402,167,216 100% 1.3%
Personnel & Benefits $ 194,208,774 48.9% $ 205,237,914 51.0% 5.7%
Operating & Maintenance 76,947,732 19.4% 94,175,803 23.4% 22.4%
Major Capital 50,924,297 12.8% 54,592,615 13.6% 7.2%
Contingency & Reserves(1) 75,056,136 18.9% 48,160,884 12.0% (35.8%)
Total General Fund(2) $ 397,136,939 100.0% $ 402,167,216 100.0% 1.3%
(1)
Contingency funds and reserves are one-time appropriations comprised of various funds, of which the majority is restricted in their use.
Contingency funds can be used for unanticipated revenue shortfalls or unforeseen or emergency expenditures. Use of these funds requires
Council approval.
(2)
FY 2020-21 includes General Funds of $316,922,227 GO Debt Service Funds of $28,970,415, and General Government Capital Project Funds
of $51,174,297; FY 2021-22 includes General Funds of $306,845,101, GO Debt Service Funds of $40,479,500, and General Government
Capital Project Funds of $54,842,615.
19City of Chandler
Budget Highlights 2021-22 Proposed Budget
General Fund Expenditure – by Function
The adopted General Fund budget, divided between operating and capital, is shown below. The FY 2021-22 budget
reflects an increase to debt service and an increase in one-time funding to Public Safety Personnel Retirement System
(PSPRS) towards the goal of paying down the unfunded liability, thereby reducing the annual employer contribution
sooner.
The FY 2021-22 General Fund Capital budget reflects an 7.2% increase primarily due to the increase of capital
carryforward when compared to FY 2020-21. The combined operating and capital General Fund change over the prior
fiscal year is an 1.3% increase.
Operating Budget
2020-21 2021-22 % Change
Adopted Proposed Adopted to
Budget Budget Proposed
General Government $ 30,105,328 $ 31,653,141 5.1%
Community Services 26,794,778 27,559,362 2.9%
Cultural Development 3,634,295 3,758,931 3.4%
Development Sevices 9,113,629 9,465,361 3.9%
Information Technology 11,792,184 12,631,421 7.1%
Management Services 8,075,928 8,206,540 1.6%
Neighborhood Resources 3,556,968 3,976,275 11.8%
Non-Depatmental 23,840,567 33,652,628 41.2%
Public Safety - Fire 38,895,433 38,231,724 (1.7%)
Public Safety - Police 77,989,907 79,299,326 1.7%
Public Works & Utilities 10,222,104 10,834,092 6.0%
Total Department Operating $ 244,021,121 $ 259,268,801 6.2%
Debt Service 27,135,385 40,144,916 47.9%
Contingency & Reserves 74,806,136 47,910,884 (36.0%)
Total Operating $ 345,962,642 $ 347,324,601 0.4%
Capital Budget
2020-21 2021-22 % Change
Adopted Proposed Adopted to
Budget Budget Proposed
General Government $ 2,188,294 $ 4,498,990 105.6%
Community Services 3,173,434 1,332,000 (58.0%)
Cultural Development 784,477 500,000 (36.3%)
Development Sevices - 1,213,400 N/A
Information Technology 2,132,250 1,882,849 (11.7%)
Non-Depatmental - 237,000 N/A
Public Safety - Fire 800,000 988,000 23.5%
Public Safety - Police 1,773,000 2,477,000 39.7%
Public Works & Utilities 3,889,188 2,568,520 (34.0%)
Total Major Capital $ 14,740,643 $ 15,697,759 6.5%
Capital Carryforward 36,183,654 38,894,856 7.5%
Contingency & Reserves 250,000 250,000 0.0%
Total Major Capital Budget $ 51,174,297 $ 54,842,615 7.2%
Grand Total(1) $ 397,136,939 $ 402,167,216 1.3%
(1)
FY 2020-21 includes General Funds of $316,992,227, GO Debt Service Funds of $28,970,415, and General Government Capital Project Funds
of $51,174,297; FY 2021-22 includes General Funds of $306,845,101, GO Debt Service Funds of $40,479,500, and General Government
Capital Project Funds of $54,842,615.
20City of Chandler
Budget Highlights 2021-22 Proposed Budget
2022-2031 Capital Improvement Program
Projected Expenditure and Resource Summary
(Project Detail is Located in the Capital Improvement Program Book)
21City of Chandler
Budget Highlights 2021-22 Proposed Budget
Capital Improvement Program Impact on Operating Funds
The City of Chandler prepares a Capital Improvement Program (CIP) Budget separately from the Operating Budget;
however, the two are closely linked. As part of the CIP process, departments are asked to identify those capital projects
that have an impact on the operating budget. As capital projects are completed, operation and maintenance of these
facilities must be funded in the operating budget. The following table reflects the projected operating expenses, by CIP
area, for the proposed CIP projects. Operations and maintenance cost increases shown below are not automatically
added to the budget but reviewed as to their impact on the ongoing forecast. Requests must be submitted by the
appropriate department and increases are only incorporated with Council approval as part of the annual budget
approval process. Additional details on operations requirements for specific projects are available in the Proposed CIP
booklet.
22City of Chandler
Budget Highlights 2021-22 Proposed Budget
Strategic Goals, Organizational Priorities, and Priority Based Budgeting (PBB)
The City of Chandler’s continued goal is to provide the highest quality services to the community in the most cost-
effective manner. The City Council sets goals to continuously improve Chandler and to make fiscally responsible
decisions that make the City a regional leader with a strong plan for the future. This process is designed to address the
needs and desires of the community, and includes their input received through surveys, commissions, neighborhood
meetings, and contacts with individuals throughout the year.
In February 2015, the City Council established six Strategic Policy Goals identified below. Minor revisions were approved
in April 2017 and February 2019. Focus areas around infill and redevelopment, innovation and technology, mobility,
neighborhoods, and quality of life were added in June 2019. These Goals and Focus Areas are then tied to our Priority
Based Budget (PBB) goals and objectives to allow program costs to be associated with the strategic goals they support.
The City’s PBB efforts led to the creation of the PBB “Desired Results”, which link the broad range of Department
programs and services provided to the citizens of Chandler to the City Council Strategic Goals. The results have been
established under the broad areas of:
• A Connected and mobile community
• A Safe community
• An Attractive community
• A Community with Sustainable economic health
• A Community that has a Contemporary culture and is unified
• A Community with Good governance
Each of these PBB results is supported by a variety of programs and services across multiple Departments which
provide a tool for budget decision making. These links are indicated in each of the Department’s cost center pages.
The six strategic policy goals are designed to ensure Chandler is a great place to visit, work, play, and live by…
Being the most connected City - PBB result: Connected and mobile community
• Connect our community using enhanced communication technologies to share information by increasing
electronic availability of City information.
• Increase community connectivity through enhancing multimodal transportation.
Being a leader in trust and transparency – PBB result: Good governance
• Provide timely and accurate data and reports to maintain accountability and provide support for effective
decision making.
• Promote opportunities that encourage citizen engagement and input.
Maintaining fiscal sustainability – PBB result: Good governance
• Maximize the City’s diverse portfolio of revenue sources.
• Continue adherence to and improve upon fiscal policies.
• Maintain strong bond rating with all three rating agencies for all types of debt.
• Manage expenditure growth through periodic review of programs and services.
Attracting a range of private sector businesses - PBB result: Sustainable economic health
• Position Chandler to be recognized by corporate real estate executives, site selectors, regional partners, and
the development industry as a premier location for new investment.
• Coordinate and facilitate the revitalization of Downtown Chandler.
Fostering a contemporary culture that embraces unity - PBB result: Contemporary culture / Unified
• Promote Chandler as an inclusive community that values its rich diversity, history, and culture.
• Support diversity through City employment practices.
• Invest in employees, support systems, and innovation strategies that ensure Chandler remains a leader in
the delivery of high quality services.
Being safe and beautiful - PBB results: Safe community and Attractive community
• Promote a multifaceted approach to address the needs of neighborhoods from the physical, safety, and
community perspectives.
• Construct and maintain sustainable public infrastructure.
• Ensure Chandler remains a safe community by employing best practices.
23City of Chandler
Budget Highlights 2021-22 Proposed Budget
Focus Areas
The City of Chandler has outlined five focus areas to concentrate efforts to achieve the identified goals.
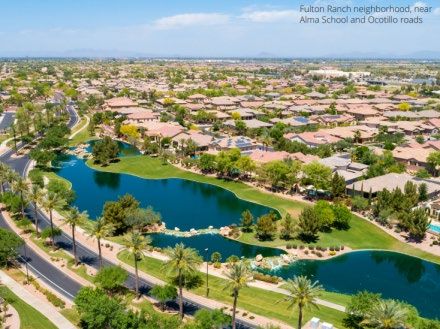
Infill and Redevelopment
Strategic infill and redevelopment includes the use of creative regulatory
tools and marketing efforts to ensure Chandler remains a world-class
community for residents, visitors and businesses. These approaches will
maintain the viability of existing developments and plan for the use of
remaining unbuilt properties.
PBB – Sustainable economic health and Contemporary culture / unified
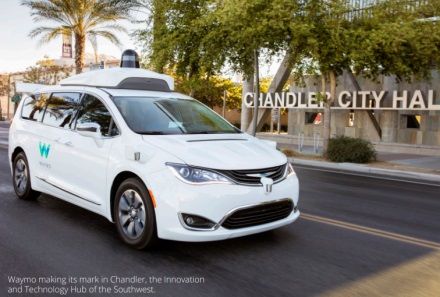
Innovation and Technology
Chandler’s high-tech industries and talented workforce drive the local
economy and create future opportunities. The City recognizes the
importance of providing solid infrastructure and streamlined
government services to support the implementation of current and
future technologies.
PBB – Good governance, Connected and mobile community and
Sustainable economic health
Mobility
Mobility — the ability to go places — has been essential to Chandler’s
success. Served by three major highways, a well-planned arterial street
network, public transit and a growing airport, the foundation has been
laid for Chandler to expand its multi-modal transportation offerings and
further integrate new technologies to efficiently get people where they
want to go. Mobility includes bicycling, autonomous vehicles, new transit
modes, business aviation, traffic technologies and safety enhancements.
PBB – Connected and mobile, Safe and Attractive community and Good
governance
Neighborhoods
Chandler boasts a mixture of modern homeowner associations, mature
traditional neighborhoods, apartments, condominiums and other
housing types. To sustain an exceptional quality of life for Chandler
residents and keep Chandler safe, clean and beautiful, the
preservation and enhancement of neighborhoods is paramount.
Just as Chandler’s neighborhoods are diverse, so are the approaches to
ensure that all neighborhoods remain safe and vibrant. Partnerships
with stakeholders including engaged residents, developers and
community agencies provide opportunities to achieve this goal while
maintaining each neighborhood’s distinct character.
PBB – Contemporary culture / unified, Safe and Attractive community
Quality of Life
Chandler’s commitment to high standards has spanned generations of
City leadership and resulted in the safe and beautiful community
residents and businesses enjoy today. Maintaining an unparalleled
quality of life includes a renewed focus on arts, culture and recreation.
High quality development and amenities shape the character of our
neighborhoods and business centers. Public safety is essential to our
community’s quality of life. First responders protect, serve and respond
to the needs of the community.
PBB - Contemporary culture / unified, Safe and Attractive community
24City of Chandler
Budget Highlights 2021-22 Proposed Budget
Financial Policies
The City of Chandler’s financial policies have been developed to set standards for stewardship over financial resources.
The policies institutionalize strong financial management practices, clarify the strategic intent for financial management,
define boundaries, manage risks to financial condition, support good bond ratings to minimize borrowing costs, and
comply with established public management best practices. The policies provide a guide for sound fiscal planning, while
maintaining fiscal integrity.
There are nine (9) financial policies: Operating Management; Capital Management; Reserve; Debt Management; Long-
Range Financial Planning; Grant Management; Investment; Accounting, Auditing, and Financial Reporting; and Pension
Funding. The policies are reviewed annually, with updates approved by City Council. Listed below are the financial
policies that provide the direction, that allows for “Moving Forward Together”, for the FY 2021-22 Budget, and continue
to keep the City fiscally strong.
1. Operating Management Policy
The purpose of the Operating Management Policy is to provide guidance and clarification on how the budget will be
structured and developed, define the budget control system, how to amend the budget, and specific revenue and
expenditure principles to ensure ongoing financial sustainability and operating practices.
Key Budget Features
Scope and Length of Budget Period: The budget shall be based on a fiscal year beginning July 1 through June 30, and
revenue and expenditures for all funds shall be adopted annually (excluding funds maintained for financial reporting
purposes only).
Level of Control: The budget process shall be decentralized, allowing all Departments to provide updated revenue and
expenditure amounts entered directly into an online budget system. Budgetary control shall be at the Departmental
level and managed separately between the Personnel budget (5100 series of accounts) and the Operating budget (5200-
8900 series of accounts). A Department cannot spend more than the budget appropriated; however, line item
appropriations shall be established for each cost center (division) within each Department.
Balanced Budget Definition: According to the City Charter, the total of proposed expenditures shall not exceed the total
of estimated income and fund balances available. Each fund in the budget must also be in balance; total anticipated
revenues plus the necessary portion of fund balance (all resources) must equal total expenditure appropriations for the
upcoming fiscal year. Appropriation shall be for a specific fund and balanced based on specific funding sources,
therefore savings in one fund shall not be used to cover over-expenditure in another fund.
Basis of Budgeting: The City’s accounting system is maintained on the same basis as the Adopted Budget. This enables
Departmental budgets to be easily monitored via accounting system reports on a monthly basis. The City’s financial
records, as reported each year in the Comprehensive Annual Financial Report (CAFR), are maintained in accordance
with Generally Accepted Accounting Principles (GAAP). For comparison purposes, the City’s CAFR shows fund revenues
and expenditures on both a budget basis and a GAAP basis in all funds for which budgets are adopted.
The budgets for general governmental fund types, (i.e., General Fund, Special Revenue, Capital Projects, and Expendable
Trust) are prepared on a modified accrual basis, which is a mixture of the cash and accrual basis. This basis is consistent
with GAAP except for the following:
a. Compensated absences are recorded as expenditures when paid (cash basis) as opposed to a liability that is
expected to be liquidated from available financial resources as earned and accrued by employees (GAAP basis).
b. Sales tax and grant revenue are recorded on the basis of cash collected (cash basis) as opposed to the accrual
basis (GAAP basis) whereby amounts are recorded to the period the revenue was earned.
c. Capital outlays for Enterprise funds are recorded as expenses (cash basis) as opposed to fixed assets (GAAP
basis).
25City of Chandler
Budget Highlights 2021-22 Proposed Budget
d. Principal payments on long-term debt are recorded as expenses (cash basis) as opposed to a reduction of a
liability (GAAP basis).
e. Proceeds from the sale of bonds and utility system development fee revenues are recognized as revenue when
received (cash basis) as opposed to a reduction of a liability and an increase in contributed capital (GAAP basis).
f. No depreciation is budgeted (on a cash basis for any fund) as opposed to depreciation expense recorded in
financial statements (GAAP basis).
The budgets for Proprietary fund types such as the City's Enterprise (water, wastewater, reclaimed water, reverse
osmosis, solid waste, and airport), Internal Service, Fiduciary, and Permanent Trust funds are budgeted and reported on
a full accrual basis of accounting. Under the full accrual basis, expenses are recorded at the time liabilities are incurred,
and revenues are recognized when they are obligated to the City (for example, water user fees are recognized as
revenue when bills are produced, not when the cash is received). All operating and capital expenditures (except
depreciation) are identified in the budgeting process because of the need for appropriation authority.
Cost Allocation: Costs incurred in the General Fund to support the operations of the Enterprise funds (water,
wastewater, reclaimed water, reverse osmosis, solid waste and airport) will be recovered through an indirect cost
allocation. The indirect cost allocation plan will be reviewed annually, and costing adjustments made after approval of
the City Manager or Designee.
Long-Term Financial Forecasts: Forecasts will be prepared annually covering a ten-year period and considered during
budget development.
Performance Measurement: Each Department will establish goals and objectives and create and track performance
measurements to assure the goals and objectives are achieved in an efficient and effective manner. Performance
measures may be eliminated if approved by the Department Director.
Budget Principles and Process
Budget Links to Strategic Financial Plans: The City’s annual budget will be developed in accordance with the policies and
priorities set forth in the Council Strategic Goals, the needs of the community, and local, federal and state laws.
Examination of Spending Patterns: The City will seek to maximize the value the public receives through its spending by
critically examining existing spending patterns to make sure they continue to provide value, and if not, reallocate to
services that do.
Prioritizing Services: The Priority Based Budgeting (PBB) results will be used annually to prioritize City services based on
City Council’s long-term desired results. Costs of City services will be updated every three years.
All Department needs (decision package requests), will be weighed taking into account PBB results and other
information based on available City resources within projected fiscal constraints. All requests must be fully justified to
show that they will maintain or enhance service delivery or support new programs.
Additions to Department budgets outside of the annual budget process are discouraged and only approved by the City
Manager’s office in unique circumstances or by Mayor and Council when required by City Code.
Funding Liabilities: The current portion of long-term liabilities (i.e., capital infrastructure, annual costs of maintaining
and replacing capital assets, contributions to employee pensions), at a minimum, should be funded in the annual
budget so as to maintain the trust of creditors and ensure a manageable payment plan.
Budget Process: The budget will be developed following a detailed calendar to ensure timely preparation and execution,
provide opportunities for citizen participation at different points, follow State law and City Charter, and be summarized
within a budget document to clearly communicate policy decisions.
Budget Control System
Modified Expenditure Control Budgeting (MECB): MECB will be utilized in order to encourage cost effectiveness while
providing quality services to Chandler citizens. MECB assumes existing service levels will be maintained and new or
26City of Chandler
Budget Highlights 2021-22 Proposed Budget
enhanced programs require an ongoing source of funding before initiation. The use of MECB supports the following
basic philosophies:
a. Department management is expected to manage wisely and to look for effective and efficient ways to deliver
quality services to our citizens while meeting the goals of Council; and
b. Department management can find ways to do things more efficiently if given the freedom to innovate and
control their own resources.
Base Budget Method: The base budget method will be utilized for ongoing Operations and Maintenance (O&M)
appropriation. Departments shall be allocated the prior year's base budget to support all ongoing operations but may
request supplemental funding through a decision package. Requests approved in the Adopted Budget shall be
incorporated into Department’s base budgets. Departments develop their own expenditure line item budgets; however,
exceptions exist for certain citywide expenditure line items and can only be spent for the specified purpose (department
fleet, equipment and technology replacement transfers out, and fuel).
Under the MECB philosophy, Departments may request to carryforward savings achieved in their Base Budget
operating accounts to the next year, with justification, through a request to the City Manager. Funds available for
carryforward will exclude the above noted exceptions.
The City will use an Encumbrance Accounting System whereby budgeted funds are committed and no longer available
for spending when a purchase order is approved in the financial system. Encumbered funds will be carried forward to
the next budget year if not spent by year end.
Personnel Services Budgeting: All personnel costs are funded outside of the base budgets, and any personnel savings
accumulated remain in their original fund. The Budget Division develops all personnel services budgets based on full
funding of all approved positions. If revenues are available during the budget process, positions may be added to
maintain or enhance service levels after City Manager review and City Council approval.
Additions outside of the budget process are discouraged and only approved by the City Manager’s Office in unique
circumstances. Overspending of overtime and temporary budgets must be funded from base budgets if not directly
related to a vacancy.
Budget Resolution Transfer Authority: The Adopted Budget Resolution for each fiscal year gives authority to the City
Manager or his/her designee regarding transfers to/from departments of non-departmental encumbrance,
carryforward, lump sum agreements, fuel and utility reserves, non-departmental personnel, department operations
and maintenance savings, Information Technology telecommunications appropriation, undetermined grants, and grant
matching funds.
Budget Expenditure Limitation: State Expenditure Limitation options, the level at which expenditures cannot legally
exceed the appropriated amount, will be reviewed and implemented as required by State statute to ensure the best
approach for the City. The City of Chandler currently falls under the Home Rule Option: Under the Home Rule Option,
the expenditure limitation is free from any ties to the State imposed expenditure limitation if the majority of the
qualified electors vote in favor of this alternative. On August 28, 2018, the City of Chandler voters approved to continue
under Home Rule for four years. Chandler adopts its expenditure limitation along with the annual budget. The
maximum legal expenditure limit is the total of all departmental appropriations in the final budget adopted by the City
Council. The City’s next Home Rule election will be in 2022.
Budget Amendments
In accordance with the City’s Alternative Expenditure Limitation, total expenditures may not exceed the final
appropriation once the budget is adopted. The City can amend the total appropriation for an individual fund; however,
if one fund’s total appropriation is increased, another fund must be decreased by an equal amount.
Amendments moving budget appropriation between departments may be processed at any time during the fiscal year
upon written request by the City Manager to the City Council (Section 5.08, City of Chandler Charter). Organizational
27You can also read