Housing the Next Million New Yorkers Near Transit - Planning for Growth - Eric Kober - NYU ...
←
→
Page content transcription
If your browser does not render page correctly, please read the page content below
Housing the Next Million
New Yorkers Near Transit
Planning for Growth

                           Eric Kober

                            July 2018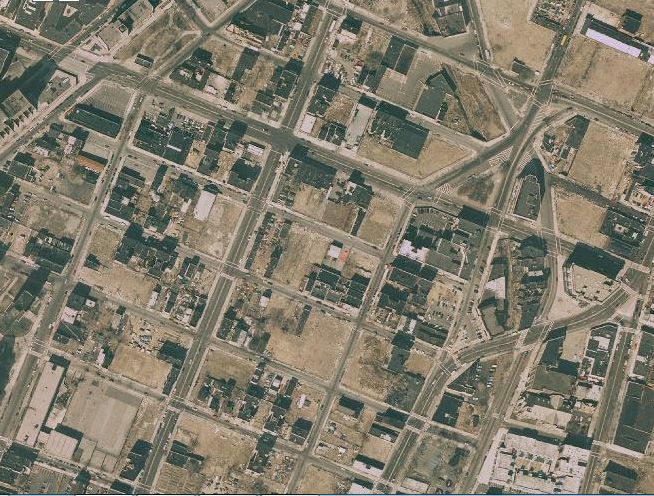
Executive Summary

New York City has experienced four decades of population and housing
growth since the 1970’s fiscal crisis, and needs continued growth
to maintain its position as the nation’s leading center of commerce
and culture, while generating tax revenue to support public services.
Properly planned growth enables the city to provide housing and
economic opportunities to a diverse population.

New York City must plan for its future growth while burdened with a
legacy of zoning not designed to support the population and housing
stock it will need in the next three decades. But at the same time, it
benefits from far-sighted rail transit investments mostly undertaken
before 1940. This transit legacy is both a vital support for future needed
zoning density increases and a challenge in those areas where historic
transit investment was inadequate.

New York City’s land use planning and its transit system have long been
inextricably linked. Employment has throughout the city’s history been
concentrated at the core of a transit network that was initially horse-
drawn, later powered by steam, and since the turn of the 20th Century,
by electric traction. The subway, beginning in the early 1900’s, was
embroiled in political controversy and competing agendas throughout its
development history. The consequence is that some areas of the city are
well provided with rail transit capacity into the city’s employment core
while others, particularly western Queens and northern Brooklyn, are
less well served and experiencing constraints on their ability to support
continued large-scale housing construction.

Dense housing spread rapidly as new rapid transit lines opened. The
size and shape of this housing was determined by building regulations.
                                     1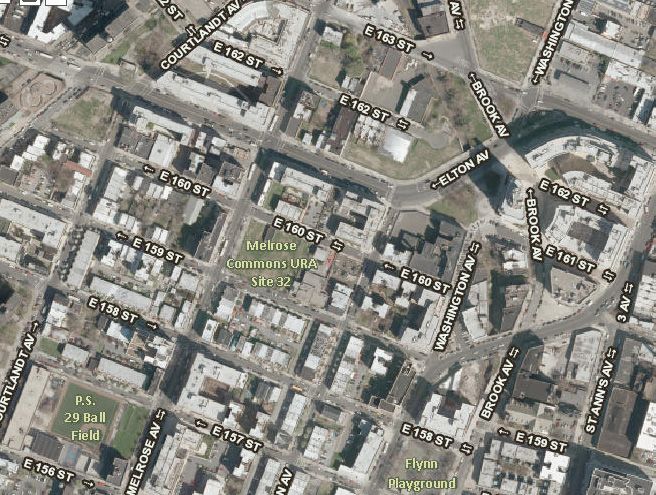
Beginning in the late 19th Century, the New York State Legislature passed
a series of laws – the “Old” Tenement Law of 1879, the “New” Tenement
Law of 1901, and the Multiple Dwelling Law of 1929, which imposed
increasingly demanding standards for yards and interior courts in an
effort to ensure that all apartments had decent access to light and air.
The city’s first Zoning Resolution of 1916 did not significantly improve on
these standards but this changed with the creation of the City Planning
Commission and two major zoning amendments. First, the citywide
amendment to the 1916 zoning in 1944 effectively reduced lot coverage
for apartment buildings and promoted a more open streetscape. Then, in
1961, an entirely new Zoning Resolution was instituted, for the first time
providing development controls that capped future population growth
effectively.

The 1961 zoning plan was based on the conclusions of two planning
studies in the late 1950’s. These looked forward to 1975 and predicted
that the suburbs would accommodate most population growth in
the New York region in that period, with New York City’s population
stabilizing. Within the city, Manhattan would lose population while
Queens and Staten Island, the two least developed of the boroughs, would
grow. In reality, the suburbs grew but the city’s population declined in
the 1970’s. The two reports were more accurate in forecasting housing
unit changes in the city through the 1970’s than population changes. New
York City required more housing units for its diminished population than
forecast, due to larger declines in average household size than had been
predicted.

Since 1980 New York City’s population has grown by about one and
a half million people. With the return of rapid population growth, the
inadequacy of the 1961 zoning framework was exposed. The city began
a long series of zoning changes to increase density and promote housing
development, mainly in areas served by existing subway lines, but in some
cases along newly constructed subway extensions.
                                     2
These rezonings continue to this day, and must continue in the future,
because there is no foreseeable slackening of the city’s rate of population
growth. The suburbs no longer serve as a growth relief valve for the
city. The lower density zoning districts mapped along transit corridors,
and low-density manufacturing districts near transit, represent the best
opportunities for additional housing density in the coming decades. Some
of these opportunities were identified in a 2007 city study, PlaNYC 2030,
but have yet to be grasped.

As the city considers future zoning changes to accommodate growth,
there is a greater need than before to consider transit capacity issues.
Rezonings in areas served by the portions of the subway network that
pass through Downtown Brooklyn, or enter the employment core from
Upper Manhattan and the Bronx, are less constrained by subway capacity
than rezonings in western Queens and northern Brooklyn.

In the short to medium term, technological and equipment changes
proposed by New York City Transit, notably the implementation of
modern signaling systems and open-gangway passenger rail cars, will
provide relief on constrained subway lines. However, planning should
be initiated for long-term capacity increases for western Queens and
northern Brooklyn linked to the construction of increased trunk line
capacity in Manhattan through future phases of the Second Avenue
subway.

As the Department of City Planning considers future zoning changes,
it needs to keep in mind that such changes are successful only if
large amounts of new housing are actually constructed. Affordability
requirements, which have become city policy in the de Blasio
administration, need to be consistent with private sector investment
criteria. Making a statement through restrictive zoning about the
need for affordability, but then failing, due to the insufficiency of public

                                        3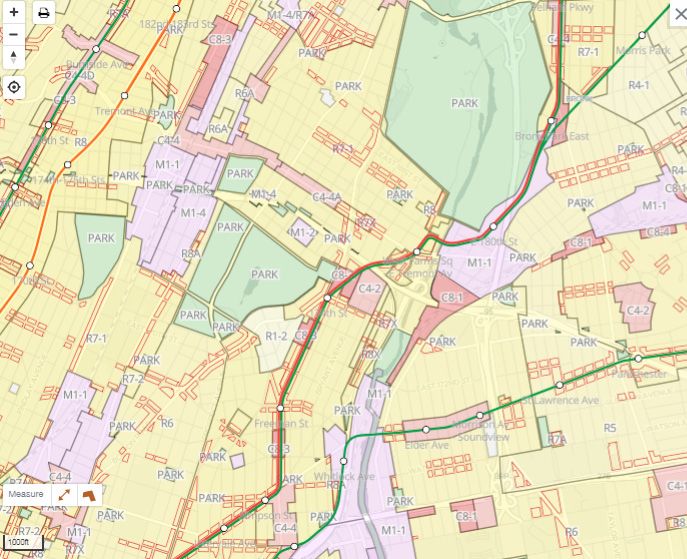
funding, to achieve the construction of new housing at a large scale
consistent with the city’s growing population, is detrimental to the city’s
future. As shown by rapid demographic changes in western Queens
and northern Brooklyn, with an influx of college-educated adults even
in some community districts that have not experienced large-scale
housing construction, in the absence of new housing construction to
meet demand older housing becomes inaccessible to long-standing lower
income populations.
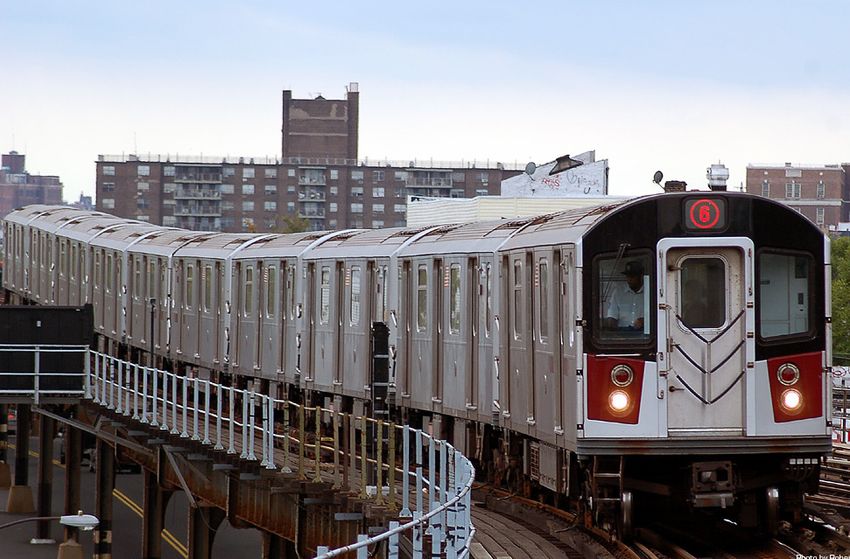
Cover image: Robert McConnell, Wikimedia Commons
4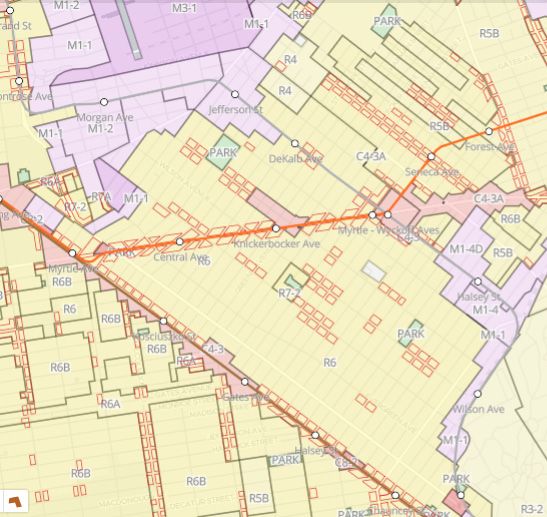
Introduction

New York City is sometimes criticized by activists for having no master plan, but it is nonethe-
less a planned city. The city’s plan is not found in one location, nor is it the outcome of a co-
herent decision making process. The plan has multiple elements that establish limits on growth
and determine built uses and densities in every neighborhood. For the city as a whole, the plan
establishes a long-term cap on population growth by controlling the amount of housing that
can be constructed.
What are the elements of this plan? The most important element is the subway system. New York City’s subway system
is a hub-and-spoke system that covers Manhattan, approaches the edges of the Bronx and Brooklyn and covers western
and central Queens. Residential density generally follows the spokes, with the greatest residential densities closer to the
core areas of the city. Commercial density congregates at the hubs, making the neighborhoods surrounding the hubs
the city’s most desirable residential locations. Only in Staten Island is there limited rail transit, with density concentrated
only at the bus, rail and ferry hub in St. George and nearby areas.

The subway is not itself a comprehensively planned system. It is a combination of pre-1900 rail and elevated lines; new
lines constructed in the early 1900’s as an outcome of bargaining between the city government, two private companies,
communities and elected officials; and a rival system built by the city in the 1920’s and 1930’s to drive the two private
companies to give up their franchises, which they duly did in 1940. The city then proceeded to demolish elevated lines
that represented a significant part of its acquisition. It also moved to knit its disparate transit lines together in the 1950’s
and 1960’s but never found the resources to complete its intended subway network. The result is that some areas of the
city are well-provided with subway service, relative to residential density and peak ridership, while other portions of the
system are notoriously overcrowded.

The second key element of the city’s plan is the rectangular street grid. Most of the city is divided up into blocks that
follow the pattern set by the Commissioners’ Plan of 18111 — about 200 feet deep and about 800 feet long. Such
blocks are often neatly divided into building lots that are about 100 feet deep. This creates a characteristic pattern in
residential neighborhoods, with buildings close to the street and an unbuilt open area in the center of the block, divided
into private rear yards but providing shared light and air to adjacent buildings. Because blocks and lots are relatively
small, for apartment buildings to be designed efficiently they generally need high lot coverage, which limits design flexibil-
ity and results in a consistent development pattern across the city. Changes to this pattern — through public assemblage
of “superblocks” that allowed towers surrounded by large open areas — were restricted to a brief period of the city’s
history and had a limited impact on the city overall.

Zoning was for a long time a relatively less important element of the city’s plan. Most of the city was built either before
the city enacted zoning in 1916, or under the zoning that existed prior to 1961, which was generally permissive and
allowed apartment buildings over a much larger area of the city than was deemed necessary when the city was compre-
hensively rezoned in 1961. The New Tenement Law and the Multiple Dwelling Law, which allowed low-cost semi-fire-
proof wood joist construction, but only up to a height of six stories, were far more significant in determining the pattern
of development. Few areas of the city could support taller buildings economically, although they were generally permit-
ted, because they had to be fully fireproof.

Only after the 1961 zoning went into effect did zoning become an affective cap on development densities, but by that
time the city’s economy had begun to decline and housing production fell off sharply. The planners who prepared the
1961 zoning anticipated a slow-growing city and enacted zoning consistent with their assumptions. The new zoning res-
olution was in principle as-of-right but allowed densities were greatly reduced in many areas of the city. When the city’s

1       “Grid plan,” in Kenneth T. Jackson, ed. The Encyclopedia of New York City,Yale University Press, 1991, p. 510.
                                                                           5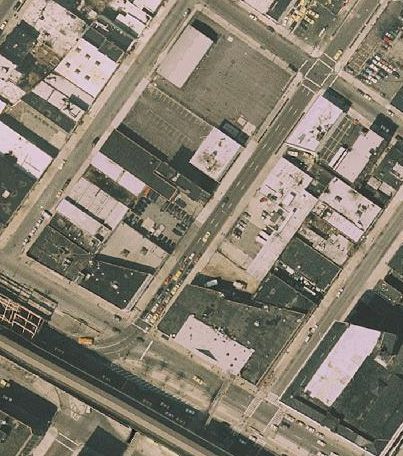
economy recovered in the 1980’s and the city began, against all expectations, to grow rapidly, the city moved to modify
the zoning to allow for more growth. The subway was not seen as a limiting factor in growth at that time since ridership
had declined, and surplus capacity was widely available.

In 2018 both the capacity of the transit system and zoning are limiting factors in determining the pattern of future
growth in New York City. A combination of population growth, employment growth, and increased labor force partici-
pation absorbed much of the excess capacity in the subway system that existed in the 1980’s. Concurrently the city’s
housing stock has grown slowly and become increasingly costly to rent or buy, relative to incomes. Many neighborhoods
where housing is in demand have few available development sites and higher-income populations are spreading into
neighborhoods that have heretofore provided reservoirs of relatively low-cost housing.

The geographic spread of higher-income households is evidence that the city does not have enough housing to meet de-
mand, in the neighborhoods where such households have in the past chosen to live. This failure to build enough housing
leads to pressure on low income communities — where residents cannot compete for housing with newcomers.

New Yorkers take pride in the idea of their city as a place of opportunity. A future New York City that mostly houses
those who are already successful, and no longer serves as an avenue of opportunity for upward-striving people from
throughout the nation and the world, would no longer possess the qualities that many New Yorkers value. To avoid such
a future, the city should seek to accelerate the production of housing in many neighborhoods throughout the city. As it
has been for decades, such new housing needs to be concentrated in areas well served by transit, where more density
can be accommodated without needing to accommodate a vast influx of private autos generating congestion and requir-
ing large amounts of expensive off-street parking.

To achieve this zoning must become far more permissive in terms of where housing is permitted and how dense it can
be, a dramatic turn from the policies of recent years. But this is not enough. New Yorkers need to be able to move
around the city. New York planners have always understood the relation between transit capacity and the levels of resi-
dential growth the city needs. This report will explore how growth and transit investment have been linked in the past,
and how they can be linked today.

                                                            6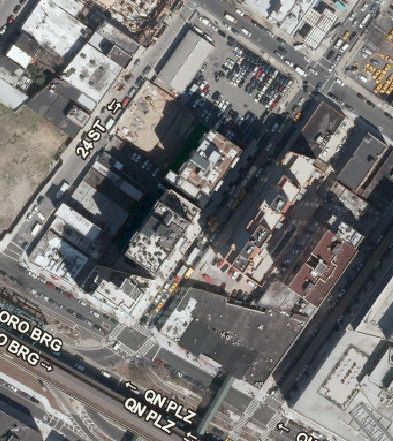
Rapid Transit as a de Facto Master Plan

The expansion of the urbanized areas of New York City, beyond the crowded mid-nineteenth century port cities of New
York and Brooklyn, followed the path of rapid transit lines. Prior to about 1880, when steam-powered elevated railroads
began service, Manhattan’s population was largely concentrated below Central Park2, and residential patterns were deter-
mined by the maximum distance people could reasonably walk or travel by horse-drawn vehicles. 3 Similarly, before the
mid-1880’s, when “els” began service in Brooklyn following the completion of the Brooklyn Bridge4, Brooklyn’s developed
area was north and west of Prospect Park and along the waterfront from Red Hook to Williamsburg.5

Manhattan had elevated lines on Sixth and Ninth Avenues on the West Side and Second and Third Avenues on the East
Side. North of 110th Street, the Ninth Avenue “el” switched to Eighth Avenue, ending at 155th Street.6

In Brooklyn, an extensive network of new elevated lines and older surface lines that began as excursion lines to Coney
Island came into existence by the early 20th century. 7 The Brooklyn “els” accessed Manhattan only at the Park Row end
of the Brooklyn Bridge and, after the opening of the Williamsburg Bridge, at Delancey and Essex Sts. Between 1888 and
1902, the Third Avenue elevated rail line was extended into the Bronx, extending to Bronx Park, at 200th St.8

The construction of the elevateds nearly coincided with the 1879 enactment of the Old Tenement Law, which effectively
mandated the characteristic “dumbbell tenement” layout9 in which interior rooms in a walk-up apartment building, usually
five or six stories, had windows on a narrow enclosed courtyard.

The combination of elevated rapid transit service and the tenement law produced a distinctively uniform pattern of land
use. As areas became accessible, they were developed rapidly with tenements. Figure 1 shows tenement development,
mainly Old Law, in a section of Yorkville in Manhattan in 1924, from East 86th Street at the lower left to East 91st St. at
the upper right, and from Third to First Avenues, with the Third Avenue and Second Avenue Els visible.

 Figure 1: Old Law
 Tenements in the Shadow
 of the Els, Yorkville, 1924

Source: http://maps.nyc.gov/
doitt/nycitymap/

2          A visualization of Manhattan’s population density over time is found at Eric Jaffe, “Watch 210 Years of Manhattan Densification in 2 Min-
utes,” https://www.citylab.com/equity/2015/06/watch-210-years-of-manhattan-densification-in-2-minutes/394736/.
3          Roger P. Roess and Gene Sansone, Wheels That Drove New York: A History of the New York City Transit System, Springer, 2014, Chapters 4 and 6.
4          Ibid., Chapter 6.
5          See a 1879 Currier and Ives view of the City of Brooklyn, https://www.loc.gov/pictures/item/90715974/.
6          A map of the Manhattan elevateds can be found at http://stuffnobodycaresabout.com/wp-content/uploads/2014/09/Map-Elevated-System-
Manhattan-1881.jpg.
7          A map of the Brooklyn elevated system at its maximum extent can be found at http://brooklynanalog.blogspot.com/.
8          “History of the Bronx 3rd Ave El,” http://bronxtimetraveler3.weebly.com/history.html.
9          A diagram of a “dumbbell tenement” can be found at https://thegildedage.wikispaces.com/Dumbbell+Tenement.
                                                                           7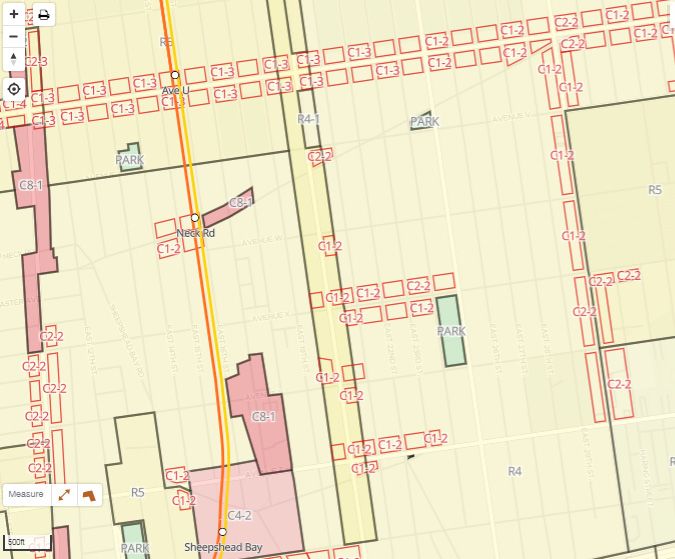
Figure 2: New Law
 Tenements by the
 Subway in Longwood,
 Bronx, 1924

Source: http://maps.nyc.gov/
doitt/nycitymap/

As a consequence of the construction of the elevateds, Manhattan south of 155th Street, northern Brooklyn and the
lower portions of the Bronx along Third Avenue were already densely urbanized before the first subway opened in 1904.
Because the subways were expected initially to be privately operated and self-supporting, negotiation of the early subway
contracts required achieving a balance between serving existing urbanized areas and opening up new areas to develop-
ment. Since the existing developed areas would provide lucrative revenues and in contrast the new areas, initially, would
produce little revenue, the private operators were reluctant to enter new territory. 10

The contracts, known as Contracts One through Four, with the last two, which had the greatest impact, known as the
Dual Contracts, succeeded in opening large areas of the city to residential development. The Dual Contracts11, which
opened up the northern and eastern Bronx, western Queens and parts of southern and eastern Brooklyn to residential
development, finally enabled the city to ameliorate the problem of overcrowding and disperse its growing population into
less dense “subway suburbs”.12

Like the advent of the elevateds, the construction of the subways was accompanied by changes in building regulations,
and in combination, these established the land use pattern in the growing areas of the city. In 1901, the state of New
York enacted the New Tenement Law13, which upgraded standards for light and air to interior rooms and ensured that a
25-foot-wide lot would no longer suffice for an apartment building.

In 1916, as a continuation of the same reform impulse that led to tenement reform and the construction of the subways,
New York City enacted its first zoning resolution. The 1916 Zoning Resolution included standards for use, height and
lot coverage, but these were generally permissive, and in the developing areas of the city served by the Dual System the
most influential restriction on development was the requirement that any building taller than six stories be fireproof.14
Because new “semi-fireproof” apartment buildings built with brick fire walls, but wood joists supporting the floor and
roof, were affordable to a much larger share of the population than fully non-combustible buildings that could be much
taller under zoning, six stories became an effective height limit over large areas of the city.

Figure 2 shows New Law Tenements developed near the Westchester Ave. line (now the 2 and 5), in Longwood, the
Bronx in 1924. While elevated, the Westchester Avenue line is considered a “subway,” constructed in the early 1900’s

10        The history of the city’s contracts in the early 1900’s with private firms (Interborough Rapid Transit and Brooklyn Rapid Transit) to build
and operate the subways is retold in Clifton Hood, 722 Miles: The Building of the Subways and How They Transformed New York, The Johns Hopkins Uni-
versity Press, 1993, and Peter Derrick, Tunneling to the Future: The Story of the Great Subway Expansion That Saved New York, New York University Press,
2001.
11        An image of the Dual Subway System can be found at http://academic.brooklyn.cuny.edu/history/burrows/NYC/Documents/Hood5.jpg.
12        Derrick, Chapter 7, “Impact of the Dual System.”
13        An image of the evolution of New York City tenement plans, with the New Law as the final plan, can be found at http://www.columbia.
edu/itc/architecture/wright/6769_2002/images/week5/v01.jpg.
14        Tenement House Act of 1901, §11 and McKinney’s Consolidated Laws of New York, Book 35A, Multiple Dwelling Law, Edward Thomson Com-
pany, 1931, §101.

                                                                           8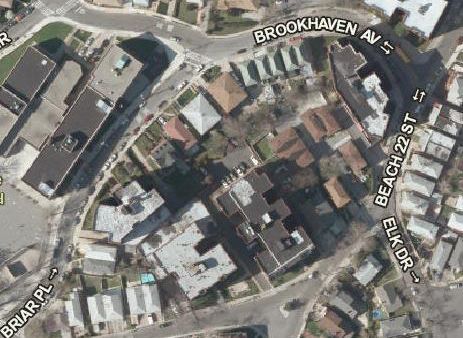
under Contract 1.15 Note the high lot coverage and lack of open space. The neighborhood was hit hard by abandonment
in the 1970’s, and many of these buildings no longer exist. At the time the subway was built, however, the interaction of
subway accessibility with the building laws of the day produced densities that, while an improvement over the conditions
on the Lower East Side, remained quite high.

Beginning in the late 1920’s the city undertook construction of the Independent Subway System, to be a municipally
operated competitor to the two private operators, by then Interborough Rapid Transit (IRT) and Brooklyn-Manhattan
Transit (BMT). To be financially viable, the Independent System largely had to serve existing built-up areas and take pas-
sengers away from the existing operators; this helped precipitate the merger of the three operators under public owner-
ship in 194016. The only IND line that served largely undeveloped territory was the Queensboro Line (today’s E, F, M and
R), which opened a series of neighborhoods along Queens Boulevard including Rego Park, Forest Hills, Kew Gardens and
Briarwood to dense multifamily development.

As with the original four private subway contracts, the advent of the IND System – the first phase was largely opened
between 1932 and 194017 – was concurrent with changes to building regulations that shaped the new housing devel-
oped near its stations. In 1929 the New Tenement Law was replaced by the Multiple Dwelling Law (MDL). Because
developments with building permits under the New Law at the time of enactment of the MDL were allowed to continue
to completion, and the post-1929 Great Depression then brought new housing construction largely to a halt for sev-
eral years, the impact of the MDL was felt only briefly in the late 1930’s and early 1940’s and then, after another halt to
construction, after World War II. The MDL increased standards for yards and courts and provided better light and air to
apartments.18

The aims of the MDL were reinforced by a 1944 citywide zoning text amendment. The City Planning Commission,
anticipating a postwar building boom, and not wanting to recreate the density of the neighborhoods of six-story apart-
ment buildings that grew in the wake of subway construction in the 1910’s and 1920’s, manipulated the tools provided in
the 1916 zoning to effectuate a citywide reduction in zoned densities. The ubiquitous six-story apartment building would
need to be set back from the street and cover less of its lot.19 The Commission wrote in its report:

       Apartment house construction in the Boroughs of the Bronx, Queens, and Brooklyn has been and continues to be planned
       with excessive coverage. with structures placed on the building line and without setting aside a reasonable portion of the
       land for open space.The lack of opportunities for recreation and healthful living is self evident…

       Certain opponents [of the proposed amendment] stated that six-story, non-fireproof apartment buildings, so common
       in New York City, would be outlawed by [the proposed changes. On the contrary], in order to build such apartments to
       their previous height it would be necessary merely to set the building back...One of the principal reasons for the proposed
       amendments is to provide more space, light and air for multiple dwellings.20

The consequences of the MDL and the 1944 zoning changes were that the Queens Boulevard corridor developed mark-
edly differently from its predecessors. While still built out with relatively dense apartment buildings, apartments had far
more light and air and the streetscape was noticeably landscaped, with buildings set back, rather than lined with building
facades. Figure 3 shows an early postwar neighborhood along the winding Yellowstone Boulevard in Forest Hills, Queens,
near the 67th Avenue station of the Queens Boulevard subway line, at upper left.

In the postwar period, the city continued to make incremental improvements that brought subway service to the less
developed outlying areas of the city. In 1956, the IND Rockaway Line opened for service, connecting the Liberty Avenue
elevated in Queens, part of the IND Fulton Street (Brooklyn) line, to the Rockaway Peninsula. The Rockaway line used
an old Long Island Railroad right-of-way but had much more capacity and direct service into Downtown Brooklyn and
15        Clifton Hood, “Subways, Transit Politics, and Metropolitan Spatial Expansion,” in David Ward and Olivier Zunz, eds. The Landscape of Mo-
dernity, Russell Sage Foundation, 1992, pp. 195 and 201.
16        Hood, 722 Miles, pp. 203-213
17        Mark S. Feinman, “History of the Independent Subway,” https://www.nycsubway.org/wiki/History_of_the_Independent_Subway.
18        McKinney’s Consolidated Laws, op.cit., §26.
19        New York City Planning Commission, Report on Amendments of the Zoning Resolution of the City of New York Affecting Height and Area, Novem-
ber 1, 1944.
20        Ibid., pp. 10, 26-27

                                                                         9
Figure 3: Multiple
Dwellings in Forest Hills,
Queens, 1951
Source: http://maps.nyc.gov/
doitt/nycitymap/
Manhattan.21 In 1957, the Dyre Avenue line began operations as a through service to Manhattan. Once a commuter line
ending at the Harlem River Yards at the southern tip of the Bronx, the Dyre Avenue route had been operated as a sub-
way shuttle since 1941.22
Given the history of the linkages between transit expansion and residential growth one might expect that the areas
made newly accessible by these investments would be redeveloped with apartment buildings. At first, this did occur. For
example, in 1959 a certificate of occupancy was issued for a six-story apartment building at 530 Briar Place, a short walk
from the then-new Mott Avenue subway station on the Rockaway Line. In 1963 a certificate of occupancy was issued
for a six-story apartment building on an adjoining lot at 22-04 Collier Ave. At about the same time, a third certificate of
occupancy was also granted for a six-story apartment building on a lot adjoining the Collier Avenue building, 439 Beach
22nd Street.23
Figure 4: Three “Pre-
1961” Apartment
Buildings on a City Block
in a Low-Density Zoning
District, Far Rockaway,
Queens, 2012
Source: http://maps.nyc.gov/
doitt/nycitymap/
21 Ira Henry Freeman, “Rockaway Trains to Operate Today,” The New York Times, June 28, 1956, https://timesmachine.nytimes.com/timesma-
chine/1956/06/28/84703811.pdf.
22 “Subway Trains Run to Dyre Ave.”, The New York Times, May 7, 1957, https://timesmachine.nytimes.com/timesma-
chine/1957/05/07/84726091.pdf.
23 The certificates of occupancy can be viewed in the New York City Department of Buildings’ information system, http://a810-bisweb.nyc.
gov/bisweb/bsqpm01.jsp.
10However, these were to be the last apartment buildings in this growing neighborhood. The building rules had once again
changed, and the 1961 zoning had gone into effect. (The two buildings completed in 1963 were allowed to finish con-
struction under the old zoning). The block where these three buildings stand was formerly a D area district and a Class
1 height district. Those districts in combination allowed six-story residential buildings, provided that they were set back
several feet from the street. In 1961 the block had been zoned R4, a low-density residence district. While in theory the
district allowed an apartment building on an extremely large lot, in a moderately urbanized area like Far Rockaway, the
district effectively limited new housing to small homes. Figure 4 shows the three apartment buildings in 2012, surround-
ed by small homes protected from redevelopment by the low-density zoning.
The 1961 Zoning: Breaking the Link between Transit and Housing
The 1961 Zoning Resolution thus broke the heretofore almost automatic linkage between subway expansion and new,
dense residential construction by interposing a regulatory barrier in the form of use and bulk restrictions and increased
off-street parking requirements. The 1961 zoning had a hierarchy of residential districts, from R1 and R2 (single-family
detached housing only) to R9 and R10 (the highest-density residence districts, with maximum floor area ratios of 7.52
and 10, the latter of which could be increased to 12 by providing an open space amenity). The R9 and R10 districts
and their commercial equivalents were mapped in Manhattan south of 110th Street and in Downtown Brooklyn. These
districts allowed a high-rise tower covering 40 percent of its lot (higher on small sites). This building type became the
character of many Manhattan streets, particularly north-south avenues that had been lined with Old Law tenements in
the days of the “els”.
In the R6, R7 and R8 medium-density zoning districts widely mapped in the Bronx, Brooklyn and Queens, Floor Area Ra-
tios, essentially a 1961 invention, and lot coverage requirements were established on a sliding scale that favored low-rise
housing types on most available lots. Apartment buildings at the maximum permitted floor area ratios (2.43, 3.44 and
6.02, respectively) were possible on large lots in the “tower-in-the-park” configuration, but the assemblage of such large
lots depended on publicly funded housing programs that became increasingly unpopular in the 1960’s due to concerns
about neighborhood scale and displacement of residents and businesses. The R3-2, R4 and R5 districts were effectively
attached-rowhouse districts at floor area ratios of .5, .75 and 1.25, respectively. These districts were mapped widely in
the boroughs outside Manhattan.
The best source on the thinking behind the decisions on where to map the specific zoning districts is an oral history
transcript by Edwin Friedman, a former New York City planner. Friedman states:
Available statistics, data from surveys on existing and emergent trends and developments, interviews with experts and prac-
titioners and careful analysis led to the conclusion that future land demand would be determined more by internal shifts of
people and jobs than by appreciable changes in total population or employment…
The single most important objective of residential recommendations was to effectuate more evenly distributed residential
densities without impinging upon individual freedom of locational choices.This objective resulted from the conclusion that
overbuilding in some parts of the City was only at the expense of the sterilization of other parts.24
The planners of the 1961 zoning were comfortable in limiting residential densities because they saw a slow-growing city.
As stated in the 1958 planning study that formed the basis for the proposed new zoning resolution:
Projections of the City’s population anticipate a total of 8,340,000 persons in 1975, an increase of 470,000 over the esti-
mated 1957 figure of 7,870,000. It has become increasingly clear that the City is approaching a population plateau and is
unlikely to experience either sharp net gains or losses in the future...25
24 Edwin Friedman, The 1961 Zoning, p. 1, https://archive.org/details/1961zoning00frie.
25 Voorhees, Walker, Smith and Smith, Zoning New York City: A Proposal for a Zoning Resolution for the City of New York, New York City Planning
11The relatively conservative projection of population growth – New York City did not in fact exceed this figure until the
current decade26 – understates the shortcomings of the 1961 zoning map. The 1958 planners projected a much larger
average household size into the future, thus underestimating the number of housing units needed. A total of 2,854,000
housing units were projected for 1975, based on an average household size of 2.9.27
By 2016 the average household size in New York City, according to the American Community Survey (ACS), was 2.68.
The difference may seem small but with a population in households of 8,360,689, again according to the ACS, an addi-
tional 236,664 occupied housing units are needed with the smaller average household size.
The city in fact exceeded the Voorhees, Walker 1975 housing unit projection by 1970, and continued to gain housing
units, rising to an estimated 3,463,870 by 2016 (Table 1). Manhattan’s count of housing units well exceeds the 1958 plan’s
“zoned capacity.” The borough never lost the number of units anticipated by Voorhees, Walker – likely attributable to the
curtailing of large-scale urban renewal schemes in the 1960’s. Moreover, likely under pressure from real estate interests,
the enacted 1961 zoning mapped the highest-density, 10 FAR residential districts over a much wider area in the Manhat-
tan core, located south of 96th Street on the East Side and 110th Street on the West Side, than originally proposed.28
Despite these later changes, Manhattan became the borough most constrained by zoning, with the highest land values,
market rents and sale prices. The Edwin Friedman narrative acknowledges that many areas were zoned at low densities,
relative to the actual built context, in anticipation of future urban renewal:
The philosophy underlying the R7 designation was that R7 represented the highest density district in which amenities and
facilities could be provided adequately and economically for middle- income families. Implicit in this philosophy was the idea
that where urban renewal write-down was used, subsidy should be provided in such a manner that desirable density levels
would be possible.29
The Bronx and Brooklyn exceeded the Voorhees, Walker 1975 projection by 1970, and then lost large numbers of hous-
ing units during the city’s period of population decline in the 1970’s. By 2016, both boroughs’ housing stock well exceed-
ed the projection and each was over 90 percent of the theoretical “zoned capacity” calculated in the 1958 plan. Queens
did not exceed its projection for 1975 until 1990, but by 2016 also exceeded 90 percent of 1958 zoned capacity. Staten
Island exceeded the Voorhees, Walker projection for 1975 by 1980 but stood at only 72 percent of its theoretical 1958
zoned capacity by 2016. However, the large amount of land in that borough subsequently preserved as parks, wetlands
and other open areas makes the denominator in this calculation questionable.
Calculations of zoned capacity in New York City involve difficult measures of “buildable land” and “development sites”
and assumptions about the size of housing units and the amount of land needed for commercial uses and community
facilities. The Voorhees, Walker calculations should not be seen as exact. What they do tell us is that the drafters of the
1961 zoning did not leave a large margin for future growth. No doubt they believed that their successors would adjust
the zoning map if it proved to be inadequate. The land use process was relatively short and simple in the early 1960s;
there were no community boards and no environmental review.
The 1961 zoning also created “manufacturing zones” with M prefixes, as well as C8 “general service” commercial dis-
tricts, in which residences were prohibited. This was in contrast to the pre-1961 zoning’s “unrestricted” use districts,
corresponding to many of the same locations. Unrestricted districts permitted residences.
Commission, 1958, p.5.
26 The Department of City Planning estimates that, accounting for the 2010 Census undercount, the city’s population was 8.24 million in
2010. The Census Bureau estimates that as of July 1, 2017, the city’s population was 8,622,698. See http://www1.nyc.gov/site/planning/data-maps/
nyc-population/current-future-populations.page.
27 Voorhees, Walker, Smith and Smith, op. cit., pp. 6-7.
28 The highest-density district was R9 in the original proposal and R10 in the adopted proposal. There were also equivalent commercial
districts including C1-9, C2-8, C4-6, C4-7, all C5 districts and C6-4 and higher suffix districts. The Department of City Planning’s Zoning History
webpage (https://www1.nyc.gov/site/planning/about/city-planning-history.page) has scans of both the Voorhees, Walker proposal and the adopted
1961 zoning maps, allowing for comparison.
29 Friedman, op. cit., p. 46.
12This use restriction was based on incompatibility of residences and industrial uses and the desire to reserve large areas
for the needs of industry:
Residential uses…are excluded from Manufacturing Districts to protect residences from industrial traffic and all other
objectionable influences, as well as to prevent spotty residential development from breaking up large tracts or otherwise pre-
empting land better suited for industrial use.30
However, the decision to separate residences and industry removed the as-of-right capacity to adjust the land use in an
area consistent with market forces. From now on, a specific act by the land use authorities would be needed to change
an industrial zone to residential. Thus the accuracy of the Planning Commission’s guess as to the future land needs of in-
dustry became a critical issue. In fact, the industrial sector rapidly declined after 1961.31 Nonetheless, successive Mayoral
administrations sought symbolically to demonstrate their commitment to industry by preserving manufacturing zoning
and excluding residences.32
Table 1: Housing Units:
Voorhees, Walker
Projected and Census
Bronx Brooklyn Manhattan Queens Staten Total, New
Island York City
Voorhees, 498,000 900,000 607,000 746,000 103,000 2,854,000
Walker 1958:
Projected, 1975
Voorhees, 577,000 1,129,000 710,000 930,000 249,000 3,595,000
Walker 1958:
Zoned Capacity
1970 508,789 902,622 714,593 708,316 89,961 2,924,281
1980 451,118 881,399 754,796 740,129 118,968 2,946,410
1990 440,955 873,671 785,127 752,690 139,726 2,992,169
2000 490,659 930,866 798,144 817,250 163,993 3,200,912
2010 511,896 1,000,293 847,090 835,127 176,656 3,371,062
2016 525,788 1,031,125 875,990 851,576 179,391 3,463,870
2016 as a 91% 91% 123% 92% 72% 96%
percent of 1958
zoned capacity
Source: Voorhees, Walker, Smith and Smith, Zoning New York City, p. 6; U.S. Census, 1970-2010;
American Community Survey, 2016
30 Voorhees, Walker, Smith and Smith, op. cit., p. 177.
31 Department of City Planning, “Employment Patterns in New York City: Trends in a Growing Economy,” July 2016, http://www1.nyc.gov/
assets/planning/download/pdf/data-maps/nyc-economy/employment-patterns-nyc.pdf, p. 12.
32 See, e.g., City of New York, Office of the Mayor, “Mayor de Blasio and Speaker Mark-Viverito Unveil Action Plan to Grow 21st Century
Industrial and Manufacturing Jobs in NYC,” November 3, 2015, http://www1.nyc.gov/office-of-the-mayor/news/780-15/mayor-de-blasio-speaker-
mark-viverito-action-plan-grow-21st-century-industrial-and#/0.
13Restoring the Relationship between Transit and Residential Growth
The consequence of the planning decision made in the late 1950’s to jettison a permissive residential zoning framework,
and enact a relatively restrictive one, was that when the city’s population began to grow in the 1980’s, planners faced
an uphill battle to persuade communities and elected officials to create land capacity for new housing in locations ap-
propriate for additional density. Throughout this period of planning for growth, the policy has been to concentrate new
housing largely in a band of neighborhoods in the Manhattan Core, upper Manhattan, the South Bronx, Western Queens
and Northern and Central Brooklyn.33 These areas are well-served by transit and characterized in many cases by low
car ownership. In a 2013 study of residential parking, the Department of City Planning characterized the neighborhoods
now generally experiencing housing growth outside the Manhattan Core as the “Inner Ring,” and the neighborhoods of
the Bronx, Brooklyn and Queens more distant from the core the “Outer Ring.”34 Figure 5 shows these geographies.
Figure 5: Manhattan
Core, Inner and Outer
Ring Geographies
Source: New York City
Department Of City Planning,
Inner Ring Residential Parking
Study, p. 19
In 1973, the city’s population was still in decline. Nonetheless the City Planning Commission, alarmed by the drop in new
housing construction, adopted “infill” zoning in “predominantly built-up” areas zoned R4 and R5.35 This increased residen-
tial densities in many areas in the northeast and east Bronx, southern Brooklyn and western Queens, effectively permit-
ting three-story multiple dwellings. This was still roughly half the density of the six-story apartment buildings prohibited
in 1961. However, the affected zoning districts were mapped both near transit and in auto-dependent areas with high car
ownership. This change, although favorable to housing production, could not be sustained in the face of community op-
33 For the period of 2010 to 2017, see New York City Department of City Planning, “NYC Housing Production Snapshot,” http://www1.nyc.
gov/assets/planning/download/pdf/about/dcp-priorities/data-expertise/nyc-housing-production-snapshot-info-brief.pdf.
34 New York City Department of City Planning, Inner Ring Residential Parking Study, December 2013, p. 19, https://www1.nyc.gov/assets/plan-
ning/download/pdf/plans-studies/inner-ring-residential-parking/inner_ring_complete.pdf.
35 CP21965A, http://www1.nyc.gov/assets/planning/download/pdf/about/cpc/19730117.pdf.
14position. The applicability of “infill” zoning was scaled back in 1987 in response to concerns, particularly in Queens, that
it had dramatically altered the character of small-home areas.36
Beginning in the 1980’s, more successful efforts to overturn, the zoning restrictions of 1961 began to be enacted, and
zoning tools became available to permit mid-density apartment buildings on smaller lots. These changes were better
focused on areas that were accessible to the subway.
The first major post-1961 zoning action to promote more traditional apartment buildings near transit was the Qual-
ity Housing zoning text amendment of 1987.37 Quality Housing built upon an earlier, less successful zoning amendment
that allowed 1961 bulk provisions to be waived, but only by special permit.38 It also incorporated “contextual” districts
created earlier in the 1980’s to ensure that zoning better matched traditional streetscapes, mainly in Manhattan. Quality
Housing rewrote the as-of-right bulk rules for the medium-density residential zoning districts (R6, R7 and R8) that were
widely mapped in the city’s subway corridors in the Bronx, Brooklyn and Queens and in upper Manhattan. By permit-
ting increased lot coverage and a higher floor area ratio on “wide street” (75 feet or wider) frontages, Quality Housing
restored the ability to construct as-of-right squat, high-coverage apartment buildings that were similar in massing to the
buildings that prevailed under the zoning prior to 1961.
Quality Housing was a necessary, but insufficient condition to revive housing construction near transit outside the high-
income portions of the Manhattan core. The economy needed to strengthen, broadening the scope of feasible private
investment to include new apartment buildings in broad areas of upper Manhattan, the Bronx, Brooklyn and Queens, and
the City needed to begin to commit substantial capital budget resources to new construction affordable housing. These
conditions began to come together after the year 2000, and for the first time since the 1960’s and early 1970’s, the city
had more than 20,000 new housing permits for six years in a row, 2003 to 2008, and again in the current decade (2014,
2015 and 2017).39
An additional spur to new housing construction was the decision by the Department of City Planning to begin a wide-
ranging program of neighborhood rezonings. For example, in 1961 the area along Broadway in Brooklyn south of the
Williamsburg Bridge was zoned M1-1, a low-density manufacturing zone prohibiting residences, with a high parking re-
quirement for new buildings. It bore little relation to the local context which included remnants of what had once been
downtown Williamsburg, before the bridge, including a landmarked bank building and a well-known restaurant. The neigh-
borhood was within walking distance of the Marcy Avenue station on the Broadway elevated line. In 1998, the area was
rezoned to C4-3, equivalent to the R6 district for residential buildings.40 The rezoning led to the construction of several
residential buildings and the conversion of a large existing industrial loft building to residential.
Also in 1998, the city rezoned Downtown Flushing, In Queens. As in the Williamsburg Bridge neighborhood, a large area
west of Main Street, within walking distance of the Main Street station on the Flushing subway line, had been zoned M1-1.
The rezoning made a large portion of this area C4-2, also equivalent to R6 for residential buildings. The central down-
town area was rezoned from C4-2 to C4-3, keeping the residential density constant but lowering the parking require-
ment for non-residential uses.41 The Downtown Flushing rezoning coincided with an influx of immigrants that greatly
increased the demand for housing and as a result, touched off widespread development.
With the success of these rezonings, the Department of City Planning began to increase the scope and ambition of its
rezoning proposals. In 2001, Long Island City was rezoned. Prior to the rezoning, the core area of Long Island City, near
Queens Plaza, accessible to multiple subway lines, was zoned with a combination of 2 and 5 FAR manufacturing zones,
prohibiting residential use. The rezoning increased densities and allowed residential use.42 By 2018 the rezoning had
transformed the Long Island City core into a forest of high-rise, mainly residential buildings (Figure 6).
36 N880172ZRY, http://www1.nyc.gov/assets/planning/download/pdf/about/cpc/880172.pdf.
37 N870197(A) ZRY and N 870385(A) ZRY, http://www1.nyc.gov/assets/planning/download/pdf/about/cpc/870385a.pdf.
38 CP-23042, January 28, 1976, http://www1.nyc.gov/assets/planning/download/pdf/about/cpc/CP23042.pdf.
39 New York City Rent Guidelines Board, 2018 Housing Supply Report, May 24, 2018, p. 16, https://www1.nyc.gov/assets/rentguidelinesboard/
pdf/18HSR.pdf.
40 C 980077 ZMK, http://www1.nyc.gov/assets/planning/download/pdf/about/cpc/980077.pdf.
41 C 960566 ZMQ, http://www1.nyc.gov/assets/planning/download/pdf/about/cpc/960566.pdf.
42 C 000406 (A) ZMQ, http://www1.nyc.gov/assets/planning/download/pdf/about/cpc/000406a.pdf.
15Figure 6: Residential
Growth in Queens Plaza
North Area, Long Island
City, 1996 and 2012
Source: http://maps.nyc.gov/
doitt/nycitymap/
1996 2012
The Bloomberg mayoral administration followed with additional rezonings that were profoundly consequential for
transit-oriented housing growth in Brooklyn and Queens. These included Downtown Brooklyn in 200443; Greenpoint-
Williamsburg in 200544 and Astoria in 2010.45
Figure 7: Melrose
Commons, 1996 and 2012
1996 2012
Source: http://maps.nyc.gov/doitt/nycitymap/
43 C 040171 ZMK,http://www1.nyc.gov/assets/planning/download/pdf/about/cpc/040171.pdf.
44 C 050111(A) ZMK, http://www1.nyc.gov/assets/planning/download/pdf/about/cpc/050111a.pdf.
45 C 100199 ZMQ, http://www1.nyc.gov/assets/planning/download/pdf/about/cpc/100199.pdf.
16In the 1980’s the South Bronx had substantial zoned capacity for residential growth, after the large housing losses in the
1970’s. Additionally, the city acted to update the zoning map in the areas of greatest loss. These rezonings supported
publicly-assisted affordable housing construction. The rezonings included Melrose Commons in 1994 (Figure 7)46, Mor-
risania in 200347, and Third Avenue/Tremont in 2010.48
In the post-fiscal crisis period the MTA again began to open new subway stations in areas with the capacity to accom-
modate residential growth. For new transit to support population growth a specific decision had to made to update the
zoning to make it happen. For example, the Archer Avenue subway line opened in 198849 in an area mostly zoned for
low-density housing and industry. Zoning densities were only increased in the vicinity of the new Jamaica-Van Wyck sta-
tion in 200550 and around the two new Downtown Jamaica stations, Sutphin Blvd. and Parsons-Archer, in 2007.51
The 21st Street-Queensbridge station opened in 198952 directly adjacent to the NYCHA Queensbridge Houses. The
blocks to the east of 21st Street were, and remain as of mid-2018 medium-density manufacturing zones. Farther to the
east, rezonings to permit new residential uses occurred in the Queens Plaza North area in 200153 and in Dutch Kills in
2008.54
Only with the extension of the Flushing line (7 train) to 34th Street-Hudson Yards, opened in 201555, were a rezoning
(approved in 2005)56 and a subway extension part of a coordinated plan. The two had a common environmental review57
and the revenues from the real estate development resulting from the rezoning, especially a very high-density commercial
core, enabled the city to finance the subway.58 The Hudson Yards subway station also serves the northern area of the
West Chelsea-High Line rezoning59, also approved in 2005, and also an area of substantial residential growth.
In contrast to these wide-ranging rezonings that increased residential densities, zoning in most of Staten Island, as well as
much of the “Outer Ring” became substantially more restrictive, particularly in the 2002-13 Bloomberg years. The rezon-
ings protected the character of low-density neighborhoods and limited growth in areas of relatively high car ownership.60
The Bloomberg administration articulated a continued strategy of transit-oriented growth in its PlaNYC 2030 report
in 2007.61 There is notable consistency between the Manhattan Core and Inner Ring geographies depicted in Figure 5,
the high-growth areas in the map of a “Potential Population Growth Scenario, 2010 to 2030” from PlaNYC 2030 and
the Department of City Planning’s recently published map of “Completed Housing Units in New Buildings 2010-2017, by
Neighborhood.” These maps are shown below in Figure 8.
46 C 940227 ZMX, http://www1.nyc.gov/assets/planning/download/pdf/about/cpc/940227.pdf.
47 C 030333 ZMX, http://www1.nyc.gov/assets/planning/download/pdf/about/cpc/030333.pdf.
48 C 100407 ZMX, http://www1.nyc.gov/assets/planning/download/pdf/about/cpc/100407.pdf.
49 Kirk Johnson, “Big Changes for Subways are to Begin,” The New York Times, December 9, 1988, https://www.nytimes.com/1988/12/09/nyre-
gion/big-changes-for-subways-are-to-begin.html.
50 C 050153 ZMQ, https://www1.nyc.gov/assets/planning/download/pdf/about/cpc/050153.pdf.
51 C 070314 (A) ZMQ, https://www1.nyc.gov/assets/planning/download/pdf/about/cpc/070314a.pdf.
52 MTA, “63 St Subway Extension Opened 25 Years Ago this Week,” October 31st, 2014, http://www.mta.info/news/2014/10/31/63-st-subway-
extension-opened-25-years-ago-week.
53 C 000406 (A) ZMQ, op. cit.
54 C 080429 ZMQ, https://www1.nyc.gov/assets/planning/download/pdf/about/cpc/080428.pdf.
55 MTA, “New 34 St.-Hudson Yards 7 Station Opens,” http://web.mta.info/capital/no7_alt.html.
56 N 040500(A) ZRM, http://www1.nyc.gov/assets/planning/download/pdf/about/cpc/040500a.pdf.
57 No. 7 Subway Extension - Hudson Yards Rezoning and Development Program Final Generic Environmental Impact Statement, https://www1.nyc.gov/
assets/planning/download/pdf/plans/hudson-yards/hyards.pdf.
58 Lincoln Institute of Land Policy, “Innovative Financing at New York’s Hudson Yards,” March 22, 2017, https://www.lincolninst.edu/es/news/
lincoln-house-blog/innovative-financing-new-yorks-hudson-yards.
59 N 050161(A) ZRM, http://www1.nyc.gov/assets/planning/download/pdf/about/cpc/050161a.pdf.
60 Sarah Laskow, “The quiet, massive rezoning of New York,” Politico, February 24, 2014, https://www.politico.com/states/new-york/city-hall/
story/2014/02/the-quiet-massive-rezoning-of-new-york-078398.
61 PlaNYC: A Greener, Greater New York, http://www.nyc.gov/html/planyc/downloads/pdf/publications/full_report_2007.pdf.
17Figure 8: Two Maps of
Transit-Oriented Growth
Source: City of New York, PlaNYC: A Greener, Greater New York, p. 19; New York City Department
of City Planning, NYC Housing Production Snapshot, p. 1
Consequences of Transit-Oriented Growth Policies
If the 1961 zoning did much to sever the relationship between the subway system and housing growth, the zoning chang-
es that began in 1987 with Quality Housing did much to restore it. In the R6, R7 and R8 districts, widely mapped near
subway stations outside the Manhattan core, the construction of apartment buildings at the nominal maximum floor area
ratio no longer depends, as it did after 1961, on the assemblage of large sites able to provide the required open space.
This alone would have greatly increased potential housing production. In addition, floor area ratios were increased for
development sites fronting wide streets, and widespread changes to the zoning map occurred, which in part corrected
for both the excessive mapping of manufacturing zones prohibiting new housing, and for the mapping of low-density
residence districts along major transit corridors that occurred in 1961. Finally, the city committed billions of dollars to
subsidize new construction affordable housing.
The resulting levels of new housing construction would be impressive were New York City not already so large. Even
small percentage changes in population over a decade require the number of housing units to increase by a number
representing the entire housing stock of a mid-sized American city. From 2000 to 2009 the city granted new certificates
of occupancy for 195,787 housing units.62 Total housing units, according to the U.S. Census, increased by 170,150.63 While
the two figures are not directly comparable, they are consistent, since the net change in housing units from one Census
to the next should be smaller than the new construction total due to demolitions and conversions of housing units exist-
ing as of the beginning of the census decade. By the Department of City Planning’s calculation, adjusting for 2010 Census
undercount of occupied housing units, this housing unit change supported a population increase from 8,008,278 in 2000
62 Rent Guidelines Board, op. cit., p. 19
63 New York City Department of City Planning, http://www1.nyc.gov/assets/planning/download/pdf/data-maps/nyc-population/census2010/
tothousing_vacant_2000-2010nyc.pdf.
18to 8,242,624 in 201064, about 234,000 or 2.9 percent. This is about the estimated population of Fremont, California, the
96th largest American city in 2017.65
From 2010 through 2017 the city granted certificates of occupancy for 135,476 housing units.66 There were, as of the
end of 2017, an unusually large number of units that had been issued permits but not completed – 79,00067 – and most
of these units will likely be completed before 2020 to qualify for expiring tax benefits. Thus the number of new housing
units completed in this decade will likely be similar, about 200,000, to the number in the previous decade.
The Census Bureau’s population estimate for New York City as of July 1, 2017 is 8,622,698.68 This represents an increase
of about 380,000 over the adjusted 2010 population, or about the estimated population of Bakersfield, California, the
53rd largest American city. The Census Bureau’s population estimates have not been highly accurate in predicting Census
counts in the past.69 Whether the city will have, as currently estimated, a much larger population gain in the 2020 Census
count than in the previous decade, on a similar housing unit increment, depends on subtle changes in average household
size that are difficult to predict.
New York City and Regional Growth
Underlying demographic trends and New York City’s strong economy propel population growth. The city’s Department
of City Planning undertook in recent decades two population projection exercises. The first, undertaken in connection
with the drafting of PlaNYC 2030 in the mid-2000s, projected that the city’s population would exceed nine million by
2030.70 The second, scaling back this prediction in light of the effects of the post-2008 economic slowdown, pushed off
the expected attainment of the nine million threshold to 2040.71
It’s easier to forecast the direction of change in the future, than the level. With the city’s fast growth in the 2010’s, per-
haps the first projection was not so far off after all. It is in any event probable that the city will pass nine million in the
next two decades.
Why can one be so confident of this? The city’s population is projected forward by modeling the demographic compo-
nents of population change – natural increase (births minus deaths) and net migration. Natural increase is positive for
the city, with an excess of births over deaths of 463,000 in the 2010-17 period.72 The department expects that natural
increase will remain consistently very large and positive over the period to 2040.73 It would seem difficult to conceive of
circumstances in which this would not be the case, short of war or economic depression which might cause prospective
parents to postpone childbearing.
64 New York City Department of City Planning, “The Census Challenge: The Final Statement,” http://www1.nyc.gov/site/planning/data-maps/
nyc-population/census-2010.page.
65 US Bureau of the Census, “Annual Estimates of the Resident Population for Incorporated Places of 50,000 or More, Ranked by July 1, 2017
Population: April 1, 2010 to July 1, 2017,” https://factfinder.census.gov/faces/tableservices/jsf/pages/productview.xhtml?src=bkmk
66 Rent Guidelines Board, op.cit., p.19
67 Department of City Planning, “NYC Housing Production Snapshot,” p. 2.
68 “Annual Estimates of the Resident Population for Incorporated Places of 50,000 or More, Ranked by July 1, 2017 Population: April 1, 2010
to July 1, 2017,” op. cit.
69 Department of City Planning, “The Census Challenge: The Final Statement.”
70 PlaNYC 2030, op. cit., pp. 4-6.
71 New York City Department of City Planning, New York City Population Projections by Age/Sex & Borough, 2010-2040, December 2013, p. 1,
http://www1.nyc.gov/assets/planning/download/pdf/data-maps/nyc-population/projections_briefing_booklet_2010_2040.pdf.
72 New York City Department of City Planning, “Current Estimates of New York City’s Population for July 2017,” http://www1.nyc.gov/site/
planning/data-maps/nyc-population/current-future-populations.page.
73 New York City Population Projections by Age/Sex & Borough, 2010-2040, op. cit., p. 7
19You can also read