Page | 1 - Vanderbilt University ...
←
→
Page content transcription
If your browser does not render page correctly, please read the page content below
Page | 1
Table of Contents
Introduction ......................................................................................................................... 4
Collaborations ..................................................................................................................... 4
Environmental Scan Results ................................................................................................ 6
Secondary Data Results ....................................................................................................... 8
Primary Data Results ......................................................................................................... 33
Needs Description ............................................................................................................. 38
Appendices ........................................................................................................................ 43
       o Appendix A: Acknowledgements ..................................................................... 44
       o Appendix B: Key Informant Interviews ........................................................... 47
       o Appendix C: Community Listening Sessions ................................................... 48
       o Appendix D: Healthcare & Community Resources .......................................... 49
       o Appendix E: Secondary Data Tables & Sources .............................................. 52

Figures and Tables
Figure 1. Methodology of the CHNA Process. ............................................................................... 5
Figure 2. Demographics of Rutherford County, US Census Bureau (2018) .................................. 8
Figure 3. Rutherford County Growth Forecasts 2015 - 2035, Nashville Metro Planning
Organization (2019) ........................................................................................................................ 8
Figure 4. Distribution of poverty in Rutherford County, US Census Bureau (2018) ..................... 9
Figure 5. Population in poverty by race in Rutherford County, US Census Bureau (2018) .......... 9
Figure 6. High school graduation rates 2011-2017, Annie E. Casey Foundation (2017) ............. 10
Figure 7. Residents that commuting in and out of Rutherford Country for work, US Census
Bureau (2018) ............................................................................................................................... 11
Figure 8. Forecasted grown of senior population in Tennessee and Rutherford County, TN
Commission on Aging and Disability (2017) ............................................................................... 12
Figure 9. Comparison in changes in median home value, US Census Bureau (2018) ................. 12
Figure 10. Share of renters and owners who are cost-burdened in Rutherford County, US Census
Bureau (2018) ............................................................................................................................... 13
Figure 11. Varying definitions of homelessness, Nashville Metropolitan Development and
Housing Agency (2018) ................................................................................................................ 14
Figure 12. Rover bus routes in Rutherford County, City of Murfreesboro (nd) ........................... 15
Figure 13. Percentages of households without a vehicle by census tract, US Census Bureau
(2018) ............................................................................................................................................ 16
Figure 14. Low food access by census tract in Rutherford County, Community Commons (2018)
....................................................................................................................................................... 17
Figure 15. Fast food restaurants per 100,000 population, Community Commons (2019) ........... 17
Figure 16. Violent crime rate per 100,000, Community Commons (2019) .................................. 18
Figure 17. Correlation of ACE score and life outcomes, CDC (2016) ......................................... 18
Figure 18. Percent of population age 19-64 that is uninsured by census tract, US Census Bureau
....................................................................................................................................................... 19

                                                                                                                                             Page | 2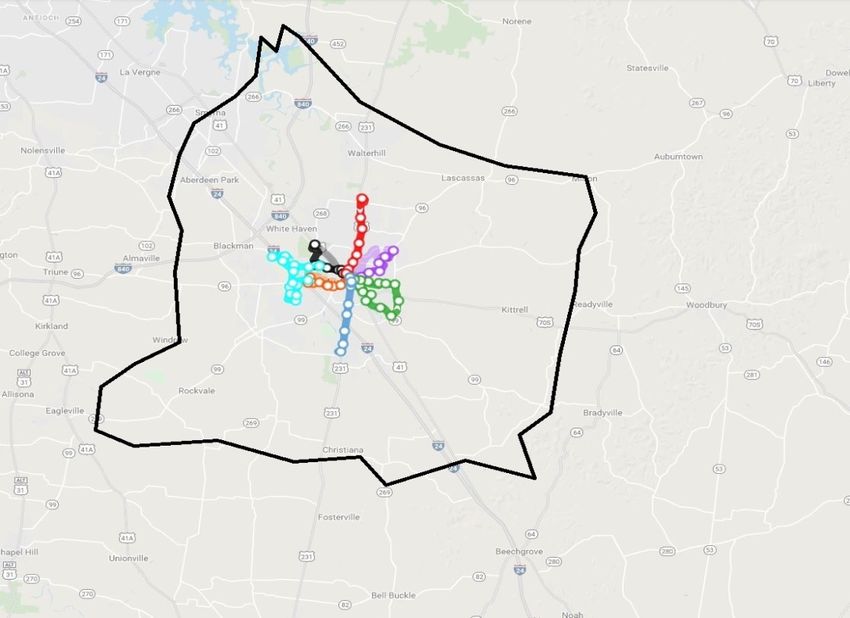
Figure 19. Uninsured rates by race and ethnicity, US Census Bureau (2017).............................. 20
Figure 20. Access to care for children by insurance status, Kaiser Family Foundation (2017) ... 21
Figure 21. Percentage of uninsured of population under age 19 by census tract, US Census
Bureau ........................................................................................................................................... 21
Figure 22. Top five leading causes of death in the US 1900-2016, CDC (2018) ......................... 23
Figure 23. Percentage of deaths in Rutherford County 2014-2016, CDC Wonder (2018) .......... 23
Figure 24. Infant Death Rates per 1,000 live births by race, Kids Count Data Center (2018) & TN
Dept of Health (2017) ................................................................................................................... 24
Figure 25. Percentage of adults that are obese, CDC (2017) ........................................................ 25
Figure 26. Obesity trends in adults 2004-2015, County Health Rankings (2018) ........................ 25
Figure 27. Rutherford County student obesity trends, CDC (2017) ............................................. 26
Figure 28. Recreation and fitness facilities per 100,000, Community Commons (2018) ............ 27
Figure 29. Cigarette use among adults, BRFSS (2016)                                        Figure 30. Percentage of adult
smokers, County Health Rankings (2018) .................................................................................... 28
Figure 31. Prescribing rates map, CDC (2017)............................................................................. 29
Figure 32. Opioid prescribing rates per 100 persons, CDC (2017) .............................................. 30
Figure 33. Drug overdose deaths in Rutherford County, TN Dept of Health (2017) ................... 30
Figure 34. Reasons people sought treatment for substance abuse, TN Dept of Mental Health and
Substance Abuse Services (2017) ................................................................................................. 31
Figure 35. Concentration of linguistically isolated households in Rutherford County, CDC
(2016) ............................................................................................................................................ 32
Figure 36. Self-reported health status of Rutherford County survey respondents ........................ 33
Figure 37. Rutherford County health summit voting results ........................................................ 38

Table 1. Provider Ratios, County Health Reports (2018) ............................................................22
Table 2. Alcohol Use, BRFSS (2018) ...........................................................................................29
Table 3. Availability/need of resources in Rutherford County ...................................................34
Table 4. Top community issues in Rutherford County listening sessions ..................................36

                                                                                                                                         Page | 3
Introduction
        Vanderbilt University Medical Center (“VUMC”) is located in Nashville, Tennessee, and
chiefly serves Tennessee, northern Alabama, and southern Kentucky. Although licensed as
Vanderbilt University Hospitals under a single hospital facility license, VUMC owns and
operates three separate hospitals: The Vanderbilt University Adult Hospital (“VUAH”), Monroe
Carell Jr. Children’s Hospital at Vanderbilt (“the Children’s Hospital”) and the Vanderbilt
Psychiatric Hospital (“VPH”). As part of a joint venture with Encompass Health Corporation,
VUMC also owns 50% of Vanderbilt Stallworth Rehabilitation Hospital (“Stallworth”).
        Non-profit hospital organizations such as VUMC are required to complete a Community
Health Needs Assessment (CHNA) and an accompanying Implementation Strategy every three
years as mandated by the 2010 Patient Protection and Affordable Care Act. The CHNA process
is designed to identify key health needs and assets through systematic, comprehensive data
collection in target communities.
        VUMC conducts the CHNA in three Tennessee counties where a large number of
VUMC’s patients live—Davidson, Rutherford, and Williamson counties. These counties are
diverse in socio-economic status, race and ethnicity, health risks and health outcomes. The
CHNA sought to better understand community concerns related to health and health care, the
social, environmental and behavioral factors that impact health, the greatest needs and assets in
communities, and strategies for improving community health and well-being – with a focus on
the underserved, low-income and minority populations. The CHNA serves as a health profile for
the community in which VUMC patients live.
        This “at a glance” excerpt provides a summary of data regarding Rutherford County. The
full VUMC CHNA report outlines the complete needs assessment process, shares results and
describes how needs were prioritized by the community in each of the three counties. The
accompanying Implementation Strategy (IS) outlines the programs and resources committed to
address these prioritized needs. Both reports can be accessed via the Community Health
Improvement Website.

Rutherford County Collaborations
        In Rutherford County, VUMC collaborated on the CHNA with Saint Thomas Health
(STH), another local non-profit hospital system. Our collaboration included nearly every
component of the planning and data collection process including interviews, listening sessions,
and community surveys; secondary data collection; and the community summit for Rutherford
County.
        VUMC also collaborated with the Rutherford County Health Department for the CHNA.
The Rutherford County Health Department and staff were critical in identifying interview
participants as well as recruiting participants and securing space for listening sessions. In
addition, the Rutherford County Health Department joined in the planning and implementation
of the community summit in Rutherford County.
        The Circle of Engagement (COE) was a group of leaders in Rutherford County that also
helped guide the CHNA process and had a strong impact on the community. The COE provided
guidance to the core planning team throughout planning the assessment, data collection, and
needs prioritization. The COE met every other month throughout the Needs Assessment process,

                                                                                         Page | 4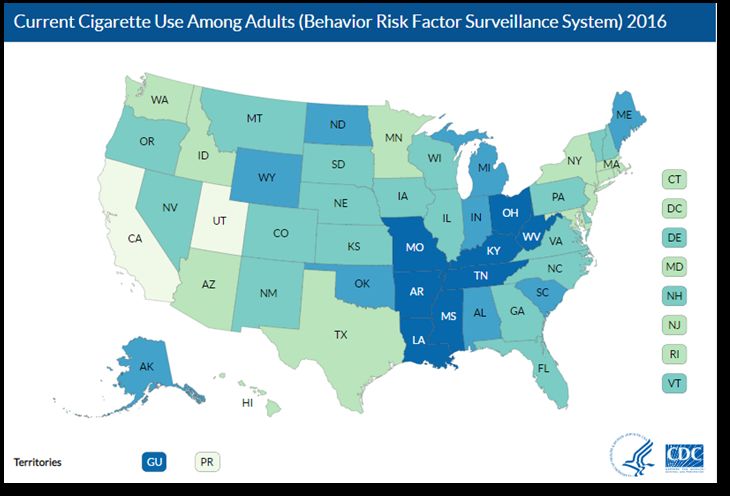
and this group also aided in community mobilization to help drive assessment participation and
build relationships.
         The CHNA approach from which this summary derives relies on secondary data and
primary data from community stakeholders and members. Input from persons representing the
broad interests of the community, including those with expertise in public health, was obtained
through face-to-face interviews, community listening sessions, and community surveys. An
environmental scan was conducted in each county to examine existing reports relevant to
community health and identify strengths, assets, and areas of improvement regarding the health
and healthcare in the community. In addition, VUMC continuously solicits written feedback on
the most recent CHNA/IS on the VUMC Community Health Improvement website. VUMC and
its collaborators benefitted from the input of over 1100 individuals across the three counties,
each sharing their time, perspectives, and experience in helping VUMC to identify significant
health needs in the community.
         In Rutherford County, the assessment methods include: 1) an environmental scan of 5
community reports from 2015-2017; 2) 26 key informant interviews with community leaders; 3)
4 community listening sessions with 60 participants; and 4) community surveys with 1,027
respondents. We also conducted an in-depth review of secondary data using indicators
recommended by the Centers for Disease Control, other national public health institutions, and
community advisory groups. These efforts culminated in a summit in Rutherford to solicit
community input in identifying and prioritizing health needs. A summary of methods and the
overall assessment process are described in the table below.

                               Figure 1. Methodology of the CHNA Process.

                                                                                        Page | 5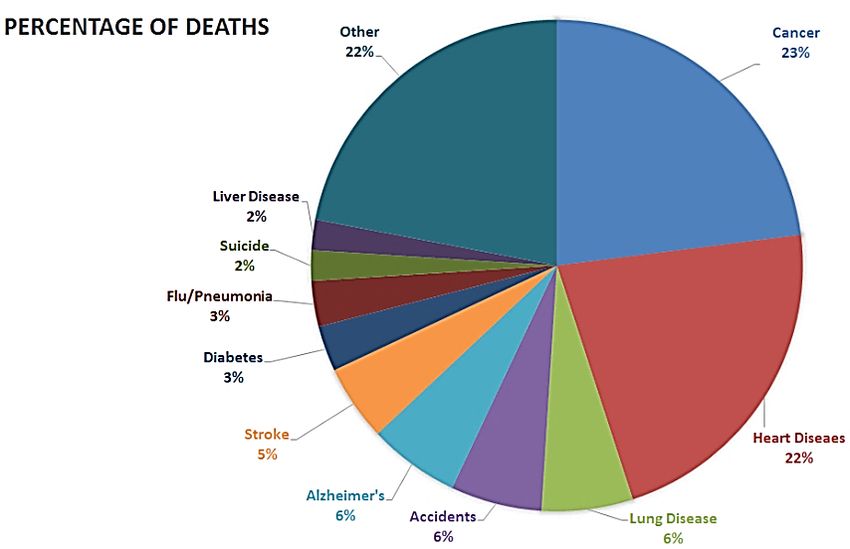
Environmental Scan Results
Introduction
        This environmental scan is a summary of health and health-related studies that provide
information, data, and common themes presented in various reports published about Rutherford
County. The purpose of the review is to examine existing data released within the last five years
relevant to community health and identify strengths, assets, and areas of improvement regarding
the health and healthcare in the community.
        The reports included in the Rutherford County review included the Community Health
Improvement Plan for 2016-19, the Consolidated Plan 2015-20 and its corresponding Action
Plan for 2017-18, Murfreesboro 2035, A Strategic Framework for Ending Involuntary
Homelessness in Rutherford County, Drive your County to the Top Ten, and Rutherford County
Health Watch.
        When examining these reports, it is important to understand the underlying and
systematic barriers affecting the health outcomes of the populations of focus. To ensure that the
populations and communities at higher risk for adverse health outcomes were included, the
review used “healthy equity buckets” as outlined in the Mobilizing for Action through Planning
and Partnerships (“MAPP”) handbook published by the National Association of County and City
Health Officials (“NACCHO”). Some of the health equity buckets that were considered in the
various reports include: economic security and financial resources; livelihood security and
employment opportunity; adequate, affordable, and safe housing; school readiness and
educational attainment; environmental quality; and availability and utilization of medical care.

Major Themes
         Rutherford County is one of the most populous counties in Tennessee and encompasses
the City of Murfreesboro, as well as other small cities, towns, and unincorporated communities.
Rutherford County is less than 30 miles south of Davidson County and the metropolitan
Nashville area. Murfreesboro and all of Rutherford County is continuing to grow in population
and becoming a major hub for economic and social growth. However, these changes and
opportunities invite challenges and obstacles that must be addressed.
         One of the top themes addressed in various reports regarding Rutherford County was
affordable housing and homelessness. Due to the constant growth, the demand for affordable
single-family housing is rising every day with an unmatched supply. Many families and young
adults are unable to find affordable housing or housing that meets their financial needs.
Additionally, many adults living in Rutherford county are cost-burdened, meaning at least 30%
of their income is spent on housing. These difficult living conditions make homelessness a
reality for some. There is also a burden and concern for Veterans and those living with
disabilities to find affordable and accessible housing to meet their needs.
         The second top theme addressed was social determinants of health, which included
poverty, education (or lack thereof), access to parks and recreation/outdoor activities, health
disparities, and violent crime. The Centers for Disease Control and Prevention (CDC) defines
social determinants of health as conditions in the places where people live, learn, work, and play
that affect a wide range of health risks and outcomes. The environmental scan found that single

                                                                                           Page | 6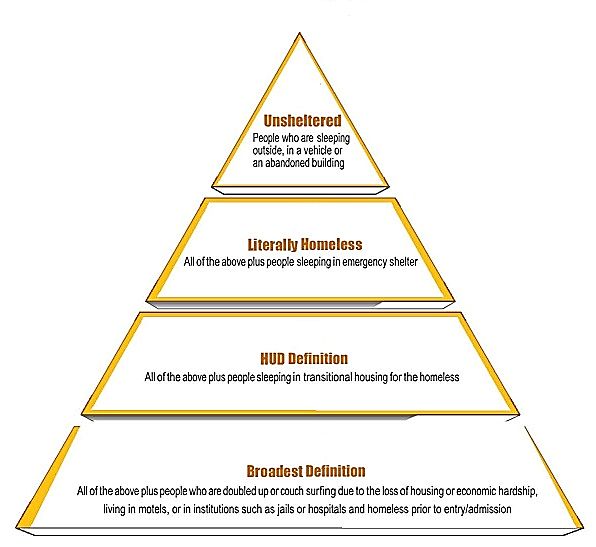
mother families, Veterans, minorities, and those living with disabilities are most affected by a
lack of societal resources in their communities. Understanding the need for improvement of the
community resources mentioned above helps to ensure that all people can lead healthy lives.
        The third and last main theme gathered from this review was wellness and disease
prevention, which included a focus on high obesity rates, heart disease, physical inactivity, and
diabetes management. Many of these health problems are affecting all residents in Rutherford
County and are easily preventable. However, some groups are more equipped to take
preventative measures. Having things like parks and recreation centers allows for easy exercise
opportunities. Additionally, sidewalks, public transportation, and safety can all help to ensure
that someone is willing and able to walk or run in their own neighborhood. Many of the at-risk
groups mentioned above (single-mother families, Veterans, minorities, and those living with
disabilities) are at an equally high risk of getting one of these preventative diseases.

Conclusion
        Overall, Rutherford County is one of the healthiest counties in the state of Tennessee.
However, there are still many community health issues that need to be addressed to improve
health outcomes for everyone in the county. By focusing on the top themes mentioned above:
affordable housing and homelessness, social determinants of health, and wellness and disease
prevention, we can begin to address the major health concerns in the county.

                                                                                           Page | 7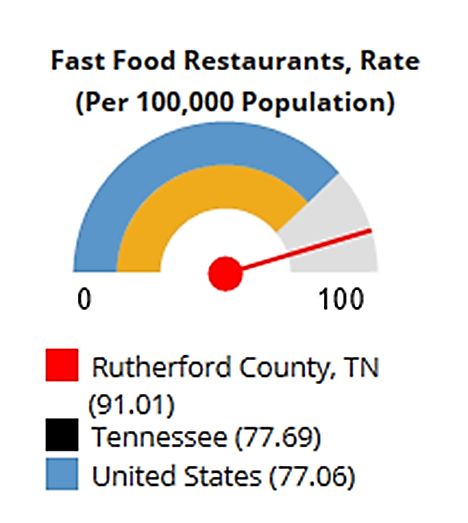
Secondary Data Results
Demographics and Socioeconomics

          Rutherford County is home to
approximately 317,157 individuals as of 2017.
Compared to the State (38) and The Nation (37),
it is a relatively young county with a median age
of 33 and seniors make up 10.1% of the
population. Similar to national and statewide
statistics, Rutherford County is growing in
racial and ethnic diversity; However, about 79%
are white. The county also has a relatively low
percentage of residents who are Hispanic
(7.6%). Rutherford county also reports that
10.1% of households speak a language other
than English compared to 21.3% of national
households. Veterans make up almost 9%
                                                      Figure 2. Demographics of Rutherford County, US Census Bureau
percent of the population in Rutherford County                                    (2018)
which is slightly higher than that of the U.S.A
(8.0%). Additionally, 10% of the population has
reported having a disability. This percentage is lower than what is reported for the state (15.4%)
and the nation (12.5%). 1

Projected Population and Job Growth

         Rutherford County is experiencing
rapid growth with a 21% increase in
population between 2010 and 2017
(Figure 3). This is almost three times
faster than the state as a whole. The
Nashville Metro Planning Organization
estimated a 42% increase in population
and a 46% increase in jobs between 2015
and 2035.2 Of note, the unemployment
rate in Rutherford County is 2.6% which
is lower than both the State (3.5%) and
National rates (4.2%). 3
                                                       Figure 3. Rutherford County Growth Forecasts 2015 - 2035, Nashville Metro
                                                                              Planning Organization (2019)

1
  US Census Bureau. (2018). QuickFacts, 2017 American Community Survey. Retrieved from
https://www.census.gov/quickfacts/fact/table/rutherfordcountytennessee,US/PST045217
2
  Nashville Metro Planning Organization. (2019). Growth Trends & Forecasts Regional Profile. Retrieved May
2018 from http://www.nashvillempo.org/growth/
3
  US Census Bureau. (2018). QuickFacts, 2017 American Community Survey. Retrieved from
https://www.census.gov/quickfacts/fact/table/rutherfordcountytennessee,US/PST045217

                                                                                                           Page | 8
Poverty

         Poverty is one of the most critical indicators of future health and well-being according to
leading health agencies such as the World health Organization (WHO). Poverty creates barriers
to accessing resources including health services, healthy food, and other necessities that
contribute to health status.
         The Federal Poverty Level is a
measure of income used to determine
poverty status. In 2018, the Federal
Poverty Level was $12,140 for an
individual and $25,100 for a family of
four. In Rutherford County, 11.8% of
residents live in poverty. While this is
much lower than both the state (16.7%)
and the nation (14.6%), this is still a
significant number. Poverty levels are
higher in some geographic areas of
Rutherford County as seen in Figure 4,
a map from the U.S. Census Bureau
where the darkest green indicates areas
with the highest rates of poverty (up to
55.6%).                                      Figure 4. Distribution of poverty in Rutherford County, US Census Bureau
         The prevalence of poverty also                                         (2018)
varies by race. In Rutherford County,
individuals who identify as “some other race” have the highest percentage of individuals
experiencing poverty (22.8%) and African Americans have the second highest percentage (19%).
Figure 5 denotes the percentage of each race that is below the Federal Poverty Level and
illustrates that the rates in Rutherford County are similar to that of the State and the Nation as a
whole. In Tennessee, individuals that identify as “some other race” have the highest percent of
population in poverty (34.2%). Native Hawaiian/Pacific Islanders are ranked second highest with
32.7% living in poverty.4

                        Figure 5. Population in poverty by race in Rutherford County, US Census Bureau (2018)

4
  US Census Bureau. (2018). Poverty Status in the Past 12 Months, 2017 American Community Survey. Retrieved
from
https://factfinder.census.gov/faces/tableservices/jsf/pages/productview.xhtml?pid=ACS_17_5YR_S1701&prodType
=table

                                                                                                                Page | 9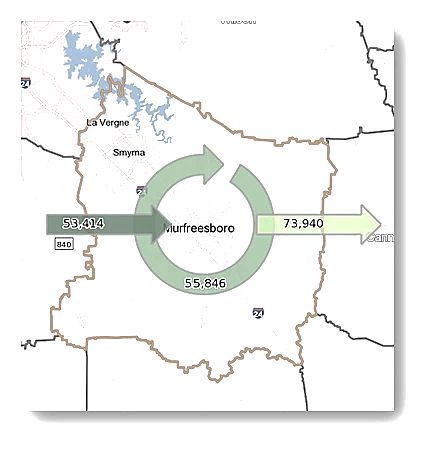
The challenges of poverty are not only an issue for many of the adults in Rutherford
County. Unfortunately, many of our children also experience these stressors, with almost 15%
currently living in poverty. This equates to more than 10,000 children in Rutherford County.
This is an improvement from the CHNA report in 2016 (17.7%). Additionally, Rutherford
County has less children living in poverty when compared to the state (24.25%) and the nation
(20.31%).5

Education

        The residents in
Rutherford County have overall
success in attaining the
traditional levels of education.
However, educational attainment
differs for many minority
populations. Educational
attainment is linked with
improved health behaviors,
longer life, and positive health
outcomes. County Health
Rankings says “better educated
individuals live longer, healthier
                                          Figure 6. High school graduation rates 2011-2017, Annie E. Casey Foundation (2017)
lives than those with less
education, and their children are
more likely to thrive.”
        In Rutherford County, 9.15% of residents over the age of 25 do not have a high school
diploma (or equivalency) or higher which equates to almost 17,000 people. However, this is still
lower than both the state (13.5%) and the nation (12.7%). As with poverty and other SDOH, the
rates for lacking a high school diploma also vary by geography and by race. In Rutherford
County, 8.4% of whites do not have a high school diploma compared to 10.6% of African
Americans. 6
        The rate of graduation serves as an indicator for increasing the percent of the population
with a high school diploma. In Figure 6, the Tennessee Department of Education and Kids
Count note that 95.3% of students graduated on time between 2016 and 2018 in Rutherford
County, which is better than the state (89.1%) and the nation (84%). There are increasing trends
in the number of people graduating on time as these graduation rates have increased about 4-5%
at the county, state, and national levels since 2011. 7

5
  Community Commons. (2019). Poverty-Children Below 100% FPL. Retrieved in May 2018 from
https://assessment.communitycommons.org/board/chna?page=3&id=408&reporttype=libraryCHNA
6
  The Annie E. Casey Foundation KIDS COUNT. (2017). Graduation Rates. Retrieved from
http://www.datacenter.aecf.org
7
  National State Center for Education Statistics. (2018). Graduation Rates. Retrieved from
http://nces.ed.gov/ccd/tables/ACGR_2010-11_to_2012-13.asp

                                                                                                          Page | 10
Employment
Opportunities for quality employment can
help ensure financial stability that impacts the
ability to live in healthy neighborhoods, purchase
healthy food, and access other factors that support
health.
In Rutherford County, there is a high
percentage of the community that is employed. In
fact, the unemployment rate is only 2.5%, which is
lower than both the state (3.3%) and the nation
(4%). However, many residents work in
surrounding counties. Figure 7 from the U.S.
Census Bureau estimates the number of residents
that commute in and out of the city each day.8
There are about 53,000 coming in and almost
74,000 going out daily. The number of residents
Figure 7. Residents that commuting in and out of
Rutherford Country for work, US Census Bureau (2018)
that are commuting out of the county daily make up
about 57% of the workforce. While many residents
do stay within the County lines for work, many residents work in Davidson, Williamson,
Cannon, and other counties with some traveling as far as Montgomery County (Clarksville, TN).
9
Senior Population
The Tennessee Commission on Aging and Disability projected in 2017 that the senior
population in Rutherford County would increase 125% between 2017 and 2030. This means that
agencies serving this population will need to strategically build capacity and resources to meet a
growing demand for their services over time—including in-home support, nutrition,
transportation, and others—to ensure this population can enjoy the highest possible quality of life
into older adulthood.10
The projected growth in the senior population is illustrated in Figure 8, showing the
percent increase in Tennessee and Rutherford County between 2017 and 2030.
8
Nashville Metro Planning Organization. (n.d.) Population & Employment Forecast for the Nashville Area MPO.
Retrieved from http://www.nashvillempo.org/growth/
9
U.S Census Bureau, Center for Economic Studies. (2018) OnTheMap (Employment). Retrieved on November 12,
2018 from http://onthemap.ces.census.gov/
10
Source: Tennessee Commission on Aging and Disability. (2017). Tennessee State Plan on Aging October 1,
2017-September 31, 2021. Retrieved from
https://www.tn.gov/content/dam/tn/aging/documents/TN_State_Plan_on_Aging_2017-2021.pdf
Page | 1137%
125%
Figure 8. Forecasted grown of senior population in Tennessee and Rutherford County, TN
Commission on Aging and Disability (2017)
Social Determinants of Health
Our health is shaped by factors such as income and education. According to the World
Health Organization, the circumstances “in which we are born, grow, live, work, and age” are
called Social Determinants of Health, and these are related to the “distribution of money, power,
and resources” within a community. “The social determinants of health are mostly responsible
for health inequities – the unfair and avoidable differences in health status seen” within a
community. In addition to factors like education, social determinants can encompass the social
environment, the physical environment, resources available in communities, economic
opportunity, food access, and more.11
Housing
According to the American
Community Survey 2013-2017 5-year
estimates, there are 106,673 occupied
housing units in Rutherford County, and
average household size is 2.82 persons
for owners and 2.62 persons for renters,
which is higher than both the state (2.57
persons for owners, 2.45 persons for
renters) and the nation (2.7 persons for
owners and 2.52 persons for renters).12
County-wide, 82.6% of residents live in
the same house as one year ago, Figure 9. Comparison in changes in median home value, US Census Bureau
compared to 85.4% in the nation and the (2018)
85.2% in the state.13 This indicator helps
describe “residential stability and the effects of migration” within a community.14
11
World Health Organization. (n.d.). Social Determinants of Health. Retrieved from
https://www.who.int/social_determinants/sdh_definition/en/
12
U.S. Census Bureau. (2019). Selected Housing Characteristics, 2017 American Community Survey 5-year
estimates. Retrieved from https://factfinder.census.gov/
13
U.S. Census Bureau. (2019). Population 60 Years and Over in the United States 2013-2017 ACS 5-Year
Estimates. Retrieved from https://factfinder.census.gov/
14
U.S. Census Bureau. (n.d.). Why We Ask: Residence One Year Ago. Retrieved February 12, 2019 from
https://www.census.gov/acs/www/about/why-we-ask-each-question/migration/
Page | 12The availability of safe and affordable housing stock has a direct bearing on health. Poor
quality housing can contribute to the risk of injury and to other illnesses through poor
maintenance, leaks, toxic factors in the environment (such as lead), increased risk of
infectious/contagious disease through overcrowding, and psychological distress.15
Furthermore, a shortage of affordable housing can put families under intense stress.
According to the Robert Wood Johnson Foundation: “The lack of affordable housing affects
families’ ability to meet other essential expenses, placing many under tremendous financial
strain. High housing-related costs place a particular economic burden on low-income families,
forcing trade-offs between food, heating and other basic needs. One study found that low-income
people with difficulty paying rent, mortgage or utility bills were less likely to have a usual source
of medical care and more likely to postpone treatment and use the emergency room for
treatment. Another study showed that children in areas with higher rates of unaffordable housing
tended to have worse health, more behavioral problems and lower school performance.”16
Through the course of the Community
Share of Renters and Owners Health Needs Assessment process,
Who Are Cost-Burdened in Rutherford County residents repeatedly
voiced concern about the challenges of a
Rutherford County, 2017
growing population and its implications for
housing in Rutherford County. Data on
housing value bear out this concern.
14.7% Non-Cost-
Burdened Owner
According to the American Community
Survey 2014 and 2017 1-year Estimates
Cost-Burdened
(Figure 9), over the three-year period
54% Owner
between 2014-2017, median home values in
19.7% Non-Cost-
Tennessee increased by about $24,000; in the
Burdened Renter
USA, median home values increased by
11.6% Cost-Burdened
about $36,000; and in Rutherford County,
Renter
median home values increased by $57,000.
This is more than double the rate of increase
17
Figure 10. Share of renters and owners who are cost-burdened in of home values in Tennessee.
Rutherford County, US Census Bureau (2018) There is concern over the number of
cost-burdened households, which are
defined as households that spend more than 30% of their annual income on housing costs.
According to the City of Murfreesboro Consolidated Plan from 2015-2020, cost-burden “is the
housing characteristic linked most closely with instability and the risk of homelessness”.18
According to the U.S. Department of Housing and Urban Development, “Families who pay more
than 30 percent of their income for housing are considered cost burdened and may have
difficulty affording necessities such as food, clothing, transportation and medical care”.19
15 Robert Wood Johnson Foundation. (2011). Housing and Health. Retrieved from
https://www.rwjf.org/en/library/research/2011/05/housing-and-health.html
16 Robert Wood Johnson Foundation. (2011). Housing and Health. Retrieved from
https://www.rwjf.org/en/library/research/2011/05/housing-and-health.html
17 US Census Bureau. (2018). Median Value (Dollars), 2011, 2014, 2017 American Community Survey 1-year estimates.
Retrieved from https://factfinder.census.gov/faces/nav/jsf/pages/searchresults.xhtml?refresh=t#none
18 City of Murfreesboro Community Development Department. (2015). City of Murfreesboro Consolidated Plan 2015-2020.
Retrieved from http://www.murfreesborotn.gov/DocumentCenter/View/2278/2015-2020-Consolidated-Plan?bidId=
19
U.S. Department of Housing and Urban Development. (n.d.) Affordable Housing. Retrieved February 11, 2019 from
https://www.hud.gov/program_offices/comm_planning/affordablehousing/
Page | 13The chart above (Figure 10) shows the share of homeowners versus renters in Rutherford
County. Of the 106,673 occupied housing units in the county in 2017, 65.6% were owner-
occupied (both blue segments combined) and 34.4% were renter-occupied (the yellow and gray
segments combined). The gray yellow segment shows the share of renters who were cost
burdened (43% of renter households, or 14.7% of households overall), and the darker blue
segment shows the share of homeowners who were cost-burdened (17.5% of homeowner
households, or 11.6% of households overall). Between renters and owners, 26.3% of Rutherford
households overall are cost-burdened.20
Homelessness
Many in Rutherford County have
expressed worry that a growing population and
rising home costs have put many on the brink
of homelessness. Point-in-Time count is the
annual one-night tally of those in shelters and
those who are unsheltered throughout the
county. The 2018 Point-in-Time Count
indicated that 283 individuals in Rutherford
County were experiencing homelessness (City
of Murfreesboro, 2018). This is thirty-three
fewer than at the same time in 2017, though
many believe this is a low estimate of the total
homeless population.21
While the Point-in-Time count
identifies those who are in shelters and Figure 11. Varying definitions of homelessness, Nashville
unsheltered, many argue that this is the narrowest Metropolitan Development and Housing Agency (2018)
definition of homelessness as it does not include
those who are doubled up with friends or family/couch surfing, those staying in motels, or those
in other institutions (Figure 11).22
Meanwhile, the Murfreesboro City and Rutherford County school systems estimate that
1,480 students met the definition of homeless in the 2017-2018 school year as specified by the
U.S. Department of Education (D. Garrett, personal communication, December 4, 2018). “The
U.S. Department of Education defines homeless youth as youth who ‘lack a fixed, regular, and
nighttime residence’ or an ‘individual who has a primary nighttime residence that is: a) a
supervised or publicly operated shelter designed to provide temporary living accommodations; b)
an institution that provides a temporary residence for individuals intended to be institutionalized
including welfare hotels, congregate shelters, and transitional housing for the mentally ill; or c) a
public or private place not designed for, or ordinarily used as, a regular sleeping accommodation
20
U.S. Census Bureau. (2018). Selected Housing Characteristics, 2017 American Community Survey 5-year
estimates. Retrieved from https://factfinder.census.gov/faces/nav/jsf/pages/searchresults.xhtml?refresh=t#none
21
National Homeless Information Project. (2017). Point-In-Time Count Homeless Estimates: Comparison between
2016 and 2017. Retrieved from http://www.nhipdata.org/local/upload/file/2016-
2017%20coc%20pit%20comparison.pdf
22
Nashville Metropolitan Development and Housing Agency. (2018). Results of 2018 Point in Time (PIT) Count
Released. Retrieved from http://www.nashville-mdha.org/wp-content/uploads/2016/09/PIT-COUNT-Press-Release-
04172018.pdf
Page | 14for human beings.’ This definition includes both youth who are unaccompanied by families and
those who are homeless with their families.”23
Transportation
The built environment and transportation options affect people’s health and their ability
to make healthy choices. A robust transit system ensures people can easily access essential
resources and services needed to support health. Public transportation can also help to improve
air quality by taking individual cars off the roads and can help reduce stress due to traffic. In
addition to this, better transit
options can alleviate the burden of
long solo commutes to work.
Finally, well-designed transit
options can also support health
equity by bringing transportation
options within reach of vulnerable
populations.24
Rutherford County is
served by the Rover bus service,
whose low-cost fares and multiple
routes serve as a primary means
of transportation for many.
However, Rover routes are
concentrated in the urban
Murfreesboro core, meaning those
on the periphery of the county
have no access to public transit,
making much of Rutherford
County car-dependent. Refer to Figure 12. Rover bus routes in Rutherford County, City of Murfreesboro
25 (nd)
Figure 12 to see the Rover bus
routes.
23
Youth.gov. (n.d.) Federal Definitions. Retrieved from http://youth.gov/youth-topics/runaway-and-homeless-
youth/federal-definitions
24 Centers for Disease Control & Prevention. (2014). Transportation and Health. Retrieved February 12, 2019 from
https://www.cdc.gov/healthyplaces/healthtopics/transportation/default.htm
25 City of Murfreesboro. (n.d.). Rover Route Map. Retrieved November 12, 2018 from: http://63.137.71.220/RouteMap/Index
Page | 15Figure 13 shows the percentage of
households in each census tract in Rutherford
County with no vehicles available. According
to American Community Survey 2017 5-year
estimates, the darkest census tracts constitute
12.4%-17.2% of households with no vehicle
available, and large census tracts on the edges
of the county, outside of the reach of the Rover
routes, have between 5.4%-9.3% of households
with no vehicle available.26
Rutherford County residents spend
significant time sitting in the car, with 85% of
workers driving alone to work27 and less than
2% walking, biking, or taking public transit to
get to their jobs.28 In fact, according to the US
Department of Transportation, across
Tennessee, only 4.5% of walking and biking
trips are at least 10 minutes long, indicating
Figure 13. Percentages of households without a vehicle by
some kind of sustained exercise. This puts census tract, US Census Bureau (2018)
Tennessee in the 5th percentile nationwide for
active transit that represents sustained exercise
indicating lower health performance.29
Mean travel time to work in Rutherford County is 28.1 minutes30 and 42% of workers
who commute alone drive more than 30 minutes to work. According to County Health Rankings,
this measure “is an indicator of community design and infrastructure that discourages active
commuting and social interactions”.31
26 US Census Bureau. (2019). Selected Housing Characteristics, 2017 American Community Survey 5-year estimates. Retrieved
from https://factfinder.census.gov/
27University of Wisconsin Population Health Institute. (2018). 2018 County Health Rankings. Retrieved from
http://www.countyhealthrankings.org/app/tennessee/2018/rankings/rutherford/county/outcomes/overall/snapshot
28 Community Commons. (2018). Percent of workers who walk or bike to work, 2016 American Community Survey 5-year
estimates. Retrieved June 1, 2018 from
https://assessment.communitycommons.org/CHNA/report?page=3&id=408&reporttype=libraryCHNA
29 U.S. Department of Transportation (n.d.) Transportation and Health Indicators. Retrieved June 1, 2018 from
https://www.transportation.gov/transportation-health-tool/indicators
30 US Census Bureau. (2017). Workers Commuting by Public Transportation, 2016 American Community Survey 5-year
estimates. Retrieved from https://factfinder.census.gov/
31 University of Wisconsin Population Health Institute. (2018). 2018 County Health Rankings. Retrieved from
http://www.countyhealthrankings.org/learn/explore-health-rankings/what-and-why-we-rank/health-factors/physical-
environment/housing-transit/long-commute-driving-alone
Page | 16Food Access
The built environment and access to
transportation also affect the choices people can make
regarding what they eat. Lower-income and rural
neighborhoods are often awash in fast food and other
unhealthy options while facing low access to
groceries and other markets that carry fresh produce
and other options that support healthy choices.32
Overall, 28.6% of Rutherford County’s low-
income population also face low food access,
“defined as living more than ½ mile from the nearest
supermarket, supercenter, or large grocery store”.33
Figure 14 illustrates census tracts in Rutherford
County where these low-income, low food access
households are concentrated, with the darkest colors
representing areas with over 50% of low-income Figure 14. Low food access by census tract in
residents facing low food access.34 Rutherford County, Community Commons (2018)
However, in terms of access to fast food,
Rutherford County outstrips both the state and the nation
with a rate of 91.01 fast food establishments per 100,000
people.35 This rate has risen steadily over the last several
years. Studies have shown that an environment rich in fast
food options is linked to a higher likelihood of obesity and
diabetes for residents and students who live and study
nearby.36
Again, it is clear that pockets of need are
geographically concentrated within the county, suggesting
that place matters in terms of residents’ ability to make
healthy choices. Figure 15 outlines the fast food restaurant
abundance.
Figure 15. Fast food restaurants per
100,000 population, Community Commons
(2019)
32
Robert Wood Johnson Foundation. (n.d.) Healthy Food Access. Retrieved February 12, 2019 from
https://www.rwjf.org/en/library/collections/healthy-food-access.html
33
Community Commons. (2018). Food Access – Low Income & Low Food Access. Retrieved February 12, 2019 from
https://www.communitycommons.org/board/chna
34
Community Commons. (2018). Food Access – Low Income & Low Food Access. Retrieved February 12, 2019 from
https://www.communitycommons.org/board/chna
35
Community Commons. (2018). Food Access – Low Income & Low Food Access. Retrieved February 12, 2019 from
https://www.communitycommons.org/board/chna
36
Office of Disease Prevention and Health Promotion. (2019). Access to Foods that Support Healthy Eating Patterns. Retrieved
February 20, 2019 from
Page | 17Violence
Community Commons states that “Violent crime
includes homicide, rape, robbery, and aggravated assault”.37
Safety is a social determinant that affects inequities in health
outcomes.38
Figure 16 shows that Rutherford County has a higher
rate of violent crime than the nation, but lower than
Tennessee overall at 436.8 violent crime offenses reported by
law enforcement per 100,000 residents.39
Research has shown that child abuse and neglect have
long-term ramifications, affecting a child’s physical,
psychological, and behavioral development into adulthood
and creating lasting impacts throughout society.40 Rates of
substantiated child abuse and neglect cases in Rutherford
County have remained consistent over the last several years,
hovering between 3.2 and 3.9 cases per 1,000 children in Figure 16. Violent crime rate per 100,000,
Community Commons (2019)
Rutherford County per year. This is lower than the state rate
of 4.9 cases per 1,000 children.41
Emerging research on ACEs, or
traumas sustained by children before the
age of 18, indicates the lifelong impact of
these events on a person’s health and
socioeconomic outcomes. ACEs range
from divorce/separation to incarceration of
a parent to mental illness in the home to
physical violence and neglect. A high
ACE score is a strong predictor of health
problems in adulthood. Regarding the
original ACE study, which brought the
impact of these childhood traumas to the
forefront, the Substance Abuse and Mental
Health Services Administration states, “As
researchers followed participants over
time, they discovered that a person’s
Figure 17. Correlation of ACE score and life outcomes, CDC (2016)
cumulative ACEs score has a strong,
37
Community Commons. (2018). Violent Crime Rate Per 100,000 Population. Retrieved November 12, 2018 from
https://assessment.communitycommons.org/CHNA/report?page=3&id=408&reporttype=libraryCHNA
38
Office of Disease Prevention and Health Promotion. (2019). Crime and Violence. Retrieved November 12, 2018 from
https://www.healthypeople.gov/2020/topics-objectives/topic/social-determinants-health/interventions-resources/crime-and-
violence
39
Community Commons. (2018). Violent Crime Rate Per 100,000 Population. Retrieved November 12, 2018 from
https://assessment.communitycommons.org/CHNA/report?page=3&id=408&reporttype=libraryCHNA
40
U.S. Department of Health & Human Services, Administration for Children & Families, Children’s Bureau. (n.d.) Long-Term
Consequences of Child Abuse and Neglect. Retrieved February 25, 2019 from
https://www.childwelfare.gov/topics/can/impact/long-term-consequences-of-child-abuse-and-neglect/
41
The Annie E. Casey Foundation Kids Count Data Center. (2018). KIDS COUNT National Indicators. Retrieved May 1, 2018
from https://datacenter.kidscount.org/data#USA/1/0/char/0
Page | 18graded relationship to numerous health, social, and behavioral problems throughout their
lifespan, including substance use disorders”.42
Figure 1743, from the CDC, represents state level ACE data. There is not yet county-level
data on ACEs for Rutherford County, but it has been determined that Tennesseans fall in the
highest quartile nationwide in prevalence of many childhood traumas.44 Some nonprofit and
health organizations in Rutherford County are starting to screen for ACEs as a part of their intake
process, and there is hope that there will be county-level data on them in the near future.
Access to Health Care
Access to appropriate healthcare is a critical piece in the puzzle of factors that affect
health outcomes. According to Healthy People 2020, “Access to comprehensive, quality health
care services is important for promoting and maintaining health, preventing and managing
disease, reducing unnecessary disability and premature death, and achieving health equity for all
Americans”.45
Insurance Coverage – Adults
For most people, the way they gain
entry to the healthcare system is through
insurance coverage.46 Though uninsured rates
are at historic lows, there are still populations
with no access to insurance. This is largely
due to cost and to other restrictions – for
instance, immigrant eligibility restrictions or
income restrictions. Populations most at risk
for not having insurance are low-income
adults and people of color. Lack of insurance
can be a major deterrent in seeking necessary
care, and when care is postponed, conditions
can go undetected or untreated, and outcomes can be
severe. For this reason, we can look at insurance rates Figure 18. Percent of population age 19-64 that is
as a proxy for health outcomes in general.47 The age uninsured by census tract, US Census Bureau
group with the highest uninsured rates nationwide is
42
U.S. Department of Health & Human Services Substance Abuse and Mental Health Services Administration. (2018). Adverse
Childhood Experiences. Retrieved February 26, 2019 from https://www.samhsa.gov/capt/practicing-effective-
prevention/prevention-behavioral-health/adverse-childhood-experiences
43
Centers for Disease Control and Prevention. (2016). About Adverse Childhood Experiences. Retrieved February 26, 2019 from
https://www.cdc.gov/violenceprevention/childabuseandneglect/acestudy/aboutace.html?CDC_AA_refVal=https%3A%2F%2Fw
ww.cdc.gov%2Fviolenceprevention%2Facestudy%2Fabout_ace.html
44
Child Trends. (2014). Research Brief: Adverse Childhood Experiences: National and State-Level Prevalence. Retrieved from
https://www.childtrends.org/wp-content/uploads/2014/07/Brief-adverse-childhood-experiences_FINAL.pdf
45
Office of Disease Prevention and Health Promotion. (2014). Access to Health Services. Retrieved November 15, 2018 from
https://www.healthypeople.gov/2020/topics-objectives/topic/Access-to-Health-Services
46
Office of Disease Prevention and Health Promotion. (2014). Access to Health Services. Retrieved November 15, 2018 from
https://www.healthypeople.gov/2020/topics-objectives/topic/Access-to-Health-Services
47
Henry J. Kaiser Family Foundation. (2019). The Uninsured and the ACA: A Primer - Key Facts about Health Insurance and
the Uninsured amidst Changes to the Affordable Care Act. Retrieved January 9, 2019 from
https://www.kff.org/uninsured/report/the-uninsured-a-primer-key-facts-about-health-insurance-and-the-uninsured-under-the-
affordable-care-act/
Page | 19working-age adults between 19 and 64, which is likely due to the public insurance options
available for low-income children and those over 65.48 In Rutherford County, 13.4% of working-
age adults age 19-64 are uninsured. This is lower than both the state (15.9%) and national
(14.8%) rates of uninsured. Figure 18 shows where in Rutherford County these uninsured adults
19-64 reside by census tract, with the darkest tracts having rates of 24.3%-28.2% uninsured.49
Racial disparities in insurance coverage are present in Rutherford County. According to
the 2017 American Community Survey 5-year estimates, in Rutherford County, 33.7% of
Hispanic or Latino residents lack insurance, while whites of non-Hispanic origin are uninsured at
a rate of 7.4% overall. Figure 19 below outlines these racial disparities.50
Uninsured Rates by Race & Ethnicity,
2017
Hispanic or Latino (of any race)
Two or more races
Native Hawaiian and Other…
American Indian and Alaska…
White alone
0%
5%
10%
15%
20%
25%
30%
35%
40%
45%
Rutherford TN USA
Figure 19. Uninsured rates by race and ethnicity, US Census Bureau (2017)
Insurance Coverage – Children
Children’s uninsured rates are also at an all-time low nationally. Access to insurance is
crucial in getting kids the care they need that can set them up for good health later in life, as well
as for better academic and economic outcomes. Insurance coverage affects the care children
receive. In the graph below, the orange and dark blue bars represent children with private and
public insurance/Medicaid, and the light blue bars represent children with no insurance. In all
instances, children with no insurance are significantly less likely to have access to a usual source
of care, to receive a well-child checkup, or to receive a specialist visit.51 Figure 20, from the
Kaiser Family Foundation represents the likelihood of a child receiving care depending on their
insurance status.
48
U.S. Census Bureau. (2017). Selected Characteristics of Health Insurance Coverage in the United States, 2013-2017 American
Community Survey 5-Year Estimates. Retrieved from https://factfinder.census.gov/faces/nav/jsf/pages/index.xhtml
49
U.S. Census Bureau. (2017). Health Insurance Coverage in the United States: 2017 – Current Population Reports. Retrieved
from https://www.census.gov/content/dam/Census/library/publications/2018/demo/p60-264.pdf
50 U.S. Census Bureau. (2017). Selected Characteristics of Health Insurance Coverage in the United States, 2013-2017 American
Community Survey 5-Year Estimates. Retrieved from https://factfinder.census.gov/faces/nav/jsf/pages/index.xhtml
51 Henry J. Kaiser Family Foundation. (2017). Key Issues in Children’s Health Coverage. Retrieved January 9, 2019 from
https://www.kff.org/medicaid/issue-brief/key-issues-in-childrens-health-coverage/
Page | 20Figure 20. Access to care for children by insurance status, Kaiser Family Foundation (2017)
In Rutherford County, 5.5% of children
under 19 years of age are uninsured. This is
higher than the state rate overall (4.8%) and
slightly lower than the national rate (5.7%).
Figure 21 shows where these children reside in
the county, with the darkest census tracts
representing areas where 18.3% to 29.2% of
children do not have insurance.52
Provider Ratios
Access to care depends not only on
insurance coverage, but on the availability of
providers nearby. In Rutherford County, there is 1 Figure 21. Percentage of uninsured of population under
primary care provider for every 2,300 residents. age 19 by census tract, US Census Bureau
This is less favorable than the state ratio over all
(1 primary care provider for every 1,380 residents), and the ratio of the top 10% of counties
nationwide (1 provider for every 1,030 residents).53
Similarly, access to dental care is a crucial factor in health, and shortage of providers
continues to affect much of the nation. Rutherford County does better than the state overall (1:
1,892) with 1 provider for every 1,860 citizens but is still short of the rate in the top 10% of
counties, which is one dental provider for every 1,280 residents.54
Finally, access to mental healthcare has grown in demand, and Rutherford County has
one mental health provider (defined as psychiatrists, psychologists, licensed clinical social
workers, counselors, marriage and family therapists, mental health providers that treat alcohol
and other drug abuse, and advanced practice nurses specializing in mental health care) for every
52
U.S. Census Bureau. (2017). Selected Characteristics of Health Insurance Coverage in the United States, 2013-2017 American
Community Survey 5-Year Estimates. Retrieved from https://factfinder.census.gov/faces/nav/jsf/pages/index.xhtml
53
University of Wisconsin Population Health Institute. (2018). Primary care physicians. Retrieved from
http://www.countyhealthrankings.org/app/tennessee/2018/measure/factors/4/map
54
University of Wisconsin Population Health Institute. (2018). Dentists. Retrieved from
http://www.countyhealthrankings.org/app/tennessee/2018/measure/factors/88/map
Page | 211,269 residents. Table 1 below shows how Rutherford continues to fall behind both the state
(1:742) and the top 10% of counties, which have a ratio of 1 provider for every 330 citizens.55
Table 1. Provider Ratios, County Health Reports (2018)
Primary Care Mental Health
Dentists
Providers Providers
1:2300 1:1860 1:1270
1:1382 1:1892 1:742
Top 10% of counties in the US
1:1030 1:1280 1:330
There are racial disparities across Tennessee in the way people are able to access the care
they need. This chart based on data from the 2017 BRFSS shows Tennesseans who needed to see
a doctor in the past year but could not due to cost. Roughly 18% of Hispanic respondents needed
to see a doctor but couldn’t due to cost, while nearly 20% of black and 13% of white
Tennesseans weren’t able to see a doctor due to cost. However, those of other races or of mixed
race couldn’t see a doctor due to cost at much higher rates (26.5% and 35.5% respectively).56
Access to a consistent primary care physician is a crucial piece of preventive care. In
Tennessee, about 21% of white and 25% of black residents don’t have anyone they consider to
be their personal health care provider. For individuals who identify as Hispanic, 37% of this
population feels that they don’t have one person who is their doctor.57
Health Status
Morbidity/Mortality
The World Health Organization reports that the global burden of disease has shifted over
the last century from infectious disease to chronic disease. The same is true for the trends of
disease that we see in the United States.
55
University of Wisconsin Population Health Institute. (2018). Mental health providers. Retrieved from
http://www.countyhealthrankings.org/app/tennessee/2018/measure/factors/62/map
56 Tennessee State Department of Health. (2017). Behavioral Risk Factor Surveillance System Tennessee Core Questions Data
Report. Retrieved from https://www.tn.gov/content/dam/tn/health/documents/brfss/2017_Core_Sections.pdf
57 Tennessee State Department of Health. (2017). Behavioral Risk Factor Surveillance System Tennessee Core Questions Data
Report. Retrieved from https://www.tn.gov/content/dam/tn/health/documents/brfss/2017_Core_Sections.pdf
Page | 22Figure 22. Top five leading causes of death in the US 1900-2016, CDC (2018)
Figure 22 shows the top five leading causes of death in the United States from 1900-
2016. In the early 1900’s, the leading causes of death in the U.S. were infectious diseases such as
Influenza/Pneumonia, Tuberculosis, and Diarrhea/Enteritis/Ulcerative Colitis. More than a
century later, the leading causes of death have shifted to be more chronic diseases such as Heart
Disease and various Cancers. These data illustrate how the conditions in which we live, work,
and play impact how we are affected by disease. 58
The leading causes of death in Percentage of Deaths
Rutherford County are consistent with the Rutherford County (2014-2016)
state and national trends. Between the years
of 2014-2016, there were about 5,500
deaths in Rutherford County for which we
have data (Figure 23). Cancer (23%) and
Health Disease (22%) make up, by far, the
largest portion of deaths with 45%. Other
leading causes include Lung Disease (6%),
Accidents (6%), Stroke (5%), Diabetes
(3%), Flu/Pneumonia (3%), Suicide (2%),
and Liver Disease (2%). Overall, these 10
leading causes of death makeup more than
three quarters (78%) of deaths in
Rutherford County. The other category,
though large, represents any causes of
Figure 23. Percentage of deaths in Rutherford County 2014-2016, CDC
death outside of these leading causes. Wonder (2018)
Birth Outcomes
Infant Mortality
Infant mortality in the United States continues to be an important health issue, even
though it has been on the decline over the last century. However, the Rutherford County infant
58
Centers for Disease Control and Prevention: CDC Wonder. (2018). CDC Wonder.
Page | 23You can also read