Addison County 2021 Community Health Needs Assessment (CHNA) - Porter Medical Center
←
→
Page content transcription
If your browser does not render page correctly, please read the page content below

Addison County
    Community Health Needs
      Assessment (CHNA)

               2021

        Approved By: UVMHN Porter Medical Center
                    Board of Directors
             Date Approved: August 4th, 2021

1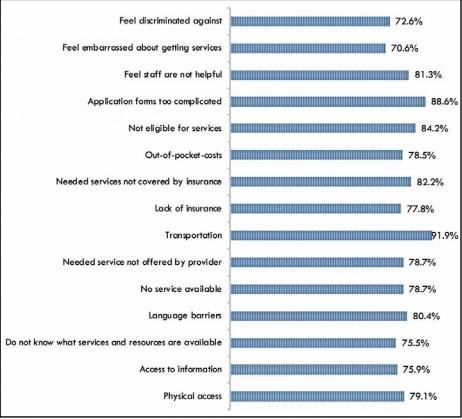
Table of Contents
Executive Summary                                                          3
Chapter 1 - Background                                                     5
Chapter 2 - Addison County Description                                     6
Chapter 3 - Data Collection Process                                        10
    Survey                                                                 10
    Focus groups                                                           12
    Stakeholder interviews                                                 13
Chapter 4 - Secondary Data                                                 14
    Introduction                                                           14
    Health Care organizations in Addison County                            14
    Mortality                                                              15
    2018 Community Profile conducted by the Vermont Blueprint for Health   18
    Local Determinants of Health                                           29
    2020 Achievements                                                      31
    Early Childhood Systems Needs Assessments 2020                         33
Chapter 5 - Summary of Community Survey Results                            34
    Demographics and Representativeness of the Survey                      34
    Perception of Community Health and Health Issues                       44
    COVID-19 Impact                                                        60
Chapter 6 – Focus Group and Stakeholder Interviews                         68
Chapter 7 – Community Health Improvement Plan                              75
References                                                                 77
Appendices                                                                 79
    Appendix A – CHNA Survey                                               79
    Appendix B – Focus Group Questionnnaire                                91
    Appendix C – Focus Group Exit Survey                                   94
    Appendix D – Stakeholder Interview Questionnaire                       95

     2
Executive Summary
The Community Health Needs Assessment (CHNA) was designed to view the health
conditions and status of Addison County in order to increase accountability of health
care providers to their service populations, ensuring that the health care organizations’
range of services addresses local needs and promotes community health. The
expectation is that health care organizations will use results from the CHNA to guide
their strategic planning and resource allocation for the next 3 years.
        The CHNA includes:
            ● Assessment of existing indicators
            ● Primary data collection
                   ○ CHNA Survey – 761 respondents
                   ○ Focus Groups - 14 participants
                   ○ Stakeholder Interviews – 33 representatives / 23 organizations
            ● Identification of health priorities

Brief Overview/description of Addison County:
Addison County is located in the lower Champlain Valley of Vermont with Lake
Champlain and the Adirondacks to the west and the Green Mountains to the east.
Addison County is rural and known for its dairy farming. Addison County has a density
of around 45.5 people per square mile. The major employers in the county include
Middlebury College, UVMHN Porter Medical Center and Collins Aerospace.

Major findings

Across several issues, respondents were concerned about the affordability of services,
from healthy foods to substance use treatment to general health care services.

Employment and Demographics:
92.6% of Addison County residents are white non-Hispanic. Hispanic or Latino residents
are Addison County’s more prevalent minority population at 2.3%. According to the
2019 Census, the median income in this county is $68,825, higher than both Vermont
and the United States as a whole, and there is a 7.9% level of poverty in the county.

Substance Abuse:
Survey respondents were concerned about stigma surrounding substance use,
including stigma surrounding treatment for substance use. Respondents were also
concerned about the availability and affordability of services and treatment, such as the
affordability of residential substance use disorder treatment.

Healthy Eating:
Respondents were most concerned about the affordability of healthy foods; availability
of healthy foods was not a concern for most respondents.

     3
Mental Health:
The majority of survey respondents rated their mental health at a 4 or 5 on of a scale of
5, signifying overall satisfaction with their mental health. When ranking concerns about
mental health, respondents were most concerned with the affordability of mental health
services. However, during focus groups and stakeholder interviews, participants
expressed a need for more mental health clinicians to address the demand for services,
especially in schools, the healthcare system, and in the general community.
Health Care:
Regarding healthcare, survey respondents highlighted that their top concern was
affordability. For example, survey respondents were concerned about the affordability of
dental and health care for adults. During focus groups and stakeholder interviews, the
need for more Primary Care Providers and wellness-centered care was expressed at a
high frequency, as well as transportation and health insurance being a barrier to
accessing care.
Environmental Issues:
The top environmental and social challenges that survey respondents were concerned
with were climate change and street safety.
Housing:
Affordable Housing was identified by 55.2% of the respondents as the top social and
environmental challenge in the community. During the focus groups and stakeholder
interviews, the concern about housing was made apparent by more than half of the
participants. The concern included all forms of housing, affordable units, space to rent,
houses to buy, sober housing, and housing for elders.
COVID-19 Pandemic:
Overall, the COVID-19 pandemic exacerbated pre-existing disparities in Addison
County, with the most vulnerable populations experiencing the most negative impacts
due to COVID-19. For example, decreases in income were most likely to be
experienced by households making $10,000-$24,999, and by underemployed people.
Top 3 Priorities Identified:
CHNA collaborators, UVMHN Porter Medical Center, Home Health and Hospice, and
Five-Town Health Alliance, along with community partners used a set of criteria to
identify priorities. The criteria included: scope of work, severity of issue, ability to impact,
community readiness, and health equity. Based on the findings from the CHNA and
criteria, the selected priorities include:
Access to Healthcare Services
Access to Mental Health Services
Housing
Community Health Improvement Plan:
Stakeholders from each priority group will gather to discuss strategies to be
implemented from 2021-2023.
4
Chapter 1 - Background
With the passing of the Affordable Care Act, Community Health Needs Assessments
(CHNAs) are required by the Internal Revenue Service (IRS) for not-for-profit hospitals
and other not-for-profit health care providers. By surveying residents in a community,
CHNAs help increase accountability of healthcare providers to their service populations,
ensuring that the healthcare organizations’ range of services address local needs and
promotes community health. The expectation is that healthcare organizations will use
results from the CHNA to guide their strategic planning and resource allocation for the
next 3 years.

Surveying Addison County residents can help shed light on problems that had
previously gone unnoticed. Results and insight from analyzing survey data can lead to
creation and implementation of interventions to address these issues. CHNAs also
provide a platform for the community to be heard in a way they may not have been
heard before. Since the last CHNA in 2018, the COVID-19 pandemic started and
spread. The survey used in this CHNA helps to elucidate how the pandemic has
affected Addison County residents.

Data informing the Addison County CHNA comes from multiple sources and includes
primary data from the questionnaire (Appendix A), findings from focus groups and
stakeholder interviews, secondary data, and indicator data. Chapter Three includes a
summary of the data collection process along with strengths and limitations for all types.
Secondary and indicator data is analyzed in Chapters Two and Four of this document.
Primary data is analyzed and compared to secondary and indicator data in Chapter
Five. Chapter Six is informed by all qualitative data extracted from focus group and
stakeholder interviews. Chapter 7 reviews priorities selected and next steps to create a
comprehensive Community Health Improvement Plan addressing priority concerns.

     5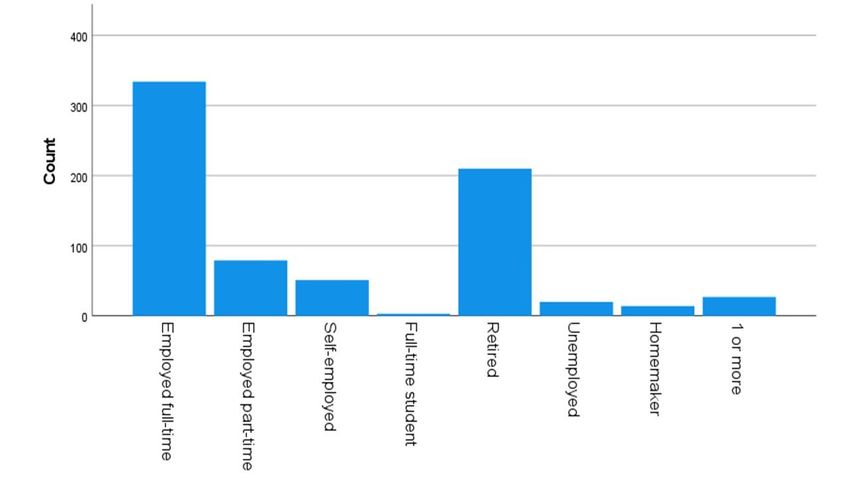
Chapter 2 - Addison County Description

Addison County is located in the lower Champlain Valley of Vermont with Lake
Champlain and the Adirondacks to the west and the Green Mountains to the east. The
unique landscape of Addison County, the farmlands of the Champlain Valley, and the
predominately wooded settings near the foothills of the Green Mountains promote a
variety of lifestyles and a balanced blend of light industry and farming. Addison County
is rural and known for its dairy farming. It has the most farm acreage in the state and
leads the state in the value of agriculture products sold (US Census Bureau, 2012). The
County is home to three local newspapers, more than 50 service organizations and
more than 100 faith communities. The major employers in the county include
Middlebury College, Porter Medical Center and Collins Aerospace.

Addison County is bordered to the north by Chittenden County, Vermont’s most densely
populated county, which includes Vermont’s largest city, Burlington, and its surrounding
suburbs. The northern portion of Addison County is considered a commutable distance
to Burlington so residents have the option of traveling north for employment, healthcare,

     6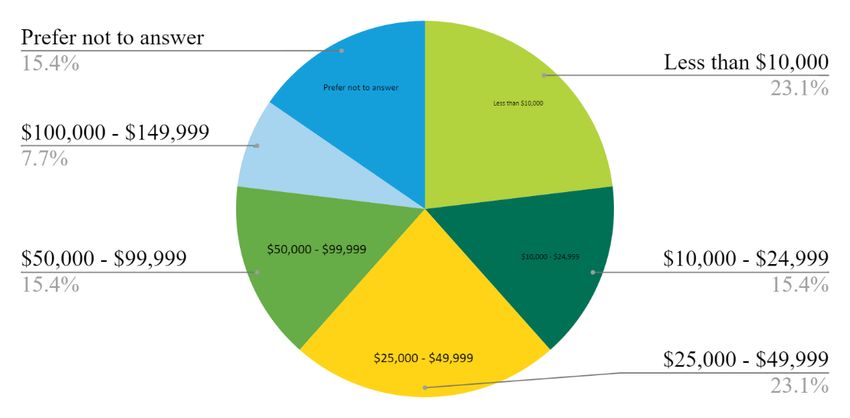
shopping and other services. Addison County is bordered to the south by Rutland
County. Rutland County is home to Vermont’s third largest city, Rutland. Residents who
live in the southern portion of Addison County have the easy access to Rutland County
for work, healthcare, and other opportunities. Addison County is bordered to the east by
Windsor, Orange and Washington Counties. For the eastern Addison County
communities of Hancock and Granville, accessing services within our county is
challenging in winter as this requires traveling over mountain roads.

According to the US Census Bureau, the 2019 population estimate for Addison County
is 36,777 which is approximately 6% of the state’s total population. According to
population estimates, Addison County had 0.1% decrease in population since the 2010
census. A vast majority (94.5%) of Addison County residents are white non-Hispanic.
Hispanic or Latino residents are Addison County’s more prevalent minority population at
2.3%.

The US Census Bureau estimates that 4.7% of Addison County residents under the age
of 65 were uninsured in 2019. Overall, Vermont has one of the lowest rates in the
country of people living without health insurance.

Addison County is similar to the state as a whole for educational attainment. Addison
County has lower poverty and a higher median income than the state as a whole. Below
is data from the 2019 US Census Bureau comparing Addison County to Vermont for
educational attainment, people living in poverty and the median household income:

                                                              Addison County           Vermont

 % of population with high school diploma or higher                 93.5%               92.7%

 % of population with bachelor’s degree or higher                   39.6%               38.0%

 % of population under the federal poverty level                    7.9%                10.2%

 Median household income                                           $68,825             $61,973
         Table 1. Comparing educational attainment, people living in poverty, and median household
         income of Addison County residents with Vermont residents overall. Source: 2019 US Census
         Quick Facts.

In Addison County, 16.5% of the population is age 18 and under while 20.7% of the
population is age 65 years and older. This represents a significant shift in the age of the
county’s population. In the 2009 Community Health Needs Assessment, the population
of Addison County youth age 18 and under was 21% while the population of seniors
age 65 and older was 13.3%. According to a June 29, 2017 Burlington Free Press
article, Vermont is aging faster than the nation as a whole. Furthermore, the number of
people under the age of 20 is declining in Vermont while the number of people under
age 20 is holding steady for the rest of the country.

     7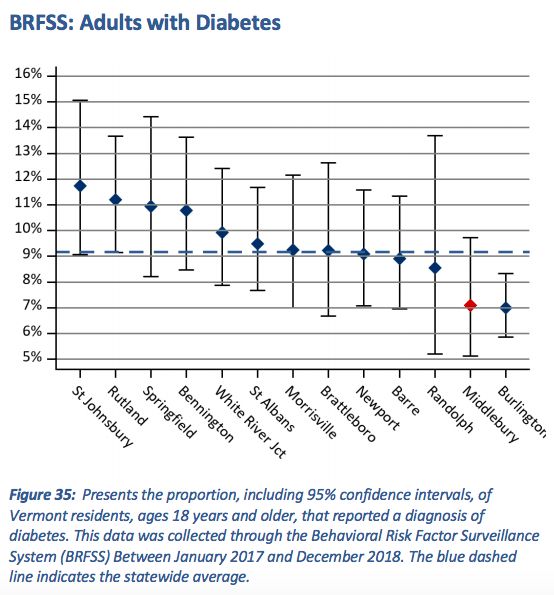
Regarding education, many towns offer early education/preschool. However, it will be
noted later in this report that accessing childcare is a high priority for survey
respondents aged 18-34 years. There are three school districts located within the
county while the southernmost communities of Addison County (Leicester, Whiting, and
Orwell) are part of school districts that primarily serve Rutland County students. In
addition to traditional secondary schools, the Patricia A. Hannaford Career Center offers
an integrated work and learning program to students from the three Addison County
school districts. Addison County is home to Middlebury College, a prestigious liberal
arts college, the Community College of Vermont, and Northlands Jobs Corps, a
residential and educational training program located in Vergennes for youth ages 16-24
years.

Population Centers:

Middlebury.
        Middlebury, the seat of Addison County, was chartered in 1761 and was settled
just after the Revolutionary War. Today, the village is listed on the National Register of
Historic Places and is home to shops, businesses, churches, and public buildings.
Middlebury is the largest community in the county with a population of 8,780.
Middlebury is home to Middlebury College. Middlebury is also the hub for medical
services in the county with the University of Vermont Health Network Porter Medical
Center (a critical access hospital), Helen Porter Healthcare and Rehabilitation Center,
and many of the area’s medical provider offices.

Vergennes
        Established in 1788, Vergennes is Vermont’s oldest incorporated city. Vergennes
encompasses 1,200 acres of land that was carved from the three neighboring towns of
Ferrisburgh, Panton and Waltham. It is where Thomas Macdonough built and armed the
fleet that would defeat the British on Lake Champlain during the War of 1812. In the late
1990s, Vergennes residents launched a Main Street revitalization effort and formed the
Friends of the Vergennes Opera House to complete the restoration of the 1897 Opera
House. Today, Vergennes is home to 2,596 residents and Collins Aerospace, one of the
largest employers in the county.

Bristol
        Bristol, known as the “Gateway to the Green Mountains,” was founded in 1762
and is currently home to 3,800 residents. The town was originally known as Pocock,
after a distinguished English admiral. The name was changed to Bristol in 1789 but the
community still celebrates its heritage during the annual Pocock Rocks Street Fair. The
Bristol Band has presented outdoor summer concerts on the town green every
Wednesday since shortly after the Civil War. Downtown Bristol is a National Historic
District with small shops and restaurants and a vibrant artist community.

Smaller Towns and Villages:
      Approximately 60% of Addison County residents live outside the three population
centers. These outlying communities are rural with few local services. The communities

     8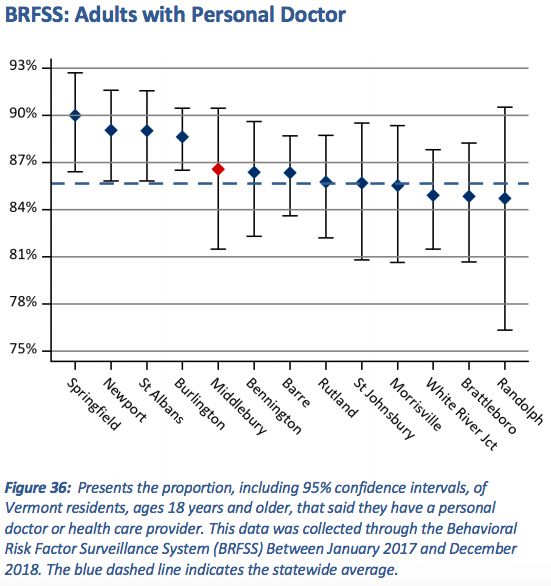
are governed by select boards and most have their own elementary school, fire
department, and town office. There are small country and convenience stores/gas
stations in some of these communities. The large grocery stores are located in the
population centers along with other shopping, banking and healthcare services.
Transportation is a significant issue in the county. Tri-Valley Transit, formerly Addison
County Transit Resources (ACTR), provides bus and volunteer driver services but these
services are somewhat limited to the outlying communities. Agencies such as the
Addison County Parent Child Center and Elderly Services provide transportation for
their clients for specific purposes but in general, transportation is a concern for those
who do not drive and those without a reliable vehicle.

       There are ample opportunities for outdoor physical activity in Addison County
including walking, running, biking, swimming in lakes, streams and outdoor public pools,
and use of recreation fields. However, there are concerns that the roads are dangerous
for pedestrians and cyclists due to fast moving traffic and narrow shoulders. The Walk-
Bike Council of Addison County formed in 2017 in response to three cyclist deaths in
the county several years ago and is working to make walking and biking safer for
everyone.

     9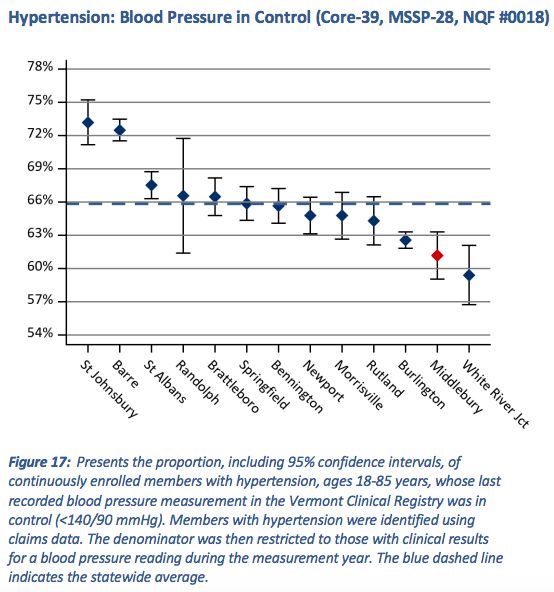
Chapter 3 - Data Collection Process
Survey

The information used for data analysis in Chapter 5 of this report was collected via a
county-wide survey conducted on the Survey Monkey platform. The survey was made
available in English and Spanish. It was conducted anonymously and mostly online
through a publicized internet address, although paper versions of the survey were also
distributed throughout the county among target populations by facilitators and through
partner organizations. The web link to the survey was listed on the UVMHN Porter
Medical Center website, distributed through committee list serves to share with clients
and individuals served by partnering organizations, and through Front Porch Forum.
The schools received outreach information to send to families in weekly newsletters.
Several social media posts were also developed to increase number of survey
respondents. Paper surveys were made available by request and distributed at the
Open Door Clinic, Middlebury Laundromat. ACHHH offered paper surveys to individuals
who received home-bound Covid-19 vaccinations. However, during the Covid-19
pandemic, it was a challenge to distribute paper copies in person and for people to take
time in public spaces to complete the survey.

A total of 761 participants in total completed the survey, with five of these participants
taking the survey on paper. The responses from the paper surveys were manually
entered into the Survey Monkey platform by team members from Middlebury College;
this was done to have all participant data in the place on the Survey Monkey platform
for subsequent analysis. Data were downloaded as a Microsoft Excel file (.xlsx) and
analyzed using Microsoft Excel, Stata, and IBM SPSS Statistics software programs.
Before the final version of the data was downloaded, a weekly analysis of demographic
questions built into the survey allowed for facilitators to monitor which parts of the
population served by Porter Medical Center were filling it out, and therefore enabled the
alteration of distribution methods to ensure that all target populations were being
represented, as well as a more informed creation of focus groups.

The survey went live on February 1, 2021. Over the weekend of February 6th and 7th,
the survey was changed to allow respondents to select multiple options for the second-
to-last question, “Where do you get your information about resources?” This change
was made because early respondents had expressed multiple times that they wished to
be able to select more than one answer, but up until that point had been able to only
select one option. At this point, the format of the question was altered in order to allow
subsequent respondents to make multiple selections from the various methods of
obtaining information about resources available in the county. Survey responses
collected prior to this question change (n=253) were re-coded to reflect the multiple
selections respondents would have made if they had been able, based on write-in
responses written by respondents to indicate “other” sources of information. Some of
these answers required a manual cross-check and copying into the re-coded version.
Some of the answers, such as one that read “nearly all of the above” and another that
said, “several of the above,” were not recoded into the multiple categories because it
     10
was assumed that because these respondents did not specify their answers, it would
not be possible to recode these responses into various categories accurately. The
survey was closed on March 20, but late responses were accepted for an additional
week, including paper survey responses that were entered into Survey Monkey. On
March 27, the survey data collection was considered final and was exported for
analysis.
All demographic data, mainly collected from the third section of the survey, was
analyzed using Microsoft Excel and Google Sheets. Simple count and sort functions in
these programs were used to turn the information into tables and charts. Frequency
counts and descriptive statistics were calculated for nearly every variable in this section.
Sometimes, answers from written-in responses were re-coded to fit into a pre-existing
option for analysis purposes. For example, when individuals wrote that they were from
“East Middlebury” in the section where they were asked about their town of residence,
these responses were re-coded to read “Middlebury” (since East Middlebury is not
chartered as a separate town) and these individuals were counted as being a resident
of the town of Middlebury. In doing comparisons or breakdowns with these data, such
as the chart where individuals are broken down both by gender and age at the same
time, some identities and responses were grouped in order to protect the privacy of
individuals and not expose any potentially identifying information.
All non-demographic and non-COVID-19 related questions were analyzed using SPSS
statistical software. No identifying information was moved into SPSS. Numerical
responses were incorporated. Responses that were not numerical in nature were
assigned a specific coordinating number and analyzed using the numerical conversion.
Descriptive statistics and frequency count were done on almost all questions, and
corresponding graphs of outputs can be found later in this document. Gender
stratifications were also done to identify differences in response patterns among male,
female, and non-male/non-female identifying individuals. Although no identifying
information was used in SPSS, if any potentially identifying questions or outputs were
found (especially through a combination of age, gender, and town of residence),
responses were then grouped to avoid identification,
COVID-19 related questions were analyzed using Stata statistical software. The final
excel file obtained from the Survey Monkey platform was cleaned to be properly
recognized by Stata, which allowed for the cross-tabulation outputs included in Chapter
5 of this report. As was the case for SPSS, this meant that responses that were not
numerical in nature were assigned a specific coordinating number and analyzed
thereafter. Demographic information such as income level and age were used in these
analyses in order to identify how different portions of the population were affected by the
pandemic. While SPSS and Stata have similar capabilities and all questions on the
survey followed similar formats, we put an emphasis on the separation of COVID-
specific questions from the rest of the survey in order to maintain the integrity of long-
lasting recurring needs and those that arose due to the stress the pandemic posed on
systems. An analysis of these effects can be found in Chapter 5 under “COVID-19
Impact.”
11The Survey Monkey data export was uploaded to a Google Drive folder with access
shared among members of the Middlebury College team (one professor and four
students). Subsequent data sets and subsets created for analytic purposes resided on
the Google Drive. All data that were downloaded onto personal computers were deleted
and removed from these machines afterwards. The Google Drive files will exist only
until the CHNA work is completed, and will then be erased.
Focus groups and Stakeholder Interviews
Focus Groups Recruitment:
Focus group recruitment take place in 3 different methods 1) flyers were sent to
community partners to share and post with staff and clients 2) community partners were
asked to directly identify community members that would be interested in sharing their
opinion in a group setting and 3) front porch forum recruitment post for people to sign
up. Participants were incentivized by a $10 gift card to Shaw’s Grocery store once they
completed the Focus Group. This gift card was sponsored by UVMHN Porter Medical
Center. Based on the call to action, 18 individuals registered for focus groups, 14
completed the focus groups, and 13 completed the exit questionnaire (Appendix C) with
demographics information and contact information for the $10 gift card. Focus groups
were capped at 10 members per group to encourage conversation and they were
scheduled on various days and differing times to accommodate for individual’s
schedules. Focus group times included the following:
May 3rd - 12-1 p.m. May 12th - 8-9 a.m.
May 4th - 5:30-6:30 p.m. May 20th – 12-1 p.m.
May 6th - 8-9 a.m. | 5:30-6:30 p.m.
One focus group session was held at Parent Child Center via zoom. However, other
partners were unable to help due to COVID-19 restrictions and partners such as Charter
House and Open Door Clinic hope to offer in-person focus groups in the future.
Focus Group Method and Extraction:
The questionnaire was designed to do a deeper dive on the gaps from the CHNA
survey and to get a perspective from underrepresented groups. Questions were
designed to identify other needs that may not have been identified from the survey
questions. See Appendix B for focus group questionnaire. The questionnaire was used
a as guide by the facilitator, but the concerns that rose from the discussion shaped the
conversation. There were two note takers for each session to capture quotes from
participants and information that was shared. From those notes, themes and trends
were extracted to be put in a table and compared to information that came from the
stakeholder interviews. See chapter 6.
12Stakeholder Interviews:
Cross-sector stakeholders were asked to take part in interviews at existing meetings
such as the Community Health Action Team (CHAT), Building Bright Futures group,
Substance Use Treatment and Recovery Committee or individually if they were
interested. Stakeholders were also sent a link to the same questionnaire that was used
to facilitate discussions at the group setting. There were 33 representatives from 23
different organizations that took part in a group interview or responded to the survey.
See Appendix D for the stakeholder interview questionnaire.
Information from the group conversations and survey monkey was gathered by two note
takers. The trends and themes were extracted and compared to the focus group
information with community members. See comparison in Chapter 6.
13Chapter 4 - Secondary Data
Introduction
This chapter reviews secondary and indicator data collected outside of the Community
Health Needs Assessment. Understanding the following sections will provide an
important understanding of recent trends in Addison County and offer a frame of
reference for the data collected through this project.
Health Care organizations in Addison County
UVMHN Porter Medical Center is a non-profit critical access hospital that services
Addison County and surrounding areas. Mountain Health Center, under Five-Town
Health Alliance is a federally qualified health center in Addison County that provides
care to the underserved population and is located in Bristol, VT. The table below, listing
healthcare organizations in Middlebury, was taken from the 2020 Annual Report on the
Vermont Blueprint for Health:
Addison County Blueprint Practices
ACO Participation
Parent Organization Practice Site Name Medicare Medicaid BCBS MVP PCMH WHI Spoke
Middlebury Family Middlebury Family Health
Health Center x x x x x
Mountain Health Center, Red
Five-Town Health Clover Family Dentistry, and
Alliance, Inc Mobile Health Unit x x x x x x
Independent Practice Rainbow Pediatrics x x x x
Natural Family Health, Vermont Natural Family
P.C. Health - Salisbury x x x x
Planned Parenthood of
Northern New England PPNNE - Middlebury x x x x x x
UVM Health Network Porter
Medical Center Pediatric
Porter Medical Center Primary Care x x x x x
UVM Health Network Porter
Medical Center Primary Care
Porter Medical Center Brandon x x x x x
UVM Health Network Porter
Medical Center Primary Care
Porter Medical Center Middlebury x x x x x
UVM Health Network Porter
Medical Center Primary Care
Porter Medical Center Vergennes x x x x x x
UVM Health Network Porter
Medical Center Women's
Porter Medical Center Health x x x x x
Table 2: This table shows healthcare organizations in Middlebury. ACO stands for “Accountable Care
Organization,” BCBSVT stands for “Blue Cross Blue Shield of Vermont,” MVP stands for “Nonprofit
MVP Health Care,” PCMH stands for “patient-centered medical home,” WHI stands for “Women’s
Health Initiative,” and SPOKE stands for “Hub & Spoke Program.”
14Addison County is also home to a multitude of other care organizations, such as:
● The Open Door Clinic, a free health clinic for uninsured and under-insured adults
in Addison County.
● The Charter House Coalition, a non-profit, volunteer-based organization
dedicated to providing basic food and housing in and around Middlebury,
Vermont.
● SaVida Health Vergennes, which provides FDA approved addiction treatment.
● Turning Point Center, a non-profit recovery center that provides a safe, friendly,
and substance use free environment where all people in recovery, and their
families and friends, can meet for peer-to-peer recovery support, social activities,
recovery coaching, education, and advocacy.
● ACHHH – Addison County Home Health and Hospice, provides home care
services to families and individuals of all ages
● HOPE - Helping Overcome Poverty’s Effects, a non-profit organization that works
to improve the lives of low income people in Addison County by working with
individuals to identify and secure the resources needed to meet their own basic
needs.
● Tri-Valley Transit, a nonprofit organization that provides public transit buses for
everyone and door to door Dial-A-Ride service for vulnerable populations who
cannot access the buses.
● Vermont Department of Health Services provide wrap around services to families
including the Women Infants and Children (WIC) program.
● ACORN Network, which provides support to farmers and food producers,
engages in food education, and ensures access to healthy food for all members
of the community.
● Elderly Services, Inc., which offers elders and their families an adult day care
center to help delay or prevent nursing home placement; it also provides
creative, high-quality programs to help elders live safe and satisfying lives in their
own homes and communities.
● Counseling Services of Addison County (CSAC), designated community mental
health agency that provides a multi-disciplinary approach for developmental
services, substance abuse treatment, psychiatry, psychology, mental health
counseling, social work, family therapy, and child therapy.
● And much more!
Mortality
Beyond the number of deaths per age group in Addison County, more detail about the
cause of deaths in this county was unavailable. As such, this section on mortality will
mainly cover the trends in deaths in Vermont overall.
Figure 1: Deaths per age group in Addison County in 2018. This figure was created by the
Vermont Department of Health Statistics and Vital Records.
15In 2018, the most recent year reported by the Vermont Department of Health Statistics
and Vital Records, 6,027 residents died in Vermont. Since 2004, the death rate has
been increasing, as seen in the figure below.
Figure 2: Vermont and U.S. Death Rates. This figure was created by the Vermont Department of
Health Statistics and Vital Records.
The fact that Vermont’s crude death rate exceeds that of the average U.S. death rate
reflects, in part, the fact that Vermont has an older and more rapidly aging population
than most of the country, as stated by the Vermont Department of Health (2018).
According to the 2019 U.S. Census, 20.7% of Vermonters were aged 65 years or older,
as compared to 16.5% nationally.
The top 5 leading causes of death in Vermont in 2018, in order, were heart disease,
cancer, accidents or unintentional injuries, chronic lower respiratory diseases, and
Alzheimer’s disease.
16Figure 3: Five leading causes of death in Vermont in 2018. This figure was created by the
Vermont Department of Health Statistics and Vital Records.
In 2020, the number of deaths in Vermont increased by at least 2%, according to the
CDC; some estimates put the total increase over normal rates as high as 11%,
according to VTDigger. COVID-19 infections contributed to this higher death rate, but
beyond infections, the COVID-19 pandemic contributed to deaths in other ways.
In addition, deaths due to Alzheimer’s disease and dementia were 50% higher in 2020
compared to 2019. Because those with memory loss were more likely to live in skilled
nursing facilities and more likely to take off their masks, they were at higher risk of
contracting COVID-19. Once those with Alzheimer’s contracted COVID, they were more
likely to fall seriously ill or die. Most skilled nursing facilities did not allow visitors during
the pandemic leading contributing to loneliness amongst these older Vermonters, which
may also have led to increased deaths related to Alzheimer’s disease. All in all, COVID-
19 significantly impacted this vulnerable population.
17Figure 4: Major causes of death in Vermont from 2015-2020. Figure was created by Erin Petenko
for VTDigger.
According to the Addison County Community Health Action Team (CHAT) Data Meeting
in 2019, three behaviors (poor nutrition, lack of exercise, and tobacco use) contribute to
four diseases (lung disease, diabetes, heart disease and cancer) that result in more
than 50% of the deaths in Addison County. This is the percentage of Addison County
adults diagnosed with the following chronic diseases:
● Lung Disease: 14%
● Diabetes: 8%
● Cardiovascular Diseases: 7%
● Cancer: 10%
This is the percentage of Addison County deaths by chronic illness:
● Lung Disease: 9%
● Diabetes 3%
● Cardiovascular Disease: 23%
● Cancer: 21%
2018 Community Profile conducted by the Vermont Blueprint for
Health
According to the Vermont Blueprint for Health - Middlebury Community Profile (2018),
adults served by Middlebury healthcare organizations have a higher rate of having a
personal doctor compared to the statewide average. Most adults served by Middlebury
healthcare organizations reside in Addison County, so for the rest of this section, they
will be referred to as Addison County adults. Addison County adults with hypertension
have a lower rate of in-control blood pressure compared to the state average. Addison
18County adults have a lower rate of diabetes compared to the state average and are
tested for diabetes more than the statewide average. However, of the people who have
diabetes, Addison County adults have higher rates of uncontrolled diabetes relative to
the statewide average. A table summarizing the Blueprint data below is at the end of
this section.
The graphs and figures in this section with blue titles are images copied directly from
the 2018 Vermont Blueprint for Health Community Profile and noted as such.
Figure taken from the Vermont Blueprint for Health.
The graph above shows the percentage of adults with a personal doctor. The red data
point is adults served by Middlebury healthcare organizations. These adults are slightly
more likely than the state average (blue dashed line) to have a personal doctor.
19Figure taken from the Vermont Blueprint for Health.
The Vermont Blueprint for Health figure above reveals that hypertensive patients whose
care is centered in Middlebury are less likely to have their blood pressure under control
– the second worse proportion across all areas in the state. The state average is shown
by the blue dotted line.
20Figure taken from the Vermont Blueprint for Health.
Vermont residents with care centered in Middlebury have a lower rate of diabetes than
the state overall, with the second lowest rate after Burlington.
21Figure taken from the Vermont Blueprint for Health.
Compared to the state average shown by the blue dotted line, patients with diabetes in
the Middlebury area are more likely to have received a hemoglobin A1c test.
22Figure taken from the Vermont Blueprint for Health.
The above figure shows the rate of uncontrolled diabetes in Vermont areas relative to
the statewide average (dotted blue line). Middlebury-area patients, as shown by the red
diamond, have diabetes that is less well-controlled (third worst in the state). This finding
stands in contrast to the previous finding indicating that Middlebury-area patients are
more likely to have received a hemoglobin A1c test.
23Figure taken from the Vermont Blueprint for Health.
Compared to the statewide average, adults served by healthcare organizations in
Middlebury are screened less often for tobacco use with an accompanying cessation
intervention.
24Figure taken from the Vermont Blueprint for Health.
Similar to the previous graph about tobacco use screening, adults served by Middlebury
healthcare organizations were screened at lower rates for clinical depression.
25Figure taken from the Vermont Blueprint for Health.
Unlike screenings for tobacco use and clinical depression, screenings for cervical
cancer were more common among patients with Middlebury-centered healthcare.
26Figure taken from the Vermont Blueprint for Health.
Similar to the findings on cervical cancer screenings, patients with Middlebury-centered
care were more likely to have received a chlamydia test as compared to the state
average.
27Figure taken from the Vermont Blueprint for Health.
Breast cancer screenings among Middlebury area patients were slightly more common
than the statewide average.
In summary, the Vermont Blueprint for Health 2018 Community Profile showed mixed
results:
Better than statewide average Worse than statewide average
Proportion of adults with a personal In-control blood pressure
doctor In-control diabetes
Rate of diabetes Screenings for:
Diabetes testing o Tobacco use
Screenings for: o Clinical depression
o Cervical cancer
o Chlamydia
o Breast cancer
28Women’s health screenings are occurring at better-than average rates among patients
with Middlebury-centered care. Interestingly, Middlebury area patients are screened
more often for diabetes and have lower rates of diabetes than the rest of the state, but
their diabetes is less well controlled.
Local Determinants of Health
In the summer of 2015, Schumacher and Berenbaum surveyed the local determinants
of health in Addison County, based on the opinions of experts who served at health and
social service organizations. This section will summarize important points from that
study that are applicable to this year’s CHNA, with some updated information.
Overall, Vermont is considerably healthier than the country as a whole. Vermont is the
second healthiest state in the country, and Vermont ranks number one in the health of
its senior citizens. However, Vermont has an especially vast amount of variation in its
citizens’ health status. Vermont also ranked number one in the Opportunity Index, which
measures opportunity and economic mobility. Though Vermont’s median income is
higher than the national average, Vermont has one of the highest costs of living in the
country.
In Vermont, Addison County has the fastest growing population people aged 85 years
and older. Addison County’s economy is largely agriculturally based, and many of the
workers on dairy farmers are migrant workers from Latin America.
Overall, Addison County has great rates of insurance coverage. Some barriers to
healthcare are a shortage of providers, lack of reliable transportation, cultural/personal
beliefs, and language and education. Health insurance coverage rates in Addison
County, as compared to the state of Vermont and the United States as a whole, are as
follows:
Addison County Vermont United States
95.3% 94.4% 90.5%
Table 3. Comparing Addison County’s insurance rates to Vermont and the United States. Source:
2019 Census Data.
For a rural county, Addison County has excellent public transportation. Tri-Valley
Transit, formerly known as Addison County Transit Resources (ACTR), is the main
public transportation provider in Addison County. Because this county is rural and
sparsely populated, more extensive public transportation is a challenge.
29Figure 5. Tri-Valley Transit’s System Map. Taken from the Tri-Valley Transit’s website.
There are high-quality health services available in Addison County, but there are long
wait-times to see providers. The problems with providers in Addison County are with
quantity, not quality. More specifically, there is a lack of capacity of mental health
services, drug treatment, and dental care. On the bright side, people tend to have
positive views of the local hospital and the emergency response teams. There also
tends to be good collaboration, coordination, and cooperation among agencies and
offices.
There are a number of unmet needs in Addison County. These include child care,
substance use disorder (SUD) treatment, mental health, dental health, housing
(especially affordable housing), and rural services.
Addison County has multiple factors that support healthy living. There are excellent
opportunities for physical activity and recreation, as well as healthy and fresh food
because of the agriculturally based economy. However, it is not easy to live a healthy
life if you live in rural isolation or if you lack money, education, or knowledge about
health. In addition, some challenges to accessible recreation are the lack of bike paths
in Addison County and the lack of sidewalks outside of the immediate downtown areas.
In the 5-10 years preceding Schumacher and Berenbaum’s 2015 report, there were
numerous changes within the county, as noted by the service providers interviewed: the
population was rapidly aging; the rate of poverty seemed to be increasing; families were
having fewer children; and there were more disengaged youth. There was a major
increase in SUD, particularly opiates. There was also a shift from inpatient mental
health care services to community-based care.
30Because of the closing of several Vermont inpatient mental health institutions, some
people with severe mental health issues are not receiving adequate treatment, mainly
because of the shortage of beds for inpatient mental health. Some barriers to mental
health care include stigma and a long waitlist. In addition, it can be cost-prohibitive to
seek mental healthcare because it is often poorly covered by insurance.
Regarding substance use disorder, some experts believe that significant progress has
been made in tackling opiate addiction. However, there are barriers to tackling SUD
included the lack of sober housing options in Addison County. Additionally, there is
stigma attached to opiate use, leading to some people feeling more reluctance to seek
help. SUD can have trickle-down effects in families, where parental SUD can affect
children’s health and development.
Like much of the rest of America, there is an income divide within Addison County. This
income divide is at times referred to as “two Addison Counties.” Because of this divide,
middle class people are underserved. They make too much income to qualify for
government assistance, but they cannot pay for everything they need. In short, those in
the middle of the two extremes often struggle.
There are people who are eligible and could benefit from services but have not been
reached. Some of these people do not reach out or because they have highly
specialized needs. This include middle-class people for the reasons elucidated above.
There are also logistical challenges for people who might need medical services; for
instance, the services may only be offered during work hours, or they might not have
adequate transportation or child care to make the visit possible. Some people may lack
information about available services, and others may not reach out to access these
services because of fear of stigma.
2020 Achievements
The 2020 Annual Report on the Vermont Blueprint for Health highlighted the challenges
that healthcare organizations faced in 2020, as well as their achievements. To address
chronic conditions, the Farmacy Program expanded and the Food Bags project was
piloted. The Farmacy project doubled in participants in 2020, from 30 Porter participants
in 2019 to 60 participants in 2020. Participants received free weekly shares of locally
grown produce for 12 weeks between July and September, along with resources and
nutrition education. The Farmacy Program was created to provide individuals with type
II diabetes, heart disease, and other diet-related illnesses with healthy food while
offering local farmers new and sustainable markets. With 14% of Vermont children living
in food insecure households and over 50% of deaths in Vermont resulting from food and
nutrition related illnesses, the Farmacy Program is addressing pressing issues
regarding health and food access. 2020 was an opportune time to expand the Farmacy
Program, as there was a greater need for food and nutrition due to the COVID-19
pandemic.
31The Food Bags project was piloted at Porter Women’s Health and was facilitated by
Community Health Team (CHT) Registered Dieticians and the embedded Women’s
Health Initiative (WHI) Social Worker. The distributed bags contained healthy non-
perishable food items, intended to last a family of four for 2-3 days, as well as dental
supplies such as toothbrushes, toothpaste, and dental floss. The bags also contained a
food resource guide for Addison County, for use after the 2-3 days.
The COVID-19 pandemic caused a rapid shift to telehealth, which allowed for the
Vermont Blueprint for Health to formalize a CHT service model that reduces common
barriers to care access, such as transportation, lack of childcare, and scheduling
challenges. This telehealth model uses both phone and video conferencing platforms. In
addition, several self-management programs, geared at supporting individuals with
chronic conditions, transitioned to telehealth during the pandemic. This transition to
telehealth helped reach more people who may have had transportation issues in the
past. Many primary care practices also expanded telehealth services as a result of the
pandemic.
Medication-Assisted Treatment (MAT) for Opioid Use Disorder (OUD) is a well-
supported initiative from the Vermont Blueprint for Health. Mountain Health Center
made their mobile unit available for MAT, increasing access outside of their main
location in Bristol. The mobile unit was successful during its first few months, but
unfortunately, due to COVID-19, the mobile unit was placed on hold. In addition, Rapid
Access to MAT was started at Porter Hospital in January 2020, in collaboration with
SaVida and Turning Point Center (TPC). All of the doctors in the Emergency
Department (ED) were x-waivered, and patients seen in the ED for OUD were treated,
referred to SaVida in Vergennes to be seen within 3 days, and connected with a peer
recovery coach from TPC.
The Resiliency Campaign “OK, You’ve Got This” significantly expanded. Because the
COVID-19 pandemic added another layer of stress on families and youth, community
partners refocused efforts to support family needs during this time. The campaign has
shifted to “OK, We’ve Got This,” demonstrating that the community is in this together. In
2020, additional resources were made available to parents to support children
accessing school from home and to give parents tools to discuss the pandemic and
social distancing. Additionally, monthly mini webinars were developed surrounding
mindfulness, stress management, activities for families, and much more.
The Addison County Community Trust was able to create 36 affordable housing units in
Vergennes, VT, which can accommodate both single and family needs and are already
at full capacity. In early 2020, Porter Medical Center, in collaboration with Tri-Valley
Transit, was awarded a Rides to Wellness Grant. Subsequently, gas cards were
distributed to several health and wellness offices, such as Primary Care, SaVida,
Turning Point Center, and the Health Department, to help individuals physically access
these resources.
32Early Childhood Systems Needs Assessment 2020
In 2020, Building Bright Futures conducted a needs assessment by collecting data
through surveys, focus groups with childhood providers, families, and community
leaders. They also reviewed 18 documents with data on the status of children and
families in Vermont. The assessment found gaps in the following areas: equity, quality,
mental health, workforce, system integration, family engagement, resources, and
funding and high quality data.
A report published by Let’s Grow Kids in 2020, found that 62% of infants likely to need
care do not have access to programs. Other barriers included transportation, cost,
application forms, and eligibility (Figure 6).
Figure 6: Barriers to Needed Services for Children Ages 0-21. Taken from 2020 Final Vermont Early Childcare Needs
Assessment, Building Bright Futures
In 2019, Designated Agencies reported 3,171 children accessed services in Vermont.
Additionally, the How are Vermont’s Young Children and Families Report indicated that
in 2019, 1 in 5 children between the ages of six and eight had a social, emotional, or
behavioral health condition. The 2020 How are Vermont’s Young Children and Families
Report indicates that there are 2,901 children under the age of 9 in Addison County, 45
of which are in and out of home custody. Additionally, 34% of children under 6 years of
age are living in poverty.
33Chapter 5 - Summary of Community Survey
Results
The bulk of the Community Health Needs Assessment primary data was gathered by a
survey, as described earlier in this document. Participants had the option of filling out
the survey either online on Survey Monkey or on paper. Paper surveys were placed in
locations such as the Open Door Clinic and laundromats. This chapter is a description
of the results. See Chapter Three for more information on the primary data collection
process.
Demographics and Representativeness of the Survey
Age and Gender
Female 577 75.82%
Male 151 19.84%
Prefer not to
Respond 20 2.63%
Transgender
Female 2 0.26%
Transgender
Male 0 0.00%
Gender
Variant/ Non-
Conforming 4 0.53%
No Response 7 0.92%
Total 761 100.00%
Table 4: Participant gender and percentage of respondents by participant self-identification.
34Figure 7: Participant gender by self-identification in survey.
Participants self-identified their gender in the first question of the second section of the
distributed survey. The available categories were “female,” “male,” “transgender
female,” “transgender male,” “gender variant/ non-conforming,” and “prefer not to
respond.” Seven of the 761 participants did not answer this question, and they are
categorized differently from those who specifically said that they preferred not to
respond. Note that the majority of respondents self-identified as female, at over 75%;
less than 20% identified as male; the third-largest category (with 20 people) was “prefer
not to respond”; and there were no transgender males, so therefore this category is not
included in the pie chart pictured above. According to the 2019 United States Census,
50.8% of Addison County residents were female, indicating that female participants
were overrepresented in this study, and all other genders were underrepresented.
18-24 5 0.66%
25-39 122 16.00%
40-64 359 47.17%
65+ 275 36.14%
Total 761 99.97%
Table 5: Respondent age.
35Figure 8: Respondent age.
Participant age, sorted into four age groups that were created based on survey
respondents’ self-reported year of birth, is displayed above in a table and pie chart.
According to the US Census, in 2019 just 20.7% of Addison County residents were age
65 or older, meaning that this age group is overrepresented in our sample population,
where over 36% of respondents fell into this age category. The 18-24 age group is also
significantly underrepresented, making up less than 1% of survey participants.
Age Female Male Other % of Total
18-24 100.00% 0.00% 0.00% 0.66%
25-39 86.07% 9.02% 4.92% 16.00%
40-64 77.44% 17.27% 5.29% 47.17%
65+ 68.73% 28.36% 2.91% 36.14%
Total 76.32% 19.97% 4.37% 100%
Table 7: Participant gender by age (percentages).
36Figure 9: Participant gender by age (counts).
The table above displays the percentage of each age group that fell into each gender
category. The “other” category was created to encompass individuals who identified as
transgender, gender variant or non-confirming, and those who did not respond to the
question or preferred not to identify their gender; this aggregation was performed in
order to preserve anonymity, as explained in the Methods section above. The figure
above displays this information in a graph, showing that the majority of each age group
identified as female. The entirety of the youngest age group, which was 18-24 years,
was female.
Race
Figure 10. Survey respondents’ races (counts).
37Figure 11. Survey respondents’ races (percentages). Figure 12. Addison County residents’ races (percentages). Source: US Census Quick Facts 2019. 38
As seen from the graphs above, the relative percentages of the races of the survey
respondents were largely similar to the races of all Addison County residents. Because
of the amount of people who elected not to answer, it appears that several
demographics are at least slightly underrepresented on the survey, with Hispanic or
Latino, Black or African American, American Indian and Alaska Native, Asian, and
multiracial people being noticeably underrepresented on the survey.

Town of Residence

Question #2 asked respondents to write in the name of their town of residence. The
frequency of responses are shown in the table below.
                       Middlebury                 288         37.94%
                       Bristol                     79         10.41%
                       Cornwall                    64          8.43%
                       Vergennes                   44          5.80%
                       New Haven                   39          5.14%
                       Lincoln                     31          4.08%
                       Ferrisburgh                 31          4.08%
                       Monkton                     28          3.69%
                       Bridport                    18          2.37%
                       Addison                     17          2.24%
                       Weybridge                   16          2.11%
                       Salisbury                   15          1.98%
                       Shoreham                    15          1.98%
                       Orwell                      10          1.32%
                       Starksboro                  10          1.32%
                       Brandon                      9          1.19%
                       Ripton                       8          1.05%
                       Waltham                      5          0.66%
                       Whiting                      5          0.66%
                       Other                       27          3.56%
                       Total                      759        100.00%
                      Table 6: Survey respondents’ towns of residence (percentages).

     39
Figure 13: Survey respondents’ towns of residence (counts).
The towns in which survey respondents reside are pictured above. The “other” category
is a sum of residents of towns from which there were less than five respondents. These
towns were Panton, from which there were four respondents, Leicester, from which
there were three respondents, Benson, from which there were two, Crown Point, NY,
from which there were two, Hinesburg, from which there were two, and Bomoseen,
Charlotte, Fair Haven, Forest Dale, Goshen, Granville, Huntington, Poultney, Richmond,
Rochester, Rutland, South Burlington, Ticonderoga, NY, and Williston, all of which had
one resident from these towns. The highest percentage of respondents were from
Middlebury, including six people who specified that they were from East Middlebury.
Over 37% of respondents were from Middlebury, which shows an overrepresentation
when looking at 2018 Vital Statistics that show that only 23.65% of county residents live
in Middlebury. When looking at these two sets of data side by side, it also becomes
clear that Hancock was the one town in Addison County not represented in the CHNA
survey demographic at all. After Middlebury residents, the next-largest group of
respondents were those from Bristol, making up 10.41% of responses. Fifteen
participants wrote in towns of residence not included in the listed towns in Addison
County. They were from towns in the nearby Rutland, Chittenden, and Windsor
Counties. Three respondents live across the lake in New York but work or access care
in Addison County.
40Household Makeup
Figure 14: Are there elders dependent on you for care or support?
Roughly one fifth of survey respondents said that they had elders dependent on them
for care or support. This statistic could potentially be complicated by the fact that
36.14% of survey respondents were aged 65 or over to begin with.
Figure 15: Are there children under 21 in your household?
Less than one third of respondent households have children under 21 in their homes.
41Employment, Income, and Education
Figure 16: Employment.
The figure above displays how many respondents described their employment status as
full-time, part-time, self-employed, student, unemployed, homemaker, or 1 or more of
the aforementioned options.
Figure 17: Reported household income.
42Most respondents answered the survey question about annual household income (755
out of 761), but 10% of these 755 selected that they preferred not to answer. The
majority of respondents had an annual household income over $50,000, and the figure
above shows that around 8% of respondent households fell below the poverty line. This
aligns fairly well with US Census data from 2019 regarding the percent of people living
in poverty in Addison County. Additionally, the US Census found that the median
household income in 2019 in Addison County was $68,000, and the median household
income of respondents from this survey also fell in the $50,000-$99,999 range.
Figure 18: Education.
As is visible in the figure above, the overwhelming majority of respondents in this CHNA
survey completed a degree in higher education, either at the undergraduate or graduate
level. Less than 1% of people who responded to the survey had not finished high
school, while 10% had attended some college, 33% had completed a bachelor’s
degree, and over 40% had completed a graduate degree. This draws stark contrast to
2019 US Census data, which says that 39.6% of people in Addison County had a
bachelor’s degree or higher. A total of 75.4% of survey respondents had a bachelor’s
degree or higher, showing a strong over-representation of higher levels of education
among survey respondents in comparison to the general population of Addison County.
43You can also read