Prepared by: The Health Planning Council of Southwest Florida, Inc.
←
→
Page content transcription
If your browser does not render page correctly, please read the page content below

Prepared by: The Health Planning Council of Southwest Florida, Inc.
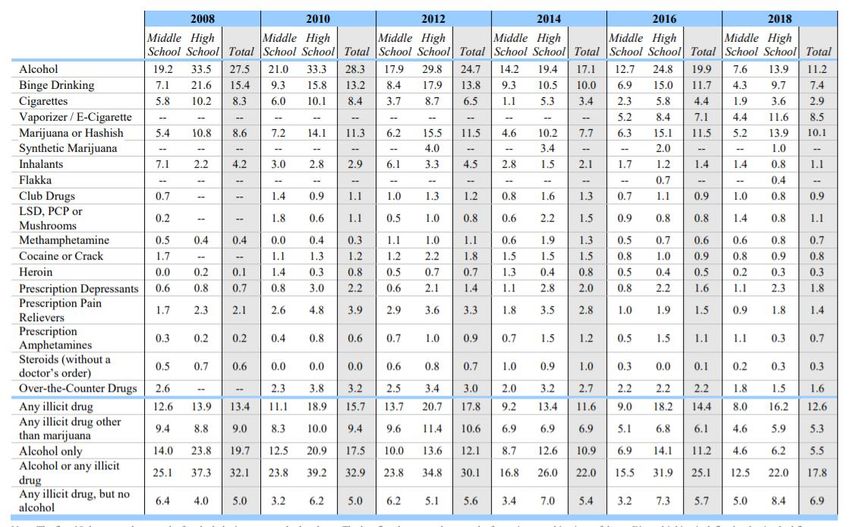
Table of Contents

Introduction ...................................................................................................................................... 4
    Methodology ............................................................................................................................................ 5
    Visioning ................................................................................................................................................... 5
Demographic and Socioeconomic Characteristics ................................................................................ 7
    Population Demographics ........................................................................................................................ 7
    Population Growth ................................................................................................................................... 8
    Age ........................................................................................................................................................... 9
    Gender ..................................................................................................................................................... 9
    Race and Ethnicity .................................................................................................................................. 10
    Socioeconomic Indicators ...................................................................................................................... 12
    Housing .................................................................................................................................................. 12
Health Status ................................................................................................................................... 14
    Health Ranking ....................................................................................................................................... 14
    Leading Causes of Death ........................................................................................................................ 15
    Chronic Diseases .................................................................................................................................... 24
    Communicable Diseases ........................................................................................................................ 28
    Maternal and Child Health ..................................................................................................................... 31
    Hospitalizations ...................................................................................................................................... 33
    Emergency Room Visits .......................................................................................................................... 37
Health Resources ............................................................................................................................. 39
    Medicaid................................................................................................................................................. 39
    Uninsured ............................................................................................................................................... 40
    Physicians and Facilities ......................................................................................................................... 41
    Federal Health Professional Shortage Designations .............................................................................. 42
Social and Mental Health ................................................................................................................. 44
    Suicides .................................................................................................................................................. 44
    Baker Act ................................................................................................................................................ 44
    Crime and Domestic Violence ................................................................................................................ 46
    Florida Youth Substance Abuse Survey .................................................................................................. 48
    Behavioral Risk Factor Surveillance Survey............................................................................................ 51
    Healthy People 2020 Objectives ............................................................................................................ 52
Community Input ............................................................................................................................. 55
    Survey on Health and Healthcare .......................................................................................................... 55
    Interviews with Community Leaders ..................................................................................................... 63
Dissemination Plan .......................................................................................................................... 68

                                                                                  2
Hendry County                                                                                                       Health Planning Council of SW Florida, Inc.
Community Health Assessment                                                                                                                              2019
Appendices:
   Appendix A:     Healthier Hendry Glades Taskforce Members ................................................................. 69
   Appendix B:     Survey on Health and Healthcare .................................................................................... 70
   Appendix C:     Key Informant Interview Guide ........................................................................................ 72
   Appendix D:     Community Leaders Interviewed ..................................................................................... 74
   Appendix F:     County Health Rankings ................................................................................................... 75
   Appendix G:     Definitions of Prevention Quality Indicators ................................................................... 76
   Appendix H:     Florida Youth Substance Abuse Survey ........................................................................... 77
   Appendix I:     Behavioral Risk Factor Surveillance Survey ..................................................................... 78
   Appendix J:     Hendry County Guide to Health Services ......................................................................... 83
   Appendix K:     Selected Data Sources ..................................................................................................... 89

                                                                       3
Hendry County                                                                                        Health Planning Council of SW Florida, Inc.
Community Health Assessment                                                                                                               2019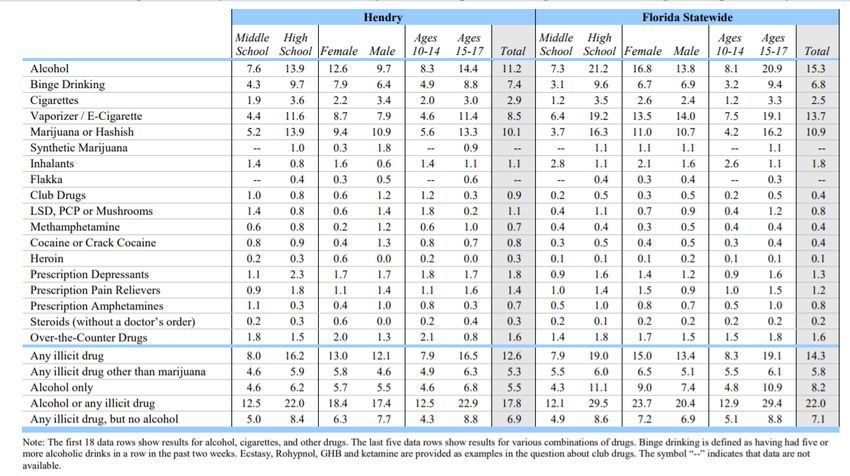
Introduction and Methodology
In an effort to improve the health of the residents of Hendry County, a collaborative partnership was
formed between the Florida Department of Health in Hendry County, Hendry Regional Medical Center and
the Health Planning Council of Southwest Florida, Inc. (HPC) for the purpose of conducting a needs
assessment for use by the Florida Department of Health in Hendry County, Hendry Regional Medical
Center and other community partners.

The Healthier Hendry Glades Taskforce is a community committee comprised of area residents and
community leaders who showed an interest in improving the health of their community. This group was
created to work on a previous Health Assessment and have continued to meet consistently to discuss
ways to improve the health of the community. This group served as the community advisors for this
Assessment. A list of participating members of the Healthier Hendry Glades Task Force (Healthier Hendry
Glades) is available in Appendix A. This group held monthly meetings for the duration of the project to aid
in the creation and implementation of this needs assessment.

MAPP Process

The Florida Department of Health in Hendry and Glades Counties and the Healthier Hendry Glades Task
Forces decided on using a modified MAPP process. The group considered the various elements of the
MAPP process through their monthly meetings and stand-alone planning sessions. The planning elements
included:

         1. Phase One - Organize for Success: The group discussed the plan for the assessment and the
            relevant partners needed for success during a Healthier Hendry Glades Taskforce meeting on
            January 23, 2019.

         2. Phase Two - Visioning: The group conducted a visioning exercise to define the community
            vision for what a healthy community in Hendry and Glades Counties could look like on April
            24, 2019. The results of this exercise are available below.

         3. Phase Three - The four assessments:

                   a. Community Themes and Strengths: The group conducted interviews and a community
                      survey to help identify community themes and strengths. These took place between
                      January 2019 and March 2019.
                   b. Local Public Health System Assessment: The strengths and weaknesses of the local
                      public health system were discussed during a planning session including a SWOT
                      Analysis on April 11, 2019
                   c. Community Health Status Assessment: Data was collected and analyzed for the
                      Community Health Status Assessment. Data was reviewed and discussed over the
                      course of two task force meetings on March 16, 2019 and April 24, 2019
                   d. Forces of Change: The forces of change were part of the planning session discussion
                      and SWOT and TOWS discussion on April 11, 2019

         4. Phase Four - Identify Strategic Issues: During a half-day planning session on July 15, 2019, the
            Healthier Hendry Glades Task Force members identified three strategic issues of focus. This
            was further refined during a task force meeting on August 28, 2019.

                                                      4
Hendry County                                                               Health Planning Council of SW Florida, Inc.
Community Health Assessment                                                                                      2019
5. Phase Five - Formulate Goals and Strategies: The Healthier Hendry Glades Task Force
            brainstormed ideas for goals and strategies in workgroups on July 15, 2019. This discussion
            was continued and solidified at the task force meeting on August 28, 2019.

         6. Phase Six - Action Cycle: The Healthier Hendry Glades Task Force will be meeting bi-monthly
            on the first Friday of every month to review progress against the action plan and to make any
            necessary process revisions to the plan. At the annual review session, a full review and
            revision of the plan will be conducted. The annual review session will include an evaluation of
            progress and a survey of partners to allow for feedback and input from the community.

Visioning

The Healthier Hendry Glades Taskforce was asked how they would describe a healthy community or what
a health community means to them. Using the Mentimeter tool, they supplied 53 responses. These
responses were compiled in the form of a word cloud. The most common responses were active, safe,
happy, proactive, fun, supportive, productive, involved individuals and mentally healthy.

Source: Healthier Hendry Glades Taskforce via Mentimeter, Spring 2019

                                                              5
Hendry County                                                              Health Planning Council of SW Florida, Inc.
Community Health Assessment                                                                                     2019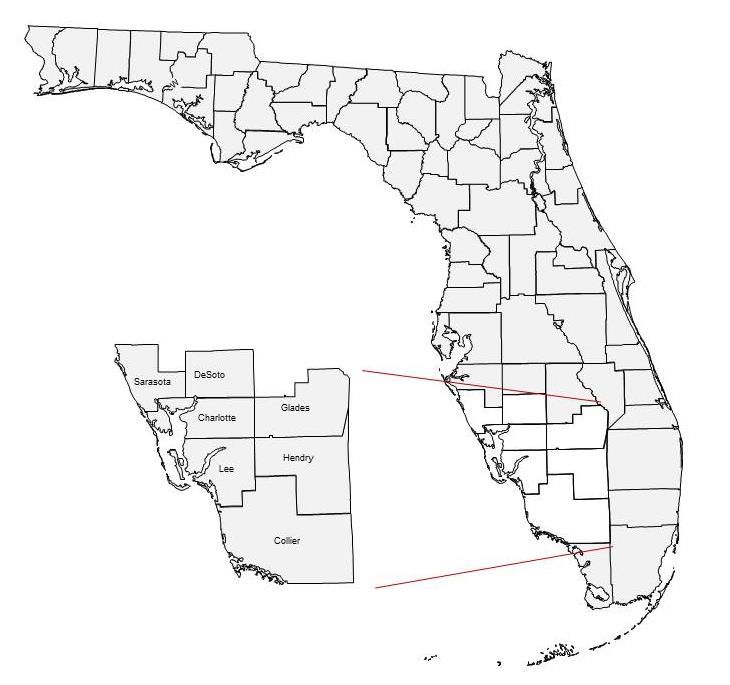
Next, the Healthier Hendry Glades Taskforce was asked to describe the current health of Hendry and
Glades Counties. Using the Mentimeter tool, they supplied 52 responses. These responses were also
presented in the form of a word cloud. The most common responses were overweight, poor, stressed,
challenged, rural, work in progress, segregated, obese and good intentions. They indicate that there is
potential room for improvement for the health in the area.

Source: Healthier Hendry Glades Taskforce via Mentimeter, Spring 2019

HPC reviewed numerous data sources and received feedback from the Healthier Hendry Glades Task Force
as well as from members of the community through surveys and interviews. The Healthier Hendry Glades
Task Force reviewed the preliminary data that was collected, and provided feedback to the Health
Planning Council.

This needs assessment consists of demographic, socioeconomic and health status information that will be
used to identify areas where targeted interventions and policy changes may have the greatest impact.
Once community needs are identified through quantitative data analysis of demographic, socioeconomic
and health status information, and qualitative interviews, the strategic planning process can begin.

                                                              6
Hendry County                                                             Health Planning Council of SW Florida, Inc.
Community Health Assessment                                                                                    2019
Demographic and Socioeconomic Characteristics
The demographic, social and economic characteristics of a community can strongly influence the
community’s health status and related service needs. These indicators should be a primary consideration
when designing and developing any system of care within the region. This section provides a brief
overview of some of the characteristics and trends that make Hendry County unique in comparison to the
state of Florida.
Population Demographics
The sheer number of people in a community is the leading determinant of the demand for healthcare
services. Hendry County, which has a population of just over 38,000, is located in southwest Florida (Fig.
1). The county also shares borders with the following counties: Glades to the north; Martin and
Okeechobee to the northeast; Palm Beach to the east; Broward to the southeast; Collier to the south; and
Lee and Charlotte to the west. As seen in Figure 2, Hendry is one of seven counties in southwest Florida
that comprise the Local Health Planning District 8 as designated by the Florida Agency for Health Care
Administration (AHCA). LaBelle is the county seat. Clewiston is the largest and most populous
incorporated area. Hendry County is 1,189.79 square miles in area; about 3 percent of that area is
covered by water. The county has a population density of about 34 persons per square mile compared to a
state average of 392 persons per square mile. Hendry County is considered a rural county.
Figure 1: Figure 2:
7
Hendry County Health Planning Council of SW Florida, Inc.
Community Health Assessment 2019Population Growth
The illustration below represents the total population of Hendry County from 2007-2017. The estimate
for 2017 places the population of Hendry County at 38,675. This number has been growing since 2013,
however it is slightly lower than it was in 2007-2011). The spike in 2010 represents a census year when
there was a more complete count. The next census year is 2020.
Chart 1: Total Population Hendry County, 2007-2017
40,955
41,000
40,500
40,000
39,500 39,036 39,165 39,103
39,000 38,734 38,675
38,436
38,500 38,160
37,991
37,806 37,939
38,000
37,500
37,000
36,500
36,000
2007 2008 2009 2010 2011 2012 2013 2014 2015 2016 2017
Source: The Florida Legislature, Office of Economic and Demographic Research
Population growth in a community is the result of natural increase (more births than deaths) and also the
migration of people moving into the area at a higher rate than those who are leaving. According to the
Office of Economic and Demographic Research, the population of Hendry County is expected to continue
to grow in the coming years. In 2022, it is estimated that the population of Hendry County will be 40,560;
that is an increase of about two percent from the same number for 2018.
Chart 2: Estimated Population Hendry County, 2018-
2022
40,560
40,600
40,300
40,400 40,080
40,200 39,907
40,000 39,682
39,800
39,600
39,400
39,200
2018 2019 2020 2021 2022
Estimated Population
Source: The Florida Legislature, Office of Economic and Demographic Research
8
Hendry County Health Planning Council of SW Florida, Inc.
Community Health Assessment 2019Age
The average age for residents of Hendry County is about the same as the average age of residents of
Florida. The largest proportion of the population of the county is between the ages of 25 and 44 while the
largest proportion of the population for the state is between 45 and 64. Approximately thirty-six percent
of the population in Hendry is under the age of 25 and approximately thirteen percent are 65 or older.
Chart 3: Population Percentage by Age Group,
Hendry County & Florida, 2017
30 26.8 26.6
25.0
25 23.6
20
15.1
13.7
15 11.2 12.0 11.0
8.8
10 7.5 7.5
5.5 5.7
5
0
74
Hendry County Florida
Source: The Florida Legislature, Office of Economic and Demographic Research
Gender
There are significantly more men than women in Hendry County. Approximately, 52 percent of the
residents of Hendry County are male while about 48 percent are female; statewide the percentages are 51
percent female and 49 percent male. Nationwide females outnumber males, but it is not uncommon for
men to outnumber women in rural areas.
9
Hendry County Health Planning Council of SW Florida, Inc.
Community Health Assessment 2019Chart 4: Population by Sex
Hendry County & Florida, 2017
52%
53%
51%
52%
51%
49%
50%
49% 48%
48%
47%
46%
45%
Percent Male Percent Female
Hendry County Florida
Source: The Florida Legislature, Office of Economic and Demographic Research
Race and Ethnicity
17.4 percent of the population of Hendry County is non-white; compared to a statewide population
comprised of 21.5 percent non-whites. Approximately 4.7 percent of the population is listed as “Other
non-white”. This category includes American Indian, Alaskan Native, Asian, Native Hawaiian, and other
Pacific Islanders, and those of mixed race who chose not to select white or black.
Chart 5: Hendry County Population by Race, 2017
4.70%
12.70%
82.60%
White Black Other
Source: The Florida Legislature, Office of Economic and Demographic Research
10
Hendry County Health Planning Council of SW Florida, Inc.
Community Health Assessment 2019Ethnicity in Florida is broken out separately from race. For ethnicity, a person must designate themselves
as Hispanic or Non-Hispanic; people in both of those groups can identify as white, black or other non-
white. About 52 percent of the residents of Hendry County identify as Hispanic; this is significantly higher
than the state average. The vast majority of the people in Hendry County who identify as Hispanic identify
as white.
Table 1: Race and Ethnicity, 2017
Hendry State
Hispanic Non-Hispanic Hispanic Non-Hispanic
White 49.2% 33.4% White 22.8% 54.7%
Black 1.3% 11.4% Black 1.3% 15.6%
Other 1.6% 3.2% Other 0.9% 4.7%
Total 52% 48% Total 25% 75%
Source: The Florida Legislature, Office of Economic and Demographic Research
11
Hendry County Health Planning Council of SW Florida, Inc.
Community Health Assessment 2019Socioeconomic Indicators
The figures shown below summarize some of the primary indicators of economic health for the county
and state. Like the rest of Florida, Hendry County was hit hard by the economic downturn. The
unemployment rate jumped from 7.2 percent in 2000 to 14.7 percent in 2010. As of 2017, it has reduced
to 8.2 percent. That is higher than the state rate of 7.2 percent.
The percent of people living under the poverty level in Hendry County is significantly higher than the state
as a whole. Unfortunately, that also holds true for the percent of children 0-17 years of age who are under
the poverty level; that rate is 31.1 percent for Hendry County compared to 22.3 percent for the state. On a
positive note, the county rate has improved from 39.8 percent in 2010.
Table 2: Socioeconomic Indicators
Hendry County and State, 2017
Hendry State
Civilian Labor Force which is unemployed 8.2% 7.2%
Median Household Income $37,966 $50,883
Individuals Below Poverty Level 9,739 3,070,972
% Living Below Poverty Level 25.5% 15.5%
% of Individuals Under 18 Below Poverty Level 31.1% 22.3%
Source: The Florida Legislature, Office of Economic and Demographic Research
Hendry County lags behind the state average for educational attainment. Far fewer residents of Hendry
County have received a high school diploma than the state average. Also a much lower percentage of
people in Hendry County who are aged 25 and older have received a Bachelor’s degree than the
percentage of residents of Florida who have done the same.
Table 3: Educational Attainment
Persons aged 25 and older, Hendry and State, 2017
Hendry State
% High School graduate or higher 62.9% 87.2%
% Bachelor's degree or higher 9.1% 27.9%
Source: The Florida Legislature, Office of Economic and Demographic Research
Housing
Table 4: Housing Occupancy
Hendry and State, 2013 - 2017
Hendry State
Occupied housing units (%) 82.5 81.1
Owner-occupied (%) 65.4 64.8
Renter-occupied (%) 34.6 35.2
Household size owner-occupied unit 3.16 2.62
Household size renter-occupied unit 2.91 2.69
12
Hendry County Health Planning Council of SW Florida, Inc.
Community Health Assessment 2019Vacant housing units (%) 17.5 18.9
Homeowner vacancy (%) 1.2 2.4
Rental vacancy (%) 3.2 8.5
Occupying mobile home (%) 41.3 9.1
Occupying boat, RV, van, etc. (%) 0.5 0.1
Median value of owner-occupied units (dollars $79,700 $178,700
Source: US Census Bureau DP04 Selected Housing Characteristics
As seen in Chart 6, among working adults in Hendry County the most common sectors of employment are:
natural resources and mining, government and trade, transportation, and utilities. Natural resources and
mining represents about one-third of all employment in Hendry County, by far the largest industry.
Chart 6: Average Annual Employment, % of All Industries, 2017
12.4%
Government 17.5%
3.2%
Other Services 1.8%
14.1%
Leisure and Hospitality 8.4%
14.8%
Education & Health Services 6.9%
15.6%
Professional & Business Services 5.8%
6.6%
Financial Activities 2.3%
1.6%
Information 0.5%
20.5%
Trade, Transportation and Utilities 14.6%
4.3%
Manufacturing 3.5%
5.9%
Construction 5.4%
0.9%
Natural Resources & Mining 33.2%
0.0% 5.0% 10.0% 15.0% 20.0% 25.0% 30.0% 35.0%
Florida Hendry County
Source: Florida Legislature, Office of Economic and Demographic Research
13
Hendry County Health Planning Council of SW Florida, Inc.
Community Health Assessment 2019Health Status
Health Ranking
County Health Rankings & Roadmaps, a collaboration between the Robert Wood Johnson Foundation and
the University of Wisconsin Population Health Institute, has Hendry County currently ranked the 33rd
healthiest out of 67 counties in Florida for Health Outcomes, and 65th healthiest for Health Factors. These
rankings are based on a variety of factors that affect the health of the county’s residents such as
unemployment, levels of physical inactivity, and rates of smoking, obesity, and children living in poverty.
Table 5: County Health Ranking, 2018
Hendry County
Rank
Hendry Error Top U.S.
Florida (of
County Margin Performers
67)
Health Outcomes 33
Length of Life 32
Premature death 8,300 7,300- 5,400 7,200
9,300
Quality of Life 30
Poor or fair health 24% 24-25% 12% 19%
Poor physical health days 4.4 4.3-4.5 3.0 3.8
Poor mental health days 3.8 3.7-3.9 3.1 3.8
Low birthweight 8% 7-9% 6% 9%
Health Factors 65
Health Behaviors 36
Adult smoking 15% 15-16% 14% 15%
Adult obesity 33% 28-38% 26% 27%
Physical inactivity 33% 28-37% 19% 25%
Access to exercise opportunities 63% 91% 88%
Excessive drinking 16% 16-17% 13% 18%
Alcohol-impaired driving deaths 32% 25-39% 13% 25%
Sexually transmitted infections 521.5 152.8 467.4
Teen births 50 45-55 14 23
Food insecurity 13% 9% 14%
Limited Access to Healthy Foods 15% 2% 7%
Motor Vehicle Crash Deaths 27 21-34 9 14
Clinical Care 65
Uninsured 25% 22-27% 6% 15%
Primary care physicians 2,810:1 1,050:1 1,390:1
Dentists 2,520:1 1,260:1 1,700:1
14
Hendry County Health Planning Council of SW Florida, Inc.
Community Health Assessment 2019Mental Health Providers 2,240:1 310:1 670:1
Preventable hospital stays 6,556 2,765 5,066
Hendry Error Top U.S. Florida Rank
Definitions for each measure are listed on the Country Margin Performers (of
next pages 67)
Mammography screening 33% 49% 42%
Flu vaccinations 32% 52% 41%
Social & Economic Factors 67
High school graduation 86% 96% 82%
Some college 32% 26-38% 73% 62%
Unemployment 7.2% 2.9% 4.2%
Children in poverty 35% 26-44% 11% 21%
Income inequality 4.6 4.0-5.3 3.7 4.7
Children in single-parent households 46% 37-54% 20% 38%
Social associations 8.9 21.9 7.1
Violent crime 560 63 484
Injury deaths 79 67-92 57 76
Physical Environment 11
Air pollution - particulate matter 7.3 6.1 8.2
Drinking water violations Yes
Severe housing problems 22% 18-26% 9% 21%
Driving alone to work 64% 60-69% 72% 79%
Long commute - driving alone 37% 31-43% 15% 40%
Source: Robert Wood Johnson Foundation and the University of Wisconsin Population Health Institute
Leading Causes of Death
Mortality rates can be key indicators of the state of health of a community. A significant number of
Hendry County’s deaths are premature and preventable. Behavior modification and risk reduction can
reduce the mortality rates of many of the leading causes of death, especially those attributed to heart
disease, stroke, diabetes, lung cancer and motor vehicle accidents. Individuals may improve both the
length and the quality of their lives by simply following a healthy lifestyle and receiving regular medical
care.
Table 5 gives detailed information on the leading causes of death for residents of Hendry County in 2017.
The Deaths column is a simple count of the number of people who died by the listed cause during 2017.
Percent of Total deaths lets you know what percent of the people who died in 2017 died from that cause.
Crude Rate per 100,000 gives a sense of how likely a person is to die of that cause in any given year. For
example, out of every 100,000 people in Hendry County, 206.9 of them died of heart disease in 2017.
Since there are fewer than 100,000 people in Hendry County the rates per 100,000 are higher than the
actual number of people who died, which in the case of heart disease was 80. Using the rate per 100,000
allows comparison between areas with different populations such as comparing a small county to a large
county or a county to the state.
15
Hendry County Health Planning Council of SW Florida, Inc.
Community Health Assessment 2019The next column lists the Age-Adjusted Death Rate per 100,000. Age-adjusting a rate is a way to make
fairer comparisons between groups with different age distributions. For example, a county having a higher
percentage of elderly people may have a higher rate of death or hospitalization than a county with a
younger population merely because the elderly are more likely to die or be hospitalized. The same
distortion can happen when we compare races, genders, or time periods. Age adjustment can make the
different groups more comparable.
The 3-Year Age-Adjusted Death Rate per 100,000 gives an average of the three years ending in 2017
(2015, 2016, and 2017). A small increase or decrease in the number of deaths in a given year can make a
big difference in the rate so averages are used to flatten out large fluctuations.
The last column is Years of Potential Life Lost. This is an estimate of the number of years a person would
have lived had they not died prematurely. In this case that number is given for all people who died under
the age of 75 assuming that they would have lived to the age of 75. When the numbers are particularly
low, such as they are for Alzheimer’s disease, it is generally because that cause of death largely impacts
the elderly. Conversely, a particularly high number suggests that the average age of the victims was fairly
young.
Table 6: Leading Causes of Death, 2018
Hendry County
Deaths Percent Crude Age- 3-Year YPLL <
of Total Rate Per Adjusted Age- 75 Per
Deaths 100,000 Death Adjusted 100,000
Rate Per Death Under
100,000 Rate Per 75
Cause of Death 100,000
All Causes 291 100.0 752.4 731.5 749.7 8,328.3
Heart Disease 80 27.5 206.9 195.6 187.3 1,398.8
Cancer 52 17.9 134.5 129.2 145.3 949.0
Unintentional Injury 23 7.9 59.5 61.9 64.3 1,744.4
Chronic Lower Respiratory Disease 19 6.5 49.1 48.1 46.0 249.6
Diabetes 14 4.8 36.2 35.5 33.0 397.7
Stroke 13 4.5 33.6 32.7 35.7 126.2
Alzheimer's Disease 10 3.4 25.9 27.4 23.7 0.0
Suicide 5 1.7 12.9 12.7 16.7 329.1
Perinatal Period Conditions 4 1.4 10.3 9.7 5.5 817.3
Benign Neoplasm 4 1.4 10.3 10.1 6.1 5.5
Hypertension 4 1.4 10.3 10.1 13.1 101.5
Chronic Liver Disease & Cirrhosis 4 1.4 10.3 10.5 12.8 216.7
Influenza & Pneumonia 3 1.0 7.8 7.1 9.6 35.7
Septicemia 3 1.0 7.8 6.9 9.5 60.3
Congenital Malformations 2 0.7 5.2 4.5 2.3 253.7
Nephritis, Nephrotic Syndrome & 2 0.7 5.2 5.3 6.5 0.0
Nephrosis
Homicide 2 0.7 5.2 5.2 10.2 304.4
HIV/AIDS 1 0.3 2.6 2.1 3.3 49.4
Pneumonitis 1 0.3 2.6 2.5 3.4 0.0
16
Hendry County Health Planning Council of SW Florida, Inc.
Community Health Assessment 2019Parkinson's Disease 1 0.3 2.6 2.3 6.9 13.7
Viral Hepatitis 1 0.3 2.6 2.3 2.2 27.4
Atherosclerosis 1 0.3 2.6 2.8 2.5 0.0
Cholelithiasis & Other Gallbladder 1 0.3 2.6 2.5 1.8 0.0
Disorders
Medical & Surgical Care 1 0.3 2.6 2.1 0.7 49.4
Complications
Peptic Ulcer 0 0.0 0.0 0.0 1.5 0.0
Hernia 0 0.0 0.0 0.0 0.9 0.0
Pregnancy, Childbirth & The 0 0.0 0.0 0.0 1.7 0.0
Puerperium
Anemias 0 0.0 0.0 0.0 1.8 0.0
Nutritional Deficiencies 0 0.0 0.0 0.0 1.7 0.0
Aortic Aneurysm & Dissection 0 0.0 0.0 0.0 2.2 0.0
Source: Florida Department of Health, Bureau of Vital Statistics
Age-adjusted death rates are computed using the year 2000 standard population.
YPLL = Years of Potential Life Lost
The most frequent causes of death for people in Hendry County are heart disease and cancer. Together
they accounted for more than 44 percent of the deaths in 2015-2017. Table 6, which compares the three-
year age-adjusted rates for Hendry County with those for all of Florida, shows that the death rates for
heart disease are higher than the state average. The rates are slightly lower for cancer for Hendry County
than the state. In 2010, the death rate for Hendry County was higher than the state average for each of
these major causes of death. For 2015-2017, the death rate in Hendry is higher than the state’s rate
overall, but it is lower for stroke. It is significantly higher for unintentional injury and diabetes.
Table 7: Major Causes of Death
Hendry and State
County 2015-2017 Florida 2015-2017
Age-Adjusted Age-Adjusted
Rate/100,000 Rate/100,000
Cause of Death
All Causes 749.7 685.2
Heart Disease 187.3 150.8
Cancer 145.3 151.9
Unintentional Injury 64.3 52.6
Chronic Lower Respiratory Disease 46 39.6
Diabetes 33 20
Stroke 35.7 38.7
Alzheimer’s Disease 23.7 21.9
17
Hendry County Health Planning Council of SW Florida, Inc.
Community Health Assessment 2019Suicide 16.7 14.2
Perinatal Period Conditions 5.5 4.5
Source: Florida Department of Health, Bureau of Vital Statistics
Age-adjusted death rates are computed using the year 2000 standard population.
Table 7 lists the cause of death noted for all deaths in Hendry County from 2008-2017. The total number
of deaths has fluctuated within a fairly narrow range during this period, with the lowest total in 2012 and
the highest in 2016 (it should be noted that the population also fluctuated a bit during that period with
the highest population in 2010).
Table 8: Deaths From All Causes
All Races, All Sexes, All Ethnicities, All Ages
Hendry County 2008-2017
Cause of Death 2008 2009 2010 2011 2012 2013 2014 2015 2016 2017
283 296 289 247 242 285 281 278 311 291
All Causes
Infectious Diseases 9 13 7 12 6 4 7 11 6 6
Certain Other Intestinal 0 0 0 1 0 1 0 2 1 1
Infections
Human Immunodeficiency Virus 2 4 3 4 0 1 1 3 0 1
(HIV) Disease
Other & Unspecified 1 0 0 1 2 0 1 0 1 0
Infectious/Parasitic Disease &
Sequelae
Septicemia 5 6 3 6 2 1 5 4 4 3
Viral Hepatitis 1 3 1 0 2 1 0 2 0 1
Malignant Neoplasm (Cancer) 56 58 75 49 43 74 56 58 64 52
All Other & Unspecified - 9 13 7 12 6 4 7 11 6 6
Cancer
Bladder Cancer 1 2 0 1 1 3 0 2 3 1
Breast Cancer 3 3 3 4 4 3 3 2 5 1
Cervical Cancer 2 0 0 0 0 0 0 0 4 1
18
Hendry County Health Planning Council of SW Florida, Inc.
Community Health Assessment 2019Colon, Rectum, & Anus Cancer 6 3 4 6 2 7 6 6 7 9
Corpus Uteri & Uterus, Part 0 0 0 0 2 0 0 0 4 1
Unspec Cancer
Esophagus Cancer 1 6 2 2 5 3 1 0 2 4
Hodgkins Disease 0 1 0 0 0 0 0 0 0 0
Kidney and Renal Pelvis Cancer 1 0 3 0 1 2 3 1 3 1
Larynx Cancer 3 0 1 0 0 0 0 1 0 0
Cause of Death 2008 2009 2010 2011 2012 2013 2014 2015 2016 2017
Leukemia 1 4 1 2 1 2 4 1 4 1
Lip, Oral Cavity, Pharynx 4 0 1 1 1 4 3 2 0 0
Liver & Intrahepatic Bile Ducts 3 2 1 0 3 3 2 2 4 2
Cancer
Meninges, Brain, & Other Pert 0 0 2 1 0 3 1 1 0 1
Cen Nerv Sys Cancer
Multiple Myeloma & 2 1 1 1 0 0 1 2 0 2
Immunoprolifera Neoplasm
Non-Hodgkins Lymphoma 2 1 3 1 2 3 2 0 1 1
Ovarian Cancer 1 1 2 2 1 4 1 0 2 3
Pancreatic Cancer 3 5 4 3 1 2 4 3 5 2
Prostate Cancer 1 3 6 3 0 5 2 6 3 1
Skin Cancer 3 2 1 0 1 2 1 0 0 1
Stomach Cancer 1 0 2 0 0 0 0 0 1 1
Trachea, Bronchus, Lung Cancer 14 18 27 13 12 18 17 20 17 10
In Situ, Benign, Uncert/Unk 0 1 2 1 2 1 4 2 1 4
Behavior Neoplasms
Anemias 1 2 0 1 1 1 0 1 1 0
Nutritional and Metabolic 16 14 10 14 10 12 17 16 11 14
Diseases
19
Hendry County Health Planning Council of SW Florida, Inc.
Community Health Assessment 2019Diabetes Mellitus 15 14 10 14 10 12 17 16 9 14
Malnutrition 1 0 0 0 0 0 0 0 2 0
Nervous System Diseases 4 4 6 1 7 11 12 11 12 11
Alzheimer’s Disease 4 4 5 1 4 10 9 5 11 10
Parkinson’s Disease 0 0 1 0 3 1 3 6 1 1
Cardiovascular Diseases 89 102 87 72 73 84 85 80 108 98
Acute Myocardial Infarction 12 8 10 4 6 8 6 3 14 14
Cause of Death 2008 2009 2010 2011 2012 2013 2014 2015 2016 2017
Acute Rheum Fever & Chronic 1 0 0 0 1 1 0 0 0 0
Rheum Heart Disease
All Other Chronic Ischemic 20 33 12 18 16 18 25 22 23 41
Heart Disease
Aortic Aneurysm & Dissection 0 4 1 2 0 4 2 2 1 0
Atherosclerosis 1 0 1 0 0 0 0 0 2 1
Atherosclerotic Cardiovascular 24 19 21 19 20 14 9 16 19 11
Disease
Cerebrovascular Diseases 14 15 13 5 10 17 12 12 17 13
Essen Hypertension & 3 3 2 5 3 4 7 4 7 4
Hypertensive Renal Disease
Heart Failure 3 4 4 3 1 2 2 1 1 5
Hypertensive Heart & Renal 0 0 0 0 0 0 2 1 0 0
Disease
Hypertensive Heart Disease 3 4 5 5 5 6 5 9 14 5
Other Acute Ischemic Heart 0 0 2 2 0 1 0 0 0 0
Disease
Other Arteries, Arterioles, 0 1 0 3 0 2 1 2 0 0
Capillaries Disease
Other Forms Heart Disease 8 10 16 5 10 6 14 8 10 4
20
Hendry County Health Planning Council of SW Florida, Inc.
Community Health Assessment 2019Pericardium Diseases & Acute 0 1 0 0 0 0 0 0 0 0
Myocarditis
Other Circulatory System 0 0 0 1 1 1 0 0 0 0
Disorders
Respiratory Diseases 23 27 26 22 32 25 30 28 24 24
Chronic Lower Respiratory 16 17 18 11 21 17 21 20 15 19
Disease
Influenza & Pneumonia 2 4 4 4 9 6 3 5 4 3
Other Respiratory System Dis 4 4 2 4 2 2 4 2 3 1
Cause of Death 2008 2009 2010 2011 2012 2013 2014 2015 2016 2017
Pneumonitis Due to Solids & 1 2 2 3 0 0 2 1 2 1
Liquids
Digestive Diseases 4 6 6 4 4 8 7 8 7 5
Cholelithiasis & Other 0 0 1 0 0 2 0 1 0 1
Gallbladder Disorders
Alcoholic Liver Disease 2 1 1 3 3 1 4 4 4 2
Other Chronic Liver Disease & 2 5 3 1 0 2 3 2 1 2
Cirrhosis
Hernia 0 0 0 0 0 2 0 0 1 0
Peptic Ulcer 0 0 1 0 1 1 0 1 1 0
Urinary Tract Diseases 10 6 4 1 5 6 5 2 3 2
Female Pelvic Organs- 0 0 0 0 0 0 1 0 0 0
Inflammatory Disease
Nephritis, Nephrotic Syndrome, 10 6 4 1 5 6 4 2 3 2
Nephrosis
Pregnancy, Childbirth, 0 0 0 0 1 0 0 2 0 0
Puerperium Complications
Perinatal Period Conditions 1 0 0 0 1 2 0 2 1 4
Congenital & Chromosomal 1 3 0 0 2 1 1 0 1 2
Anomalies
21
Hendry County Health Planning Council of SW Florida, Inc.
Community Health Assessment 2019Symptoms, Signs & Abnormal 4 7 6 6 3 0 2 2 2 2
Findings
Other Causes (Residual) 27 20 34 28 26 27 33 23 28 36
External Causes 38 32 26 34 26 28 22 32 42 31
Drowning & Submersion 0 0 0 0 1 2 0 2 1 0
Falls 5 6 2 8 7 3 4 3 4 4
Homicide by Firearms 0 1 5 5 2 0 4 3 3 2
Discharge
Homicide by Other & 1 1 0 5 1 3 0 1 3 0
Unspecified Means & Sequelae
Cause of Death 2008 2009 2010 2011 2012 2013 2014 2015 2016 2017
Medical & Surgical Care 0 0 0 0 0 0 0 0 0 1
Complications
Motor Vehicle Crashes 16 11 10 11 6 14 4 12 18 12
Other & Unspecified Event & 0 0 1 0 0 0 0 0 0 0
Sequelae
Other & Unspecified 1 1 2 4 2 2 3 1 2 2
Nontransport & Sequelae
Other Land Transport Accidents 1 0 0 0 0 1 0 0 0 0
Poisoning & Noxious Substance 7 4 4 0 4 2 2 1 5 5
Exposure
Smoke, Fire, Flames Exposure 1 0 0 0 1 0 0 0 1 0
Suicide by Firearms Discharge 3 6 0 1 2 0 3 7 1 5
Suicide by Other & Unspecified 2 2 2 0 0 1 2 2 4 0
Means & Sequelae
Water/Air/Space/Oth-Unsp 1 0 0 0 0 0 0 0 0 0
Transport & Seq
Source: Florida Department of Health, Office of Vital Statistics
22
Hendry County Health Planning Council of SW Florida, Inc.
Community Health Assessment 2019Unintentional Injury
Hendry County residents die from unintentional injuries at a higher rate than the state average. This
difference in rates is not as large as it was in the early parts of the 2000s though. The death rate from
unintentional injuries in both Hendry County and the State has been rising in recent years. It should be
noted that drug overdoses are included in this category.
Chart 7: Deaths from Unintentional Injury
Age-Adjusted rate per 100,000, 3-Year Rolling Rates 1996-2017
120
100 95.9
86.8 90.0
78.2 81.8 81.5 82.8
Rate Per 100,000
80 74.0 85.1
69.9
76 63.8 64.2 64.3
69.5 57.8
60 53.349.9 55.5
45.2 45.8 45.4 57.3
43.1 43.1
36.5 39.8 41.8 39.4 52.6
40 34.6 44.6 47.5
44.5 41.6 40.5 41.8
38.0 39.6
35.3
20
0
Years
Hendry State
Source: Florida Department of Health, Bureau of Vital Statistics
23
Hendry County Health Planning Council of SW Florida, Inc.
Community Health Assessment 2019Chronic Diseases
Heart disease is the leading cause of death in Hendry County. Chart 7 gives a detailed look at the decline
in deaths from coronary heart disease across the last twenty years. Unfortunately after many years of
decline, the rate seems to be rising again in recent years, however it remains lower than it was ten years
ago.
Chart 8: Deaths from Heart Disease
Age-adjusted rate per 100,000, 3-Year Rolling Rates 1996-2017
400
320.9 335.2
350 313.6300.3
293.4
293.1
300 324.4 263
255 297 239.3
243.5
Rate Per 100,000
250 228.4 207.6 219.1
250.7 200 179.1 180.6 187.3
244.9 186.8 170.1
200 238.5 220 215.3 158 166 164.1
198.4
150 175.9 165.5 156.4 153.5 152.3
156 155.2 150.8
154.5 153
100
50
0
Years
Hendry State
Source: Florida Department of Health, Bureau of Vital Statistics
24
Hendry County Health Planning Council of SW Florida, Inc.
Community Health Assessment 2019Cancer is the second most common cause of death in Hendry County. As seen in Chart 8, age-adjusted
death rates from cancer showed a decrease between 2013 and 2017 after a bit of a rise earlier in the
decade. Rates for Hendry County are now slightly lower than the rate for the state as a whole.
Chart 9: Deaths from All Cancers
Age-adjusted rate per 100,000, 3-Year Rolling Rates 1996-2017
250
196.8
193.5 190.2 200.8 187.5 191.6
200 186.8 187.9 181.9 189.4182.2 181.7
173.5 169.6 160.7
162.1 161.5 157.9163.3153.5
189 187.6 177.2 151.9
150 183.6 176 173.1 162.5
165.4
Rate Per 100,000
162.5 180.2 163.5 162 154.8 155.6155.9
169
151.6 151.1 145.3
100
50
0
Years
Hendry State
Source: Florida Department of Health, Bureau of Vital Statistics
25
Hendry County Health Planning Council of SW Florida, Inc.
Community Health Assessment 2019Cancer incidence in Hendry County has been lower than the state average since 2007. The rates have
decreased significantly since 2005.
Chart 10: Cancer Incidence
Age-adjusted rate per 100,000, 3-Year Rolling Rates 2005-2016
500 446.6 445.6 444.2 437.1 431.9 427.1
428.4 428.8 426.8 423.8
400
436.2 436.1
Rate Per 100,000
445.2 416.3
389.2 376.2 382.8
365.7 386.8
369.1
300
200
100
0
2005-07 2006-08 2007-09 2008-10 2009-11 2010-12 2011-13 2012-14 2013-15 2014-16
Years
Hendry Florida
Source: University of Miami (FL) Medical School, Florida Cancer Data System
Among the types of cancer, lung cancer is the primary cause of death in Hendry County. The second most
deadly form of cancer in Hendry County is skin cancer.
Table 9: Common Types of Cancer
Death Rate and Incidence, Hendry County
3 yr. Age Adjusted Avg. Annual Number
Death Rate, 2015- of Events
2017 (Incidence), 2014-
20116
Lung Cancer 37.8 72
Breast Cancer 36.6 21
Colorectal Cancer 23.7 12
Prostate Cancer 5.1 10
Liver Cancer 6.2 0
Ovarian Cancer 5.4 0
Skin Cancer 6.2 25
Source: Deaths - Florida Department of Health, Office of Vital Statistics; Incidence - University of Miami (FL) Medical
School, Florida Cancer Data System
26
Hendry County Health Planning Council of SW Florida, Inc.
Community Health Assessment 2019The death rate for black individuals in Hendry County is considerably higher than that of white individuals;
this is also true for the state of Florida as a whole. From 2015-2017, the black population in Hendry
County had considerably higher rates of death due to heart disease, cancer, and stroke than the white
population. Please note that due to the small size of the black population, a small number of deaths in
one category can cause a large variance in the death rate for that category. Cancer and heart disease
were the leading causes of death for both whites and blacks although the death rate for both of those
categories were higher for the black population than the white population.
Table 10: Major Causes of Death by Race, Hendry County and State
3-Year Age-Adjusted Death Rates by Cause, 2015-2017
County State
White Black All Races White Black All Races
Total Deaths 680.1 998.7 713.3 663.1 742.6 670.4
Heart Disease 175.6 272.3 187.3 148.7 169 150.8
Cancer 143.1 191.2 145.3 152.2 156.5 151.9
CLRD* 46.3 55.9 46 41.6 25.6 39.6
Stroke 29.6 88.7 35.7 36.5 56 38.7
Diabetes 28.1 63.2 33 17.7 38.9 20
Cirrhosis 13.4 7.6 12.8 13.1 6 11.9
Pneumonia/Influenza 6.6 24.7 9.6 9.3 11.6 9.5
HIV/AIDS 1.1 18.8 3.3 1.8 14.3 3.7
Source: Florida Department of Health, Office of Vital Statistics
*Chronic Lower Respiratory Disease
Ethnicity is broken out separately from race in the state of Florida. The Hispanic population in Hendry
County has similar or lower death rates than the non-Hispanic population from most major causes of
death. Hispanic residents are more likely to die from Cirrhosis or influenza and pneumonia than the non-
Hispanic population.
Table 11 : Major Causes of Death Ethnicity and Race, Hendry County
3-Year Age-Adjusted Death Rates by Cause, 2015-2017
Non-Hispanic Hispanic
White Black &Other White Black &Other
Heart Disease 205.7 277.8 97.6 64.1
Cancer 158.8 165.5 116.6 35.1
CLRD* 59.8 51.7 25.9 0
Stroke 32.9 79.1 20.3 0
27
Hendry County Health Planning Council of SW Florida, Inc.
Community Health Assessment 2019Diabetes 36.8 64.4 17.1 0
Cirrhosis 13.0 11.2 16.5 0
Influenza & Pneumonia 6.7 26.3 7.8 0
HIV/AIDS 2.6 15.9 0 0
Source: Florida Department of Health, Office of Vital Statistics
*Chronic Lower Respiratory Disease
Communicable Diseases
Hendry County ranks below the state average rate for many sexually transmitted diseases and many
vaccine preventable diseases. Note: It is possible that a larger number of individuals are positive for these
diseases, but have not been tested.
Chlamydia is the most prevelant sexually transmitted disease in Hendry County with an average of 658
cases per year between 2015 and 2017. That works out to a rate per 100,000 of 570.8; higher than the
state average of 470.3.
The overall rate of infection from vaccine preventable diseases is very low. For most of these diseases
there is an average of less than one case every three years. Hepatitis B is the most prevelant vaccine
preventable disease in Hendry County with an average of 19 cases per year between 2015 and 2017.
Varicella (commonly known as chickenpox) is the second most prevelant vaccine preventable disease in
Hendry County with an average of 6 case per year between 2015 and 2017.
An average of 10.0 people per year were diagnosed with AIDS in Hendry County between 2015 and 2017.
The rate per 100,000 in Hendry County is 8.7 compared to a rate of 10.4 for the state as a whole. The
largest number of those cases come from urban areas. The rate of tuberculosis in Hendry County is higher
than the state as a whole at 7.8 per 100,000 compared to 2.9 per 100,000, however this is based on a
small number of cases (average of 9.0 per year).
Table 12: Communicable Diseases
Hendry County and State 2015-2017
County State
Disease # of Cases 3 yr. Rate 3 yr. Rate
Annual Avg. per 100,000 per 100,000
Sexually Transmitted Diseases (STD)
Early Syphilis 4.0 3.5 24.5
Infectious Syphilis 2.0 1.7 11.4
Gonorrhea 82.0 71.1 138.5
Chlamydia 658.0 570.8 470.3
Vaccine Preventable Diseases
Hepatitis B, chronic 19.0 16.5 24.3
Measles 0.0 0.0 0
Mumps 0.0 0.0 0
Rubella 0.0 0.0 0.0
Pertussis 2.0 1.7 1.7
28
Hendry County Health Planning Council of SW Florida, Inc.
Community Health Assessment 2019Tetanus 0.0 0.0 0.0
Varicella (Chickenpox) 6.0 5.2 3.5
AIDS and Other Diseases
AIDS 10.0 8.7 10.4
Tuberculosis 9.0 7.8 2.9
Source: Division of Disease Control, Florida Department of Health
29
Hendry County Health Planning Council of SW Florida, Inc.
Community Health Assessment 2019Chlamydia
Chlamydia is the most common of the reported sexually transmitted diseases. The infection rate for
chlamydia across the state of Florida has been on the rise for the last fifteen years. The rates in Hendry
County have followed a similar pattern and are currently higher than the state rate.
Chart 11: Chlamydia Cases
Single Year Rate per 100,000 2006-2017
800
613.2
600
568 537 555.5 529.8 530.8 568.8
526.8
494.4
474.9 438.5
Rate Per 100,000
400
299.5 407.3 418.3 455.5 468.2 486.8
424.6
379.4 389.7 397.2 401.5
274.2 312.5
200
0
2006 2007 2008 2009 2010 2011 2012 2013 2014 2015 2016 2017
Years
Hendry Florida
Source: Florida Department of Health, Bureau of Communicable Diseases
30
Hendry County Health Planning Council of SW Florida, Inc.
Community Health Assessment 2019Maternal and Child Health
On average, 593 babies were born per year to mothers from Hendry County between 2015 and 2017. The
health of the babies, the care they received before birth and the age of the mothers are important factors
in determining the state of maternal and child health which in turn is a large factor in the overall health of
the county.
Babies born to young mothers under the age of 19 are more likely to experience poor birth outcomes than
those born to adult mothers and are more at risk for developmental complications later in life. There
were more than twice as many babies born to mothers between the ages of 15 and 19 in Hendry County
than the Florida average. The birth rate for mothers under the age of 19 in Hendry County has been
declining in recent years. There were more babies born to unwed mothers in Hendry County than the
Florida average and more babies born overall to Hendry County mothers than the state average.
Infant mortality rates are considered a primary indicator of the health of a community. These rates
document the deaths of babies between birth and 364 days of life. The leading causes of infant deaths in
Florida are perinatal conditions, congenital anomalies, low birth weight and sleep-related deaths. There
has been a major decrease in the incidence of sudden infant death syndrome (SIDS) since the American
Academy of Pediatrics released its recommendation in 1992 that infants be placed down for sleep in a
non-prone position. Infant mortality rates in Hendry County are below the average for the state of
Florida. The percent of infants born with a low birth weight are less to that of the state average, however
this rate has been rising in recent years. Fewer babies born to mothers in Hendry County receive 1st
trimester prenatal care than the state average.
Table 13: Maternal & Child Health Indicators, Hendry County & State
3-Year Figures, 2015 - 2017
Births County State Trend Quartile*
Total Births (3-yr annual avg.) 593
Births to Mothers ages 15-19, per 1,000 41.9 19.7 Positive 3
Infant Deaths
Infant Deaths (0-364 days) per 1,000 Births 5.1 6.1 Inconsistent 1
Neonatal Deaths (0-27 days) per 1,000 Births 3.9 4.2 Inconsistent 2
Low Birth Weight
Percent of Births < 2500 Grams 8.0% 8.7% Negative 2
Prenatal Care
Percent of Births with 1st Trimester Prenatal Care 72.9% 78.3% Positive 3
Percent of Births with Late or No Prenatal Care 5.6% 6.1% Positive 2
Source: Florida Department of Health
*County compared to other Florida counties. The lowest Quartile equals the lowest number. That is not always the most desirable rate. For
instance, it would be desirable to have a quartile of 4 for percent of births with 1st trimester care; however it would be desirable to have a quartile
of 1 for infant deaths.
Teen Births
Hendry County has had consistently higher rates of live births to teenage and pre-teen mothers than the
rates for the state of Florida. However, like Florida as a whole, rates for teen births in Hendry County have
been on the decline since their most recent peak in 2006 (49.4 births per 1,000). In 2017, Hendry County
saw their lowest rates in recent years (20 births per 1,000).
31
Hendry County Health Planning Council of SW Florida, Inc.
Community Health Assessment 2019Chart 12: Births to Mothers ages 10-19
Single Year Rate per 1,000
60
56.4 49.4
Rate Per 1,000 Female Population
50 45.6 46.7 45
42.9 44.9
38.4
40 43.1 45
41.8 37.5 31.5
25.9 27.8
30 23.8 22.1 20.9
21.4 21.5 22.4 21 26.2 20
25.3 26.9
20 27.2 22.4 14.2
22.4 19.3 21.2
21 10
17 15
10 12.6
11.5 9.5
10.7
0
Years
Hendry Florida
Source: Florida Department of Health, Bureau of Vital Statistics
When Births by Mothers Age is selected as the indicator and specific ages are selected, the rate displayed is the
age-specific birth rate (i.e., births to mothers in a specific age group divided by females in the same age group
expressed per 1,000 population).
Infant Deaths
It should be noted for the data in Chart 14 that the total number of births in Hendry County each year is
fairly small and one or two infant deaths can cause a large variance in the death rate. For example, nine
infant deaths caused the peak in 2005 (11.9 per 1,000 births). There were five infant death in 2017.
Chart 13: Infant Deaths (0-364 days)
Single Year Rate per 1,000 births
32
Hendry County Health Planning Council of SW Florida, Inc.
Community Health Assessment 201914
11.9 11.6
12
Rate Per 1,000 Live Births
10.4
9.0
10 9.1 8.7
7.5 7.5 7.2
8 7.3 7.2 7.1 7.2 6.5 6.4 7.0
6.0 6.2 6.1
6 7.2 7.0 7.3 7.6 7.2
7.0 5.5 6.9 4.9 6.1 6.0 6.1
4 3.3 5.1
4.3 3.5
3.0 3.1 3.2
2
0.0 1.8
0
Years
Hendry Florida
Source: Florida Department of Health, Bureau of Vital Statistics
Deaths occurring within 364 days of birth
Hospitalizations
The Prevention Quality Indicators (PQIs) are a set of measures that can be used with hospital inpatient
discharge data to identify quality of care for "ambulatory care-sensitive conditions." These are conditions
for which good outpatient or preventative care can potentially eliminate the need for hospitalization or
for which early intervention can prevent complications or more severe disease. Even though these
indicators are based on hospital inpatient data, they provide insight into the community health care
system or services outside the hospital setting. For instance, patients with diabetes may be hospitalized
for diabetic complications if their conditions are not adequately monitored or if they do not receive the
patient education needed for appropriate self-management. Full definitions for each of the PQIs are
available in Appendix G. Congestive heart failure, bacterial pneumonia and chronic obstructive pulmonary
disease (this category includes chronic bronchitis and emphysema) are the most common preventable
causes of hospitalizations for Hendry County residents.
Compared to Florida as a whole, Hendry County’s 2017 rates of hospitalization for diabetes (short and
long term), chronic obstructive pd, hypertension, uncontrolled diabetes and diabetes leg amputations are
significantly higher. Rates of hospitalization for adult asthma and urinary infections are a bit lower than
the state average.
Table 14: Prevention Quality Indicators, Hendry and State
Annual Rate per 100,000 Hendry County Florida
2008 2009 2010 2011 2012 2013 2014 2015 2016 2017 2017
01-
39.5 79.3 97.6 70.6 45.2 62.2 63.8 70.8 101.3 122.2 79.8
Diabetes/short-
term
33
Hendry County Health Planning Council of SW Florida, Inc.
Community Health Assessment 201903-
211.8 182.6 148.1 144.6 132.2 145.2 173.8 244.2 141.8 158.5 115.6
Diabetes/long-
term
05-Chronic 416.4 458.3 471.3 366.5 292.2 435.5 386.5 421.2 449 445.7 412.7
obstructive PD
07- 96.9 93 53.9 121.1 97.4 76 81.6 67.2 87.8 39.6 18.9
Hypertension
08-Congestive 473.8 444.5 478 400.2 459.2 432 418.5 509.6 489.5 442.4 437.8
HF
10-Dehydration 147.2 89.6 57.2 104.2 62.6 55.3 63.8 134.5 162.1 224.5 178.5
11-Bacterial 323 396.3 474.7 457.3 431.4 452.8 397.2 361 178.9 145.3 161.5
pneumonia
12-Urinary 208.2 220.5 269.3 262.3 198.3 176.3 273.1 276.1 209.3 194.8 207.3
infections
13-Angina w/o 28.7 34.5 13.5 20.2 41.7 20.7 28.4 10.6 0 0
procedure
14-
39.5 34.5 37 70.6 41.7 31.1 49.6 53.1 111.4 75.9 59.7
Uncontrolled
diabetes
15-Adult 168.7 127.5 104.4 131.1 87 69.1 106.4 92 23.6 42.9 44.5
asthma
16-Diabetes/LE 46.7 51.7 50.5 50.4 62.6 55.3 46.1 56.6 47.3 52.8 26.0
amputations
Source: AHCA via Broward Regional Health Planning Council Hospital Inpatient and Emergency Department Analytical System
Includes hospitalizations of Hendry County residents in any hospital in Florida.
The Chronic Condition Indicator tool is another method to look at the health of a community through
hospitalizations. This tool stratifies chronic diseases based on diagnosis codes. A chronic condition is a
condition lasting 12 months or longer and meeting one or both of the following tests: (a) the condition
places limitations on self-care, independent living and social interactions; (b) the condition results in the
need for ongoing intervention with medical products, services and special equipment. The data from this
tool tells a similar story as the PQI data. Hypertension is the number one cause of hospitalization for a
chronic condition. The number of hospitalizations for diabetes is also high.
Table 15: Hospitalizations for Chronic Conditions
Annual Figures, 2008-2017, Hendry County Residents
Disease 2008 2009 2010 2011 2012 2013 2014 2015 2016 2017
Diabetes 1130 1210 1136 1157 1075 1174 1238 1313 1215 1174
Asthma 284 345 296 319 312 304 336 345 250 217
Congestive
540 580 600 613 565 533 557 593 593 628
Heart Failure
Hypertension 1498 1582 1686 1734 1639 1552 1637 1720 1707 1410
AIDS 24 33 32 28 11 14 22 14 18 21
Sickle Cell 44 47 34 34 28 30 19 19 17 12
Source: AHCA via Broward Regional Health Planning Council Hospital Inpatient and Emergency Department Analytical System
Includes hospitalizations of Hendry County residents in any hospital in Florida.
34
Hendry County Health Planning Council of SW Florida, Inc.
Community Health Assessment 2019Ambulatory Care Sensitive conditions such as asthma, diabetes or dehydration are hospitalization
conditions where timely and effective ambulatory care can decrease hospitalizations by preventing the
onset of an illness or condition, controlling an acute episode of an illness or managing a chronic disease or
condition. High rates of Ambulatory Care Sensitive hospitalizations in a community may be an indicator of
a lack of or failure of prevention efforts, a primary care resource shortage, poor performance of primary
health care delivery systems, or other factors that create barriers to obtaining timely and effective care.
The Florida Department of Health released an Ambulatory Sensitive Conditions Profile for Preventable
Hospitalizations for Persons under 65 years of age for each county using 2017 data. Hendry County has a
higher rate of preventable hospitalizations than the state average.
Table 16 : Ambulatory Sensitive Conditions Profile for Preventable Hospitalizations Under 65
Hendry County, 2017
County County County State
Count Rate Quartile Rate
390 1,162.60 3 1,033.30
All Conditions
Acute Conditions
Bacterial Pneumonia 31 92.4 2 103.9
Cellulitis 34 101.4 2 99.9
Gastroenteritis 17 50.7 2 48.3
Hypoglycemia 0 0 n/a 1.4
Kidney/Urinary Infection 15 44.7 3 29.9
Pelvic Inflammatory Disease n/a 12.1
Severe Ear, Nose, & Throat Infections 7 20.9 n/a 19.5
Skin Grafts with Cellulitis 6 14.3 n/a 8
Chronic Conditions
Angina 7 20.9 n/a 6.5
Asthma 29 86.4 3 71.5
Congestive Heart Failure 29 86.4 2 73.7
Diabetes 63 187.8 3 167.5
Grand Mal & Other Epileptic Conditions 33 98.4 3 81.9
Hypertension 6 17.9 n/a 7
Non-Pulmonary Tuberculosis 0 0 n/a 0.3
35
Hendry County Health Planning Council of SW Florida, Inc.
Community Health Assessment 2019Pulmonary Tuberculosis 0 0 n/a 1.2
Avoidable Conditions
Dental Conditions n/a 12
Nutritional Deficiencies 22 65.6 2 54.9
Vaccine Preventable Conditions 0 0 n/a 0.5
Source: Florida Agency for Health Care Administration (AHCA).
Data are suppressed when a county has between 1 and 4 reported hospitalizations.
Quartiles are calculated when data is available for at least 51 counties.
36
Hendry County Health Planning Council of SW Florida, Inc.
Community Health Assessment 2019You can also read