Sacramento Employment and Training Agency (SETA) 2020-2021 Community Action Plan California Department of Community Services and Development ...
←
→
Page content transcription
If your browser does not render page correctly, please read the page content below
Sacramento Employment and Training
          Agency (SETA)
 2020-2021 Community Action Plan

    California Department of
Community Services and Development
    Community Services Block Grant
2
Purpose
The Community Action Plan (CAP) serves as a two (2) year roadmap demonstrating how Community Services
Block Grant (CSBG) agencies plan to deliver CSBG services. The CAP identifies and assesses poverty related
needs and resources in the community and establishes a detailed plan, goals and priorities for delivering those
services to individuals and families most affected by poverty. CSBG funds may be used to support activities
that assist low-income families and individuals, homeless families and individuals, migrant or seasonal farm
workers and elderly low-income individuals and families by removing obstacles and solving problems that block
the achievement of self‐sufficiency. Community Action Plans must comply with Organizational Standards and
state and federal laws, as outlined below.

Compliance with CSBG Organizational Standards
As described in the Office of Community Services (OCS) Information Memorandum (IM) #138 dated January
26, 2015, CSBG agencies will comply with implementation of the Organizational Standards. CSD has identified
the Organizational Standards that provide guidance for the development of a comprehensive Community
Needs Assessment. The following is a list of Organizational Standards that will be met upon completion of the CAP
and CNA. This section is informational only, and narrative responses are not required in this section. Agencies are
encouraged to utilize this list as a resource when completing Organizational Standards annually (Appendix A).

State Assurances
As required by the CSBG Act, Public Law 105-285, states are required to submit a state plan as a condition to
receive funding. Information provided in the CAP by agencies is included in California’s State Plan. Alongside
Organizational Standards, the state will be reporting on State Accountability Measures in order to ensure
accountability and improve program performance. The following is a list of state assurances that will be met upon
completion of the CAP. This section is informational only, and narrative responses are not required in this section
(Appendix B).

Federal Assurances and Certification
Public Law 105-285, s. 676(b) establishes federal assurances agencies are to comply with. CSD, in its state plan
submission, provides a narrative describing how the agencies in California will comply with the assurances. By
completing and submitting this Community Action Plan, your agency certifies that it will comply with all Federal
Assurances and any other laws, rules, and statutes in the performance of the activities funded through this
grant. (Federal Assurances can be found in the CSBG Act Section 676)
The following is a list of federal assurances that will be met upon completion of the CAP. This section is
informational only, and narrative responses are not required in this section (Appendix C).

                                                                                                                 3
2020/2021 Community Action Plan Checklist
The following is a check list of the components to be included in the CAP. The CAP is to be received by CSD no
later than June 30, 2019:
☒ Cover Page and Certification
☒ Vision Statement
☒ Mission Statement
☒ Tripartite Board of Directors
☒ Documentation of Public Hearing(s)
☒ Community Needs Assessment
☒ Community Needs Assessment Process
☒ Community Needs Assessment Results
☒ Service Delivery System
☒ Linkages and Funding Coordination
☒ Monitoring
☒ Data Analysis and Evaluation
☒ Appendices (Optional)
4Vision Statement: “A Community United in the Fight Against Poverty.”
Mission Statement:
“To coordinate a community response to address the root causes of poverty in Sacramento County”
Tripartite Board of Directors
(Organizational Standards 5.1, 5.2, CSBG Act Section676(b)(10))
Section 676B of the Community Services Block Grant Reauthorization Act of 1998 requires that, as a condition
of designation, private nonprofit entities and public organizations administer their CSBG program through
tripartite boards that “fully participate in the development, planning, implementation, and evaluation of the
program to serve low-income communities.”
1. Describe your agency’s procedures for establishing adequate board representation under which a low-
income individuals(s), community organization, religious organizations, or representative of low-income
individuals that considers its organization or low-income individuals to be inadequately represented on the
board (or other mechanism) of the agency to petition for adequate representation. Please place emphasis
on the low-income individuals on your board.
(Organizational Standards 5.2, CSBG Act Section 676(b)(10))
Any low-income individual or organization representing low-income individuals may petition the
SETA Governing Board directly. The SETA Community Action Board Bylaws provide that in
February of every third year, the SETA Governing Board designates up to four (4) low-income
organizations from CSBG priority areas at a public meeting. These organizations will coordinate
the democratic election of low-income representatives to the SETA Community Action Board.
When the number of qualified low-income sector organizations interested in participating on the
Community Action Board exceeds the number of seats designated for the low-income sector, the
SETA Governing Board may choose not to reappoint organizations which have been represented
on the board so that the opportunity to participate will be shared equitably among all interested
petitioners.
2. Please describe how the individuals on your Advisory or Governing Board are involved in the decision-
making process and participate in the development, planning, implementation and evaluation of programs
funded under CSBG to meet the requirements listed above.
(Organizational Standard 5.1)
Prior to board meetings, SETA’s Community Action Board is provided with information necessary
to participate in the development, planning, implementation and evaluation of CSBG-funded
programs. These documents are discussed at CAB meetings and board members are encouraged
to provide advice and direction. This includes the Community Action Plan, staff funding
recommendations, and copies of fiscal and programmatic monitoring reports. Public hearings for
the CAP are presented before the board, and other presentations to the board address key poverty
issues in Sacramento County.
6Documentation of Public Hearing(s)
California Government Code 12747(b)-(d) requires all agencies to conduct a public hearing in conjunction with
their CAP. In pursuant with this Article, agencies must prepare and present the completed CAP for public
review and comment. The public hearing process must be documented to include how the hearing was
advertised and all testimony presented by the low-income and identify whether the concerns expressed by that
testimony are addressed in the CAP.
The agency shall conduct at least one public hearing and provide for a public comment period.
Note: Public hearing(s) shall not be held outside of the service area(s)
1. The agency has made (or will make) the plan available for review using the following process:
Public Hearing
Date:
Location:
☒ Public Comment Period
Inclusive Dates for Comment: May 17-May 29, 2019
When and where was/will be the Public Hearing Notice(s) published or posted? List the dates and
where below:
SETA began gathering public testimony at two scheduled public hearings before the
Community Action Board (CAB). Notice of CSBG Public Hearings are posted on the SETA
website, e-mailed to SETA subcontractors, and mailed to a large sample of CSBG customers.
Members of the public with information or concerns regarding the delivery of poverty related
services to families and individuals in Sacramento County are welcome and encouraged to
testify during hearings before the Board.
Dates and locations of the public hearings were as follows:
April 10, 2019 (Wednesday), 10:00A.M. – 12:00P.M.
and
May 8, 2019 (Wednesday), 10:00A.M. – 12:00P.M.
Location for Both Public Hearings:
SETA Board Room
925 Del Paso Boulevard, Suite 100
Sacramento, CA 95815
Date Where (name of newspaper, website, or public place posted)
March 20, 2019 SETA website (www.seta.net)
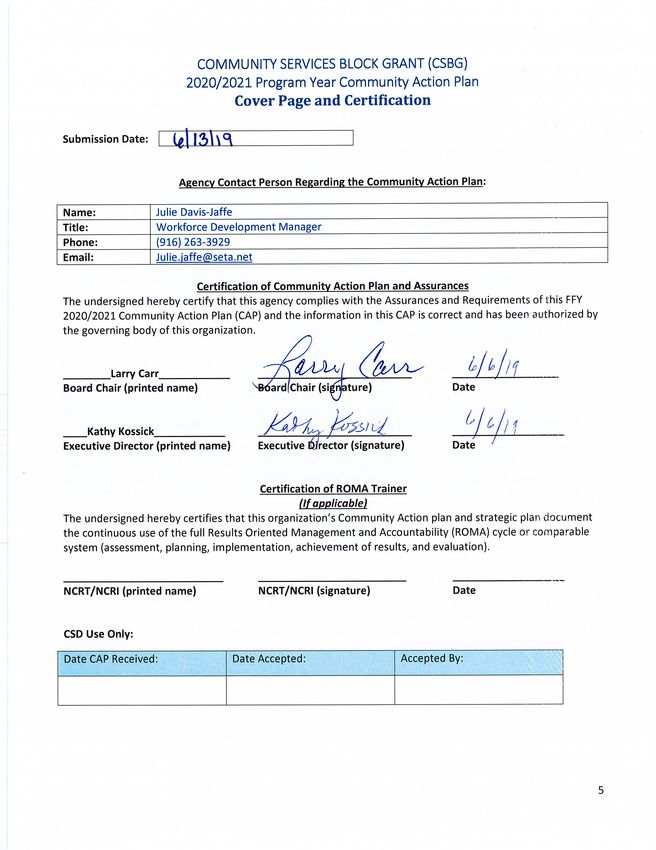
April 30, 2019 Sacramento Bee
2. *Submit a copy of published notice(s) with the CAP Application for documentation purposes.
7PUBLIC NOTICE
Announcement of Community Services Block Grant Public Hearings, posted on Agency website:
To: ALL INTERESTED PARTIES
Since 1983, the Sacramento Employment and Training Agency (SETA) has been designated as a
Community Action Agency for the purpose of administering Community Services Block Grant (CSBG)
funds for Sacramento County. CSBG funds are meant to help alleviate root causes of poverty not
adequately served by existing community resources. Indicators of unmet community needs will be
gathered from a variety of sources including members of the community. To this end, SETA will be
gathering public testimony at two scheduled public hearings before the Community Action Board
(CAB). Members of the public with information or concerns regarding the delivery of poverty-related
services to families and individuals in Sacramento County are welcome and encouraged to testify
during hearings.
Dates and locations of the public hearings are as follows:
April 10, 2019 (Wednesday), 10:00 A.M. – 12:00 P.M.
and
May 8, 2019 (Wednesday), 10:00 A.M. – 12:00 P.M.
Location for Both Public Hearings:
SETA Board Room
925 Del Paso Boulevard, Suite 100
Sacramento, CA 95815
Information gathered at the hearings and from other sources will be compiled in a draft of the
2020/2021 SETA Community Action Plan with copies available for public review on May 17, 2019 on
the SETA website (www.seta.net).
Members of the community with questions, requests for a printed copy of the draft plan, or wishing to
submit written testimony, may e-mail Pam Moore at pamela.moore@seta.net, or call her directly at
(916) 263-3734.
COMMENTS FROM THE SETA 2019 PUBLIC HEARINGS
Nilda Valmores, Executive Director, My Sister’s House: This organization works to assist
victims of domestic violence. The workers of this group must be trained to work with these clients
in a variety of ways. Ms. Valmores asked that the needs of abused women and children as well as
those facing cultural barriers needs to be addressed. Assisting women at the domestic violence
shelters to avoid homelessness is one of the greatest needs. My Sister’s House is grateful to be a
CSBG grant recipient over the past years. Ms. Valmores introduced a former client, Agnes.
Agnes, a single mother and a survivor of domestic violence, is a client of My Sister’s House.
Agnes said that she has experienced a wide variety of abuse over the years and is receiving help
through My Sister’s House. They have assisted her with transitional housing and she now has her
own apartment. My Sister’s House assisted her with her monthly rent. She is grateful for the
funding that helps her and her daughter to thrive. Agnes urged the board to continue the funding
for this program.
8Major Martin Ross, Secretary for Sacramento Social Services & Divisional Enterprise
Development, Salvation Army: Major Ross is in charge of Sacramento social services included
workforce development and capacity building. The relationship with SETA has been strong for 13
years. They are grateful for the funds received that helps with case management with PG & E,
SMUD, and the emergency food programs. The CSBG funds are utilized through utility
assistance, housing assistance, and emergency assistance. The challenges are that the funding
availability does not meet the need of the customers they serve.
Lishia Faulkner, Family Services Manager, Salvation Army: Ms. Faulkner has been with the
Salvation Army for 12 years. She recognized Saint John’s Shelter for services she received years
ago. She also received services through River City Food Bank. When she visited the food bank,
they treated her with respect and never judged her. Please continue funding for St. John’s Shelter,
River City Food Bank, and Salvation Army.
Felicia Horsley, client of Salvation Army: Ms. Horsley thanked the Salvation Army for the
assistance they provided her through rental assistance. She is employed but still needed help.
There are plenty of times the Salvation Army has assisted her and her son through rental
assistance, utility assistance, and securing employment. Ms. Horsley thanked Sacramento Lao
Family for the assistance they provided her as well.
Luke Johnson, Supervisor of Employment Programs, IRC.: Mr. Johnson thanked the board for
the funds to work with the refugee and immigrant community. Through direct assistance and case
management services they serve individuals with limited English, who lack the skills and resources
necessary to navigate American society.
Arghawan Ahmadzai, Employment Specialist, IRC: Ms. Ahmadzai said they have a lot of
clients they assist through the CSBG funds. One of their clients is a single mother from
Afghanistan who was helped with resettlement assistance. Her two sons have physical and
mental issues and the IRC program helped to navigate the various medical programs to get her
sons help. A service plan was developed to help the client with job readiness and child care. The
client secured employment and is self-sufficient, and continues to study at night. Ms. Ahmadzai
thanked the CSBG program and SETA for providing services to the refugee population. The
services make changes and give a lot of hope to refugees.
Amanda McCarthy, Executive Director, River City Food Bank: Ms. McCarthy expressed
appreciation for the funds to alleviate hunger. Food insecurity is prevalent throughout California.
More than 15% of the Sacramento population is food insecure which means people have to make
painful decisions between food and housing, child care, or life-saving medicine. Poverty is on the
rise in Sacramento and sometimes having access to food is an issue due to lack of transportation
or living in a ‘food desert.’ Providing food enables stability so people can find work and care for
their families. Unlike traditional food banks, they deliver food where it is needed the most. More
than 150,000 Sacramento County residents are served annually through two local sites.
Jena Robinson, Program Manager, River City Food Bank: Ms. Robinson said that people often
come to the food bank the day after they are released from incarceration or at the last minute.
They serve seniors on a fixed income, those that are working but run out of money for food, and
the homeless.
Veronica Williams, Intake Supervisor, Volunteers of America: Ms. Williams spoke of the
services they provide veterans, for housing and employment. They also receive funds to assist
homeless veterans with assistance for deposits, child care, vehicle care, and homeless prevention
assistance. VOA provides services for a number of regional counties. This has been one of the
CSBG safety net services since 2014. The CSBG funds assist with one-night motel stays, bus
passes, food, gas, rental arrears, and a variety of services.
9Shannon Sinclair, Volunteers of America: Ms. Sinclair is a homeless, single parent Navy
veteran. Due to a recurrence of PTSD, Ms. Sinclair “shut down” and began living in her car. The
VOA provided immediate services to help her; there was no judgement and they were always
available to talk. Ms. Sinclair appreciated the services provided by the CSBG funding.
Bonita Daniels, Case Management Services: Ms. Daniels is a participant in the Folsom
Cordova Community Partnership. They provided her with a variety of services including clothes,
child care and job assistance. One good thing about the program is rental assistance and utility
assistance. Ms. Daniels urged the continued funding for this program.
Renée John, Director of Programs, Folsom Cordova Community Partnership: Ms. John
stated that Ms. Daniels is a dream client; she’s an amazing person. Ms. John appreciated the
CSBG funding for family self-sufficiency and safety net services. They created a financial
empowerment module to assist people in building their assets and managing their money. Ms.
John urged that financial empowerment to be considered a fundable activity. In addition, Ms. John
urged funding to help people get driving lessons and car registration assistance. The Sacramento
area is not a well-connected city for transportation, and people need help to get where they need
to go.
Peter Bell, Associate Director for Data and Compliance, WIND Youth Services: Mr. Bell
stated that CSBG funding has helped address barriers that have prevented youth from
successfully exiting homelessness, such as transportation barriers. In addition, food insecurity is
also an issue. They provide meals at their drop-in center. Through the family self-sufficiency
grant, employment continues to be an issue with their young clients. Interview clothes and training
are needed for some employment. This year to date, they reached 169 clients; Mr. Bell reviewed
the various services that were provided.
Brenda Miranda, La Familia Counseling Center: Project Reach provides a variety of positive
alternates, counseling and supportive services for youth aged 10-21 through gang prevention and
mentoring. There are many youth in the community that have been touched with their program.
Project Reach helps young people with anger management and life skill training to help with life
choices. They have seen some of their former clients go to college. Ms. Miranda appreciates the
funding for this important program.
Paola Benitez, Client of La Familia: Ms. Benitez was a member of Project Reach last year.
Before she was enrolled in the program, she did not go to and was not motivated to go to school
and had a lot of anger issues. While in the program, she learned anger management, and went
back to school. She learned the importance of self-care and the passion for helping and educating
her community. La Familia and Project Reach helped her to make better choices. Ms. Benitez
urged that this program receive continued funding.
Michelle Cook, Director of Programs, Folsom Cordova Community Partnership: Ms. Cook
thanked all of the speakers for their words. Ms. Cook spoke of the safety net services provided by
CSBG. A lot of good things are being done in the eastern part of Sacramento County. Housing
and food are especially needed.
Ora Jennings, Folsom Cordova Community Partnership: Ms. Jennings moved to Rancho
Cordova three years ago. She’s always worked; she’s from a military background and was taught
not to seek handouts. But when she lost one of her jobs, she needed assistance. She’s a single
mother of four, rent was out of control, and she needed help. She reached out to Folsom Cordova
Community Partnership, where she was able to receive food, bus passes, and other services. Ms.
Jennings hopes that funding could be distributed to all programs.
10Maria Rosales, Director, South County Services: Ms. Rosales expressed appreciation for the
funds they receive. South County Services provide the most southern and rural parts of
Sacramento County. They have a satellite office in Courtland, Walnut Grove, and Isleton. In
addition, they provide mobile services to trailer parks and marinas in the delta loop since there is
no public transportation.
Ms. Rosales stated that in the delta loop, when residents who have no transportation need to buy
food, they purchase the food at liquor stores where the prices are very high. Ms. Rosales stated
that they receive food from Sacramento Food Bank and Family Services, and they also have
emergency food in their offices which they take to the satellite offices. Many people cannot drive
to Isleton so South County Services staff provide mobile services there. They provide emergency
food, utility assistance, bus passes, and propane. They also have a contract with SMUD and PG &
E to assist their clients.
Ms. Rosales said that for someone who lives in the Delta, many times they go to San Joaquin or
Yolo County for medical services. Many of the south county residents do not have the gas money
to drive to Sacramento for medical services.
Sean Ellyson, Advocate for South County Services: Mr. Ellyson lives in the Delta loop and
expressed appreciation for the services provided by South County Services. There is a great deal
of homelessness along the river. Mr. Ellyson urged continued funding in the form of a new van for
South County Services. There are so many people that need help in the rural parts of the county.
Jesse Dean Rollin, client of South County Services; Mr. Rollin found himself homeless and
had no support from anyone. He was not aware of the services available until he came across
South County Services. It is nice to see the government funding people that put people first. Mr.
Rollin is now a manager at McDonald’s and he expressed appreciation to Ms. Rosales and South
County Services.
Nakisha Barthell, Founder, Creative Expressions Academy: This is a non-profit organization
that serves at-risk youth from 10-24 years of age. They have partnered with Los Rios Community
College to offer their students enrollment in college and courses on-site. They also work with
Sacramento High School to start a program in the fall session to teach life skills, designing, and
photography that will allow the youth to become entrepreneurs. This academy is located at
Sacramento High School. They are looking into expanding into Twin Rivers School District. They
introduced students to life skills and college level curriculum to create a pathway into careers and
out of poverty. Living and staying in poverty can lead to homelessness and potentially a life of
domestic violence. This program will be seeking funding.
Tya Dotson, Sacramento High Student, Creative Expressions: Ms. Dotson is a 15 year-old
student at Sacramento High School. She is one of the youngest leaders on her campus. She
volunteers at shelters and she and her sister started their own business last summer. Ms. Dotson
urged consideration of programs such as Creative Expressions as a way to prevent vandalism.
She spoke of the popup event she attended at Sam Pannell Community Center. She is going to
another popup event this weekend. These will not bring all the kids together, and some kids will
join gangs. Creative Expressions Academy will help kids reach the creative part of themselves.
Amiah Dotson, Student, Creative Expressions: Ms. Dotson asked for cooking classes, how to
start your own business, and tax preparation.
Jeffrey “Mr. T” Tardagelia, Community Advocate: Mr. “T” is a community advocate. What
seems to work best is word of mouth. It seems like a lot of programs work in silos – there needs to
be more cooperation and communication between programs. Mr. “T” urged e-mail addresses be
shared so programs can communicate better. He is aware of how badly the roads in the south
11county are in need of repair and that the Board of Supervisors is working on it. His emphasis is to
find a better method of cooperation and communication.
Martha Haas, Program Manager, Sacramento County Senior Volunteer Services: Ms. Haas
was impressed with all of the tremendous need and services provided in the county. Her program,
the Senior Companion Program, serves 14 clients utilizing four senior volunteers. They match low
income seniors with frail, vulnerable or isolated seniors.
Roseann Araza, Volunteer Program Specialist, Sacramento County Senior Volunteer
Services: Ms. Araza provided some examples of their senior matches. One 87-year-old client
was victimized by a string of caregivers, who coerced her to sign timesheets for time not worked.
Her senior companion match urged this client to report the abuse to her social worker and they
were able to prevent further fraudulent acts. A 72-year old volunteer was matched with a 79-year
old client with no family or caregiver. The volunteer was able to help the client with medical visits
and grocery shopping. Ms. Hass thanked the board again for the funding. This is important as a
safety net for vulnerable seniors.
Kazoua Heu, Program Manager, Lao Family Services: Ms. Heu stated that a lot of partners and
agencies are reflective of the services they provide. What is not reflected is the number of people
they have to turn away since there is limited funding. They leverage their funds with other funding
sources and donations. There is a great need for their population and they advocate on behalf of
their clients and all of the programs. Ms. Heu urged the board to find additional funding to assist
support those that are turned away. The success stores given today attest to the fact that the
CSBG funding provides light in dark places.
Community Needs Assessment
Public law 105‐285 requires the state to secure from each agency, as a condition to receive funding, a CAP
which includes a Community Needs Assessment (CNA) for the community served. Additionally, state law
requires each CSBG agency to develop a CAP that assess poverty-related needs, available resources, feasible
goals and strategies, and that yields program priorities consistent with standards of effectiveness established
for the program (California Government Code 12747(a)).
Please indicate which combination of activities were used in completing the CNA, including when and how
these activities occurred in the spaces below. If the activity was not used, please type N/A or Not Used.
Focus Groups Not Used
Asset Mapping Not Used
Surveys CSBG Service Gap Questionnaires are mailed to a large sample of
CSBG customers and delivered to Sacramento Steps Forward,
WIND, and several Head Start locations.
Community Dialogue Public hearings before the Community Action Board were held on
April 10 and May 8, 2019
Interviews Not Used
Public Records Data analysis was conducted using information from the U.S.
Census, State and County Departments’ websites, Sacramento
County’s 2017 Point In time Homeless Count, and local media.
Date of most recent completed CNA: ___May 15, 2019_____________________
Date CNA approved by Tripartite Board (most recent): _____May 29, 2019____________________
(Organizational Standard 3.5.)
12Your responses to the questions below should describe how the agency ensures that the CNA reflects the
current priorities of the low-income population in the service area, beyond the legal requirements for a local
public hearing of the CAP.
1. For each key sector of the community listed below, summarize the information gathered from each sector
and how it was used to assess needs and resources during the needs assessment process (or other planning
process throughout the year). These sectors should include at minimum: community-based organizations,
faith-based organizations, private sector, public sector, and educational institutions.
(Organizational Standard 2.2)
SETA has a long history of partnerships and coordinating programs with organizations serving low-
income residents. SETA continues to actively coordinate and leverage the vital services offered by
these organizations on behalf of low-income residents in Sacramento County.
2. Describe the causes and conditions that contribute to poverty affecting the community in your service area.
(Organizational Standard 3.4)
Although fewer Sacramento County households fall below Federal Poverty Income Guidelines,
conditions of homelessness are increasing, food insecurity is growing, and persons of color still
account for a large majority of justice-involved persons.
The latest threat to local area households is the extremely low rental property vacancy rate.
Symptoms include the near disappearance of unsubsidized rental units under $800/month. Those
that exist are substandard and in high-crime areas. Community college student homelessness is
hovering around 12% and ranges to 10% for UC students. The Department of Education
estimates that K-12 schools in Sacramento County include nearly 11,000 homeless students, a
rate slightly higher than the State of California.
Target groups experiencing the highest rate of extreme poverty continue to include single-parent
females with children under six years old, a trend likely to increase without bold interventions.
3. Describe your agency’s approach or system for collecting, analyzing, and reporting customer satisfaction
data to the governing board.
(Organizational Standard 1.3)
Customer satisfaction data is gathered on a quarterly basis utilizing two basic sets of survey
questions. The first set is intended to measure the timeliness and customer care in the issuance of
emergency services and resources. The second set is intended to measure the client/case
manager relationship and effectiveness in serving customers.
4. Describe how your agency collected and included current data specific to poverty and its prevalence
related to gender, age, and race/ethnicity for your service area.
(Organizational Standard 3.2)
Data regarding current conditions and symptoms of poverty is collected throughout each program
year. Data collection becomes more deliberate and coordinated during the development of the
Community Action Plan. Year-over-year data is compared to analyze poverty, gender, race, age,
or other poverty-related trends.
Data on household conditions is gathered in a variety of ways to inform the Plan. Key data
sources include: US Census; customer satisfaction comments and success stories; State/local
13government websites; local media; Sacramento Steps Forward Point In Time Homeless Count;
special reports on target groups and target areas; surveys; public hearings; and other articles and
poverty data. Available data is compiled, analyzed, reported, and used during the ROMA planning
process.
5. Briefly summarize the type of both qualitative and quantitative data collected and analyzed as part of the
needs assessment process.
(Organizational Standard 3.3)
Qualitative data includes economic and behavioral trends, anecdotal feedback from partners,
testimony or comments by CSBG customers, and monthly reports by service providers and
partners. Quantitative data includes counts of households, families, and individuals. This data
may also include counts of households, families and individuals experiencing symptoms of poverty
including homelessness, hunger, abuse, unsafe living conditions, and neglect.
6. Describe how the agency analyzes information collected from low-income individuals as part of the
community needs assessment process.
(Organizational Standard 1.1, 1.2)
SETA analyzes information collected from low-income individuals by screening for responses that
support or question CAB strategies and that provide glimpses into trending changes to community
conditions or demographics. Information is quantified by its rate of incidence and high-incidence
remarks are prioritized for follow up. The information is then presented to the CAB to help inform
program strategies and services.
Community Needs Assessment Results
(Organizational Standard 3.4, 4.2, 4.3, CSBG Act Section 5.76(b)(12))
SACRAMENTO EMPLOYMENT & TRAINING AGENCY 2020-21 NEEDS ASSESSMENT
SACRAMENTO COUNTY ABSTRACT
The 2017 American Community Survey (ACS) reports that persons with incomes below Federal
Poverty Guidelines in Sacramento County account for 16.7% of the total population, or 246,203
persons living in poverty. This represents a 0.2 percentage point decrease in the number of residents
who were living below federal poverty income guidelines in 2012, indicating some stability in the
poverty rate. While the poverty rate has remained essentially the same, there continues to be a rise in
the number of people in poverty. Between 2007 and 2012, there were 36% more people in poverty;
between 2012 and 2017 there were 6.8% more people in poverty. This reflects the growing population
of Sacramento County as a whole, which has increased 9.4% during that same time.
During 2017, an average of 61,199 individuals per month received cash aid through participation in the
CalWORKs program; of those, 46,633 (76.2%) were children. The number of people receiving
CalWORKs represents 4.1% of the Sacramento County population, a rate that has decreased in
recent years. In 2012 an average of 79,833 individuals, 60,959 of whom were children, received cash
aid; this represented 5.6% of the population.
Graphs 1, 2, 4 and 5 highlight the pace at which the poverty rate of vulnerable and in-crisis
Sacramento County adults and children has changed over the last ten years. Although the economy
has made net improvements since 2007, poverty rates have continued to climb for many people.
14Graph 1
Source: US Census Table B17001, 2012 & 2017 ACS 5-Year Estimates, & Table B17001 2007 3-year estimates, for Sacramento County
There is mixed news about the trends in poverty rates among the target groups. The largest increase
in poverty from 2007 to 2017 (79.1%) was in the population 65 and older (10,936 to 19,591). This is a
disproportionate rise compared to the 31% increase in the number of people aged 65 and older in
Sacramento during that same period. The poverty rate among this population remains relatively low,
at 10.2%, but it has been rising. The largest increase in the actual number of people in poverty
between 2012 and 2017 (99,160 to 113,619) was among individuals 25-64, representing a 14.6%
increase of 14,459 individuals. While increasing, it is an improvement over the 47% increase in
poverty for this age group from 2010 to 2015. The increase in the poverty rate among younger
populations is slowing. During 2012-2017, the number of people in poverty age 0-15 decreased by
2,132, and the number of people in poverty aged 16-24 decreased by 3,031.
Graph 2 shows the racial/ethnic breakdown of poverty rates over a ten-year period. Aside from
people identifying as White, all racial/ethnic groups shown have experienced a drop in poverty rates.
Graph 2
Source: US Census Table B17001, 2010 & 2012 5-Year est., Table B17020, 2017 5-year est., & Table B17001, 2007 3-Year estimates; ACS, for Sacramento
County. 2007 rate for Hispanic/Latino is replaced with 2010 due to availability issues.
Graph 3 identifies Sacramento communities that have populations of over 10,000 residents and 5-
year average poverty rates (2012-2017) over 15%. The purpose of the graph is to highlight pockets of
concentrated poverty as target areas for services and implementing innovative anti-poverty strategies.
15Graph 3
Source: US Census Table S1701, ACS 2017 5-Year Estimates, for relevant communities in Sacramento County
Communities listed below as CSBG target areas were selected from all Sacramento County
communities with populations of 10,000+ and poverty rates averaging 15% or higher, based on the
most recent Census data, 2017. Target areas and their poverty rates follow in Table 1.
Table 1
Community Poverty Rate Community Poverty Rate
Arden Arcade 22.0% Florin 24.7%
Foothill Farms 21.9% Galt 15.3%
La Riviera 16.8% Lemon Hill 37.9%
North Highlands 26.8% Parkway 28.3%
Sacramento City 19.8% North Sacramento 36.3%
Carmichael 15.2%
While poverty was experienced by all family types, it was more pronounced in families headed by a
single mother. In 2017, 10.5% of two-parent families (12,183 families), were living in poverty. During
the same period, 37.0% of families headed by a single female (17,825 families), and 22.0% of families
headed by a single male (4,014 families), were living in poverty. The rate of poverty among families
headed by a single male rose between 2007 and 2017, from 14.6 to 22.0%.
Graph 4
Source: US Census Table B17010, ACS 2012 & 2017 5-Year Est., & Table B17010, ACS 2007 3-Year Est., for Sac. County
As seen in Graph 5 below, 8,773 adults and children joined the population living in extreme poverty
between 2012 and 2017. Between 2007 and 2017 there was a 57.2% increase in extreme poverty
16(below 50% of Federal Poverty Guidelines), compared with an increase of 8.9% in the Sacramento
County population for the same period.
Graph 5
Source: US Census Table B17024, ACS 2012 & 2017 5-Year Est.; Table B17024, ACS 2007 3-Year Est., for Sacramento County
Graph 6 identifies target group vulnerability to living in poverty and is an important indicator for the
identification of priority groups targeted for services.
Graph 6
Source: US Census Tables B17001, and B17001 for various racial/ethnic categories, & B17010, all from U.S. Census ACS 5-year estimates
Graph 6 shows that there are 308,619 children 0-15 living in Sacramento County; 72,493 of them are
living below 100% of Federal Poverty Guidelines. At a 23.5% poverty rate, this is significantly higher
than the 16.7% poverty rate for Sacramento County as a whole.
Conversely, there are 191,684 seniors 65+ in Sacramento County (13% of the general population), yet
they are under-represented among all persons living below 100% of Federal Poverty Guidelines at
10.2%, a rate which is two-thirds of Sacramento County’s poverty rate of 16.7%.
According to the 2017 ACS, there are 81,541 civilian veterans in Sacramento County or about 5.5% of
the general population. Veterans with a disability number 23,418; 16,412 have service-related
disabilities. Approximately 7,270 veterans live below federal poverty guidelines and as many as 300
are estimated to live in shelters or in transitional housing on any given night.
Definitions of Poverty: The poverty data used in this report and for the comparisons below represent
individuals living below 100% of Federal Poverty Guidelines, the federal definition of poverty. They do
not represent all individuals unable to sustain themselves and their families without public and private
supports. Nonetheless, it is a primary indicator used to track the growth and effects of poverty. A
17broader definition of poverty can include all persons unable to minimally sustain themselves without
some level of public or private supports to provide for basic family shelter, nutrition, clothing, health
and safety.
Statistical Data – Unless otherwise indicated, the 2017 ACS data was used to prepare this report.
The ACS is a product of the U.S. Census Bureau and is the highest quality data source for
demographic information of its kind. Data from the 2017 survey was collected in that year and
released in Fall 2018. Due to a shift in Census Bureau strategies, 5-year estimates are not available
prior to 2009. In multi-year comparisons using data prior to 2009, 3-year estimates have been used.
SINGLE PARENT HOUSEHOLDS
According to the 2017 ACS, 36.4% (66,375) of Sacramento County households with children under
age 18 (182,318) are headed by a single parent, compared to the state rate of 36.2%. Female-
headed households represent almost 72.5% of all single parent households and almost 82% of all
single parent households live in poverty.
Among single parent households with children under 18, 32.9% were living below federal poverty
guidelines. Among female-headed households, the rate was 37% or 3.5 times the poverty rate for
married couple families (10.5%). For female-headed households with children 5 and under, the
poverty rate was 42.8%.
Graph 7 identifies the poverty rates among single female-headed households in Census Designated
Areas.
Graph 7
Source: U.S, Census Table B17012, 2017 ACS 5-Year Estimates for Sacramento County
Graph 8 shows the poverty rates among married-couple households, single father households, and
single mother households over a ten-year period. Families are experiencing a leveling off of the
poverty rate; however, the poverty rate among single parents continues to climb.
18Graph 8
Source: U.S. Census Table B17010, 2012 and 2017 ACS 5-Year Estimates, and 2007 3-Year Estimates, for Sacramento County
As Graph 9 demonstrates, children in single parent households are considerably more likely to be
poor than children in two-parent households. This is particularly true for children of single mothers.
The poverty rate for the children in any of the family types considered here is higher than the poverty
rate for the family types. This is likely due to the presence of multiple children in the household.
Graph 9
Source: U.S. Census Table B17006, ACS 2012 & 2017 5-Year Estimates, & 2007 3-Year Estimates, for Sacramento County
Graph 10 shows that from 2007 to 2017, median incomes for single parent households have remained
relatively low. The 2017 median income for single female-headed households remains $11,070 lower
than the median income for single male-headed households and $56,281 lower than that of married
households with children. The income gap between single father family incomes and single mother
family incomes has nearly doubled in just two years; in 2015, single fathers were making just $6,441
more than single mothers.
Graph 10
Source: U.S. Census Table B19126 2012 and 2017, ACS5-Year Est., & U.S. Census Table B19126 2007 3-Year Est., for Sacramento County
19For comparison, the Living Wage Calculator for Sacramento County reports that the annual income
necessary to make a single parent household with two children minimally self-sufficient is $67,122, or
$32.27 per hour, if the parent is employed full-time. The graph above reflects a 2017 median annual
salary of $29,831 for single mothers – a median income decline of over $1,000 in ten years. For a two
parent household with two children and one parent working, the annual income for minimal self-
sufficiency is less at $56,014 or $26.93 per hour, if one parent is employed full-time and the other
parent provides childcare and other services for the family.
POVERTY AMONG OLDER ADULTS
Since 2012, the 65+ population in Sacramento County has increased by almost 21%, from 161,119
persons to 194,729 persons in 2017. During the same period, the poverty rate for seniors rose almost
two percentage points, from 8.4% to 10.2%; the rate of seniors experiencing extreme poverty (below
50% of Federal Poverty Guidelines) declined slightly, to 33% of all seniors in poverty.
From July 2015 through June 2016, 5,064 seniors relied on 451,061 congregate or home delivered
meals to supplement their nutrition. This figure represents only the meals funded by the federal Older
Americans Act of 1965, and does not include the large number of meals provided to seniors through
local food banks, churches, and cultural organizations.
According to the 2017 ACS, the median annual household income for householders 65+ is $46,621,
and for 45- to 64-year-old householders is $72,908. Sixty-five percent of persons 65+ are females
living alone. Senior females are also more likely to be living in poverty than their male counterparts;
while the poverty rate of males 65+ is 8.5%, the poverty rate for females 65+ is 11.5%. As is true
throughout most of the economy, women 65+ who are living alone have a smaller median income,
$25,445, than their male counterparts at $33,273.
Graph 11
Source: U.S. Census Table B17001, 2017 ACS 5-Year Est., selected for the racial/ethnic groups listed above, for Sacramento County
Graph 11 compares the poverty rate of seniors with the poverty rate of the general population, by
race. While there are lower rates of poverty for seniors than for the general population, the poverty
rate for seniors has gone up between 2012 and 2017; please see Appendix C for additional
information.
The 2017 ACS estimates that 14.5% (28,213) of persons 65+ were in the workforce. Of that
population, 5.2% (1,466) were unemployed, a lower rate than in 2012 (9.2%, or 2,058). Of the
20unemployed, 42.8% were women, 16.2% fewer than in 2012. A slightly smaller number of senior men
are not working, but actively looking (5.6%), than in 2012 (6.6%).
POVERTY AMONG YOUTH
According to the most recent ACS (2017), children aged 0 through 17 years (356,360 individuals)
comprise 24.2% of Sacramento County’s total population. Among this age group, the poverty rate is
22.6%, about 2.4 percentage points lower than the same poverty rate in 2012. Children 0-5 years
have traditionally maintained the highest poverty rate among children 0-17 years. The 25.2% poverty
rate for children aged 0-5 is 2.6 percentage points higher than the 0-17 year-olds. The slight decrease
in poverty rates for children overall is an improvement. However, the poverty rate for youth aged 0-17
is still 5.9 percentage points higher than the overall poverty rate of 16.7%; the poverty rate for children
aged 0-5 is 8.5 percentage points higher than the overall poverty rate.
Graph 12 compares averaged poverty rate data collected during 2017, for children 0-5 in the
communities noted. Similar trends are seen among children 0-17, as demonstrated in Appendix C,
Graph B.
Graph 12
Source: U.S. Census Tables 17001 ACS for 2012 & 2017, 5-Yr. Est., & Table B17001 ACS for 2007 3-Yr. Est., for Sacramento County
The percentages above represent hundreds, often thousands, of children in each Census Designated
Place. Table 2 in Appendix C breaks out this information in greater detail, and presents conditions of
poverty for many of Sacramento County’s most vulnerable residents.
FOSTER YOUTH:
In almost every category, the number of children in foster care has remained relatively flat over the last
5 years. On January 1, 2018, there were 2,392 children in foster care in Sacramento County, 2.9%
less than 2013 (2,464). During 2017, 1,189 children entered foster care, a 3.3% increase over the
entry numbers in 2012 (1,151), and 1,416 youth exited the foster care system, a 12.4% decrease over
the same number of exits in 2012 (1,260). During 2017, 202 youth were emancipated from the foster
care system in Sacramento County.
21Graph 13 compares Sacramento County and California exit outcomes for foster youth aging out or
legally emancipating during 2017.
Graph 13
Source: California Child Welfare Indicators Project, U.C. Berkeley, 2017 Outcomes for Foster Youth
In many measures, foster youth exiting from the child welfare system in Sacramento County seem
somewhat better prepared to reach self-sufficiency than their peers, statewide. However, areas of
concern remain for Sacramento County foster youth:
No permanent connection to a committed adult was established or known for 6 exited foster youth
(4%), prior to being exited from the system;
Fifty-seven (38%) exited without obtaining employment;
Twelve Sacramento County foster youth (8%) had no known housing connection when exited;
Over 27% (41) of youth exiting the Sacramento County foster care system did not earn a high
school diploma or its equivalent.
Without a job, basic education, housing, or a trusted adult to guide them, these youth face significant
barriers and would benefit from some type of intervention or safety-net supports.
YOUTH OFFENDERS/JUVENILE DELINQUENCY
The following section provides data and analysis for juvenile arrests occurring in 2017, the most recent
year for which accurate crime statistics are available from the State. Although not all arrests result in
convictions and penalties, or can be attributed to a crime actually taking place, they represent the
entry point into the Juvenile Justice system for many, and the beginning of a criminal record that can
affect a juvenile’s future pursuits and employability as an adult.
Statistical parameters for the juvenile arrest rates have changed over the past few years. The most
significant change at the County level is broader age range available on arrest rates for juveniles.
While juvenile arrest rates are available, they encompass youth age 0-17 (formerly age 10-17). This
shift lowers the overall arrest rate for youth, since the population of youth age 0-17 is considerably
larger than the youth population age 10-17. Nevertheless, patterns are still noticeable in the rates of
arrest for different racial and ethnic groups. Additionally, two recent California laws have impacted
longitudinal review of some offenses. In 2014, Proposition 47 reduced some felonies to
misdemeanors; in 2016, Proposition 64 legalized the possession and use of marijuana for people 21
years and older, and reduced the penalties for related offenses. Reductions of the arrest rate for
some offenses may be a result in the shift of the definition and disposition of certain crimes.
22Longitudinal information has been included here, but its applicability may be limited due to these
changes in California law.
In 2017, there were 361,889 youth under 18 in Sacramento County. This represents 4% of the same
target group for all California counties (9,114,270 youth). Sacramento County felony arrests of
juveniles under the age of 18 represents 4.1% of all felony arrests in California, slightly higher than
their representation in the State’s target group population. It should be noted that there has been an
overall and sometimes steep decline in felony and misdemeanor arrests over the previous decade.
Reasons for the decline are unclear, but may include law enforcement staffing levels, shifts in priorities
or policies, or successful crime reduction strategies.
According to the most currently available data for this report, Sacramento County had a slightly higher
juvenile felony arrest rate during 2017 (2.2 arrests/1,000 youths aged 0-17) than the State of
California. The California rate for felony juvenile offenders was 2.1 arrests/1,000 youths aged 0-17.
Graph 14 illustrates the felony arrest rates for target groups by race/ethnicity and adjusted for relative
group populations in Sacramento County.
Graph 14
Source: CA Dept. of Justice Juvenile Felony Arrest Statistics for 2017, & US Census Table B01001 2017 ACS, 5-Yr. Est., for Sacramento County
Of particular note is the high incidence of felony arrests for African American males (0-17 years) or
approximately 132% of the rate for all juvenile males (0-17 years), and for African American females,
approximately 136% of the rate for all juvenile females (0-17 years), in Sacramento County.
A similar discrepancy occurs in the rate of misdemeanor arrests, included in Appendix C as Graph C.
According to the most current data available for this report, Sacramento County appears to have had a
51% lower juvenile misdemeanor arrest rate during 2017 than the State. The rate for misdemeanor
juvenile arrests in California was 3.3 arrests/1,000 youths aged 0-17; for Sacramento County, that rate
was 1.9 arrests/1,000 youths aged 0-17.
African American juvenile males 0-17 represent less than 10% of the total juvenile male population 0-
17, but they represent nearly 55% of all juvenile males arrested for violent crimes and over 57% of all
felony burglary arrests for their age group in Sacramento County. Although the raw number of arrests
has generally declined for this group over the past decade, the data continues to indicate that African
American males and females remain underserved by existing programs and resources.
23The purpose of Graph 15 is to illustrate that all five of the major felony arrest categories in
Sacramento County for which the State keeps statistics (violent, property, drug, sex, and other
offenses) have experienced a drop, some dramatic, over the past decade.
Graph 15
Source: State of California Department of Justice Juvenile Felony Arrest Statistics 2008-2016
LEVEL OF EDUCATION
Data from the 2017 ACS illustrates a strong correlation between level of education, median income,
and poverty. It also illustrates gender disparities in wages.
Graph 16, below, demonstrates the correlation of low educational attainment and poverty by showing
poverty at defined educational levels in Sacramento County. The poverty rate of persons without a
High School diploma is more than double that of all persons who have an Associate Degree or some
college coursework.
Graph 16
Source: US Census Table B17003, 2017 ACS 5-Year Estimates, for Sacramento County
24Graph 16 demonstrates there is a significantly lower rate of poverty for those with a bachelor’s degree
or higher. In all educational levels, women experienced greater incidences of poverty than men. As
shown in Graph 16, for all Sacramento County persons age 25+ without a high school diploma, the
poverty rate in 2017 was 25% for males and 30.8% for females. These rates are decreasing: in 2015
the poverty rate for males without a high school diploma was 29% and for females without a high
school diploma was 33.7%. Nevertheless, the rates remain high.
Table 2, below, demonstrates median earnings in Sacramento County by educational attainment for
the years 2007, 2012 and 2017. Results are mixed, but at every level of education, females earned a
substantially lower median income than males. This is especially true for women who did not graduate
from high school, who earn 42% less than their male counterparts.
Table 2
Group Characteristic Median Earnings Male Median Earnings Female
Comparison Years 2007 2012 2017 2007 2012 2017
Less Than High School
$23,625 $20,844 $25,487 $15,076 $15,430 $16,429
Graduate
High School Graduate or
$32,454 $31,339 $31,817 $24,850 $25,835 $25,456
Equivalent
Some College/
$41,619 $41,120 $41,392 $33,366 $33,010 $31,987
Associate’s Degree
Bachelor’s Degree $60,755 $62,253 $63,782 $44,368 $47,220 $49,327
Graduate or Professional
$76,065 $83,008 $85,558 $59,524 $64,630 $67,967
Degree
NOTE: Median income represents that amount at which half of the working population in any of the categories above makes
more income, and the other half makes less.
Women over the age of 25 who have never graduated from high school have a median annual income
of only $16,429; that is just over half of the median income for women who have completed some
college courses. Fair market rent for a 1-bedroom apartment in Sacramento County ($968/month)
would consume almost 71% of this pre-tax income.
Since the vast majority of students complete their education in four years, the four-year graduation
rate is a valuable tool when considering high school completion. Graph 17 presents this information.
Graph 17
Source: CA Dept. of Educ. DataQuest, Dropouts by Ethnic Designation by Grade, 2016-17 for CA and Sac. County AIAN* Amer. Indian/Alaskan Native
25Graduation rates also reveal the rate of people who did not complete high school in four years. While
78.2% of Latinos, and 71.7% of African Americans, graduated from high school in four years in
Sacramento County, 21.8% of Latinos and 28.3% of African Americans did not graduate from high
school. This is consistent with the yearly rate of 3.1% of Latinos and 4.7% of African Americans
dropping out each year, as demonstrated in Appendix C, Graph D.
According to the Child Trends Databank, people who do not complete high school are more likely to
struggle with employment and poverty, be dependent on welfare benefits, have poor physical and
mental health, and engage in criminal activity than those with higher educational levels. The
completion of a GED does contribute to an individual’s economic prospects, but it does not replace the
earning potential associated with earning a high school diploma.
HOUSING
This section describes the current state of rental housing and its effects on low-income households in
Sacramento County. During the period between 2007 and 2017, Sacramento saw a shrinking number
of homeowner households in most income brackets; the exception is a 7.2% increase (11,262) in
households earning more than $75,000 per year. There has been an 18.2% increase (37,533) in the
number of rental households. While this increase is reflected in all income brackets, it is most
pronounced among households earning more than $75,000 per year, who accounted for 23,608 of
those households.
The increased activity rate of the rental housing market has led to a limited vacancy rate throughout
the area. Sacramento’s third quarter rental housing vacancy rate for 2018 was 4.4%. This is an
improvement of the rental vacancy rate of 2% in 2017, but it remains a tight market. Limited
availability has also led to an increase in rents. According to Chris Salviati of ApartmentList.com,
rental costs in Sacramento have risen 26% in the last five years, which is the sixth-fastest rise among
large cities in the country. On March 4, 2019, the Sacramento Bee reported that the median rent for a
two-bedroom apartment rose a “modest” 1.4% over 2018 rates. Given the rapid rise in the cost of
rental units, the potential for a slowdown in the cost of rental housing is good news.
Fair market rent for Sacramento County is typically driven by demand and the rate of rental unit
inventories available in the marketplace. According to the fair market value listed by the Housing and
Urban Development (HUD), most apartments had increased rents in 2017; however, aside from studio
apartments, all rents have decreased since 2013. Despite the decrease in fair market rent, the hourly
wage needed to pay for apartments in Sacramento County is still beyond the reach of many residents,
as indicated in Table 3, below.
Table 3
2013-2017 Fair Market Rent Comparison for Sacramento County (HUD)
Hourly Wage Needed
2013 2015 2017
to Afford Rent in 2017*
Studio Unit $717 $676 $720 $13.85
One-Bedroom Unit $855 $806 $821 $15.79
Two-Bedroom Unit $1,073 $1,012 $1,036 $19.92
Three-Bedroom Unit $1,581 $1,491 $1,508 $29.00
Four-Bedroom Unit $1,900 $1,792 $1,825 $35.10
* Assumes the equivalent of one third of gross income from a F/T job is spent on rent
26You can also read