Caring for Vulnerable Babies: The reorganisation of neonatal services in England
←
→
Page content transcription
If your browser does not render page correctly, please read the page content below
Caring for Vulnerable Babies:
The reorganisation of
neonatal services in England
REPORT BY THE COMPTROLLER AND AUDITOR GENERAL | HC 101 Session 2007-2008 | 19 December 2007
The National Audit Office scrutinises
public spending on behalf of
Parliament. The Comptroller and
Auditor General, Sir John Bourn, is
an Officer of the House of Commons.
He is the head of the National Audit
Office, which employs some 850 staff.
He, and the National Audit Office, are
totally independent of Government.
He certifies the accounts of all
Government departments and a wide
range of other public sector bodies;
and he has statutory authority to report
to Parliament on the economy,
efficiency and effectiveness with
which departments and other bodies
have used their resources. Our work
saves the taxpayer millions of pounds
every year. At least £8 for every
£1 spent running the Office.
Caring for Vulnerable Babies:
                                            The reorganisation of
                                    neonatal services in England

                                                                                Ordered by the
LONDON: The Stationery Office                                              House of Commons
£13.90                                                     to be printed on 17 December 2007

   REPORT BY THE COMPTROLLER AND AUDITOR GENERAL | HC 101 Session 2007-2008 | 19 December 2007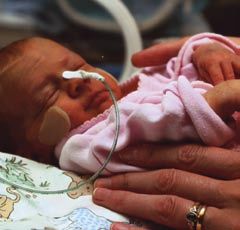
CONTENTS
                                                  KEy FAcTS                                       4

                                                  SuMMAry                                         8

This report has been prepared under Section 6
                                                  PArT OnE
of the National Audit Act 1983 for presentation
to the House of Commons in accordance with        Neonatal services have been reorganised        12
Section 9 of the Act.                             into networks
                                                  The 2003 Review made the case                  12
John Bourn                                        for the reorganisation of neonatal services
Comptroller and Auditor General
National Audit Office                              The reorganisation of services into managed    12
                                                  clinical networks has largely been achieved
14 December 2007
                                                  Since 2003 neonatal networks have developed    13
                                                  in different ways
The National Audit Office
study team consisted of:                          The objective of reducing mortality rates      16
                                                  continues to be a challenge
Ffiona Kyte, Tom McDonald, Nick Ormiston-
Smith, Caroline Milligan, Marianne O’Neill,       Other NHS bodies hold data which could         17
Tom McBride and Ria Gill-Williams,
                                                  help networks evaluate quality of outcomes
under the direction of Karen Taylor
                                                  PArT TWO
This report can be found on the National Audit    Networks have made progess in                  20
Office web site at www.nao.org.uk                 improving consistency, communication
                                                  and coordination of neonatal services
For further information about the                 Networks have made progress in agreeing        20
National Audit Office please contact:              protocols and standards to improve
National Audit Office                             consistency of service
Press Office
157-197 Buckingham Palace Road                    Engaging and involving families is improving   21
Victoria
                                                  Networks are helping to improve management     21
London
                                                  information and data on performance
SW1W 9SP
Tel: 020 7798 7400                                There are signs of improvement in              21
                                                  the transfer of babies but problems remain
Email: enquiries@nao.gsi.gov.uk
© National Audit Office 2007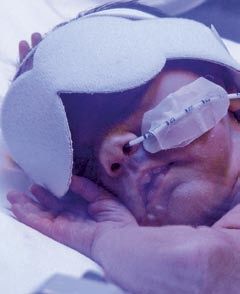
Part THREE                                                          Appendices
Capacity and staffing problems at                      24
                                                                    1 Methodology                          34
unit level continue to constrain the service
                                                                    2 Profile of neonatal networks         36
There are shortfalls in capacity                       24
                                                                    3 Summary of key service indicators,   40
Medical staffing ratios are generally being met        26
                                                                      grouped by network
Shortages in the numbers of neonatal nurses            26
are a key concern                                                   glossary                               42

Parents are mostly content with the expert             28           endnotes	                              44
care provided to their babies

Part four
There has been additional funding for                  29
services but financial management and
commissioning need to improve
The Department has allocated additional                29
resources to neonatal services although
its visibility of the costs of the service is
somewhat limited

Financial management at the unit level                 30
needs to be improved

Commissioning practices vary but                       31
should be more joined up

Implemented carefully, Payment by                      32
Results could bring real benefits

Photographs courtesy of Clare Osborn, Cosser Akhtar, Sharon Cox and © Crown copyright 2007.
kEy FACTS
    Demand for neonatal care
    is increasing
    n      In 2006, 635,748 babies were born in England,             n     The risk factors associated with prematurity or low
           a 3.7 per cent increase since 2005 and the fifth                birth weight are high or low maternal age, obesity,
           increase since 2001.                                            smoking, ethnic origin, deprivation and assisted
                                                                           conception such as IVF.
    n      In 2006-07, 62,471 babies, or roughly one in ten
           of all births, were admitted to neonatal units. This      n     The number of women giving birth at 40 years of
           was up from 59,711 in 2005-06.1                                 age or more has more than doubled since 1986.
                                                                           The proportion of births to non-UK born mothers
    n      Babies need neonatal care because they are                      has increased from 12.8 per cent in 1996 to
           premature, have a low birth weight or suffer from               21.9 per cent in 2006. The number of women
           an illness or condition, such as a heart defect. The            receiving assisted conception has more than
           trend in low birth weight babies is increasing in the           trebled since 1991.3
           UK and other developed countries.2

4       CARING FOR vuLNERABLE BABIES: THE REORGANISATION OF NEONATAL SERvICES IN ENGLAND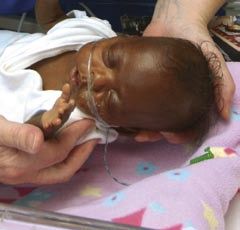
Key facts continued

n 	Survival  rates for premature or low birth weight babies     How neonatal services have responded
     have improved dramatically. In 1975 half of babies
                                                                 n 	Advances     in technology and health care expertise
     born prematurely with birth weight 1500g or less died
     and many others were stillborn. By 1985 a quarter                 have led to increasing survival rates of very
     died and by 1995 it was a sixth. Many babies who                  premature babies over the last 20 years.7 Medical
     previously would have been stillborn are now born                 advances such as antenatal steroids and surfactant
     alive. As a result there is an increased expectation that         (which helps babies’ lungs to function more
     very small babies will survive.                                   effectively), improvements in nutrition, evolution of
                                                                       neonatology as a paediatric sub-specialty and the
n 	Infant  mortality as a whole has fallen from 7.3 deaths            development of nursing expertise mean the service
     per 1,000 live births in 1991 to 5 deaths in 2005                 continues to be an innovative and cutting edge area
     and is heavily affected by deaths in the neonatal                 of medicine.
     period. Some 70 per cent of infant mortality occurs
                                                                 n 	In   England there are 180 neonatal units based in
     in the first 28 days of life. Although prematurity and
     low birth weight are most closely associated with                 NHS and Foundation Trusts currently structured into
     infant mortality, other factors, such as congenital               23 regional networks.8 Each unit has a designation
     anomalies, also have a significant impact.                        of either level 1, 2 or 3 which indicates the type and
                                                                       intensity of the care it provides. See Figures 4 and 5
n 	Neonatal   mortality rates have fallen from 4.2 deaths             for further details.
     per 1,000 live births in 1995 to 3.5 deaths in 2005.4
                                                                 n 	Babies    are cared for in incubators, also described as
     There is evidence showing that neonatal mortality
     increases with higher levels of deprivation.5                     cots, at three levels of care. The total number of cots
                                                                       has increased from 3,243 in 2004-05 to 3,521 in
n 	Premature     birth can have long-term health impacts              2006-07.9
     such as learning difficulties and cerebral palsy, but
                                                                 n 	These   units are staffed by paediatric and neonatal
     accurate data on trends over time is sparse and its
     full effects may not be identified for several years.             doctors and neonatal nurses, some of whom have
     Long-term studies of premature children, such as the              specialist training.
     EPICure study, suggest that prematurity can have a
                                                                 Figure 1 overleaf shows the ideal patient pathway
     wide range of physical and cognitive effects.6
                                                                 and shows the points at which the pathway can
                                                                 be undermined.

Caring for vulnerable babies: the reorganisation of neonatal services in England 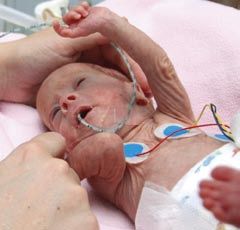
key facts

    1      The ideal neonatal pathway can be interrupted by delays at different decision points

                                                   Potential                          Baby transferred
      Parents access                          irregularities with                        in-utero to
     antenatal services                         pregnancy are                           neonatal unit        Baby delivered
           early                                identified and                        providing care at
                                                  monitored                           appropriate level

                                                                                                              Mother gives
         Parents do                                                                                          birth in hospital
         not access                              Mother goes                            Parents arrive            without
          antenatal                              into labour                             at hospital           appropriate
           services                                                                                           neonatal care
                                                                                                                  on site

                                                                                         Mother may
                                                                                         be moved to           Baby has to
                                                                                       another hospital        wait before
                                                                                       with appropriate       being moved
                                                                                     neonatal care on site   to appropriate
                                                                                     depending on labour      neonatal unit
                                                                                        ward capacity

               indicates the appropriate steps to access neonatal services
               indicates delays that put at risk treatment being accessed urgently
               indicates severe delays, usually caused by transport or capacity problems

    Source: National Audit Office analysis

       Caring for vulnerable babies: the reorganisation of neonatal services in England
key facts

                       Baby moved
  Baby is cared     through levels of                                                        Community
 for in neonatal    care as required                                                       neonatal nurse
   network, as       and transferred                   Baby discharged                      visits mother
close to home as     to unit closer to                                                     and baby once
     possible      home as condition                                                         discharged
                        improves

      Baby
                        Delay to                        No community
 transferred to
                      baby being                        neonatal nurse
  appropriate
                      transferred                        able to visit
 neonatal unit
                    closer to home                       mother and
  (mother may
                     as condition                         baby once
   or may not
                       improves                          discharged
  accompany)

    Baby and
   mother are
 looked after in
  separate units

                        Caring for vulnerable babies: the reorganisation of neonatal services in England
SuMMARy
1 Most babies are born healthy requiring little or 4 The Department endorsed the report’s
no medical intervention. Every year, however, around recommendations and at the same time announced an
ten per cent of babies are born prematurely or suffer additional £72 million between 2003-04 and 2005-06 to
from an illness or condition which requires care ranging help implement the recommendations. The distribution of
in complexity, from a local special care baby unit to a these additional funds was weighted by incidence of low
highly specialised neonatal intensive care department birth weight. In 2006-07 some £420 million was spent on
(Figure 1). Prematurity and illness in newborn babies are running neonatal units.a
associated with a complex range of factors, including
social deprivation, ethnicity and maternal age, assisted 5 There are important ethical issues surrounding
conception and lifestyle factors. Babies can also require neonatal care, such as the gestational age at which it
care arising from complications of pregnancy and delivery, is appropriate to treat extremely premature babies and
from medical disorders such as infection or metabolic the long term impacts of disability. These issues were
disorders or when surgical or other treatment is required addressed in the Nuffield Council on Bioethics 2006
for congenital anomalies. report.11 Our report does not comment on these decisions
nor does it examine issues aimed at reducing the risks of
2 Over the last 20 years, neonatal services have premature and low birth weight babies, for which there
undergone substantial organisational and technological are a number of NHS and cross-Government initiatives.
changes whilst remaining a challenging and necessarily Rather, our focus is on how well the introduction of
innovative area of medicine. Specialised training of networks has helped the service respond to the increasing
doctors and nurses underpinned by technological demand for neonatal care. Full details of our methodology
advances has led to greater numbers of very small babies are at Appendix 1.
being born alive and surviving. Year on year increases in
birth rates and improvements in survival rates have placed
increasing pressure on the capacity of neonatal services Findings
and led to some instances of babies being transferred long 6 There is widespread support for neonatal services
distances to receive definitive care. to be delivered through managed clinical networks,
but these networks have evolved at different rates.
3 In 2001 the Department of Health (the Department)
Most neonatal units in England organised themselves
commissioned an expert working group to review
into formal networks linked by supervisory management
neonatal intensive care services. The resulting report,
structures, although there has recently been some
published as a consultation document in April 2003,
shifting of network boundaries, including one merger
proposed the reorganisation of neonatal care into
(Appendix 2). As specific arrangements are determined
managed clinical networks so that units in each network
locally, variations exist in network budgets, stakeholder
would provide virtually all the care required by mothers
representation and the roles networks have assumed.
and babies without the need for long-distance transfers.
All networks have developed their own neonatal care
This followed evidence from other countries that
pathways, guidelines and clinical audit programmes.
networked models of intensive neonatal care produced
However, there has been less progress in influencing
the best outcomes for babies.10
a This covers the costs of special, high dependency and intensive medical care provided in neonatal units plus surgery where it is provided on the same site,
but excludes costs of babies treated in other specialist surgical units.
8 CARING FOR vuLNERABLE BABIES: THE REORGANISATION OF NEONATAL SERvICES IN ENGLANDsummary
commissioners and Trusts to re-designate units according of regional data sets, enabling analysis and benchmarking
to the care they are able to provide, which was one of the of data. However, there is a high level of duplication
key recommendations of the 2003 Review. of data collection and a need for consolidation
and harmonisation.
7 Most networks have made progress in reducing
long-distance transfers, but only half provide specialist 10 Constraints in relation to capacity continue to
transport services 24 hours a day, seven days a week. undermine the effectiveness and efficiency of neonatal
Neonatal transport is an essential element of networked care. One of the key indicators of the capacity of a unit is
neonatal care including transfers to, between and back the frequency with which it has to close to new admissions
from units. Networks generally deploy some form of (each unit had closed to new admissions an average of
specialist transport service during day time working 52 times during 2006-07 due mainly to either lack of cots
hours, with half providing a 24-hour, seven day-a-week or shortages of nursing staff (n=122)). Fifty-eight units
transport service. Seventeen out of 23 networks are (33 per cent) operated above the British Association of
now meeting the target of treating 95 per cent of babies Perinatal Medicine (BAPM)b guideline of 70 per cent cot
within the network. However, few transport services have occupancy and three units above 100 per cent.c Although
separate staffing arrangements from the clinical inpatient there has been an increase in the numbers of intensive and
service. As a result, staff often have to leave their unit high dependency cots, most special care units had to care
to accompany a baby on a transfer, putting pressure on for babies needing these higher levels of care.
remaining staff.
11 A key reason for problems with capacity is nursing
8 Evidence of outcomes, other than the traditional shortages. Most units had an adequate level of medical
indicator of mortality rates, is sparse and these rates staffing and were in line with the BAPM 2001 medical
show unexplained variations. Whilst management staffing guidelines. The situation with nursing is much
information is improving, it is not yet strong enough to more critical with significant shortages of trained nurses
provide evidence of improvements in quality of care. The across the country and wide regional variations in
neonatal mortality rate for England was 3.7 (deaths per vacancies (Appendix 3). Only the guideline for special
1,000 live births) in 2003, 3.4 in 2004 and 3.5 in 2005, care, one nurse to four babies, is being met. Half of all
which is within a similar range of other comparable units met the standard for high dependency care but only
countries. This national figure however masks wide 24 per cent did so for intensive care (n=151).d
variation at the network level. We focussed on neonatal
mortality rates at network level in recognition that at 12 Parents are mostly very happy with the specialist
unit level a complex combination of factors can affect care and expertise their babies receive, but they
the mortality rate; and that we would expect some also have needs which are currently not always met.
variations to be smoothed out at the network level. In Parents’ views of the service are important given that
2005 Midlands South (South West Midlands) had the babies cannot speak for themselves and the former are
highest rate (4.8 per 1,000) and Surrey and Sussex the extremely appreciative of the care their babies receive.
lowest rate (1.8 per 1,000). Whilst this may be due to the However, their needs are often overlooked. Parents
demographics of the population covered by the network, have consistently suggested a need for improvements in
differences in service provision may also be a factor. support for breastfeeding, information about their babies’
care, communication with medical staff, car parking and
9 Networks have improved communication and accommodation to enable them to stay with their babies.
coordination between units and now have better, more
consistent information on performance. All networks 13 The separation of commissioning for different
have agreed their own protocols, standards and pathways levels of care causes difficulties in planning services.
of care. The Healthcare Commission, supported by the Special care is commissioned by Primary Care Trusts
Department has funded a Neonatal Audit Programme (PCTs) and high dependency and intensive care are
minimum dataset. Seventy per cent of units (n=153) now commissioned by the ten Specialised Commissioning
use a neonatal.net electronic patient record, making Groups, despite the tendency of babies to move rapidly
information easier to record and creating opportunities to between these levels of care. In addition, there is no
evaluate. Networks have also supported the development
b The British Association of Perinatal Medicine is a professional organisation, which aims to improve the standard of perinatal care in the British Isles. BAPM’s
Standards for Hospitals Providing Neonatal Intensive and High Dependency Care (Second Edition) was published in December 2001. They are professional
guidelines, endorsed by the Council of the Royal College of Paediatrics and Child Health and the Trustees of BLISS (the national charity of the newborn) and are
not mandatory standards.
c See paragraph 3.4 for more details on how occupancy rates were calculated.
d Unit staffing can vary from shift to shift. Vacancy levels are against establishment.
Caring for vulnerable babies: the reorganisation of neonatal services in England summary
formal link between the commissioning of maternity and Strategic Health Authorities and commissioners
neonatal services, despite the fact that the former is a key should define the performance management
driver of demand for the latter. arrangements which will monitor the outcomes
of the networks drawing on our evaluations of the
14 The costs of the service are not fully understood current situation as illustrated in Appendices 2
and there is a mismatch between costs and charges. and 3.
Data provided by units suggest wide variations within and
b Issue: Neonatal services are part of a continuum of
between the different types of unit, from one unit with an
care which starts with maternity services but they
operating deficit of £2.6 million to one with an operating
are at present commissioned and planned separately
surplus of £4.9 million. Charges for neonatal care do not
rather than as part of a whole systems approach.
necessarily reflect costs and financial management at the
There is a need for:
unit level needs to be improved. The future introduction
of Payment by Results could bring positive benefits for n Targeted research, whether commissioned by
neonatal services, although there are concerns about the the Department or by other appropriate funders
practicalities of its introduction. such as the relevant professional bodies. This
needs to be aimed at reducing the demand for
neonatal care through improved understanding
Overall conclusion and prevention of the trigger factors which are
15 The reorganisation of care into neonatal networks associated with preterm birth, low birth weight
has improved the coordination and consistency of and sickness in newborns.
services, pointing to increased effectiveness. There are n Commissioners and networks to coordinate
however still serious capacity and staffing problems the commissioning of neonatal and maternity
and a lack of clear data on outcomes. In addition, the services. This should include undertaking
variable state of financial management makes it difficult strategic needs assessments of the local
to judge the economy and efficiency of the service. We population, taking standards set by professional
are therefore unable to say whether or not networks have bodies into account and addressing the
improved the overall value for money of the service. blockages in networks which prevent efficient
Nonetheless the majority of parents are grateful for the in-utero transfers.
care their babies receive. Given the rising demand for the
c Issue: At the moment special care is commissioned
service and the constraints within the system, parents’
separately from high dependency and intensive care.
views are an important indicator of achievement, but the
There is consensus that they should be commissioned
lack of robust evidence on outcomes makes it difficult to
together and in some networks commissioners
reach an objective view of the quality of the service.
have moved to this arrangement. Networks,
commissioners and Strategic Health Authorities
Recommendations should work together to commission care pathways
across all three levels of care including transport
16 Reducing disparities in mortality rates cannot be to enable capacity to be planned and managed
addressed through improved neonatal services alone. effectively. Lessons from Kent and Medway and other
Reducing the prevalence of premature and low birth networks already implementing this approach should
weight babies requires a range of coordinated NHS, be evaluated by the national group of specialist
public health and cross government initiatives. Many of commissioners and neonatal network managers and
these, such as programmes to reduce teenage pregnancies adopted or adapted as necessary.
and smoking, are already in train. Once a baby is born,
however, neonatal services should provide high quality, d Issue: Although three quarters of networks have
safe care in an appropriate setting, keeping transfers of the reviewed the designatione of all or most of their units,
baby to a minimum. The following recommendations are re-designation has not been implemented in full for a
focused to that end. variety of reasons. Without meaningful re‑designation
processes, networks may find it difficult to ensure
a Issue: The 2003 Review did not specify how the they have appropriate capacity to meet demand
performance of networks in meeting the needs safely. Using evidence from professional bodies,
and outcomes of neonates should be managed. It commissioners should drive re‑designation
also occurred prior to the recent reconfiguration of to enable capacity to match the needs of their
Strategic Health Authorities and Primary Care Trusts. population and that babies are being cared for in
e This refers to the type and intensity of care a unit can provide and is outlined further in paragraphs 1.14-1.16 and in figures 4 and 5.
10 Caring for vulnerable babies: the reorganisation of neonatal services in Englandsummary
settings with appropriate staffing levels and skills. h Issue: There are variations in the way Trusts calculate
In doing this, they will need the support of Strategic costs and charges for neonatal care, making it
Health Authorities and full cooperation of NHS and difficult for commissioners to allocate resources
Foundation Trusts in each network. effectively. NHS and Foundation Trusts should
improve the completeness and accuracy of financial
e Issue: Progress in improving the quality of
management data on neonatal activity, by using
management information at unit, network and
developments such as patient-level costing and
national levels is slow. The availability of this
service-line reporting, and ensure that overheads are
information is vital for establishing the efficiency and
apportioned in a consistent manner.
effectiveness of the service, particularly in calculating
the long-term impacts of different types of care. All i Issue: The implementation of Payment by Results
neonatal units should, as a priority, contribute fully (PbR) for neonatal services is due to be considered
to the Neonatal Audit Programme minimum dataset, by the PbR Children’s Services Clinical Working
regardless of which system they use to gather data. Group alongside the new neonatal dataset. There
The neonatal network managers group should work are widespread concerns that not enough work
with units and the Department to reduce duplication has yet been done to create a set of tariffs which
of data collection. capture the full costs of neonatal care. We have also
identified considerable variation in the costs and
f Issue. Transport arrangements are still not optimised
charges as they are currently understood by Trusts.
in terms of responsiveness or cost-effectiveness and
In determining a future tariff or tariffs for neonatal
have developed in a piecemeal fashion. As a result,
services, the Department of Health advised by the
delays are still occurring and unit staff are being
Payment by Results Working Group needs to take
diverted to accompany transfers. Networks and
into account the findings of this report, in particular
Strategic Health Authorities should examine the
our findings on the wide range of Trusts’ costs and
relative cost-effectiveness of the different transport
charges, and ensure that transport costs are included.
arrangements currently in place and look to join up
either with neighbouring networks or with paediatric
intensive care transport services if necessary to
achieve the optimum geographic coverage.
g Issue: On average each neonatal unit in England is
currently carrying three whole-time equivalent nurse
vacancies and the proportion of vacancies increases
as the intensity of care provided increases. Very few
units are meeting the recommended nurse staffing
guidelines. NHS and Foundation Trusts should
develop a targeted action plan to address neonatal
nurse staffing shortages. In addition to addressing
staffing levels as part of the commissioning process,
solutions may be found by working with NHS
Employers to address recruitment or retention issues
and with Strategic Health Authorities to commission
more neonatal nurse training courses.
Caring for vulnerable babies: the reorganisation of neonatal services in England 11Neonatal services
have been reorganised
PART ONE into networks
1.1 Neonatal care is needed for babies born prematurely 1.4 The review was issued as a consultation document
and for babies who are either ill or have congenital the outcome of which was never published and the
disorders. In 2003 the Department of Health published report’s recommendations, although not mandated,
the results of a Review by an expert working group remain the Department’s key communication on how it
on Neonatal Intensive Care Services which proposed expects neonatal services to be provided. This part of the
the reorganisation of neonatal care into managed report examines the rationale behind the review and the
clinical networks.12 progress networks have made in reorganising neonatal
care. It also compares each network’s mortality rates and
England’s neonatal mortality rates with the rest of the UK
The 2003 Review made the case for the and internationally.
reorganisation of neonatal services
1.2 The Review’s key reason for proposing a The reorganisation of services into
reorganisation was that some mothers and babies
were travelling long distances for their care, often not
managed clinical networks has largely
in a planned way or to their nearest hospital, against been achieved
a backdrop of rising demand. It found that neonatal 1.5 The report from the ‘Neonatal Intensive Care
intensive care was provided in a widely dispersed manner Services Review Group’ recommended that the numbers
across district general hospitals and there was a need for of hospitals in each network would be for local decision,
agreed national standards of care. There was also limited but must reflect local need and geography, and that
capacity in the larger units which provided care for the extra cots should be established across England to meet
most ill babies, lack of national data on outcomes and the increased demand. It suggested that re-structuring
major challenges in nursing recruitment. neonatal services into managed clinical networks and
implementing the other report recommendations might
1.3 The Review considered two options: major save 200 to 300 lives every year and thus impact on the
centralisation of neonatal intensive care and moves to Department’s Public Service Agreement target of reducing
provide care within managed clinical networks. Major the inequality gap in infant mortality rates by at least
centralisation was rejected because neonatal intensive 10 per cent by 2010.13 The Review’s recommendations
care is often needed for some weeks which would impose and performance against them are summarised in
considerable travel and other burdens on families. Figure 2.
The Review therefore recommended the reorganisation
of neonatal care into managed clinical networks so that 1.6 In publishing the report on the 2003 Review,
units in each network would provide virtually all the care the then Minister of State for Health, Jacqui Smith MP,
required by mothers and babies without the need for announced that additional resources would be provided
long-distance transfers. This followed evidence from other to help implement the recommendations of the Review,
countries that networked models of intensive neonatal comprising £20 million for capital expenditure and
care produced the best outcomes for babies. additional running costs of £52 million over three years.f
f Further details are given in Part 4.
12 CARING FOR vuLNERABLE BABIES: THE REORGANISATION OF NEONATAL SERvICES IN ENGLANDpart one
2 Summary of the 2003 Reviews’ recommendations and performance against them
Recommendation Performance
Neonatal services should be structured around geographical networks comprising hospitals with differing Largely achieved.
types of neonatal units working together. The purpose of the network being to ensure that mothers and Paragraphs 1.8 to 1.13.
babies receive the care within it or, very occasionally, in an adjacent network (95 per cent of mothers and
babies should receive their care within their local network).
Within the networks there should be agreed identification of the needs of individual babies (categories of Partly achieved.
care) and agreed designation of the types of units providing for their care (types of neonatal unit). Paragraphs 1.14 to 1.16.
Networks should have agreed protocols, standards and pathways of care and a joined-up approach to Partly achieved.
clinical governance, including clinical audit, incident reporting and clinical training. Networks should also Paragraphs 2.3 to 2.7.
be aligned with obstetric and maternity services.
Transport systems should be put in place to move critically ill babies and also for babies being taken back Partly achieved.
to a unit near their homes. Staffing arrangements for neonatal transport should be separate from inpatient Paragraphs 2.12 to 2.23.
services to avoid compromising care.
Networks should enable the concentration of skills and expertise required for care of babies needing Partly achieved.
longer and more complex care, thereby maximising the overall capacity of the system with skills, expertise Paragraphs 3.2 to 3.9.
and paediatric training in intensive care maintained in all neonatal units. In this way networks would offer
families the greatest opportunity for local birth and minimise transfers for intensive care to those that are
necessary, returning babies to a local hospital as soon as possible.
Networks should adopt the BAPM categories of care and staffing levels1. The designation of each unit in a Partly achieved.
network should drive the activity that they are resourced for and the capacity they develop. Paragraphs 3.10 to 3.25.
Source: National Audit Office
NOTE
1 Standards for Hospitals providing Neonatal Intensive and High Dependency Care, 2nd Edition, British Association of Perinatal Medicine,
December 2001. These are widely accepted as the pre-eminent standards for delivery of care in neonatal units.
1.7 The concept of networking neonatal services has and implemented locally, following local reviews.
near universal support and there is broad agreement that a As a result, the pace of implementation has varied widely
regionalised networked system of care improves outcomes across England.
for neonates. International research highlights the benefits
of a regional system of care, although the evolution of 1.9 The concept of a network is a fluid one, with varying
such systems is related to the extent to which neonatal degrees of budgetary control, authority, stakeholder
intensive care is already centralised.14 representation and scope. The NHS has used the idea of
networks in a range of different services in recent years at
regional and national levels, including establishing cancer
Since 2003 neonatal networks have and emergency care networks.g The 2003 Review did not
developed in different ways set out the accountabilities and performance management
arrangements for neonatal networks, nor did it give
1.8 In response to the 2003 Review, neonatal care in networks formal powers to effect change. Instead networks
England was organised into 24 networks but this has now operate through communication and consensus-building
reduced to 23 with the recent merger of the former Central amongst provider Trusts and commissioning PCTs.
South and Thames Valley networks. Figure 3 overleaf A typical neonatal network comprises a group of neonatal
shows the geographical distribution of the networks. units in a particular region linked by a supervisory
The Department recognised that the implementation of management structure. There is usually one unit capable
the Review’s recommendations would need to be staged of providing the whole range of neonatal care, including
because there was insufficient capacity and skills in all intensive care; the remainder provide special and high
types of units to make immediate progress. Its view dependency care.
was that changes in provision should be decided on
g Previous work by the National Audit Office and other commentators have shown that both the make-up and scale of implementation of the network concept
has varied and that they have not always achieved what was intended.
CARING FOR VULNERABLE BABIES: THE REORGANISATION OF NEONATAL SERVICES IN ENGLAND 13part one
3 Location of networks in England
1 Northern 10 Midlands Central
2 Lancashire & (Central Newborn)
South Cumbria 11 Norfolk, Suffolk
3 Yorkshire & Cambridgeshire
4 Greater Manchester 12 Western
5 North Trent 13 South West Peninsula
1 6 Cheshire & Merseyside 14 Central South Coast
7 Midlands North 15 Bedfordshire &
(Staffordshire, Shropshire Hertfordshire
& Black Country) 16 Essex
8 Trent 17 Surrey & Sussex
3
9 Midlands South 18 Kent & Medway
2 (South West Midlands)
5
4
LONDON
6
8
20
7
21
11 19
10
9 22
23
15
16
12 19 North West London
14 Perinatal Network
18
20 North Central London
17
Neonatal Network
21 North East London and North
13 Middlesex Perinatal Network
22 South East London
Neonatal Network
23 South West London
Neonatal Network
Source: British Association of Perinatal Medicine/National Audit Office
NOTE
Networks are linked groups of health professionals and organisations from primary, secondary and tertiary care working together in a coordinated manner
across organisational boundaries to ensure equitable provision of high quality clinically effective services. The map shows the geographic location of each
network. For the composition of networks, please see Appendix 2.
14 CARING FOR VULNERABLE BABIES: THE REORGANISATION OF NEONATAL SERVICES IN ENGLANDpart one
1.10 The funding for neonatal networks has been used since 1983 and it is undertaking many of the functions
for a range of activities including network manager posts, of a network as envisioned by the Department without a
transport services and education initiatives. They have dedicated staff or board. Using as a proxy the measure of
evolved since 2003 with some shifting of geographical how many babies were transferred out of the network to
boundaries and mergers. There is a strong expectation that receive care in 2006-07, the Northern region performed
others will merge in the future, particularly in London and well with less than one per cent being transferred out
in those areas where revised SHA boundaries no longer (Appendix 3). The Essex network on the other hand has no
conform to network boundaries. At the time of our survey manager and is not functioning as a network due to a lack
21 out of 23 networks had a manager in post, either full of agreement as to which unit should provide intensive
or part-time. All networks had a lead clinician and 12 care and take the lead role in the network. It is also not
had a lead nurse. Six networks had a transport manager, yet meeting the target of treating 95 per cent of babies
three were covered by the East of England Acute Neonatal who need specialist care in the network as six per cent of
Transport Service and seven by the Greater London babies had to be transferred out in 2006-07 (Appendix 3).
Neonatal Transfer Service, see Appendix 2.
1.13 Our census of all neonatal units in England showed
1.11 Networks currently undertake a range of different that 70 per cent of units (n=150) thought that their
roles including: networks were the right size and configuration, with broad
support amongst units for networking neonatal services
n improving clinical governance by developing
despite some local difficulties in re-designating units.
guidelines and clinical audit programmes (17 out
Units did however express various concerns about lack
of 23 networks);
of capacity, rising birth rates, the knock-on effects of the
n providing education and training, particularly for re-configuration of maternity services in some areas, the
neonatal nurses (16 out of 23 networks); lack of surgical provision in some networks and major
n improving standards by developing care pathways concerns about the status of the Essex network.
and benchmarking (16 out of 23 networks);
n advising commissioners on setting standards,
There has been some re-designation of units
monitoring outcomes and agreeing investment but this remains an ongoing process
projects (15 out of 23 networks); and 1.14 Constituent units within each network are
n co-ordinating the provision of services, so that the characterised in terms of the level of care they provide.
network as a whole can safely and effectively meet Figure 4 sets out the characteristics of the three levels of
the needs of its population (21 out of 23 networks). care for newborns and infants, as advised by the BAPM.
Each network should have one or more level 3 units (one
1.12 Two networks have yet to establish formal structures, of which is a lead centre) and also a number of level 2
with differing results. Neonatal care in the Northern and level 1 units (Appendix 2). Figure 5 overleaf shows
network has been delivered in a co-ordinated fashion the total units at each designation and total cots.
4 BAPM Categories of Neonatal Care
Categories of neonatal care
Special care High dependency care Intensive care
For babies requiring continuous For babies receiving nasal continuous For babies needing respiratory support
monitoring of respiration or heart rate; positive airway pressure (CPAP) but not (ventilation); for babies weighing less
for babies receiving added oxygen, fulfilling any of the categories for intensive than 1,000g and/or born at less than
being tube fed, receiving phototherapy or care; any baby below 1,000 gms who 28 weeks’ gestation and receiving nasal
recovering from more specialist care. does not fulfil any of the categories for continuous positive airway pressure
intensive care; babies receiving parental (CPAP); for babies with severe respiratory
The recommended nurse-to-baby
nutrition, with apnoea requiring stimulation. disease or who require major surgery.
ratio is 1:4.
The recommended nurse-to-baby The recommended nurse-to-baby
ratio is 1:2. ratio is 1:1.
Source: British Association of Perinatal Medicine
CARING FOR VULNERABLE BABIES: THE REORGANISATION OF NEONATAL SERVICES IN ENGLAND 15part one
5 Unit designations and numbers Case Example 1
Unit Designation Units1 Cots A key achievement of the Peninsula network has been the
implementation of a re-designation process of its units. Crucial
Level 1
to the acceptance of this process was the establishment of a
Units provide Special Care but do not 38 2,014 fully funded transport service, which would allow the network
aim to provide any continuing High to manage the efficient transfer of mothers and babies to the
Dependency or Intensive Care nearest appropriate unit. The establishment of the transport
service gave neonatal units confidence that a networked system
Level 2 could function effectively, despite the long distances between
Units provide High Dependency Care 89 608 units in Devon and Cornwall.
and some short term Intensive Care After a process of consultation, Derriford Hospital in Plymouth
as agreed within the network was chosen as the lead tertiary care (level 3) centre and
Level 3 the other two major units in the region, Truro and Exeter,
were confirmed as level 2 centres. Each unit in the network
Units provide the whole range of medical 51 750 has agreed transfer guidelines based on gestational age.
neonatal care but not necessarily all If units find themselves looking after babies who breach those
specialist services such as neonatal surgery guidelines, they liaise with the lead centre to determine where
Total 178 3,5212 those babies should be cared for. In addition, the entire network
subscribes to the Vermont-Oxford benchmarking scheme,
Source: British Association of Perinatal Medicine/National Audit allowing for comparisons between units and performance
Office Census management of the network as a whole. The view of the
network staff is that the success of the re-designation process
has led to a considerable improvement in the quality of care.
NoteS
1 The units at each designation are based on the units’ responses to our
census in spring 2007, please see also paragraph 1.14 and Appendix 2.
2 Total cots include 149 additional cots which are un-designated. Babies
1.16 The designation of units is an ongoing process, with
can move very quickly between the three levels of care and will often stay 12 units across nine networks describing their designation
in the same cot while the level of nursing and medical care increases or
as ‘2 plus’, meaning they are officially designated level 2 but
decreases as appropriate. Level 3 cots will predominantly be found in
Level 3 units, Level 2 cots will predominantly be found in Level 2 and 3 often provide intensive care (level 3). Most cited network
units, whilst Level 1 cots will be found in all units. The numbers of cots are guidelines allowing intensive care at certain levels of
based on the responses from 175 out of 178 units.
gestation. In addition, two level 1 units across two networks
described the care they provide as ‘1 plus’. In most cases the
1.15 A key role envisaged for networks was that decision to operate across two levels of designation appears
they would lead work to categorise and, if necessary, to be a pragmatic way to maintain skills and capacity across
re‑designate all units in their region to establish a networks. Whilst there is a risk that units may provide care
service with safe levels of capacity. Networks cannot that they are not staffed or equipped to provide, we found
enforce re‑designation; only Trusts can make the no evidence that this was happening.
decision to change their services. However, with
support from commissioners, networks should be able
to present evidence based on capacity planning and the The objective of reducing mortality
implementation of standards which supports the need rates continues to be a challenge
for change. By June 2007 18 networks had undergone
1.17 The Department’s Public Service Agreement target
or were undergoing a re‑designation process. Vigorous
for infant mortality states: ‘Starting with children under one
local debates over which units should take which roles
year, by 2010 to reduce by at least 10 per cent the gap
have meant that networks are at different stages of the
in mortality between the routine and manual group and
re-designation process. Some units have changed their
the population as a whole.’15 The Department considered
designation but this has not been carried through to the
that implementing the recommendations of the 2003
movement of staff. Case Example 1 illustrates how one
Review might have an impact on the infant mortality gap
network achieved an effective re‑designation process.
through the reduction of deaths due to immaturity-related
conditions. The Department’s 2007 review of the target
showed that, although rates in the routine and manual
group were improving, the gap between the routine and
manual group and the population as a whole had widened
to 18 per cent in 2004-05 from the target baseline in
16 CARING FOR VULNERABLE BABIES: THE REORGANISATION OF NEONATAL SERVICES IN ENGLANDpart one
1997-99 of 13 per cent, a reduction from 19 per cent of deprivation.18 Whilst these roughly correspond with
in 2002-04.16 The Department is planning to publish an the networks that have higher than average mortality
implementation plan to address the infant mortality review’s rates, more detailed work is required to determine the
recommendations shortly, but the target to narrow the gap contribution which different socio-economic, ethnic,
by 10 per cent by 2010 remains challenging. demographic, cultural and service factors are making to
variations in mortality.
1.18 The neonatal period has one of the highest mortality
rates of any period of life. Out of all babies that die 1.21 Comparing the English average of 3.4 for 2004
before their first birthday, two thirds die because they (the last year that comparative data is available) to the
are premature. There is also a correlation between high rest of the UK, England’s mortality rate is below that of
neonatal death rates and lower socio-economic groups. Northern Ireland but above Scotland and Wales. Our
Improvements in neonatal mortality rates could international comparison shows that England’s neonatal
therefore assist the Department in meeting its PSA target. mortality rate is below the USA and Canada but above
We compared England’s neonatal mortality rates with rates Australia and Sweden. When the incidence of low birth
in other countries and at network level in recognition that weight births are taken into account, England performs
at unit level a complex combination of factors affects the well internationally as it has the second highest incidence
mortality rate, requiring sophisticated risk adjustments to after the USA but the third highest neonatal mortality rate.
enable meaningful comparisons to be made.h In addition When compared to Scotland however England performs
units are part of a continuum of care which begins with less well, as Scotland has a higher rate of low birth weight
maternity services, obstetrics and fetal medicine and but a lower neonatal mortality rate. Full details can be
continues with ongoing community and paediatric care. found in the accompanying report by RAND.19
Babies can also be treated in more than one unit.
Mortality data for networks shows some
Other NHS bodies hold data which
unexplained variations and some could help networks evaluate
deteriorating trends over time quality of outcomes
1.19 Neonatal units routinely submit various different types 1.22 The National Patient Safety Agency’s (NPSA)
of mortality data to the Confidential Enquiry into Maternal National Reporting and Learning System holds reports
and Child Health (CEMACH). CEMACH provided us with on patient safety incidents from all NHS trusts. From
network data on stillbirth, perinatal mortality and neonatal 1 April 2006 to 31 March 2007, there were 13,320 patient
mortality rates for 2003, 2004 and 2005.i Overall, the safety incidents reported to the NSPA relating to neonatal
neonatal mortality rate in England went from 3.7 (deaths services. Whilst almost 90 per cent of these incidents
per 1,000 live births) in 2003, to 3.4 in 2004, and to were recorded as ‘no harm’ or ‘low harm’ incidents,
3.5 in 2005. There was variation within these figures by the most frequently reported serious incidents were
network, as Figure 6 overleaf shows. Midlands South those involving medication errors. The NPSA recently
(South West Midlands) had the highest rate of any network, undertook an analysis of a sample of 200 incidents from
reaching 4.8 deaths per 1,000 live births in 2005 and neonatal services which showed that, in addition to
Surrey and Sussex and Essex the lowest rate at 1.8.j medication errors, key problems included a failure to
monitor, staff shortages and extravasations.k The NPSA
1.20 Figure 6 shows that nine networks had mortality has since begun a multi-agency work programme to
rates which were significantly lower than the network develop and implement a neonatal safety ‘package’ with
average and eight networks had mortality rates which the Royal College of Paediatrics and Child Health and
were significantly higher than the network average.17 others such as the Royal College of Nursing, Neonatal
Data from the Index of Multiple Deprivation shows that Nurses Association, BAPM and BLISS (the premature baby
localities in the far north, far west and clustered around charity). This is a two year programme which will focus on
Birmingham and London suffer from the highest levels newborn infection, medication and neonatal transport.
h The Trent Regional Survey has been collecting data for 15 years and has produced risk-adjusted mortality data. For further details see paragraph 2.11.
i For this analysis adjusted data was used, including only those deaths of babies born at 22 or more weeks’ gestation, in order to remove the potential for
distortion where there are high numbers of pre-viable gestation births. There were some caveats with these data – 6 of the 187 units were not included in
the 2005 analysis as denominators were not available. Mortality rates are based on deliveries occurring in major provider units (but do not include smaller
birthing units, unless co-located) within the neonatal network.
j Based on adjusted data, including only babies born at 22 or more weeks’ gestation. The network average shown in figure 6 is therefore not the same as the
England neonatal mortality rate which includes all neonatal deaths. Office of National Statistics, Series DH3 no. 38 Mortality Statistics, Childhood, Infant and
Perinatal 2005 also gives neonatal mortality data by Government Office Regions which are similar in size to but do not map across to neonatal networks.
k Extravasation, or infiltration, occurs when fluids or medications penetrate into the tissues surrounding an intravenous site following damage to the vessel
endothelium.
CARING FOR VULNERABLE BABIES: THE REORGANISATION OF NEONATAL SERVICES IN ENGLAND 17part one
6 Network neonatal mortality rates (for babies born at 22 or more weeks’ gestation), 2005
Neonatal death rates for babies born at 22 or more weeks’ gestation per 1,000 live births, 2005, by network
6
Networks whose neonatal mortality rates
were significantly different from the average
5
4
Network average 3.0
3
2
1
0
ex
am ord x
tra idg re
Ke uth re
th & M ast
t P way
or W la
n
ex
a
es on
N lley
re No ern
nt
l L er
n
n
& ork t
er ire
& est ide
C on
t M try)
s)
ut h C rn)
n
e
do
do
M ster
es bri
nd
or r M Tre
e
su
i
hi
st
ss
s
es
am nd
d
sh
sh
o
o
Tr
ire W eys
th
n
Es
Va
en che
l S es
on
n
ac Lon
in
b
um
C
la
Su
d
ou
dl
e
or
Th t Lo
Lo
So ew
rth
e
en
id
id
s
an
&
Y
st
tf
N
So tra
r
M
k
er
Ea
o
y
b
W
t
es
rre
re ral
h
u
es
H
t
t
n
W
h
Bl
e
W
t
C
Su
h
sh th
&
ut
en
at
ire
C
N
op or
&
en
th
re
th
nc l (C
So
&
sh
N
ou
&
hi
G
ou
C
lk
he
ds
N
nd don
hi
S
tra
(S
ffo
C
as
or
en
Su
th
on
df
hr
ou
sC
Be
tL
La
lk,
,S
sS
s
fo
Ea
ire
nd
or
la
sh
th
N
id
la
or
rd
M
id
N
ffo
M
ta
(S
th
or
sN
nd
la
id
M
Source: Confidential Enquiry into Maternal and Child Health
NOTE
The figure illustrates what is happening at a network level and it is the first time that individual networks’ mortality rates have been presented in a public
document. CEMACH is planning to undertake more sophisticated analysis of the 2006 data and their findings will be published in early 2008.
18 CARING FOR VULNERABLE BABIES: THE REORGANISATION OF NEONATAL SERVICES IN ENGLANDpart one
1.23 The Medicines and Healthcare Products Regulation
Agency receives reports on medication errors. A review of
these reports shows that they received four reports linked to
neonatal care in 2006. Whilst their data cannot be used as
a reliable indicator of the frequency of suspected adverse
drug reactions due to a general level of under‑reporting,
these can alert the NHS to important concerns.
1.24 The NHS Litigation Authority is also a valuable
source of information on incidents that resulted in a claim.
Their database shows more than 180 claims logged with
a location code of ‘Neonatal Intensive Care Unit’ since
1995.l Of these, almost half (85) are now closed with no
damages being awarded, 20 per cent (40) have closed
with total payments of approximately £5.5 million and
almost a third (50) are still open. Currently, unlike its work
on maternity services, the Litigation Authority does not
carry out any specific risk assessment of neonatal units.
1.25 Similarly, to date, there has not been any formal
review or inspection of neonatal units by the Healthcare
Commission. However they have commissioned a
National Neonatal Audit Programme from the Royal
College of Paediatric and Child Health which is expected
to report in early 2008 (paragraph 2.11 refers). Except for
some reviews undertaken by regional associations such
as the Thames Regional Perinatal Group and independent
surveys by the National Perinatal Epidemiology Unit
(NPEU), commissioned by BLISS, there are no other
national inspections or audits of neonatal services.
1.26 Our report, therefore, is the first independent
assessment of progress in improving neonatal services
since the establishment of networks. The rest of the report
covers the following areas:
n Part 2. Progress made by networks in relation to the
2003 recommendations;
n Part 3: What more needs to be done to address
capacity and staffing issues; and
n Part 4: Financial management and funding and
how commissioning can use these levers to further
improve services.
l The database was designed primarily as a claims management tool rather than for risk management or research purposes, it therefore cannot be guaranteed
to be 100 per cent consistent or that all the incidents giving rise to these claims did in fact occur within the neonatal intensive care unit or that all such
incidents have been included in the data. In addition, before April 2002 Trusts were responsible for the management and cost of claims below their Clinical
Negligence Scheme for Trusts excess. Although some of these claims were notified to the NHSLA for recording purposes, information on these claims is not
included in these figures.
CARING FOR VULNERABLE BABIES: THE REORGANISATION OF NEONATAL SERVICES IN ENGLAND 19Networks have
made progress in
improving consistency,
communication
and coordination of
PART TWO neonatal services
2.1 The 2003 Review suggested a more structured, 2.4 More sophisticated protocols have also been
collaborative approach to caring for newborn babies. introduced in some networks, under which all consultants
It recommended that networks should have agreed agree to use the same kinds of treatments for specific
protocols, standards and pathways of care as part of a conditions or follow common policies for planning
joined up approach to clinical governance. A key priority in-utero transfers. A good example of how network
was that families should be engaged in and involved with protocols can influence behaviour for the benefit of babies
the care provided. Furthermore, it recommended that comes from the Midlands South (South West Midlands)
neonatal networks should develop IT infrastructures and network. All obstetricians in this network have signed
datasets to support the audit of activity and outcomes. up to pre-term labour guidelines which set out how
premature babies’ care will be managed in the first hour of
2.2 Central to the recommendations was the need life. The use of protocols means that care is delivered more
for specialist transport services for the movement of consistently on the basis of evidence and good practice
critically ill babies and also for babies being taken back and that parents are reassured to see the same things
to a unit near their homes. Furthermore, the Review happening to their baby upon transfer to another unit.
also recommended that staffing arrangements for these
transport systems should be separate from inpatient 2.5 Another way that networks have helped to influence
services to avoid compromising care. This part of the and improve clinical practice is by organising clinical
report evaluates the progress that has been made in audits and benchmarking exercises. The vast majority
implementing these recommendations. of units surveyed, 94 per cent (n=152), participated in
network benchmarking exercises to compare clinical
practices and all ten SHAs undertook audits.
Networks have made progress in
agreeing protocols and standards to 2.6 Virtually all networks have established a series of
medical working groups to discuss particular aspects
improve consistency of services of their service. These groups discuss a wide range of
2.3 One success achieved by many networks is the subjects including education and training, transport,
widespread implementation of network-wide protocols. nursing, parental involvement and incidents. They also
These protocols represent agreement, usually between enable best practice to be disseminated, protocols to be
clinicians, that they will undertake an operational or formulated and relationships to be formed between staff
clinical activity in a common way across the network. from different units, thereby leading to stronger clinical
Many networks have protocols setting out the kind of case governance and more collegiate behaviour.
mix a named unit is able to undertake. These are usually
based on gestational age and capacity and are becoming a 2.7 Networks are also beginning to develop a distinct
strong element of clinical governance within the networks, training and education role. Ten out of 23 networks cited
since they set a standard for determining which babies training as being part of the main operational role of the
will be treated where. network and half of the ten SHAs mentioned this as an
activity undertaken by their networks. In addition, the Royal
College of Nursing highlighted the employment of practice/
clinical educators by networks and units as good practice.
These educators have proved to be successful in addressing
the initial training needs of new and newly-qualified staff,
as well as the maintenance of skills of existing staff.
20 CARING FOR vuLNERABLE BABIES: THE REORGANISATION OF NEONATAL SERvICES IN ENGLANDYou can also read