BUDGET 2020 - 2021 #BRCBUDGET20 - BUNDABERG REGIONAL COUNCIL
←
→
Page content transcription
If your browser does not render page correctly, please read the page content below
Budget
2020 - 2021
#BRCbudget20
Building Australia’s
best regional community

This page was intentionally left blank
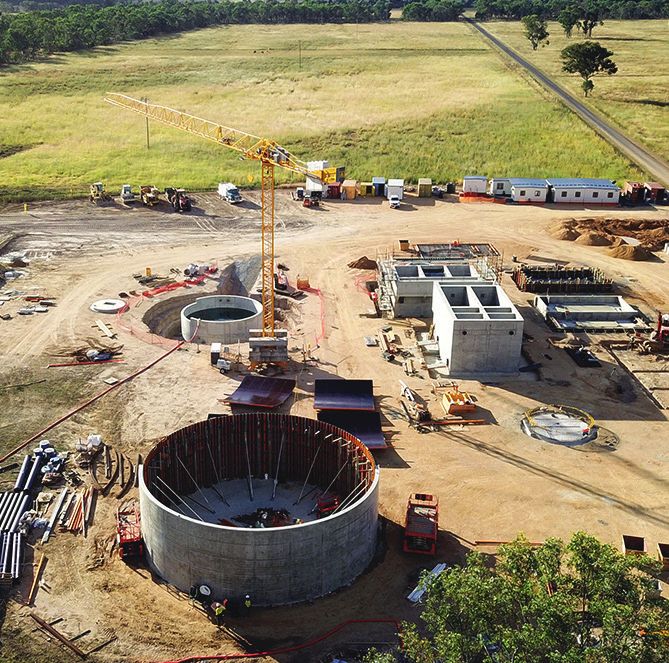
Table of Contents

Mayor’s message........................................................................................................           1

Budget statements......................................................................................................           2

10 year capital investment summary...........................................................................                    11

Investment policy.........................................................................................................       12

Revenue policy............................................................................................................       14

Revenue statement.....................................................................................................           16

Debt policy...................................................................................................................   38

Long term financial plan 2021 - 2030..........................................................................                   40

Operational Plan 2020 - 2021....................................................................................                 63
Budget
2020-2021
             $1.3 million                     $2.4 million
             Gin Gin streetscape              in pathways
             and library                      adding more than 15km
             upgrade, providing better        to the existing network
             facilities for the community

             $20.3 million                    $26.6 million
             investment in water              on roads
             improving water quality and      improving our region’s
             security for the region          road network

             $1.7 million                     $4.6 million
             in drainage                      in parks and open spaces
             improvements addressing          delivering upgrades and
             stormwater and drainage issues   management of 2600 hectares of
                                              community spaces in the region

             $4.4 million                     $4.8 million
             in wastewater                    in pools, sport and recreation
             treatment, ensuring              providing more opportunities for our
             healthy water systems            residents to enjoy an active lifestyle

              $91 million                     $200 million
              capital budget                  operating budget

Follow #BRCbudget20 to stay informed
about projects and initiatives across the
Bundaberg Regional Council area

Building Australia’s
best regional community
This outcome has been achieved
                                          because Council prudently set aside           • Gin Gin streetscape $800,000
                                          funds in the past to meet challenges            (completion of project)
                                          exactly like this.                            • Settlement Road sealing
                                          They say to keep some money for                 $970,742
                                          a rainy day. We had that experience           • Coonarr Beach Road sealing
                                          quite literally in 2010-11 and 2013             $640,000
                                          with major floods and now we’ve had           In 2021-22 we’re planning

Mayor’s                                   the pandemic.
                                          I’m proud that we retained essential
                                          services and all our staff during the
                                                                                        initiatives such as:
                                                                                        • Dog off-leash park $137,000
                                                                                        • Burnett Heads Holiday Park

message                                   lockdown. We’re now progressively
                                          getting back to normal business as
                                          restrictions are slowly eased.
                                                                                          amenities block upgrade
                                                                                          $800,000
                                                                                        • Childers Swimming Pool baby pool
                                          I’d like to acknowledge the State               upgrade $170,000
                                          Government for their support                  • Moore Park Beach Holiday Park
In presenting this 2020-21 Council                                                        upgrades $2.1 million
Budget to the community, I wish           through COVID Works For
to acknowledge the efforts of staff       Queensland $7.1 million and the               • New shade structure program
                                          Federal Government for $2.1 million             $630,000
and Councillors in constructing a
responsible budget for difficult times.   in roads funding.
                                                                                         In March I announced a relief
COVID-19 had a significant impact on      These grants have enabled us to
                                                                                         package to assist residents,
Council operations and finances.          undertake works that improve
                                                                                         businesses and organisations
                                          community infrastructure and create
Despite this, we’re providing relief to                                                  adversely impacted by the
                                          employment.
struggling households through a no                                                       coronavirus lockdown. These
pricing path increase in general rates                                                   measures included:
and a stimulus to kickstart our local       Some of our capital projects                • $200,000 in community
economy.                                    in 2020-21 include:                           sporting grants
There’s an $83 million capital works        • Gregory River water treatment             • $235,000 to extend all dog
program to create jobs and improve            plant $12.6 million (finish of              registrations by six months.
infrastructure.                               $18 million project)                      • $130,000 to extend licences
There’s support for the construction        • Back Windermere Road                        and permits for regulated
                                              $2.6 million                                premises by six months.
industry to power the engine of
economic recovery.                          • Bundaberg Recreation Precinct             • $50,000 to extend licences
                                              $3.32 million                               and permits for food premises
There’s a helping hand for sporting                                                       by six months.
organisations to get back on their          • Branyan Dr/Avoca Rd/Dittman Rd
                                              traffic lights and upgrade $1.28          • $225,000 to provide continuing
feet.
                                              million                                     rent relief from July - September
Earlier this year I said we faced                                                         2020 for Council owned
challenges to defeat an invisible           • One Mile Creek Monduran Rd
                                                                                          commercial tourism and retail
enemy. We’ve taken a few hits and             bridge replacement $1.24 million
                                                                                          shop leases.
the war isn’t over, but we’re holding       • Hamanns Road, Apple Tree Creek,
                                                                                        • $500,000 to extend trade waste
our ground.                                   crossing upgrade $1.285 million
                                                                                          licencing by six months.
This war is expensive. Council has          • Batchlers Road, Gooburrum,
received $2.8 million less revenue            upgrade $850,000
than expected due to fewer flights          • Elliott Heads Holiday Park              Today I’m pleased to announce a
into Bundaberg Airport and the                upgrades $620,000                       multi-million stimulus package for
closure of holiday parks and venues         • Moncrieff auditorium lights             the construction industry called
such as the Moncrieff Entertainment           $316,860                                Building Bundaberg Region.
Centre and the Multiplex.                   • Gin Gin Youth Centre car park           It delivers a range of fee waivers and
We’re forecasting a $5.26 million             $274,000                                incentives to encourage development
deficit next year after achieving an        • Elliott Heads recreational facilities   including permanent reductions to
expected surplus of $500,000 this             $569,840                                infrastructure charges for sectors
year.                                       • Boreham Park upgrade $899,784           including rural industries and nature-
I can assure the community that             • Gooburrum Road upgrade                  based tourism.
although we’ve had to pull out the            $317,000                                Once again, I thank everyone who
credit card for one-off bills, we’re        • Kepnock Road widen and seal             had input to this responsible budget
going to pay it all back without              $485,000                                for difficult times. By working
increasing overall debt.                    • Burrum Street pathway,                  together, we help to build Australia’s
Unless there’s a second wave,                 Crofton St to Walker St $580,000        best regional community.
Council will return to a balanced           • Faldt Street, Norville, pathway
budget in 2021-22 with no increase            $600,000                                Jack Dempsey
in loans.                                                                             Mayor, Bundaberg Regional Council

                                                                                             2020 - 2021 Budget and Operational Plan   1
Budget
    Statements

2   Bundaberg Regional Council
BUNDABERG REGIONAL COUNCIL
Budgeted Statement of Income and
Expenditure Council General Waste Management Wastewater Water
Estimated Original
For the period ending 30 June 2021 Forecast Forecast Orignal Budget Forecast Forecast Orignal Budget Forecast Forecast Orignal Budget Forecast Forecast Orignal Budget Forecast Forecast
Actuals Budget
2019/20 2020/21 2021/22 2022/23 2020/21 2021/22 2022/23 2020/21 2021/22 2022/23 2020/21 2021/22 2022/23 2020/21 2021/22 2022/23
$ $ $ $ $ $ $ $ $ $ $ $ $ $ $ $
Operating Income
Rates and utility charges* 160,684,986 158,077,593 162,351,894 166,370,026 83,461,322 85,908,216 88,428,487 15,702,071 16,096,193 16,500,207 30,236,858 31,526,756 32,476,500 28,677,342 28,820,729 28,964,832
Less: Discounts and pensioner remissions (9,048,950) (1,713,674) (1,722,242) (1,730,854) (1,042,901) (1,048,116) (1,053,356) (228,169) (229,310) (230,456) (255,237) (256,513) (257,796) (187,367) (188,304) (189,245)
Net rates and utility charges 151,636,036 156,363,919 160,629,652 164,639,173 82,418,421 84,860,101 87,375,131 15,473,902 15,866,883 16,269,751 29,981,621 31,270,243 32,218,704 28,489,975 28,632,425 28,775,587
Fees and charges 22,028,839 18,075,333 22,048,930 22,713,154 11,565,369 15,342,853 15,805,056 5,454,564 5,618,883 5,788,152 435,000 448,104 461,604 620,400 639,090 658,342
Interest 3,657,456 2,255,970 2,326,398 2,337,721 785,338 875,626 882,300 374,465 386,954 383,145 394,114 406,666 438,908 702,053 657,151 633,368
Sales, contract and recoverable works 5,916,152 5,501,170 5,632,615 5,767,201 3,502,400 3,586,086 3,671,772 516,570 528,913 541,551 482,000 493,517 505,309 1,000,200 1,024,099 1,048,569
Grants and subsidies 13,411,877 11,916,757 12,131,259 12,349,621 11,916,757 12,131,259 12,349,621 - - - - - - - - -
Donations and other contributions 445,099 261,000 265,698 270,481 101,000 102,818 104,669 160,000 162,880 165,812 - - - - - -
Profit on sale of developed land held for resale - - 150,000 150,000 - 150,000 150,000 - - - - - - - - -
TOTAL OPERATING REVENUE 197,095,459 194,374,149 203,184,551 208,227,349 110,289,285 117,048,743 120,338,549 21,979,501 22,564,513 23,148,410 31,292,735 32,618,531 33,624,524 30,812,628 30,952,765 31,115,866
Operating Expenditure
Employee benefits, materials and services (142,905,122) (144,095,554) (146,173,692) (149,514,717) (98,983,127) (99,778,862) (101,874,223) (18,112,357) (18,450,876) (18,802,905) (12,652,114) (12,708,457) (12,896,368) (14,347,956) (15,235,497) (15,941,222)
Finance costs (4,433,076) (4,291,551) (4,004,088) (4,272,277) (1,531,258) (1,403,062) (1,809,856) (901,259) (857,518) (815,329) (1,608,563) (1,511,576) (1,423,567) (250,471) (231,932) (223,525)
Depreciation (49,209,537) (51,245,440) (52,266,325) (53,818,250) (36,770,997) (37,419,824) (38,560,741) (1,621,162) (1,629,771) (1,651,072) (6,658,033) (6,776,815) (6,962,981) (6,195,248) (6,439,915) (6,643,456)
TOTAL OPERATING EXPENDITURE (196,547,735) (199,632,545) (202,444,105) (207,605,243) (137,285,382) (138,601,747) (142,244,820) (20,634,778) (20,938,165) (21,269,305) (20,918,710) (20,996,848) (21,282,915) (20,793,675) (21,907,345) (22,808,202)
Estimated Costs of Significant Business and
Commercial Business Activities
Community service obligations - - - - (2,276,221) (2,311,270) (2,344,156) 698,339 715,205 729,433 800,015 817,261 834,978 777,867 778,804 779,745
Competitive neutrality adjustments - - - - 251,664 222,815 252,146 (153,562) (150,832) (166,199) (162,497) (143,143) (143,578) 64,395 71,160 57,631
Internal tax equivalents paid - - - - 7,145,209 7,301,876 7,331,959 (566,850) (599,061) (623,982) (3,331,284) (3,569,974) (3,710,079) (3,247,075) (3,132,841) (2,997,898)
Return on capital - - - - 10,706,079 10,841,859 10,829,050 - - - (5,376,181) (6,108,079) (6,526,051) (5,329,898) (4,733,780) (4,302,999)
- - - - 15,826,731 16,055,280 16,068,999 (22,073) (34,688) (60,748) (8,069,947) (9,003,935) (9,544,730) (7,734,711) (7,016,657) (6,463,521)
Operating surplus/(deficit) 547,724 (5,258,396) 740,446 622,106 (11,169,366) (5,497,725) (5,837,272) 1,322,650 1,591,659 1,818,357 2,304,078 2,617,748 2,796,879 2,284,242 2,028,763 1,844,142
Capital Activities
Grants and subsidies 22,965,698 20,315,774 12,918,969 23,380,095 20,315,774 12,918,969 23,380,095 - - - - - - - - -
Contributions from developers 10,850,000 9,412,500 9,412,500 9,412,500 6,112,500 6,112,500 6,112,500 - - - 2,150,000 2,150,000 2,150,000 1,150,000 1,150,000 1,150,000
Other capital income 105,905 136,527 145,162 147,891 136,527 145,162 147,891 - - - - - - - - -
Capital expenses - (7,648,577) (7,704,011) (7,767,118) (6,141,408) (6,170,618) (6,207,044) - - - (745,419) (758,389) (771,585) (761,750) (775,004) (788,490)
TOTAL CAPITAL ACTIVITIES 33,921,603 22,216,225 14,772,619 25,173,368 20,423,393 13,006,013 23,433,442 - - - 1,404,582 1,391,611 1,378,415 388,250 374,996 361,510
Net result 34,469,327 16,957,828 15,513,065 25,795,474 9,254,027 7,508,288 17,596,170 1,322,650 1,591,659 1,818,357 3,708,660 4,009,359 4,175,294 2,672,492 2,403,758 2,205,653
*Change in Total Rates and Utility Charges Levied 3.09%
2020 - 2021 Budget and Operational Plan
3BUNDABERG REGIONAL COUNCIL
Budgeted Statement of Financial Position
Estimated
For the period ending 30 June 2021 Original Budget Forecast Forecast
Actuals
2019/20 2020/21 2021/22 2022/23
$ $ $ $
Current Assets
Cash and cash equivalents 111,433,879 89,336,321 66,779,001 58,223,676
Trade and other receivables 15,855,574 15,790,535 16,496,561 16,910,106
Inventories 6,173,928 6,173,928 6,123,928 6,073,928
Non-current assets held for sale 1,942,834 971,417 - -
135,406,215 112,272,202 89,399,490 81,207,710
Non-Current Assets
Investment property 7,584,851 7,721,379 7,866,541 8,014,432
Property, plant and equipment 2,204,244,890 2,253,718,488 2,327,930,142 2,402,512,319
Intangible assets 6,352,659 6,057,405 5,762,152 5,466,898
2,218,182,401 2,267,497,272 2,341,558,834 2,415,993,649
TOTAL ASSETS 2,353,588,616 2,379,769,474 2,430,958,324 2,497,201,360
Current Liabilities
Trade and other payables 11,746,321 11,877,991 12,049,418 12,324,655
Borrowings 7,489,118 6,541,817 7,573,389 8,570,146
Provisions 12,389,143 12,389,143 12,389,143 12,389,143
Unearned revenue 3,805,876 673,662 673,662 673,662
35,430,458 31,482,612 32,685,612 33,957,607
Non-Current Liabilities
Borrowings 70,058,336 63,495,837 77,669,518 95,066,146
Provisions 19,397,219 19,422,907 19,138,595 19,388,595
89,455,555 82,918,744 96,808,113 114,454,741
TOTAL LIABILITIES 124,886,013 114,401,356 129,493,725 148,412,348
NET COMMUNITY ASSETS 2,228,702,602 2,265,368,118 2,301,464,599 2,348,789,012
Community Equity
Asset revaluation surplus 546,124,994 565,832,680 586,416,096 607,945,036
Retained surplus 1,682,577,609 1,699,535,437 1,715,048,503 1,740,843,976
TOTAL COMMUNITY EQUITY 2,228,702,602 2,265,368,118 2,301,464,599 2,348,789,012
4 Bundaberg Regional CouncilBUNDABERG REGIONAL COUNCIL
Budgeted Statement of Cash Flow
Estimated
For the period ending 30 June 2021 Original Budget Forecast Forecast
Actuals
2019/20 2020/21 2021/22 2022/23
$ $ $ $
Cash Flows from Operating Activities
Receipts from customers 177,630,080 179,860,423 187,485,814 192,585,180
Payments to suppliers and employees (150,963,982) (148,040,411) (147,264,137) (149,974,736)
26,666,098 31,820,012 40,221,677 42,610,444
Recurrent grants, subsidies, contributions and donations 14,515,505 12,187,795 12,378,940 12,601,761
Interest received 3,657,456 2,255,970 2,320,122 2,304,959
Proceeds from sale of developed land held for resale - - 200,000 200,000
Borrowing costs (3,403,076) (3,186,551) (2,882,878) (3,115,117)
Net Cash Inflow/(Outflow) from Operating Activities 41,435,983 43,077,226 52,237,861 54,602,047
Cash Flow from Investing Activities :
Proceeds from sale of property, plant and equipment 900,000 1,093,000 1,100,000 1,100,000
Proceeds from sale of non-current assets held for sale - 971,417 971,417 -
Capital grants, subsidies, contributions and donations 25,921,603 23,028,274 15,631,469 26,092,595
Payments for property, plant and equipment (103,713,915) (82,757,674) (107,703,321) (108,743,352)
Payments for intangible assets (595,444) - - -
Net Cash Inflow/(Outflow) from Investing Activities (77,487,756) (57,664,983) (90,000,435) (81,550,757)
Cash Flow from Financing Activities :
Proceeds from borrowings 7,500,000 - 21,700,000 25,900,000
Repayment of borrowings (7,292,658) (7,509,801) (6,494,746) (7,506,615)
Net Cash Inflow/(Outflow) from Financing Activities 207,342 (7,509,801) 15,205,254 18,393,385
Net Increase/(Decrease) in Cash Held (35,844,430) (22,097,557) (22,557,320) (8,555,325)
Cash at beginning of reporting period 147,278,309 111,433,879 89,336,321 66,779,001
Cash at end of Reporting Period 111,433,879 89,336,321 66,779,001 58,223,676
2020 - 2021 Budget and Operational Plan 5BUNDABERG REGIONAL COUNCIL
Budgeted Statement of Changes in Equity
Estimated
For the period ending 30 June 2021 Original Budget Forecast Forecast
Actuals
2019/20 2020/21 2021/22 2022/23
$ $ $ $
Opening Balance - Retained Surplus 1,648,108,282 1,682,577,609 1,699,535,437 1,715,048,502
Net result 34,469,327 16,957,828 15,513,065 25,795,474
Closing Balance - Retained Surplus 1,682,577,609 1,699,535,437 1,715,048,502 1,740,843,976
Opening Balance - Asset Revaluation Surplus 514,957,398 546,124,994 565,832,680 586,416,096
Increase in asset revaluation surplus 31,167,596 19,707,687 20,583,416 21,528,939
Closing Balance - Asset Revaluation Surplus 546,124,994 565,832,680 586,416,096 607,945,036
Total Community Equity 2,228,702,602 2,265,368,117 2,301,464,599 2,348,789,012
6 Bundaberg Regional CouncilBUNDABERG REGIONAL COUNCIL
Long-Term Financial Forecast
Income and Expenditure
For the period ending 30 June 2021
2020/21 2021/22 2022/23 2023/24 2024/25 2025/26 2026/27 2027/28 2028/29 2029/30
$ $ $ $ $ $ $ $ $ $
Operating Income
Rates and utility charges 158,077,593 162,351,894 166,370,026 171,085,408 175,936,766 180,928,051 186,063,329 191,346,784 196,782,725 202,375,583
Less: Discounts & pensioner remissions (1,713,674) (1,722,242) (1,730,854) (1,739,508) (1,748,205) (1,756,946) (1,765,731) (1,774,560) (1,783,433) (1,792,350)
Net rates and utility charges 156,363,919 160,629,652 164,639,173 169,345,900 174,188,561 179,171,105 184,297,598 189,572,225 194,999,292 200,583,233
Fees and charges 18,075,333 22,048,930 22,713,154 23,397,387 24,102,234 24,828,313 25,576,266 26,346,751 27,140,447 27,958,053
Interest 2,255,970 2,320,122 2,304,959 2,355,080 2,598,208 3,127,536 3,939,835 5,088,288 6,096,328 7,430,812
Sales, contract and recoverable works 5,501,170 5,632,615 5,767,201 5,905,002 6,046,096 6,190,562 6,338,479 6,489,931 6,645,001 6,803,777
Grants and subsidies 11,916,757 12,131,259 12,349,621 12,571,914 12,798,209 13,028,577 13,263,091 13,501,827 13,744,860 13,992,267
Donations and other contributions 261,000 265,698 270,481 275,349 280,306 285,351 290,487 295,716 301,039 306,458
Profit on sale of developed land held for
resale - 150,000 150,000 350,000 150,000 150,000 350,000 150,000 150,000 350,000
TOTAL OPERATING REVENUE 194,374,149 203,178,275 208,194,588 214,200,633 220,163,613 226,781,444 234,055,757 241,444,737 249,076,967 257,424,600
Operating Expenditure
Employee benefits, materials and services (144,095,554) (146,173,692) (149,514,717) (153,838,794) (158,058,321) (163,120,254) (169,977,935) (175,487,529) (180,832,511) (188,819,490)
Finance costs (4,291,551) (3,997,812) (4,239,515) (4,667,679) (4,810,771) (4,769,061) (5,018,203) (5,219,286) (5,292,579) (5,780,376)
Depreciation (51,245,440) (52,266,325) (53,818,250) (55,463,503) (57,002,208) (57,791,053) (58,923,607) (60,076,895) (61,361,049) (62,202,482)
TOTAL OPERATING EXPENDITURE (199,632,545) (202,437,829) (207,572,482) (213,969,977) (219,871,300) (225,680,367) (233,919,744) (240,783,710) (247,486,140) (256,802,349)
Operating surplus/(deficit) (5,258,396) 740,446 622,106 230,656 292,312 1,101,076 136,012 661,028 1,590,828 622,251
Capital Activities
Grants and subsidies 20,315,774 12,918,969 23,380,095 11,350,000 11,200,000 15,100,000 10,100,000 5,100,000 2,600,000 5,100,000
Contributions from developers 9,412,500 9,412,500 9,412,500 9,412,500 9,412,500 9,412,500 9,412,500 9,412,500 9,412,500 9,412,500
Other capital income 136,527 145,162 147,891 150,671 153,504 156,390 159,330 162,325 165,377 168,486
Capital expenses (7,648,577) (7,704,011) (7,767,118) (8,330,906) (8,395,384) (8,460,562) (8,526,450) (8,593,057) (8,660,393) (8,728,469)
TOTAL CAPITAL ACTIVITIES 22,216,225 14,772,619 25,173,368 12,582,265 12,370,620 16,208,328 11,145,380 6,081,769 3,517,484 5,952,517
Net result 16,957,829 15,513,065 25,795,474 12,812,922 12,662,932 17,309,404 11,281,393 6,742,796 5,108,311 6,574,768
2020 - 2021 Budget and Operational Plan
78
BUNDABERG REGIONAL COUNCIL
Long-Term Financial Forecast
Assets, Liabilities and Equity
For the period ending 30 June 2021
2020/21 2021/22 2022/23 2023/24 2024/25 2025/26 2026/27 2027/28 2028/29 2029/30
$ $ $ $ $ $ $ $ $ $
Bundaberg Regional Council
Current Assets
Cash and cash equivalents 89,336,321 66,779,001 58,223,676 36,161,752 45,734,271 54,555,752 67,990,010 86,626,721 99,029,704 114,731,027
Trade and other receivables 15,790,535 16,496,561 16,910,106 17,335,701 17,869,759 18,370,184 18,884,870 19,361,184 19,958,683 20,518,667
Inventories 6,173,928 6,123,928 6,073,928 5,923,928 5,873,928 5,823,928 5,673,928 5,623,928 5,573,928 5,423,928
Non-current assets held for sale 971,417 - - - - - - - - -
112,272,202 89,399,490 81,207,710 59,421,381 69,477,958 78,749,864 92,548,808 111,611,833 124,562,314 140,673,622
Non-Current Assets
Investment property 7,721,379 7,866,541 8,014,432 8,165,103 8,318,607 8,474,997 8,634,327 8,796,652 8,962,029 9,130,515
Property, plant and equipment 2,253,718,488 2,327,930,142 2,402,512,319 2,466,986,148 2,491,249,232 2,524,513,035 2,545,255,233 2,554,534,770 2,578,893,409 2,597,140,715
Intangible assets 6,057,405 5,762,152 5,466,898 5,171,645 4,876,391 4,841,698 4,841,698 7,341,698 7,091,698 6,841,698
2,267,497,272 2,341,558,834 2,415,993,649 2,480,322,896 2,504,444,230 2,537,829,729 2,558,731,258 2,570,673,120 2,594,947,136 2,613,112,928
TOTAL ASSETS 2,379,769,474 2,430,958,324 2,497,201,360 2,539,744,277 2,573,922,189 2,616,579,593 2,651,280,065 2,682,284,953 2,719,509,450 2,753,786,550
Current Liabilities
Trade and other payables 11,877,991 12,049,418 12,324,655 12,646,056 13,028,169 13,444,885 14,009,210 14,423,229 14,902,762 15,559,943
Borrowings 6,541,817 7,573,389 8,570,146 7,751,753 7,146,713 7,293,603 7,327,487 7,745,369 8,429,840 8,889,597
Provisions 12,389,143 12,389,143 12,389,143 12,389,143 12,389,143 12,389,143 12,389,143 12,389,143 12,389,143 12,389,143
Unearned revenue 673,662 673,662 673,662 673,662 673,662 673,662 673,662 673,662 673,662 673,662
31,482,612 32,685,612 33,957,607 33,460,614 33,237,687 33,801,294 34,399,502 35,231,403 36,395,408 37,512,345
Non-Current Liabilities
Borrowings 63,495,837 77,669,518 95,066,146 102,609,942 100,981,901 104,730,131 106,440,540 104,220,570 108,856,053 108,562,895
Provisions 19,422,907 19,138,595 19,388,595 19,638,595 19,888,595 16,999,937 13,451,872 13,926,872 14,401,872 14,801,872
82,918,744 96,808,113 114,454,741 122,248,537 120,870,496 121,730,068 119,892,412 118,147,442 123,257,925 123,364,767
TOTAL LIABILITIES 114,401,356 129,493,725 148,412,348 155,709,150 154,108,184 155,531,362 154,291,914 153,378,845 159,653,332 160,877,112
NET COMMUNITY ASSETS 2,265,368,118 2,301,464,599 2,348,789,012 2,384,035,126 2,419,814,005 2,461,048,231 2,496,988,151 2,528,906,108 2,559,856,118 2,592,909,438
Community Equity
Asset revaluation surplus 565,832,680 586,416,096 607,945,036 630,378,228 653,494,175 677,418,997 702,077,524 727,252,684 753,094,383 779,572,935
Retained surplus 1,699,535,437 1,715,048,503 1,740,843,976 1,753,656,898 1,766,319,831 1,783,629,235 1,794,910,628 1,801,653,424 1,806,761,735 1,813,336,503
TOTAL COMMUNITY EQUITY 2,265,368,118 2,301,464,599 2,348,789,012 2,384,035,126 2,419,814,005 2,461,048,231 2,496,988,151 2,528,906,108 2,559,856,118 2,592,909,438BUNDABERG REGIONAL COUNCIL
Financial Sustainability Ratios
For the period ending 30 June 2021 Target
2020/21 2021/22 2022/23 2023/24 2024/25 2025/26 2026/27 2027/28 2028/29 2029/30
Net Financial Liabilities Ratio < 60% 1.1% 19.7% 32.3% 45.0% 38.4% 33.9% 26.4% 17.3% 14.1% 7.8%
Total liabilities less current assets divided by operating revenue
Operating Surplus Ratio 0% -10% -2.7% 0.4% 0.3% 0.1% 0.1% 0.5% 0.1% 0.3% 0.6% 0.2%
Operating surplus divided by total operating revenue
Asset Sustainability Ratio > 90% 53.1% 40.9% 56.0% 54.9% 42.1% 53.7% 45.3% 51.2% 50.2% 50.5%
Capital expenditure on replacement assets divided by depreciation expense
2020 - 2021 Budget and Operational Plan
910
BUNDABERG REGIONAL COUNCIL
Estimated Activity Statement
Waste Council's Bundaberg
For the period ending 30 June 2021 Water Wastewater
Management Holiday Parks Airport
2020/21 2020/21 2020/21 2020/21 2020/21
$ $ $ $ $
Bundaberg Regional Council
Estimated revenue payable to Council 1,787,542 495,834 295,669 - -
Estimated revenue payable to external clients 28,285,400 30,495,524 21,309,367 2,315,116 3,152,810
Community service obligations 777,867 800,015 698,339 - -
30,850,809 31,791,373 22,303,375 2,315,116 3,152,810
Less: Estimated expenses (20,561,949) (19,215,021) (20,398,409) (2,436,235) (3,441,733)
Estimated surplus/(deficit) 10,288,860 12,576,352 1,904,966 (121,119) (288,923)
Description of estimated CSO's provided to business activities
Pension remissions 187,367
Provision of water allocations to unlicensed sporting clubs free of charge 225,000
Internal bulk water provisions 97,000
Water leak relief 99,000
Infrastructure charges incentives 169,500
Pension remissions 255,237
Providing pedestal discount for community and aged care facilities 332,225
Providing pedestal discount for not-for-profit sporting clubs 50,053
Infrastructure charges incentives 162,500
Pension remissions 228,169
Provision of bins and waste disposal for community events 24,620
In-kind assistance for charities 95,550BUNDABERG REGIONAL COUNCIL
10 Year Capital Investment Summary
For the period ending 30 June 2021
2020/21 2021/22 2022/23 2023/24 2024/25 2025/26 2026/27 2027/28 2028/29 2029/30 Total
Expenditure Type
New 15,473,876 36,034,369 49,274,537 37,384,683 16,923,813 20,369,904 12,335,478 5,655,866 23,492,246 13,139,835 230,084,607
Upgrade 40,419,777 40,848,936 26,255,000 36,444,029 17,394,247 21,905,138 18,036,095 14,489,760 8,506,809 17,548,806 241,848,597
Renewal 27,388,363 31,654,327 33,513,815 25,911,080 26,131,416 30,619,518 31,160,219 29,103,703 30,264,329 25,811,063 291,557,832
Loan Redemption 7,509,801 6,494,746 7,506,615 8,524,598 7,733,080 7,104,880 7,255,707 7,302,088 7,680,046 8,383,401 75,494,962
90,791,817 115,032,378 116,549,967 108,264,390 68,182,556 79,999,440 68,787,499 56,551,416 69,943,430 64,883,104 838,985,999
Asset Class
Land 205,000 - - - - - - - 950,075 1,135,345 2,290,420
Land Restoration 524,312 834,312 300,000 300,000 300,000 3,438,658 4,098,065 75,000 75,000 150,000 10,095,347
Investment Property 2,300,000 - - - - - - - - - 2,300,000
Buildings & Structures 11,711,179 32,865,156 40,979,161 31,127,330 25,475,586 25,996,633 28,198,900 18,093,235 15,803,418 9,530,496 239,781,092
Plant & Equipment 11,429,734 12,435,213 12,554,179 7,317,196 7,289,168 6,128,227 7,375,423 6,179,334 6,484,587 6,110,333 83,303,394
Transport Infrastructure 33,323,791 37,495,015 33,821,012 26,436,961 17,951,320 18,796,551 16,659,315 16,973,510 32,144,193 23,223,725 256,825,392
Stormwater Drainage 1,682,000 3,834,000 2,220,000 14,351,031 2,436,720 2,373,587 944,916 1,981,250 901,006 7,428,969 38,153,479
Sewerage Infrastructure 2,324,000 9,793,000 9,521,000 9,569,290 4,261,682 11,427,000 2,289,984 1,779,000 2,128,190 7,202,837 60,295,983
Water Infrastructure 19,782,000 11,280,936 9,648,000 10,637,984 2,735,000 4,733,904 1,965,190 1,668,000 3,776,915 1,718,000 67,945,929
Intangibles - - - - - - - 2,500,000 - - 2,500,000
Loan Redemption 7,509,801 6,494,746 7,506,615 8,524,598 7,733,080 7,104,880 7,255,707 7,302,088 7,680,046 8,383,401 75,494,962
90,791,817 115,032,378 116,549,967 108,264,390 68,182,556 79,999,440 68,787,499 56,551,416 69,943,430 64,883,104 838,985,999
Funding Sources
Grants & Subsidies 27,959,526 13,335,427 17,080,095 16,398,902 11,200,000 15,100,000 11,600,000 5,100,000 2,600,000 5,100,000 125,473,950
Loans - 21,700,000 25,900,000 15,250,000 5,500,000 11,000,000 9,000,000 5,500,000 13,000,000 8,550,000 115,400,000
Infrastructure Charges 10,030,000 3,350,000 3,950,000 4,709,255 1,167,493 2,100,000 500,000 1,478,891 2,331,800 500,000 30,117,439
Asset Sales 1,093,000 1,100,000 1,100,000 600,000 600,000 600,000 600,000 600,000 600,000 600,000 7,493,000
Reserves 1,274,312 834,312 300,000 300,000 300,000 3,438,658 4,098,065 75,000 75,000 150,000 10,845,347
General Revenue 50,434,978 74,712,639 68,219,872 71,006,233 49,415,064 47,760,782 42,989,434 43,797,525 51,336,630 49,983,104 549,656,263
90,791,817 115,032,378 116,549,967 108,264,390 68,182,556 79,999,440 68,787,499 56,551,416 69,943,430 64,883,104 838,985,999
2020 - 2021 Budget and Operational Plan
11Investment policy
Head of Power
• Local Government Act 2009, section 104(5)(c)(i)
• Local Government Regulation 2012, section 191
• Statutory Bodies Financial Arrangement Act 1982, section 42 to 52
• Statutory Bodies Financial Arrangement Regulation 2019, section 6 to 10, Schedule 3
Intent
To ensure Council is in compliance with its obligations under the aforementioned Acts and
Regulations, and to outline Council’s investment objectives, risk philosophy and procedures for
investment of Council’s surplus funds.
Scope
This policy applies to the Chief Executive Officer, General Manager Organisational Services,
Chief Financial Officer and Financial Services staff.
Policy Statement
1. Council will invest all surplus funds, in accordance with Category 1 investment power, as
allocated under the Statutory Bodies Financial Arrangement Regulation 2019.
2. Council’s investment portfolio will maintain sufficient liquidity to meet anticipated cash flow
requirements.
3. Strong emphasis will be placed on capital preservation.
4. Council will seek to maximise earnings, with the view to exceed set performance
benchmarks, taking into account risk tolerance.
5. Investments will be placed in accordance with Council’s risk philosophy as listed below
(percentage limits are effective at the date of purchase). Where there is a discrepancy
between rating agencies, the lower rating will be used.
Maximum %
Long Term Short Term
Long Term Minimum % / Maximum % Invested with
Rating Rating Investment
Rating Amount of Total of Total any one
(Standard (Standard Quality
(Moody’s) Investments Investments Financial
and Poors) and Poors)
Institution
Capital 5% of Operating
QTC QTC A-1+ 100% 100%
Guaranteed Income
AAA Aaa A-1+ Prime
AA+ Aa1 50%
90% 40%
Aa2 (including QTC)
AA A-1+ High Grade
AA- Aa3
A+ A1
A-1 Upper Medium
A A2 0% 50% 50%
Grade
A- A3
BBB+ Baa1 A-2
Lower Medium
BBB Baa2 0% 25% 50%
Grade
BBB- Baa3 A-3
12 Bundaberg Regional Council6. A minimum of 5% of Council’s Operating Income will be held in the form of cash, which may
be called on at no cost. The balance of funds may be held in cash term deposits with varying
fixed term periods, of no more than 12 months, in accordance with category 1 investment
power.
7. In accordance with the Statutory Bodies Financial Arrangements Act 1982, where Council
holds an investment that is downgraded below the minimum acceptable rating level, Council
will either liquidate/withdraw the deposit no later than 28 days after the change becomes
known or obtain the Treasurer’s approval for continuing the investment arrangement.
8. With the exception of the Queensland Treasury Corporation, when an investment is
proposed, no less than three quotations will be obtained from financial institutions that have
been approved by the Chief Executive Officer or General Manager Organisational Services.
9. Council’s return on investment target is 1.3 times the bank bill swap rate, which will be
monitored through quarterly performance reports.
Associated Documents
• Procurement Policy
Documents controls
Council will review this policy annually or in response to changes in law or best practice.
Policy Owner
The Chief Financial Officer, Financial Services is the responsible person for this policy.
2020 - 2021 Budget and Operational Plan 13Revenue policy
Head of Power
• Local Government Regulation 2012, sections 169(2)(c) and section 193
• Corporate Plan, Outcome 3.1 – A sustainable financial position
Intent
The purpose of this policy is to achieve compliance with sections 169(2)(c) and section 193 of
the Local Government Regulation 2012 and to outline the principles applied by Council.
Scope
This policy applies to all staff and Councillors.
Policy Statement
1. Principles used for the making and levying of Rates and Charges
a) Equity – ensuring the fair and consistent application of lawful rating and charging
principles without bias, taking account of all relevant considerations;
b) Transparency – openness in the processes involved in the making of rates and
charges;
c) Simplicity – a rating regime that is simple and cost effective to administer;
d) Consistency – by scheduling the issue of rates notices on a regular basis;
e) Fiscal responsibility – levying an amount sufficient to allow Council to meet its
budgetary responsibilities;
f) Clarity – by providing meaningful information on rate notices to enable ratepayers to
clearly understand their responsibilities;
g) Flexibility – responding where possible to unforeseen changes in the local economy
and providing a wide range of payment options; and
h) Sustainability – revenue decisions supporting the financial strategies for the delivery
of infrastructure and services identified in Council’s long-term planning.
2. Principles used for granting Concessions for Rates and Charges
In considering the application of concessions Council will be guided by the principles of:
a) The same treatment for ratepayers with similar circumstances;
b) Transparency by making clear the requirements necessary to receive concessions;
and
c) Flexibility to allow Council to respond to local economic issues.
Consideration may be given by Council to granting a class concession in the event all or
part of the Bundaberg Regional Council area is declared a natural disaster area by the State
Government or impacted by a Pandemic called by the Australian Government.
2.1 Council will apply concessions for the following groups, for the purposes outlined:
a) Concession for rates and charges for pensioners – Council acknowledges
that certain classes of pensioners have a reduced capacity to pay on demand
and to the full quantum; and
b) Concessions for rates and charges for community, sporting and welfare groups –
Council acknowledges the contribution of non-profit community, sporting and
welfare groups based on the level of their community assistance and economic
value to the region and community.
14 Bundaberg Regional Council3. Principles used for the recovery of overdue Rates and Charges
a) Transparency and clarity – making the obligations clear to ratepayers and the
processes used by Council to assist ratepayers to meet these obligations;
b) Simplicity – making the processes used to recover outstanding rates and charges
clear and simple to administer and cost effective;
c) Flexibility – by responding where necessary to changes in the local economy; and
d) Equity – having regard to providing the same treatment for ratepayers with similar
circumstances.
4. Principles used in Cost-recovery methods
a) Fiscal responsibility – through full cost recovery, endeavouring to recover the full cost
of the service for which the fee is remitted to minimise the effect on ratepayers;
b) Simplicity – to make the levying of cost-recovery fees simple, efficient, and
inexpensive to administer; and
c) Clarity – in the method of calculating the amounts payable by the recipient of the
service.
5. The extent to which physical and social infrastructure costs for a new development
are funded by charges for the development
In setting infrastructure charges, Council seeks to achieve a balance between affordability
and sustainability, with infrastructure charges below the State Government cap. By
levying infrastructure charges for new development, Council intends to fund the physical
and social costs of providing trunk infrastructure to service development within the
Bundaberg Region.
Council’s infrastructure charges aim to provide a reasonable and equitable distribution of
costs between Council and developers of land, managing the impact of infrastructure
costs of new development on existing ratepayers. To encourage development and longer-
term job generating businesses, Council may discount certain types of infrastructure
charges payable for new development applications in accordance with the terms of the
relevant Policy at that time.
Council’s infrastructure charging framework has been established in accordance with
the legislative requirements of the Planning Act 2016.
Associated Documents
• Local Government Act 2009
• Planning Act 2016
• Revenue Statement
Documents Controls
Council will review this policy annually or in response to changes to law or best practice.
Policy Owner
The Chief Financial Officer, Financial Services is the responsible person for this policy.
2020 - 2021 Budget and Operational Plan 15Revenue statement
Head of Power
• Local Government Regulation 2012, sections 169(2)(b) and 172
• Corporate Plan, Outcome 3.1 - A sustainable financial position
Intent
The purpose of the Revenue Statement is to achieve compliance with sections 169(2)(b) and 172
of the Local Government Regulation 2012 and to provide an explanation of the rates and charges,
cost recovery fees, and concessions adopted by Bundaberg Regional Council (Council).
Scope
The Revenue Statement applies to all staff and Councillors.
Definitions
Rateable land is defined by section 93(2) of the Local Government Act 2009 as any land
or building unit, in the local government area, that is not exempted from rates.
Primary Council land use code means a code recorded in Council's rating files as a
Council code which identifies the principal use of the land or the potential predominant use
by virtue of its improvements or activities conducted upon the land.
Secondary Council land use code means a code used in conjunction with the Primary
Council land use code to indicate a particular land use or the potential predominant use by
virtue of its improvements or activities conducted upon the land.
Strata title residential and commercial property and Strata title residential and
commercial use means lots, which have a primary Council land use code of 1008 or
1009, created under the provisions of the Building Units and Group Titles Act 1980 or the
Body Corporate and Community Management Act 1997.
Subdivided land is defined in chapter 2, part 2, subdivision 3, sections 49 to 51 of the
Land Valuation Act 2010 as follows:
Subdivision applies to a parcel (the relevant parcel) if:
a) the relevant parcel is one of the parts into which land has been subdivided;
b) the person who subdivided the land (the "subdivider") is the owner of the parcel; and
c) the relevant parcel is not developed land.
Policy Statement
Pursuant to sections 169(2)(b) and 172 of the Local Government Regulation 2012, Council is
required to incorporate a Revenue Statement within its budget for each financial year that outlines
the rates and charges, cost recovery fees, and concessions that the Council intends to apply as
detailed below.
1. The measures adopted for revenue raising
Council for any financial year will, as properly planned to meet requirements,
make and levy:
• Differential General Rates;
• Minimum General Rates;
• Separate Rates and Charges (for a specific purpose benefitting the Region);
• Special Rates and Charges (generally across specific benefited or serviced areas of the
Region); and
• Utility Charges.
16 Bundaberg Regional CouncilIn respect of utility charges, Council will, as properly planned to meet requirements,
make and levy such charges for supplying:
• Water services;
• Sewerage services;
• Waste and recycling collection services; and
• Trade waste processing services.
Council’s rate-setting and charging structures will be based on the principles outlined in its
Revenue Policy including equity, transparency, simplicity, consistency, fiscal responsibility,
clarity, flexibility and sustainability.
2. General Rates / Differential General Rates
General rates are levied on all rateable properties in the regional area, and are calculated
on the basis of the value of land. The value of land is determined by the Department of
Natural Resources, Mines & Energy according to:
• in the case of rural land, its unimproved capital value; and
• in all other cases, its site value.
Council will make and levy differential general rates for the financial year ending 30 June
2021, on all rateable land in the Local Government area.
Where Council makes a determination that a parcel of land is intended to be used for a
particular purpose, or has the potential to be used for such a purpose, it will have regard to,
amongst other things, any improvements to, or activities being undertaken on, the land.
Further, Council delegates to the Chief Executive Officer the power (contained in
section 81(4) and (5) of the Local Government Regulation 2012) to identify the rating
category to which each parcel of rateable land in Council’s area belongs.
In accordance with sections 88 and 90 of the Local Government Regulation 2012, owners
of rateable land will be informed of the general rating category in which their land has been
included and that they have the right of objection to the category to which their land is
allocated. All objections shall be submitted to the Chief Executive Officer, Bundaberg
Regional Council, and the only basis for objection shall be that at the date of issue of the
rate notice, having regard to the descriptions adopted by Council, the land should be in
another rating category.
3. Minimum General Rates
A Minimum General Rate will be set for each rating category for the purpose of:
• setting a minimum contribution to be made from all properties situated within the region;
and
• ensure that general rate revenue from lower valued properties results in a more equitable
contribution from such properties towards the cost of services funded from general rates.
In accordance with section 77(3) of the Local Government Regulation 2012, Minimum
General Rates do not apply to subdivided land with a land use code of 1072.
4. Differential General Rates
In accordance with sections 92 and 94 of the Local Government Act 2009 and section 77 to
82 of the Local Government Regulation 2012, Council makes and levies Differential General
Rates and corresponding Minimum General Rates for the year ending 30 June 2021,
against rateable land categories as follows:
2020 - 2021 Budget and Operational Plan 17Rate in the
Identification Minimum
Dollar of
Category Description (Land to which the Primary General
Property
Land use Codes apply) Rate
Value
1 Urban Residential 1001 - Vacant Land
Land 1002 - Single Use Dwelling
– Land that is used, or 1003 - Multi Unit Dwellings – Flats/Dual
has the potential to be Occupancy
used, for urban 1006 - Outbuilding 1.1964 $1,024
residential purposes, 1009 - Strata Title Residential Use
other than land 1021 - Residential Institution Non-Medical
included 1072 - Section 49 to 51 Valuation
in category 5 or 7
2 Rural Residential 1003 - Multi Unit Dwellings – Flats/Dual 1.0292 $1,028
Land Occupancy
– Land that is used, or 1004 - Vacant Large Homesite
has the potential to be 1005 - Dwelling Large Homesite
used, for rural 1006 - Outbuilding
residential purposes 1009 - Strata Title Residential Use
1021 - Residential Institution Non-Medical
1072 - Section 49 to 51 Valuation
1094 - Other Rural Land
3 Intentionally left blank
4 Intentionally left blank
5 Coastal Towns - Land 1001 - Vacant Land 0.9761 $1,137
that is used, or has the 1002 - Single Unit Dwelling
potential to be used, for 1003 - Multi-Unit Dwelling, Flats, Dual
residential purposes and Occupancy
is located within the 1004 - Vacant Large Homesite
townships or areas of 1005 - Dwelling Large Homesite
Bargara, Burnett Heads, 1006 - Outbuildings
Buxton, Coonarr, Coral 1009 - Strata Title Residential Use
Cove, Elliott Heads, 1021 - Residential Institution Non-Medical
Innes Park, Moore Park 1072 - Section 49 to 51 Valuation
Beach, Walkers Point,
Winfield and Woodgate
Beach, and does not
have frontage to the
Pacific Ocean or
frontage to a road
which, in turn, has
frontage to the Pacific
Ocean.
* Refer Differential
Rating Maps 1-10
6 Intentionally left blank
18 Bundaberg Regional CouncilRate in the
Identification Minimum
Dollar of
Category Description (Land to which the Primary General
Property
Land use Codes apply) Rate
Value
7 Urban Oceanfront – 1001 - Vacant Land 0.9196 $1,288
Land that is used, or 1002 - Single Unit Dwelling
has the potential to be 1003 - Multi Unit Dwelling, Flats, Dual
used for residential Occupancy
purposes and is 1004 - Vacant Large Homesite
located within the 1005 - Dwelling Large Homesite
townships or areas of 1006 - Outbuildings
Bargara, Burnett 1009 - Strata Title Residential Use
Heads, 1021 - Residential Non-Medical
Coonarr, Coral Cove, 1072 - Section 49 to 51 Valuation
Elliott Heads, Innes
Park, Moore Park
Beach, Winfield and
Woodgate Beach, and
has frontage to the
Pacific Ocean, or
has frontage to a road
which, in turn, has
frontage to the Pacific
Ocean
* Refer Differential
Rating Maps 1-10
8 Intentionally left blank
9 Agricultural Land - 1060 - Sheep Grazing 1.4077 $1,137
Land that is used, or 1061 - Sheep Breeding
has the potential to be 1064 - Cattle Grazing & Breeding
used, for agricultural 1065 - Cattle Breeding & Fattening
purposes. 1066 - Cattle Fattening
1067 - Goats
1068 - Milk Quota
1069 - Milk No Quota
1070 - Cream
1071 - Oil Seeds
1073 - Grains
1074 - Turf Farms
1075 - Sugar Cane
1076 - Tobacco
1077 - Cotton
1078 - Rice
1079 - Orchards
1080 - Tropical Fruits
1081 - Pineapple
1082 - Vineyards
1083 - Small Crops & Fodder Irrigation
1084 - Small Crops & Fodder Non
Irrigation
1085 - Pigs
1086 - Horses
1087 - Poultry
1088 - Forestry & Logs
1089 - Animals – Special
1090 - Stratum
10 Intentionally left blank
11 Intentionally left blank
2020 - 2021 Budget and Operational Plan 19Rate in the
Identification Minimum
Dollar of
Category Description (Land to which the Primary General
Property
Land use Codes apply) Rate
Value
12 Bundaberg 1007 - Guest House/Private Hotel 2.2403 $1,352
Commercial 1008 - Strata Title Non Residential Use
Land – 1010 - Combines Multi Dwelling & Shops
Land located 1011 - Shop Single
within the area of 1012 - Shop Group (more than 6 shops)
Bundaberg City that is 1013 - Shopping Group (2 to 6 shops)
used, or has the 1014 - Shopping Main Retail (CBD)
potential to be used, 1015 - Shopping Secondary (Fringe CBD)
for commercial 1016 - Drive in Shopping Centre
purposes, other than 1017 - Restaurant
land included 1018 - Tourist Attraction
in Category 15. 1020 - Marina
1022-1 - Car Park Commercial
1023 - Retail Warehouse
1024 - Sales Area (Outdoor)
1025 - Offices
1026 - Funeral Parlour
1027 - Private Hospital/Convalescent
Home (Medical Private)
1028-1 - Warehouse & Bulk Stores
1030 - Service Station
1038 - Advertising Hoarding
1041 - Child Care excluding Kindergarten
1042 - Tavern/Hotel
1043 - Motel
1044 - Nursery (Plants)
1045 - Theatres and Cinemas
1046 - Drive-In Theatre
1047 - Club – Sport (run as a business)
1049 - Caravan Park
1053 - Employment Agency/Training
1054 - Marketplace
13 Intentionally left blank
20 Bundaberg Regional CouncilRate in the
Identification Minimum
Dollar of
Category Description (Land to which the Primary General
Property
Land use Codes apply) Rate
Value
14 Other Commercial 1007 - Guest House/Private Hotel 1.4505 $1,352
Land – Land 1008 - Strata Title Non Residential Use
located outside the 1010 - Combines Multi Dwelling & Shops
area of Bundaberg 1011 - Shop Single
City that is used, or 1012 - Shop Group (more than 6 shops)
has the potential to 1013 - Shopping Group (2 to 6 shops)
be used, for 1014 - Shopping Main Retail (CBD)
commercial 1015 - Shopping Secondary (Fringe CBD)
purposes. 1016 - Drive in Shopping Centre
1017 - Restaurant
1018 - Tourist Attraction
1020 - Marina
1022-1 - Car Park Commercial
1023 - Retail Warehouse
1024 - Sales Area (Outdoor)
1025 - Offices
1026 - Funeral Parlour
1027 - Private Hospital/Convalescent
Home (Medical Private)
1028-1 - Warehouse & Bulk Stores
1030 - Service Station
1038 - Advertising Hoarding
1041 - Child Care excluding Kindergarten
1042 - Tavern/Hotel
1043 - Motel
1044 - Nursery (Plants)
1045 - Theatres and Cinemas
1046 - Drive-In Theatre
1047 - Club – Sport (run as a business)
1049 - Caravan Park
1053 - Employment Agency/Training
1054 - Marketplace
15 Major Shopping 1016-16 - Drive In Shopping Centre with 3.8360 $549,346
Centre more than 20,000m2 gross floor area.
– Land that is used,
or has the potential
to be used for the
purposes of a
shopping centre with
a gross floor area of
more than 20,000m2
16 Industrial Land – 1028-2 - Warehouse & Bulk Stores 1.7124 $1,642
Land that is used, or 1029 - Transport Terminal
has the potential to be 1031 - Oil/Fuel Depot and Refinery
used for industrial 1032 - Wharves, Jetties, Barge Landing
purposes and which is 1033 - Outdoor Service Area
not included in 1034 - Cold Stores – Iceworks
Category 18 or 19. 1035 - General Industry
1036 - Light Industry
1037 - Noxious/Offence Industry
1039 - Harbour Industry
1091 - Transformers and Substations
1200 - Solar Farm
2020 - 2021 Budget and Operational Plan 21Rate in the
Identification Minimum
Dollar of
Category Description (Land to which the Primary General
Property
Land use Codes apply) Rate
Value
17 Intentionally left blank
18 Extractive Industry - 1040 - Extractive Industry 2.2951 $2,574
Land that is used, or
has the potential to be
used, for extractive
industry
19 Heavy Industry – 1251 - Co-generation plant 1.9774 $109,978
Land that is used, or 1252 - Sugar Cane/Sugar Mill
has the potential to be 1253 - Heavy Industry Purpose
used, for a sugar mill,
co- generation plant
or any heavy industrial
purpose.
20 Other Land – Land 1019 - Walkway 1.1049 $1,028
that is not included in 1022-2 - Car Parks – Ancillary Use
any other rating 1050 - Other Clubs (Non Business)
category 1051 - Religious
1052 - Cemetery
1055 - Library
1056 - Showgrounds, Racecourse, Airfield
1057 - Parks, Gardens
1058 - Educational – including
Kindergarten
1059 - Local Authority (secondary use
only)
1092 - Defence Force Establishments
1095 - Reservoirs, Dams, Bores,
Channels
1097 - Welfare Homes/ Institutions
1099 - Community Purposes
1100 - Driver Education Centre
Where the rateability of any land alters during the year, adjustment to the differential general
rate shall be made from the date such changes become effective.
Subdivisions have a primary land use code of 1072 and will be placed into the general rating
category in which they would normally be situated. The value of subdivisions will be
discounted by 40% for rating purposes in accordance with section 50(2) of the Land
Valuation Act 2010.
5. Separate Rates and Charges:
5.1 Community & Environment Charge
Pursuant to section 103 of the Local Government Regulation 2012, Council will make and
levy a separate charge in the sum of $50 per assessment for the purposes of assisting with
the maintenance and improvements of community facilities, upgrades and enhancements
of parks, reserves and natural areas within the region.
22 Bundaberg Regional Council6. Special Rates and Charges:
6.1 Rural Fire Levy
Pursuant to section 94 of the Local Government Regulation 2012 and section 128A of the
Fire and Emergency Services Act 1990 Council will make and levy a special charge to be
known as the “Special (Rural Fire Services) Charge” of $30 on each rateable assessment
in the local government area which is situated within a Class E Levy Area under the Fire
and Emergency Services Regulation 2011. Multiple charges will apply on one rateable
assessment if it comprises multiple rural fire brigade areas, with one charge of $30 per rural
fire brigade area.
The special charge shall fund the ongoing provision and maintenance of rural firefighting
equipment for the rural fire brigades that operate throughout Class E Levy areas under the
Fire and Emergency Services Regulation 2011.
Land within the local government area which is situated within a Class E Levy area under
the Fire and Emergency Services Regulation 2011 is not serviced by urban firefighting
services and, as such, specially benefits from the fire emergency response capability that is
provided by the rural fire brigades.
The overall plan for the special charge will be as follows:
a) The land to which the plan applies is each assessment in the local government
area which is situated within a Class E Levy area under the Fire and Emergency
Services Regulation 2011;
b) The service, facility or activity for which the plan is made is the ongoing provision
and maintenance of rural firefighting equipment for the rural fire brigades that
operate throughout Class E Levy areas under the Fire and Emergency Services
Regulation 2011;
c) The time for implementing the overall plan is one year; and
d) The estimated cost of implementing the overall plan is $395,000.
7. State Emergency Management Levy
In accordance with the Fire and Emergency Services Act 1990, Council is required to collect
a State Emergency Management Levy on all rateable properties on behalf of the
Queensland Fire and Emergency Services. The Levy is not a Council charge and the funds
collected are remitted to the Queensland Fire and Emergency Services. However, Council
is entitled to an administration fee for collecting this Levy, as prescribed by the Fire and
Emergency Services Regulation 2011. Rate assessments with multiple properties are levied
per parcel, in accordance with the State’s legislation, excluding contiguous agricultural
parcels in the same ownership.
8. Utility Charges
In setting Utility Charges, Council will take into consideration factors such as:
• Legislative requirements including National Competition Policy.
• Council policy objectives.
• Recovery of sufficient revenue to cover costs and a return on assets.
• Other sources of revenue where appropriate.
• Future capital investment planning.
2020 - 2021 Budget and Operational Plan 238.1 Water
8.1.1 Declared service area – water
For the financial year 1 July 2020 to 30 June 2021, the declared service areas (water) to
which water charges apply, shall be as per the declared service area (water) maps which,
in accordance with section 163 of the Water Supply (Safety & Reliability) Act 2008, are
available for inspection at Council offices or on Council’s website at
www.bundaberg.qld.gov.au.
8.1.2 Service provider (water)
The service provider within the declared service area/s (water) shall be Bundaberg Regional
Council.
8.1.3 Water charges
Council levies water charges on properties in the defined water supply areas to recover the
full costs of the water supply operation including a return to the community on the assets
employed.
Pursuant to sections 92(4) and 94 of the Local Government Act 2009 and sections 99 to
102 the Local Government Regulation 2012, the following water charges will be made and
levied for the financial year 1 July 2020 to 30 June 2021:
a) Water access charge
A common access charge, for same sized meters, applies in all areas receiving a
potable and non-potable water supply.
Vacant lands situated in the water area and not serviced with a water connection are
charged a Vacant or Non-Metered Access charge. The reason for this is that the major
portion of Council’s costs associated with providing a water service is in the provision
and maintenance of capital infrastructure and these costs must be financed whether or
not a property is actually connected to the water system.
Single residential properties are levied a charge based on the size of the water meters
serving the property, since the meter size determines the potential volume of water
used.
Where multiple lots are included on one assessment, Council will levy a water access
charge for:
• house and vacant lot together – based on the size of the water meters servicing the
property;
• multiple vacant lots on the one assessment without a water connection, a Vacant or
Non-metered Access charge; and
• multiple vacant lots on the one assessment with a water connection, based on the
size of the water meters servicing the property.
Non Strata Flats/Separate Dwellings/Dual Occupancy
Where water consumption is not separately metered for each unit, will be levied with a
water access charge based on the size of the meters servicing the property.
Where water consumption is separately metered for each unit, will be levied with a water
access charge for each of the sub metered units, based on the size of each meter.
Properties with multiple connections
Properties with multiple connections are levied a water access charge based on the size
of the water meters servicing the property.
24 Bundaberg Regional CouncilYou can also read