Maui County Community Health Needs Assessment - July 3, 2013
←
→
Page content transcription
If your browser does not render page correctly, please read the page content below
Maui County
Community Health Needs Assessment

            July 3, 2013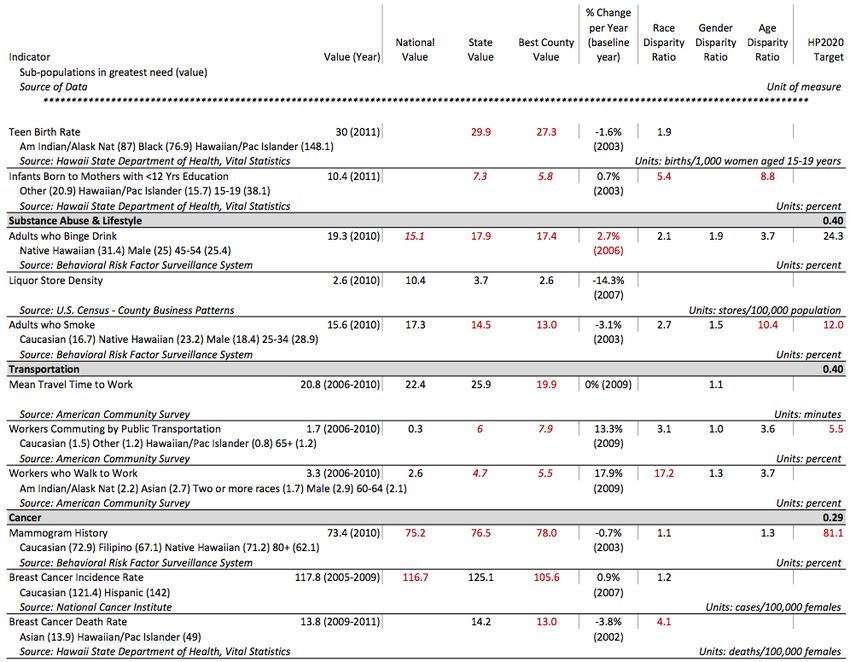
Table of Contents
Executive Summary .............................................................................................................................. 4
Introduction .................................................................................................................................................. 4
Approach ....................................................................................................................................................... 4
Data Sources and Methods ........................................................................................................................... 4
Areas of Need................................................................................................................................................ 5
Selected Priority Areas .................................................................................................................................. 7
Note to the Reader ....................................................................................................................................... 7
1 Introduction ..................................................................................................................................... 8
1.1 Summary of CHNA Report Objectives and context ............................................................................. 8
  1.1.1 Healthcare Association of Hawaii ................................................................................................. 8
  1.1.2 Member Hospitals......................................................................................................................... 8
  1.1.3 Advisory Committee...................................................................................................................... 8
  1.1.4 Consultants ................................................................................................................................... 9
1.2 Hospital Community Benefit Team and Goals................................................................................... 10
  1.2.1 Definition of Community + Map ................................................................................................. 10
2 Methods ........................................................................................................................................... 11
2.1 Core Indicator Summary .................................................................................................................... 11
  2.1.1 Data Sources ............................................................................................................................... 11
  2.1.2 Comparisons: Analytic Approach ................................................................................................ 11
  2.1.3 Indicator and Topic Area Scoring ................................................................................................ 12
  2.1.4 Shortage Area Maps ................................................................................................................... 12
2.2 Hospitalization Rates ......................................................................................................................... 13
2.3 Key Informant Interviews .................................................................................................................. 13
2.4 Community Survey ............................................................................................................................ 15
3 Community Health Needs Assessment Findings ............................................................... 16
3.1 Demographics .................................................................................................................................... 16
  3.1.1 Population................................................................................................................................... 16
  3.1.2 Economy ..................................................................................................................................... 18
  3.1.3 Education .................................................................................................................................... 18
3.2 Overview of Needs Assessment ........................................................................................................ 19
  3.2.1 Access to Health Services ............................................................................................................ 23
  3.2.2 Cancer ......................................................................................................................................... 25
  3.2.3 Diabetes ...................................................................................................................................... 26
  3.2.4 Disabilities................................................................................................................................... 27
  3.2.5 Economy ..................................................................................................................................... 28
  3.2.6 Education .................................................................................................................................... 29
  3.2.7 Environment ............................................................................................................................... 30
  3.2.8 Exercise, Nutrition & Weight ...................................................................................................... 31
  3.2.9 Family Planning .......................................................................................................................... 32
  3.2.10 Heart Disease & Stroke ............................................................................................................... 33
  3.2.11 Immunizations & Infectious Diseases ......................................................................................... 35
  3.2.12 Injury Prevention & Safety .......................................................................................................... 37
  3.2.13 Maternal, Fetal & Infant Health ................................................................................................. 38
  3.2.14 Mental Health & Mental Disorders ............................................................................................ 40

                                                                                                                                                                1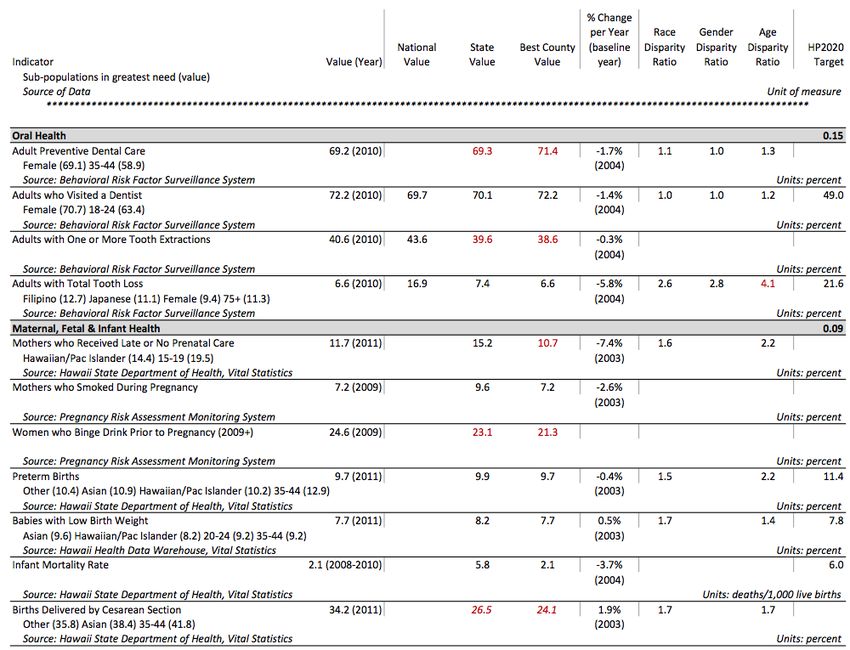
3.2.15      Older Adults & Aging .................................................................................................................. 42
   3.2.16      Oral Health ................................................................................................................................. 44
   3.2.17      Respiratory Diseases ................................................................................................................... 45
   3.2.18      Social Environment ..................................................................................................................... 47
   3.2.19      Substance Abuse & Lifestyle ....................................................................................................... 48
   3.2.20      Transportation ............................................................................................................................ 49
4 Community Health Needs Summary ...................................................................................... 51
4.1 Findings/Conclusions ......................................................................................................................... 51
  4.1.1 Disparities Highlights .................................................................................................................. 53
  4.1.2 Identified Data Gaps ................................................................................................................... 54
4.2 Limitations and Other Considerations ............................................................................................... 54
5 Selected Priority Areas............................................................................................................... 56
Appendix A: Secondary Data ........................................................................................................... 57
About HCI Provided Data ............................................................................................................................ 57
Framework for Indicator/Data and Topic Selection ................................................................................... 57
Core Indicator Data Summary: Analytic Approach and Scoring Methodology........................................... 57
Core Indicator Data ..................................................................................................................................... 62
Appendix B: Hospitalization Data ................................................................................................. 72
Hospital Service Areas................................................................................................................................. 72
Hospitalization Rates .................................................................................................................................. 72
Appendix C: Key Informant Interview Participants ................................................................ 81
Completed Interviews ................................................................................................................................. 81
Attempted Interviews ................................................................................................................................. 82
Appendix D: Identified Community Resources......................................................................... 84
Appendix E: Referenced Reports ................................................................................................... 91
Appendix F: Road map to IRS Requirements in Schedule H Form .................................... 92
Appendix G: Authors .......................................................................................................................... 93

                                                                                                                                                             2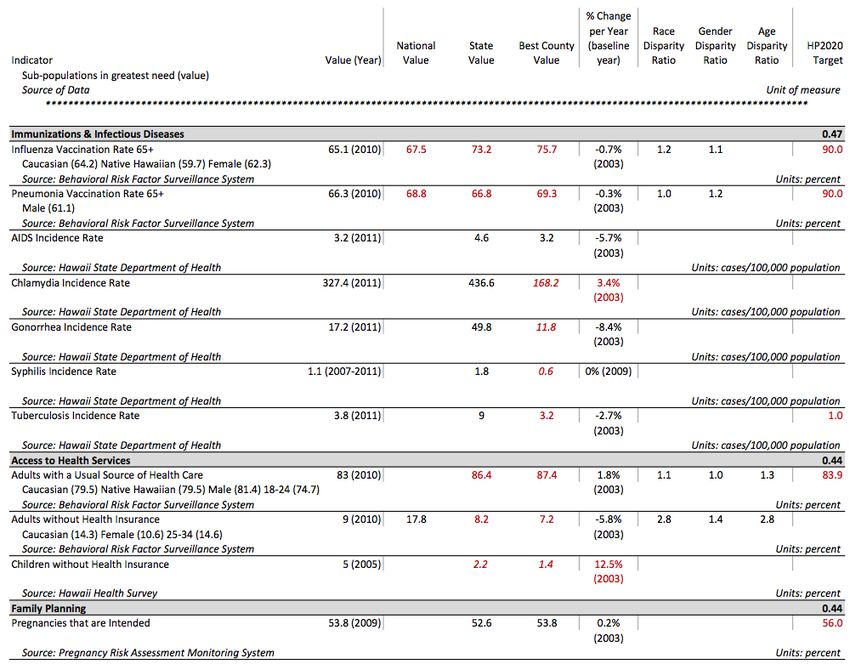
Tables
Table 3.1: Population Density and Change ..................................................................................................................16
Table 3.2: Core Indicator Summary Scores ..................................................................................................................19
Table 3.3: Hospitalization Rates due to Preventable Causes in Maui County, 2011 ....................................................20
Table 3.4: Core Indicators – Access to Health Services ................................................................................................23
                                                             2
Table 3.5: Percent of Persons with a Disability, 2011 .................................................................................................27
Table 3.6: Core Indicators – Education ........................................................................................................................29
Table 3.7: Core Indicators – Family Planning ...............................................................................................................32
Table 3.8: Core Indicators – Heart Disease & Stroke ...................................................................................................33
Table 3.9: Core Indicators – Immunizations & Infectious Diseases ..............................................................................35
Table 3.10: Core Indicators – Injury Prevention & Safety ............................................................................................37
Table 3.11: Core Indicators – Mental Health & Mental Disorders ...............................................................................40
Table 3.12: Core Indicators – Respiratory Diseases .....................................................................................................45
Table 3.13: Core Indicators – Substance Abuse & Lifestyle..........................................................................................48
Table 3.14: Core Indicators – Transportation ..............................................................................................................50

Figures
Figure 1.1: Service Area Map [Each hospital will add its own map in its submitted report.] ......................................10
Figure 2.1: Comparison Methods .................................................................................................................................12
Figure 3.1: Population by Age, 2011 ............................................................................................................................16
Figure 3.2: Population by Race/Ethnicity, 2011 ...........................................................................................................17
Figure 3.3: Breakdown of Population Reporting Race of Asian Only, 2011 .................................................................17
Figure 3.4: Poverty by Race/Ethnicity, 2006-2010 .......................................................................................................18
Figure 3.5: PQI Composite Hospitalization Rates.........................................................................................................20
Figure 3.6: Key Informant Interview Word Cloud ........................................................................................................21
Figure 3.7: High-Risk Race/Ethnicity Groups Identified through Community Survey...................................................22
Figure 3.8: Federally-Designated Medically Underserved Areas/Populations by Census Tracts .................................23
Figure 3.9: Federally-Designated Primary Health Care Professional Shortage Areas/Populations by Census Tracts..23
Figure 3.10: Hospitalization Rates due to Diabetes, 2011 ...........................................................................................26
                                                                                                                                  2
Figure 3.11: Percent of Persons with a Disability by Age and Race/Ethnicity: Maui County, 2011 ............................27
                                                                  5
Figure 3.12 Percent of Population Living Below Poverty ............................................................................................28
Figure 3.13: Hospitalization Rates due to Heart Disease, 2011 ...................................................................................34
Figure 3.14: Hospitalization Rates due to Bacterial Pneumonia, 2011 ........................................................................36
Figure 3.15: Low Birth Weight Rate per 100 Live Births, 2011 ....................................................................................39
Figure 3.16: Federally-Designated Mental Health Professional Shortage Areas by Census Tracts .............................40
Figure 3.17: Mental Health Hospitalizations by Race: Maui County, 2011 .................................................................41
Figure 3.18: Unadjusted Composite Hospitalization Rates, 2011 ................................................................................42
Figure 3.19: Federally-Designated Dental Health Professional Shortage Areas by Census Tracts ..............................44
Figure 3.20: Hospitalization Rates due to Respiratory Disease, 2011 .........................................................................46
Figure 4.1: Areas of Disparity for Race/Ethnicity Groups ............................................................................................53

                                                                                                                                                                3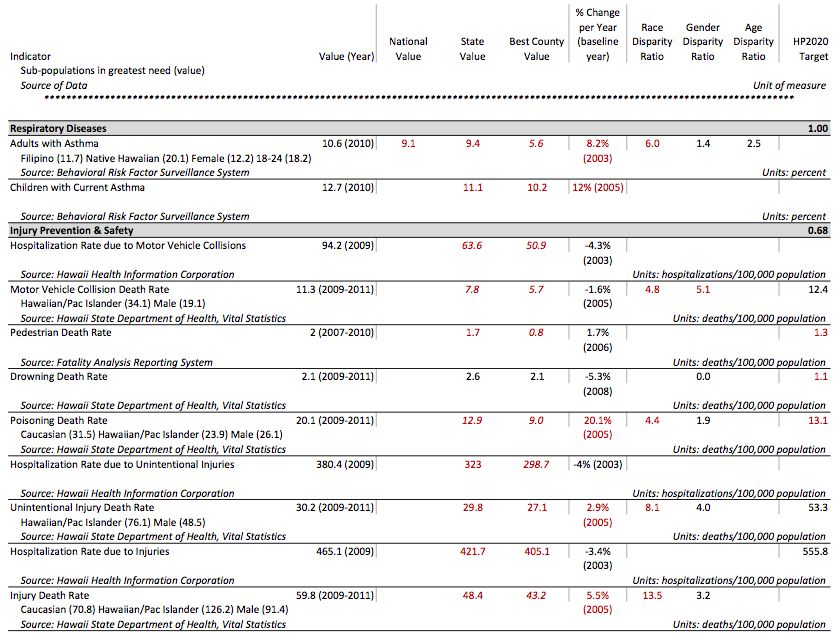
Executive Summary
Introduction
The Healthcare Association of Hawaii and its member hospitals are pleased to present the 2012-2013
Maui County Community Health Needs Assessment (CHNA). This CHNA report was developed through a
collaborative process and provides an overview of the health needs in Maui County. This document
serves as a foundation report for member hospitals to use in producing a completed CHNA report for
their institutions. The goal of this report is to offer a meaningful understanding of the health needs in
the community, as well as help guide the hospitals in their community benefit planning efforts and
development of an implementation strategy to address prioritized needs. Special attention has been
given to identify health disparities, the needs of vulnerable populations, and unmet health needs or gaps
in services. Although this report focuses on needs within the community, it is important to note there
are also innumerable community assets and a true aloha spirit that provide ample foundation for
community health improvement.
Approach
In Fall 2012, the Healthcare Association of Hawaii partnered with Healthy Communities Institute to
conduct a CHNA for Maui County. Our approach followed the public health model of assessing and
understanding community health holistically. A framework for analysis was constructed based on
determinants of health; the framework included a broad definition of community health that considers
extensive secondary data on the social, economic, and physical environments, as well as health risks and
outcomes. The influence of mauka (“toward the mountains”), or upstream factors, and the resulting
makai (“toward the ocean”), or downstream impacts, on health is a transcending theme. Key informant
interviews with those having special knowledge of health needs, health disparities, and vulnerable
populations provided vital information that increased the understanding of the health needs in Maui
County. A small set of community residents provided additional insights on the health needs in Maui
County. It is hoped that this report will provide a foundation for community health improvement efforts
and that community health partners will build on this report.
Data Sources and Methods
An extensive array of secondary and primary data was collected and synthesized for this report.
Core Indicators: Secondary data was analyzed using Hawaii Health Matters
(www.HawaiiHealthMatters.org), a publicly available data platform with a dashboard of over 100
indicators from over 20 sources; much of the data comes from Hawaii Department of Health, allowing
for Hawaii-specific race, age and gender details. This extensive core data was analyzed using a highly
systematic and quantitative approach that incorporated multiple benchmarks and comparisons to
understand the question: How is Maui County performing?
Hospitalization Indicators: Eighteen indicators on key preventable causes of hospitalization, analyzed at
the sub-county/hospital service area level, supplemented the core indicators. This data was provided by
Hawaii Health Information Corporation (HHIC) and enabled valuable insights into utilization patterns,
geographic disparities in hospitalization rates, and enhanced the core indicator data for important topic
areas.
Supplemental Information: Recently published reports on Maui County’s health and access to care were
reviewed for additional key information on important topics such as health disparities, primary care
needs, and mental health.

                                                                                                         4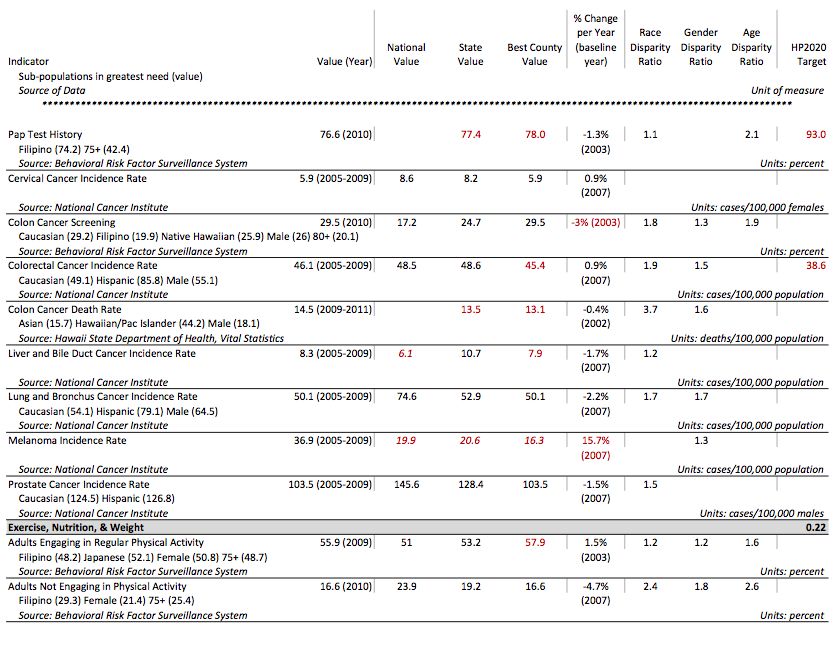
Key Informant Interviews: Storyline Consulting, a local partner of the project, interviewed 11 key
informants who had knowledge of the health needs in Maui County. The selection of the key informants
was guided by preliminary core indicator data findings and followed a structured nomination and
selection process by the HAH Advisory Committee. These 11 Maui-specific interviews were
supplemented by relevant information provided by additional key informants who were interviewed for
the State of Hawaii. The input by local key informants was invaluable and greatly enhanced the
understanding of health needs and offered insight into health resources and health improvement
approaches.
Community Survey: A small sample of community residents, via an online survey, supplemented the key
informant interviews. Highlights of these surveys, or “Voices from the Community,” are incorporated
throughout the report.
Areas of Need
This report provides an overview of Maui County’s community health needs. Community health was
assessed for Maui County as a whole, for race sub-groups, and for sub-geographies. The findings
revealed overall or sub-population community needs in the following areas:

Access to Health Services              Exercise, Nutrition, & Weight          Mental Health & Mental
Cancer                                 Family Planning                          Disorders
Diabetes                               Heart Disease & Stroke                 Older Adults & Aging
Disabilities                           Immunizations & Infectious             Oral Health
Economy                                  Diseases                             Respiratory Diseases
Education                              Injury Prevention & Safety             Social Environment
Environment                            Maternal, Fetal & Infant               Substance Abuse & Lifestyle
                                         Health                               Transportation

Several overarching themes emerged across the topic areas:
All groups experience adverse health outcomes due to chronic disease and health risk
behaviors
While there are significant disparities in chronic disease, it is important to note that areas such as heart
disease and stroke, cancer, diabetes, and asthma affect many residents of Maui County. Moreover, key
health behaviors that impact chronic disease, including optimal exercise, nutrition, and weight, need
attention across all age, gender, and race/ethnic groups. While all core indicators in the area of activity
and body weight compared favorably to the nation, it is important to remember that obesity and
inactivity is a problem nationwide. Although Maui County’s obesity rate is lower than the nation, it is still
at a hazardous level that expresses the need to improve healthy behaviors. Attention to this area at
many levels could have an enormous positive impact on the long-term health of the community.
As a chronic condition that significantly influences overall health, mental health and associated
substance abuse are key concerns in Maui County. Both the suicide death rate and adults with
depression is high and increasing; mental health disorders are the most frequent of the 15 causes of
preventable hospitalizations that were studied. The adverse outcomes from chronic conditions cut
across all race, age, and gender groups.

                                                                                                            5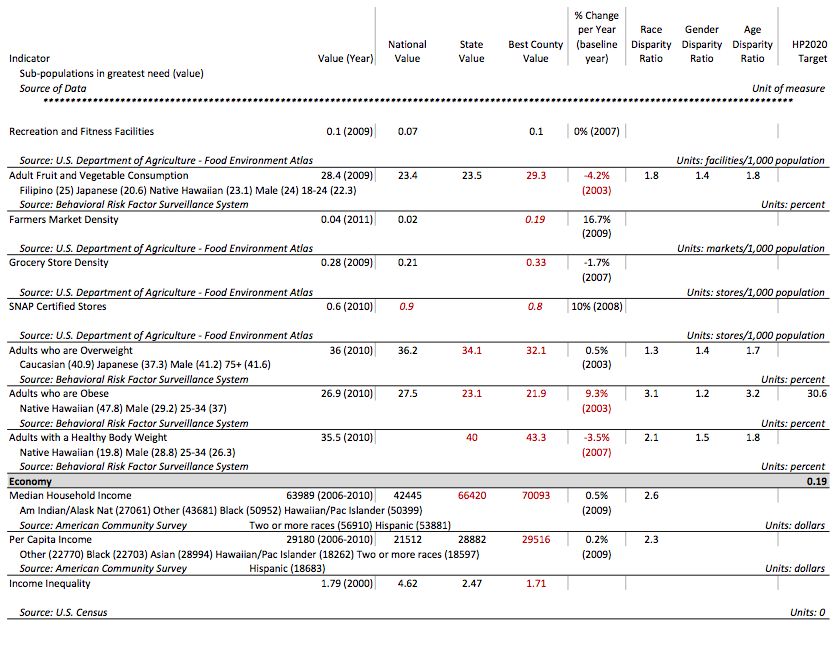
Greater socioeconomic need and health impacts are found among certain groups and places in
Maui County
Repeatedly throughout this needs assessment, key informants stressed that Maui County residents who
are low-income are the most affected by health problems and often the most difficult to help. The
highest poverty rates in the county are found on the Island of Molokai, on the north shore of the Island
of Maui, and among Native Hawaiian and Pacific Islander populations. Financial constraints affect
residents’ access to health services, including effective contraceptive methods and oral health care, and
key informants conveyed that the income levels of most Lanai residents are low enough that healthcare
is not a priority due to its cost. Low-income residents are less likely to get proper cancer screening, and
may not be able to afford the cost of travelling to Oahu for treatment if diagnosed with cancer.
Additionally, those living in poverty are less likely to engage in healthy behaviors that can prevent
chronic disease and are more likely to smoke. Children living in low-income families are at a
disadvantage in obtaining a quality education, and key informants stress the need for improving the
quality and services available to children in schools.
Cultural and language barriers inhibit effective intervention for the most impacted
populations
Because of the strong correlation between poverty and race/ethnicity, some of the groups most
impacted by health issues often face cultural barriers to health improvement. Language differences,
including limited English proficiency, and poor health behaviors that are common within a culture are
challenges that must be overcome in order to effectively prevent disease. Key informants cited
challenges in effective communication and intervention to particular race/ethnic groups in the areas of
access to health services; diabetes; education; heart disease and stroke; injury prevention and safety;
and older adults and aging. Culture is also cited as an important consideration in providing educational
opportunities that will motivate youth.
Limited access to care results in greater health impacts
Because many health services are based on the Island of Oahu, Maui County suffers from limited access
to various types of care. Throughout the entirety of the county at least part of the population has been
designated as “medically underserved” by the Health Resources and Services Administration. Key
informants cite a lack of both primary and specialty care physicians amongst the small communities, and
a need for upgrading Maui facilities with new technologies. Centers for cancer prevention, screening,
and treatment are mostly located on Oahu. Mental health services needed include case management,
housing for adults with serious issues, and substance abuse treatment; both Maui Island and Molokai
are federally designated mental health professional shortage areas. Maui Island is also designated as a
dental health professional shortage area.
Services are especially difficult to maintain on the county’s smaller islands. On Lanai, women must travel
to another island to give birth and there are very limited options for special needs care for older adults.
Molokai also needs more long-term care options, as well as services for substance abuse and domestic
violence victims. Residents from all of the islands that encompass Maui County experience
transportation and availability of care challenges.
Community health centers and schools are key community assets for effective interventions
Given the barriers described above, several key informants recommended focusing on intervention
through community health centers. The Molokai Community Health Center is cited as an asset to care
for the uninsured. Key informants suggested similar centers would be optimal for providing family
planning, oral care, behavioral health, and respiratory health services.

                                                                                                           6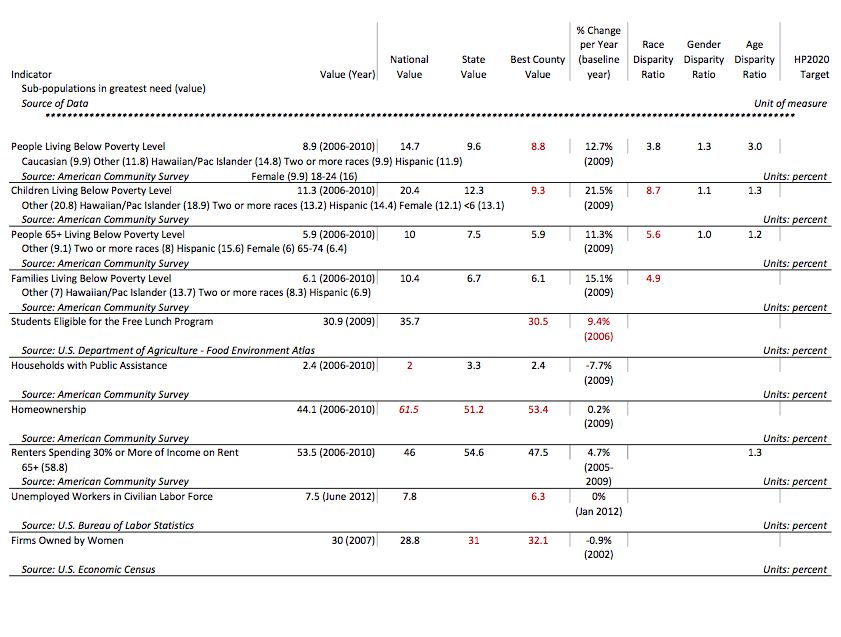
School-based interventions were also an oft-cited method of positively impacting health in Maui County.
Health interventions for children and teens can have a two-fold benefit of establishing healthy life-long
behaviors among Hawaii’s youth, as well as influencing the health of their families. Schools can readily
address childhood obesity by increasing physical activity time, oral health through dental services and
education, vaccination rates, substance abuse, and family planning needs. The need for health literacy
can successfully be addressed in the school environment.
Selected Priority Areas
Each hospital will customize this section for its own needs in its submitted report.
Note to the Reader
Beyond the Executive Summary, readers may choose to study the entire report or alternatively focus on
a particular topic area. An overview is provided for each key type of data included in the report: core
indicators, hospitalization rates, key informant interviews, and on-line community survey.
To more deeply understand a topic area, the reader can turn to any of the 20 topic area presentations
and find all data for the topic and summary conclusions. Each topic-specific section is organized in the
following way:
Core Indicators and Supplemental Information
Hospitalization Rates (when available)
Key Informant Interview Information
Summary of Topic Area
7
1 Introduction
1.1 Summary of CHNA Report Objectives and context
The state of Hawaii is unique in that all of its community hospitals and hospital systems joined efforts to
fulfill new requirements under the Affordable Care Act, which the IRS developed guidelines to
implement. The Healthcare Association of Hawaii (HAH) led this collaboration to conduct state- and
county-wide assessments for its members.
1.1.1   Healthcare Association of Hawaii
HAH is the unifying voice of Hawaii’s health care providers and an authoritative and respected leader in
shaping Hawaii’s health care policy. Founded in 1939, HAH represents the state’s hospitals, nursing
facilities, home health agencies, hospices, durable medical equipment suppliers, and other health care
providers who employ about 20,000 people in Hawaii. HAH works with committed partners and
stakeholders to establish a more equitable, sustainable health care system driven to improve quality,
efficiency, and effectiveness for patients and communities.
1.1.2   Member Hospitals
Twenty-six of 28 Hawaii hospitals,1 including all Maui County hospitals, participated in the CHNA project.

        Located in Maui County:

                 Kula Hospital
                 Lana`i Community Hospital
                 Maui Memorial Medical Center
                 Molokai General Hospital

        Serve Maui County residents:

                 Kahi Mohala Behavioral Health
                 Kaiser Permanente Medical Center
                 Kapi`olani Medical Center for Women & Children
                 Rehabilitation Hospital of the Pacific
                 Shriners Hospitals for Children - Honolulu
                 The Queen’s Medical Center

1.1.3   Advisory Committee
The CHNA process has been informed by hospital leaders and other key stakeholders from the
community who constitute the Advisory Group. The following individuals shared their insights and
knowledge about health care, public health, and their respective communities as part of this group.

        Howard Ainsley - Hawaii Health Systems Corporation
        Bruce Anderson, PhD – Hawaii Health Systems Corporation

1
 Tripler Army Medical Center and the Hawaii State Hospital are not subject to the IRS CHNA requirement and
were not a part of this initiative.

                                                                                                             8
Joy Barua – Kaiser Permanente Hawaii
        Maile Ballesteros – St. Francis Home Care Kauai
        Wendi Barber, CPA, MBA – Castle Medical Center
        Rose Choy - Kahi Mohala Behavioral Health
        Kathleen Deknis, RN, MPH – Home Health by Hale Makua
        Karen Fernandez – Wahiawa General Hospital
        Mark Forman, JD – Hawaii Medical Service Association Foundation
        Loretta J. Fuddy, ACSW, MPH – State of Hawaii Department of Health
        Robert Hirokawa, DrPH – Hawaii Primary Care Association
        Mari-Jo Hokama – Kahi Mohala Behavioral Health
        Fred Horwitz – Life Care Center of Hilo
        Susan Hunt, MHA – Hawaii Island Beacon Community
        Richard Keene – The Queen’s Health Systems
        Jeannette Koijane, MPH – Kokua Mau
        Jay Kreuzer - Hawaii Health Systems Corporation
        Greg LaGoy, ND, MBA – Hospice Maui
        Bernadette Ledesma, MPH – Pearl City Nursing Home
        Vince Lee, ACSW, MPH - Hawaii Health Systems Corporation
        Wesley Lo - Hawaii Health Systems Corporation
        Pat Miyasawa – Shriners Hospitals for Children-Honolulu
        R. Don Olden – Wahiawa General Hospital
        Quin Ogawa – Kuakini Health System
        Jason Paret, MBA – North Hawaii Community Hospital
        Ginny Pressler, MD, MBA, FACS – Hawaii Pacific Health
        Hilton Raethel, MBA, MHA – Hawaii Medical Service Association
        Hardy Spoehr - Papa Ola Lokahi
        Jerry Walker - Hawaii Health Systems Corporation
        Katherine Werner Ciano, MS, RN – North Hawaii Hospice
        Ken Zeri, RN, MSN – Hospice Hawai`i
        Lori Miller – Kauai Hospice
        Marie Ruhland, RN – Home Healthcare Services of Hilo Medical Center
        Neill Schultz – Castle Medical Center
        Corinne Suzuka, RN, BNS, MA – St. Francis Home Care
        Peter Sybinsky, PhD – Hawaii Health Information Corporation
        Ty Tomimoto – Rehabilitation Hospital of the Pacific
        Sharlene Tsuda – The Queen’s Health Systems
        Stephany Vaioleti, LSW, JD - Kahuku Medical Center
        Sharon Vitousek, MD – North Hawaii Outcomes Project

1.1.4   Consultants
Healthy Communities Institute
The Healthy Communities Institute (HCI) mission is to improve the health, environmental sustainability
and economic vitality of cities, counties and communities worldwide. The company is rooted in work
started in 2002 in concert with the Healthy Cities Movement at the University of California at Berkeley.

                                                                                                           9
HCI offers a spectrum of technology and services to support community health improvement. HCI’s web-
based dashboard system makes data easy to understand and visualize. The web system and services
enable planners and community stakeholders to understand all types and sources of data, and then take
concrete action to improve target areas of interest. HCI has over 100 implementations of its dashboard
for clients in 40+ states.
The HCI team is composed of experts in public health, health informatics, and health policy. The services
team provides customized research, analysis, convening, planning and report writing to meet the
organizational goals of health departments, hospitals, and community organizations.
To learn more about Healthy Communities Institute please visit www.HealthyCommunitiesInstitute.com.
Storyline Consulting
Storyline Consulting is dedicated to serving and enhancing Hawaii’s nonprofit and public sectors.
Storyline provides planning, research, evaluation, grant writing, and other organizational development
support and guidance. By gathering and presenting data and testimonies in a clear and effective way,
Storyline helps organizations to improve decision-making, illustrate impact, and increase resources.
To learn more about Storyline Consulting please visit www.StorylineConsulting.com.
1.2 Hospital Community Benefit Team and Goals
Each hospital will customize this section for its own needs in its submitted report.
1.2.1 Definition of Community + Map
[Each hospital will also customize this section in its submitted report.] The hospital service area is
defined by a geographical boundary of Maui County, which encompasses the inhabited islands of Maui,
Molokai, and Lanai. Maui County will serve as the unit of analysis for this Community Health Needs
Assessment. Hence, the health needs discussed in this assessment will pertain to individuals living within
this geographic boundary. When possible, highlights for sub-geographies within Maui County are
provided. The specific area served by the hospital is indicated in Figure 1.1.
Figure 1.1: Service Area Map [Each hospital will add its own map in its submitted report.]
Note: this map is a placeholder and should be replaced with a service area map specific to the hospital.
102 Methods
The starting point for this needs assessment is a summary of secondary or core indicator data, which
applies a systematic and quantitative method of comparing the relative severity of health indicators
across 20 topic areas. When possible, other data are considered, including rates of hospitalization due to
preventable causes, to more closely examine the most severe health needs and their impact on health
care utilization. The secondary data findings are further informed by collected primary data. Individuals
with special knowledge regarding the health needs of the community, including those with expertise in
public health and community health, were interviewed through a key informant interview process. An
online survey collected additional opinions from community residents. The quantitative, secondary data
is then combined with the knowledge of key informants who have awareness of health needs specific to
their community and highlighted with resident opinions on community health concerns.
2.1 Core Indicator Summary
2.1.1 Data Sources
The core indicators included in this summary originated from Hawaii Health Matters
(www.HawaiiHealthMatters.org), a publicly available data platform with a dashboard of over 100
indicators from over 20 sources. Hawaii Health Matters (HHM) was developed as a partnership between
Hawaii Health Data Warehouse and Hawaii Department of Health, with technology provided by Healthy
Communities Institute. The core indicators cover health outcomes, behaviors that contribute to health,
and other factors that are correlated with health. The secondary data available on HHM is continuously
updated as sources release new data. The data included in this summary is as of October 17, 2012, and
may not reflect data currently on the site. Additional data specific to race, gender, and age subgroups
was obtained directly from Hawaii Department of Health. Each of the indicators was categorized into
one of 20 topic areas, spanning both health and quality of life issues. All indicators, including
measurement date, sources and topic area assignment, are included in the Appendix of this report.
2.1.2 Comparisons: Analytic Approach
The status of Maui County was assessed one indicator at a time using up to four comparison methods.
1. First, Maui County was compared geographically, to the rest of the state as well as the nation.
Comparisons of Maui County to the United States, the state average, and the county in Hawaii
with the best value for the indicator were “averaged” (see Appendix A for more details and an
example). This average was used to determine whether Maui County compares poorly to other
geographies.
2. The second comparison examined the trend of the data. A line of best fit was calculated for all
available data points, and the slope of the line was used to determine the average percent
change per year. If Maui County’s indicator value had worsened by at least 2.5% of the baseline
value per year, the trend for the indicator was considered poor.
3. A third comparison measured disparities among sub-populations in Maui County. If one sub-
population had a value at least four times worse than another for the indicator, then the
disparity measurement was considered poor.
4. Finally, the indicator value was compared to nationally recognized Healthy People 2020
(HP2020) benchmarks. The indicator was considered poor if Maui County had not yet met the
target set by the U.S. Department of Health and Human Services (see Appendix A for more
information on HP2020 benchmarks).
11Figure 2.1: Comparison Methods
As many comparisons as possible were
applied to each indicator. The possible
comparisons varied for each indicator
depending on the availability of data.
Geographic comparisons were only
possible when national data was
available for the same indicator and time
period. Trend comparisons were only
possible when at least three periods of
measure were available to avoid
misinterpreting slight changes between
two periods. The availability of sub-
population data varied by indicator, and
so disparity comparisons were
incorporated whenever possible. Finally,
HP2020 benchmarks only exist for a
subset of the indicators included in the
summary. Please see Appendix A for
more details and examples of this
process.
2.1.3 Indicator and Topic Area Scoring
After the status of all possible comparisons was assessed, indicators were aggregated into their
respective topic areas. The total number of poor comparisons was divided by the total possible
comparisons within the topic area to calculate the topic area score. This score, measuring the
proportion of poor comparisons within the topic, ranges from zero to one. Scores were not calculated
for topic areas that had one or zero indicators, as these areas were deemed to lack an adequate number
of indicators. The top ten topic areas with the highest scores were used to guide primary data collection.
Please see Appendix A for more details and an example of this process.
2.1.4 Shortage Area Maps
Core indicator data for relevant topic areas was supplemented with maps illustrating the following types
of federally-designated shortage areas and populations:
Medically underserved areas and/or populations
Primary health care professional shortage areas and/or populations
Mental health professional shortage areas
Dental health professional shortage areas
Criteria for medically underserved areas and populations can be found at:
http://bhpr.hrsa.gov/shortage/muaps/index.html
Criteria for health professional shortage areas can be found at:
http://bhpr.hrsa.gov/shortage/hpsas/designationcriteria/designationcriteria.html
Maps of shortage areas and populations were based upon shapes generated using the Community
Issues Management site’s mapping tool: http://www.cim-network.org/CIM/Tools/
12Maps were further customized by Healthy Communities Institute.
2.2 Hospitalization Rates
While the Core Indicator Summary included several unadjusted hospitalization rate indicators, further
risk-adjusted rates were obtained for comparison between geographies of varying population makeup.
Rates were provided by Hawaii Health Information Corporation (HHIC), and are defined by the Agency
for Healthcare Research and Quality (AHRQ) as a set of measures that can be used to identify quality of
outpatient care which can potentially prevent the need for hospitalization. Risk adjustment attempts to
account for differences in indicators across providers and geographic areas that are attributable to
variations in patient mix. AHRQ’s risk adjustment methodology employs multivariate ordinary least
squares regression to estimate an expected value of each indicator an area would exhibit with an
“average” case-mix. The model adjusts for patient demographics, including age, sex, all age-sex
combinations, All-Payer Refined DRGs (a refinement of CMS’s DRGs that additionally classifies non-
Medicare cases) and severity-of-illness. HHIC applies AHRQ’s risk adjustment methodology to further
control for the top four dominant races in Hawaii, as determined by the Hawaii State Department of
Health’s Hawaii Health Survey. Risk adjustment coefficients are estimated using the Healthcare Cost and
Utilization Project’s (HCUP) State Inpatient Databases (SID). Please see
http://qualityindicators.ahrq.gov/Modules/pqi_resources.aspx for a complete definition of indicators.
Because the area of mental health was not well represented in the Core Indicator Summary, HHIC also
provided unadjusted rates of hospitalization for any mental health-related primary diagnosis.
Sub-county hospitalization rates are included for Hospital Service Areas (HSA), which were defined in
1995 by hospital CEOs and are composed of contiguous zip codes surrounding a hospital’s self-defined
service area. Please see Appendix B for a list of the zip codes contained within each HSA.
Also included in Appendix B are unadjusted rates for age, gender, and race/ethnicity sub-populations.
The inclusion of these rates in the Findings discussion is limited due to uncertainties in the comparability
of these unadjusted rates with the risk-adjusted rates.
All rates are based upon patient residence, and values were suppressed if there were fewer than 10
cases. Population estimates are based on the U.S. Census Bureau, Population Division, Intercensal
Estimates of the Resident Population for Counties of Hawaii and Hawaii State Department of Health,
Office of Health Status Monitoring, Hawaii Health Survey. Sub-county demographic counts are based on
estimates/projections provided by Pitney Bowes Business Insight, 2008-2011. Population estimates by
race were provided by the Hawaii State Department of Health, Office of Health Status Monitoring,
Hawaii Health Survey 2009-2010.
Hospitalization rate area maps were created by HCI using HHIC-provided Hospital Service Area maps,
where darker shading of Hospital Service Areas reflects higher rates.
2.3 Key Informant Interviews
In order to supplement the quantitative findings, key informants were interviewed to further assess the
underlying drivers for health outcomes, current community efforts, and obstacles to health. These key
informants were chosen by the HAH Advisory Committee on November 7-8, 2012 through a structured
nomination and selection process, which followed a thorough review of the preliminary core indicator
data. Advisory members nominated community members with expertise in public health, in the top ten
topic areas from the core indicator analysis, as well as in those topic areas where there were data gaps.
Key informants were also nominated for their knowledge of vulnerable populations, such as low-income
13or more adversely impacted racial/ethnic groups. After the nomination process, the advisory members
prioritized the list through a voting process.
The key informant interview process was part of a larger state-wide CHNA effort in which a total of 105
community experts were nominated, then prioritized down to a list of 75. The remaining 30 nominated
key informants were maintained on an alternate list, in the event that a key informant was not available.
Roughly 15 key informants were allotted for each of the four counties and for the overall state
perspective. For this Maui County report, 11 key informants were interviewed for their specific
knowledge of the health needs of this community; four informants represented Molokai, one discussed
Lanai, and the remaining six had knowledge of Maui. When certain topic areas were lacking an interview
specific to Maui County, findings from the state-wide perspective were included.
The interviews were conducted by local consultants, Storyline Consulting. The interviews took place
between November 19, 2012 and January 2, 2013 and lasted 30-60 minutes in length. Storyline
subcontracted the Molokai and Lanai interviews to Ka Honua Momona International, which has existing
relationships with many of the local key informant nominees. Most interviews took place by phone; a
few took place in person. Storyline Consulting typed notes from the interviews during the conversation,
capturing the bulk of the conversation verbatim. Interview notes were then condensed and entered into
a data collection spreadsheet.
The information obtained from these interviews was incorporated into this report in three ways. A
summary qualitative analysis tool called a “word cloud” was produced using TagCrowd.com to identify
the most common themes and topics. Words or phrases that were mentioned most often display in the
word cloud in the largest and darkest font (see Figure 3.6). Next, input from the key informants was
included in each relevant topic area in Section 3.2. Lastly, any recommended community programs or
resources are referenced in Appendix D: Identified Community Resources.
A Key Informant Interview Guide was developed to guide the interviews. Storyline Consulting adapted
the interview guide to best suit Hawaii’s context, unique ethnic/racial profile, and culture. The questions
used in the guide are listed below:
Q1: Could you tell me a little bit about yourself, your background, and your organization?
Q2: You were selected for this interview because of your specialized knowledge in the area of
[topic area]. What are the biggest needs or concerns in this area?
Q3: What is the impact of this health issue on low income, underserved/uninsured persons?
Q4: Could you speak to the impact on different ethnic groups of this health concern?
Q5: Could you tell me about some of the strengths and resources in your community that
address [topic area]?
Q6: Are their opportunities for larger collaboration with hospitals and/or the health department
that you want us to take note of?
14Q7: What advice do you have for a group developing a community health improvement plan to
address these needs?
Q8: What are the other major health needs/issues you see in the community?
Q9: Is there anything else you’d like us to note?
2.4 Community Survey
An online survey was used to collect community opinions on the greatest health needs for Maui County.
The survey link was virally distributed by members of the HAH Advisory Committee and was posted on
several local websites, including www.HawaiiHealthMatters.org. The survey was open from November
28 to December 24, 2012. Because the survey sample is a convenience sample, it is not expected to be
representative of the population as a whole. Survey respondents provided select personal
characteristics, including gender, age, sex, and zip code of residence and whether or not the resident
works in the health field. Residents were asked to rank the top ten topic areas from the core indicator
analysis in order of importance for their community, as well as informing us about other topic areas of
concern. Respondents were also asked which racial/ethnic groups they felt experienced more health
problems than average. Lastly, there was an open-ended question asking the resident if there was
anything else they would like to share with us, in terms of health concerns in their community. Opinions
gathered with this survey are included in this report as highlights, called “Voices from the Community,”
in describing notable areas of need.
153 Community Health Needs Assessment Findings
3.1 Demographics
The demographics of a community significantly impact its health profile. Different ethnic, age, and
socioeconomic groups may have unique needs and take varied approaches to health. This section
provides an overview of the demographics of Maui County, with comparisons to the State of Hawaii and
the United States for reference. All estimates are sourced from the U.S. Census Bureau’s American
Community Survey unless otherwise indicated.
3.1.1 Population
In 2011, Maui County had a population of 156,693. As measured by the decennial Census, the county
had a population density between those of Hawaii and the U.S. While the county is home to just 11.4%
of the state’s population, Maui County grew at a faster rate than both the state and nation between
2000-2010.
Table 3.1: Population Density and Change
Maui County Hawaii U.S.
Population density,
133 persons/sq. mi 212 persons/sq. mi 87 persons/sq. mi
2010
Population change,
20.9% 12.3% 9.7%
2000-2010
*2010 U.S. Census
Age
As seen in Figure 3.1, the Maui County population is older than that of Hawaii and the rest of the
country, with a median age of 40.1 (compared to 38.5 for Hawaii and 37.3 for the U.S.). The 18-24 age
group in particular is much smaller, at just 7.5% of the total population. Conversely, the county’s 45-64
population (29.2%) is slightly larger than both the state and the nation.
Figure 3.1: Population by Age, 2011
16Racial/Ethnic Diversity
As seen in Figure 3.2, Maui County’s racial/ethnic makeup—and that of the state as a whole—differs
from the rest of the country. In the figure below, the race groups displayed to the left of the blue line
include residents reporting one race only, while residents reporting two or more races and
Hispanic/Latino ethnicity (of any race) are shown to the right of this line. The population in Maui County
reporting a race of White only makes up 33.9% of the population, compared to 25.0% in Hawaii and
74.1% in the U.S. Black/African American, Hispanic/Latino, and Other race/ethnicity groups are also
much smaller than the U.S. overall.
Figure 3.2: Population by Race/Ethnicity, 2011
The largest single non-White race group in Maui County is
Asian at 25.1%. The majority of the Asian population is Figure 3.3: Breakdown of Population
Filipino, as seen in Figure 3.3 (which includes all residents Reporting Race of Asian Only, 2011
reporting a race of Asian only regardless of Hispanic/Latino
ethnicity). Maui County also has much larger Native
Hawaiian/Other Pacific Islander (7.8%) and multiracial
populations (31.4%) than the rest of the country.
A higher percent of Maui County is foreign-born compared to
the U.S., but not to Hawaii. In 2006-2010, 15.8% of Maui County
was foreign-born, compared to 17.7% of Hawaii and 12.7% of
the U.S. overall. However, a substantially lower percent of Maui
County households were linguistically isolated compared to
both the state and nation: just 3.5% of households reported
that all of its members ages 14 and over had some difficulty
speaking English, contrasted with 6.2% of households in Hawaii
and 4.8% of households in the U.S.
173.1.2 Economy
Median household income in 2006-2010 for Maui County was $63,989, higher than the national value of
$51,914 but lower than the state’s $66,420. Per capita income in the county ($29,180) was higher than
both those of Hawaii ($28,882) and the U.S. ($27,334).
Maui County has lower levels of poverty than both the state and the nation, at just 8.9% compared to
the state’s 9.6% and the nation’s 13.8%. Within the county, poverty is concentrated on the island of
Molokai and around the North Shore of the island of Maui. Certain race/ethnicity groups are also more
affected by poverty, as seen in Figure 3.4. The Native Hawaiian/Other Pacific Islander and
Hispanic/Latino populations have the highest poverty rates at 14.8% and 11.9% respectively. The two
least impoverished groups are American Indian/Alaska Native (0.0%) and Asian (3.9%). It is important to
note that federal definitions of poverty are not geographically adjusted, so the data may not adequately
reflect the proportion of Hawaii residents who struggle to provide for themselves due to the high cost of
living in the state.
Figure 3.4: Poverty by Race/Ethnicity, 2006-2010
3.1.3 Education
A greater proportion of Maui County residents aged 25 and older have at least a high school degree
(88.7%) compared to the U.S. overall (85.0%). However, the county falls short of meeting the state value
of 89.8%. Maui County also has a lower percentage of adults aged 25 and older who have a bachelor’s
degree or higher, compared to both the state and the nation, at just 25.7%; 29.4% of Hawaii and 27.9%
of the U.S. have at least a bachelor’s degree.
183.2 Overview of Needs Assessment
Secondary Data Summary
Ninety-five indicators of health drivers and outcomes were included in the systematic review of
secondary data. Table 3.2 shows the weighted ranking scores for each topic area, from most severe to
least.
Table 3.2: Core Indicator Summary Scores
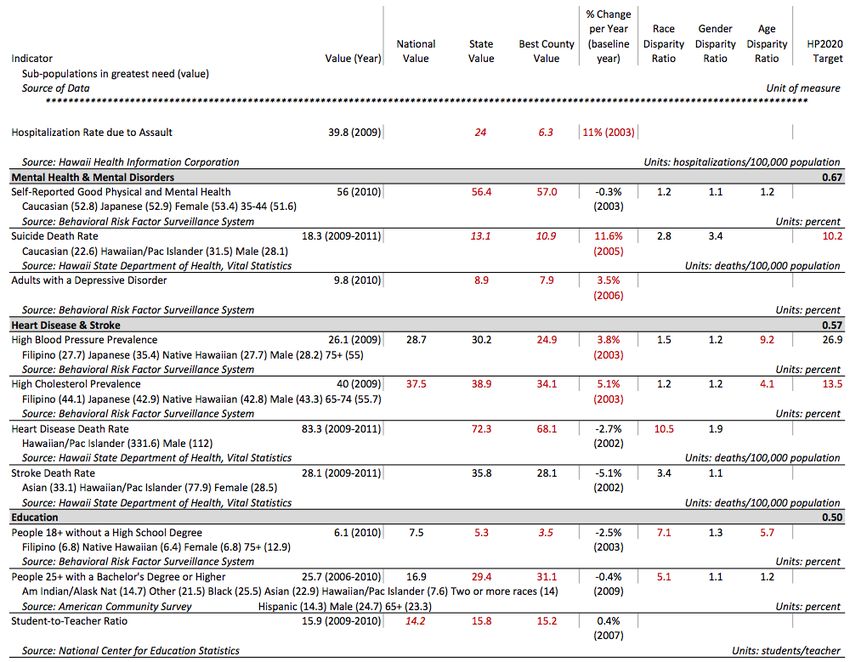
Topic Area Indicators Score Rank
Respiratory Diseases 2 1.00 1
Injury Prevention & Safety 10 0.68 2
Mental Health & Mental Disorders 3 0.67 3
Heart Disease & Stroke 4 0.57 4
Education 3 0.50 5
Immunizations & Infectious Diseases 7 0.47 6
Family Planning 3 0.44 7
Access to Health Services 3 0.44 7
Substance Abuse & Lifestyle 3 0.40 9
Transportation 3 0.40 9
Cancer 12 0.29 11
Exercise, Nutrition, & Weight 10 0.22 12
Economy 13 0.19 13
Oral Health 4 0.15 14
Maternal, Fetal & Infant Health 8 0.09 15
Environment 4 0.00 16
Diabetes 1 n/a n/a
Disabilities 0 n/a n/a
Older Adults & Aging 1 n/a n/a
Social Environment 1 n/a n/a
The ranking of scores for the topic areas provides a systematic way to assess a large number of
indicators across many topic areas. Because the absolute and relative scores are influenced by the
number of available inputs for the scoring equation, scoring differences can arise due to availability of
data, so it is important to consider the scores in the context of the primary data and the
interrelatedness of many of the topic areas. Findings of both quantitative and qualitative nature are
presented below by topic area, along with a discussion of what can be learned from these results. For a
complete list of indicators included in the core indicator summary, see Appendix A.
Hospitalization Rates
Risk-Adjusted Hospitalization Rates due to Preventable Causes in Maui County for the most recent year
available, 2011, are presented in Table 3.3. The specific causes of hospitalization with the three highest
overall rates are Mental Health, COPD or Asthma in Older Adults, and Heart Failure. Prevention Quality
Indicator (PQI) Composite Rates are a summary of preventable causes as described in the table
footnote. Specific causes of hospitalization are further discussed in applicable topic areas below. All
hospitalization rates are listed in Appendix B.
19You can also read