KENTUCKY State Health Improvement Plan 2017 2022 - Cabinet for Health ...
←
→
Page content transcription
If your browser does not render page correctly, please read the page content below

KENTUCKY
State Health Improvement Plan
2017 - 2022
Acknowledgements
The Kentucky Department for Public Health is grateful to those from the statewide stakeholders
group who aided in the development of this State Health Improvement Plan. This document is a
statewide effort of ideas and aspirations. Many have generously donated their time and provided
invaluable insight and direction to the development of this plan’s goals and strategies.
Contributions from staff at the Cabinet for Health and Family Services and citizens of the
Commonwealth of Kentucky all are recognized for going above and beyond their already busy
work schedules to make this project a reality. The Department especially acknowledges the
Kentucky State Health Improvement Plan Committee and the focus workgroup chairs who
facilitated meetings that provided the foundation for this plan. It would not have been possible
without their effort and continued dedication to improving the health of Kentuckians.
The following persons deserve special recognition for their contributions to this document:
Gary Kupchinsky, MHA
Benita Decker, RN
Nicole Barber-Culp, BA
Vivian Lasley-Bibbs, MPH
Connie Gayle White, MD, MS, FACOG
Medina Tipton, MHA
Ariel Arthur, BA
Lindsey Robertson, BS
Jeffrey D. Howard, MD
Sarojini Kanotra, PhD, MPH
Judes Boulay, MPH
Deb Colston, BS
Erin Hester, MA
Suggested Citation:
State Health Improvement Plan Committee. Kentucky State Health Improvement Plan 2017- 2022.
Frankfort, KY: Cabinet for Health and Family Services, Kentucky Department for Public Health;
2017.
Published:
September 1, 2017
Revised:
April 16, 2018
1
KENTUCKY STATE HEALTH IMPROVEMENT PLAN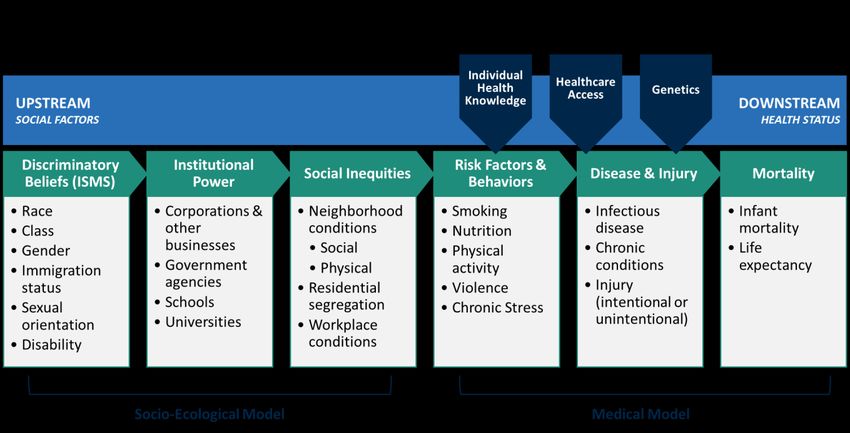
Executive Summary
In an effort to overcome the health problems that ail the commonwealth, the Kentucky
Department for Public Health performed a State Health Assessment. This report evaluated
available data on target areas of concern in our state, and was presented at “Planning with
Partners to Improve Kentucky’s Health,” a symposium of numerous stakeholders across multiple
disciplines, on March 22, 2017. During this symposium, the stakeholders identified focus areas
that need attention to improve health outcomes in Kentuckians. Using the State Health
Assessment data, the group chose the following focus areas for Kentucky to target over the next
five years:
Substance Use Disorder
Smoking
Obesity
Adverse Childhood Experiences
Integration to Health Access
Also of primary concern were the fabric issues, or topics that are deeply intertwined with each of
the aforementioned focus areas. The fabric issues include:
Data Collection and Analysis
Health in All Policies
Economic and Community Engagement/Development
Environmental Health
Mental Health
Workgroups composed of health leaders from across the state and multiple areas of healthcare
have met to evaluate the five focus areas in greater depth and contributed to the production of
this document. Goals, with strategies and measurable outcomes, are presented here to guide the
work of all interested Kentuckians over the next five years. Working as a team of citizens, we can
begin to reverse the years of poor health outcomes and focus on a better atmosphere for our
future.
2
KENTUCKY STATE HEALTH IMPROVEMENT PLAN
Table of Contents
Acknowledgements ............................................................................................................................ 1
Executive Summary ............................................................................................................................ 2
Table of Contents ............................................................................................................................... 3
Mission and Vision Statements .......................................................................................................... 4
Kentucky at a Glance .......................................................................................................................... 5
Connecting to the Community ......................................................................................................... 12
State Health Assessment .................................................................................................................. 14
Health Equity as a Framework .......................................................................................................... 15
Fabric Issues...................................................................................................................................... 20
Areas of Focus to Improve Health Outcomes .................................................................................. 20
           Substance Use Disorder........................................................................................................ 23
           Smoking ................................................................................................................................ 31
           Obesity .................................................................................................................................. 39
           Adverse Childhood Experiences ........................................................................................... 47
           Integration to Health Access ................................................................................................ 52
Call to Action..................................................................................................................................... 59
State Health Improvement Plan Contributors ................................................................................. 63
Acronyms .......................................................................................................................................... 68

                                                                          3

                                               KENTUCKY STATE HEALTH IMPROVEMENT PLAN
Mission and Vision Statements
Mission Statement
To improve the health and safety of people in
Kentucky through Prevention, Promotion and
Protection.
Mission Statement
To deliver quality services that enhance the health,
safety, and wellbeing of all people in the
Commonwealth of Kentucky.
Vision Statement
To become a recognized national leader in state-
level health and human services through continuous
quality improvement and accountability by:
Improving health and human services delivery
through quality customer service
Promoting individual self-sufficiency and
community sustainability for the betterment
of vulnerable populations
Fostering higher health awareness through
education and public information that
engages all individuals and communities
Enhancing use of technology to increase
service efficiency and effectiveness
Educating, empowering, and deploying a
highly skilled diverse workforce
Enhancing business practices to maximize
resources.
4
KENTUCKY STATE HEALTH IMPROVEMENT PLANKentucky at a Glance
Kentucky, known as the “Bluegrass State” for the deep hue of its pasturelands, is most notable for
its rich coalfields, fast racehorses, fine bourbon, and superior collegiate basketball. The state,
because of its fertile lands and streams, was a game territory for Native Americans prior to being
settled by Europeans in the early 1700s. Kentucky history and culture is richly adorned with the
pioneer spirit, which may be traced back to the great Daniel Boone.
Kentucky is home to the nation’s greatest length of contiguous navigable waterways, the nation’s
largest cave system, and two of the largest man-made lakes east of the Mississippi. Kentucky is
the nation’s leader in bourbon production and the state is also a leading producer of cattle,
burley tobacco, coal, automobile parts, and satellites.
Kentucky is proud of its heritage as a pioneer in health care. In 1925, Frontier Nursing Service
(now University) was established in Hyden, Kentucky as the national birthplace of midwifery and
family nursing training. In 1974, the first Women, Infants and Children (WIC) clinic in the country
was opened in Pineville. Moreover, Kentucky is home to Dr. Joseph N. McCormack, Kentucky
Public Health Commissioner from 1878 to 1919 and one of the founding fathers and early
presidents of the Association of State and Territorial Health Officers (ASTHO).
Demographics
• Population: 4,339,376 (26th among all states)
• Less diversity by race/ethnicity than other state:
• White – 87.8%
• Black – 7.8%
• Hispanic or Latino – 3.1%
• Asian, Hawaiian, Pacific Islander – 1.2%
• The current population in Kentucky has grown 7.4% in the last 10 years. The white population has
increased by 6% while the black population has increased 14% in the last 10 years.1
• In the 2010 census, 58% of Kentucky’s population lived in cities, up from 55.8% noted in the 2000
census.2
1
2010 Census Results, Kentucky. United States Census Bureau.
2
Decennial Census, United States Census Bureau.
5
KENTUCKY STATE HEALTH IMPROVEMENT PLANEconomics
• Fifth poorest state in the nation (median household income):1
• Kentucky percentage living below the poverty level – 18.5%
• US percentage living below the poverty level – 14.3%
• 25% of children in Kentucky live in poverty.2
• The average household income in Kentucky is $42,387 (2015).1
• Kentucky’s unemployment rate is 5.1%, compared to the national average of 4.4%.3
• 96 of Kentucky’s 120 counties experienced an increase in their unemployment rate (2017).
1
US Census Bureau, “American FactFinder Results”. Factfinder2.census.gov. Retrieved 28 July 2017.
2
US Census Bureau, 2007-2011 American Community Survey.
3
US Bureau of Labor Statistics. Local Area Unemployment Statistics.
Housing
• 11 per 10,000 households (4,538 people) in Kentucky are homeless family
households – either sleeping outside, sleeping in emergency shelters or
staying in transitional housing programs.1
• Nationally, 17.7 families per 10,000 households are homeless.1
1
National Alliance to End Homelessness. Homelessness Research Institute. The State of
Homelessness in America 2016.
Aging
• In 2010, there were 829,193 persons aged 60 and older in the
commonwealth, comprising 18.8% of the total population. This is projected
to increase to 25.6% by 2030. 1
• Kentucky ranks 50th in health outcomes for seniors.2
1
Kentucky Institute for Aging. The State of Aging 2015 Report of the Institute of Aging.
2
United Health Foundation. America’s Health Rankings Senior Report 2017.
6
KENTUCKY STATE HEALTH IMPROVEMENT PLANDisability
• As of 2012, 16.9% of Kentuckians living at home qualify as disabled.1
• The largest percentage of Kentuckians with disabilities have a cognitive
disability among both employed and unemployed individuals.2
• Kentucky ranks fourth in the nation for persons ages 65 and over with a disability.3
1
Kraus, Lewis. (2017). 2016 Disability Statistics Annual report. Durham, NH: University of New Hampshire.
2
Cornell University. Disability Statistics – 2015 Disability Status Report Kentucky.
3
Kentucky Institute for Aging. The State of Aging 2015 Report of the Institute of Aging.
Educational Achievement
• In 2016, only 9.3% of Kentuckians had achieved an advanced college degree.
• Only 22% of Kentuckians have a bachelor’s degree.
• At least 23% of Kentuckians have had some college credits.
• 13.5% of all Kentuckians have not graduated from high school.1
• In 2013, the Kentucky legislature amended KRS 159.010, to raise the compulsory school
attendance age to 18. Rolling implementation has been ongoing and will be in effect in
all districts in 2017. It is expected that this legislation will increase the state’s high
school graduation rate.
1
US Census Bureau. Factfinder.census.gov. 2012-2016 American Community Survey 5-Year Estimates.
Access to Healthcare
• Kentucky’s uninsured rate is 7.3%, while the national average of uninsured
persons per state is 10.8%.1
• Approximately, 30% of Kentuckians are covered by Medicaid.
• There were an estimated 120.6 primary care physicians for every 100,000
Kentuckians in 2017.2
1
US Census Bureau. Health Insurance Coverage in the United States: 2016.
2
American Association of Medical Colleges. 2015 State Physician Workforce Data Book.
7
KENTUCKY STATE HEALTH IMPROVEMENT PLANMaternal and Child Health
• From 2006 to 2016, the infant mortality rate in Kentucky declined from 7.8
to 6.3 per 1,000 live births.1, 2 The national rate was 5.9 in 2015.2
• In 2015, the infant mortality rate among black infants (10.8 per 1,000 live
births) was nearly twice the infant mortality rate of white infants (6.6 per
1,000 live births).3
• Neonatal abstinence syndrome (NAS) has increased from 179 cases in 2006
to 1,092 in 2015, a more than six-fold increase.2
• The percent of Kentucky women who smoked during pregnancy has declined from 26.1% to
19.5% (2000 to 2015).4, 5 However, this is more than double the 2014 US rate of 8.4%.
• Kentucky ranks 43rd in the nation for obesity among high school students in 2015.4
1
Kentucky Office of Vital Statistics, Death Certificate and Birth Certificate Files, 2006 – 2016. (Note: 2016 numbers
are preliminary and may change).
2
Centers for Disease Control and Prevention. National Center for Health Statistics. Infant Mortality Rates by State.
3
Kentucky Injury Prevention Research Center, 2017. Data source: Kentucky Inpatient Hospitalization Claims Files.
Cabinet of Health and Family Services. Office of Health Policy.
4
Infant Mortality. Annie E. Casey Foundation. KIDS COUNT data center. Infant mortality by race.
5
Trust for America’s Health. The State of Obesity: Better Policies for a Healthier America. Released August 2017.
Access to Food and Food Insecurity
• 15.8% of Kentucky households, or 399,590 individuals report food
insecurity – defined by the US Department of Agriculture as a measure of
lack of access, at times, to enough food for an active, healthy life for all
household members.1,2
• 20.0% of Kentucky children are food insecure (202,050 children).,2
• 11 Kentucky counties have childhood food insecurity rates of 30% or
higher.1
1
Economic Research Service/USDA. Household Food Security in the United States in 2016, ERR-237.
2
Feeding America. 2017 Map the Meal Gap: Highlights of Findings for Overall and Child Food Insecurity. Retrieved
on Nov 2018 http://map.feedingamerica.org/county/2015/child/kentucky.
8
KENTUCKY STATE HEALTH IMPROVEMENT PLANSuccesses with Improving Health
This plan focuses on improving the health of Kentucky and thus areas for improvement, but we
would be remiss if the report did not mention a few of our many successes. More details are
provided in the section, “Focus Areas for Improving Health of Kentuckians.” For example:
The legislature authorized harm reduction syringe exchange programs with local approval
by boards of health and local government to curb the spread of associated infectious
diseases.
As of May 2017, over 50% of Kentucky students attend tobacco free school districts.
Kentucky has 52 communities with adopted pedestrian and bicycle plans, 63 communities
working on Safe Routes to Schools and 17 communities designated as Trail Towns.
As of August 2017, 90 elementary schools in 28 districts have begun teaching about drug,
alcohol and tobacco to their students.
Kentucky has significantly increased the number of preventive screenings (i.e., dental
visits, cervical cancer, breast cancer, colorectal cancer) performed among Medicaid
enrollees.
Challenges with Health Behaviors and Health Outcomes
Despite ongoing efforts, Kentucky’s health rankings have changed little over the last 16 years
according to America’s Health Rankings (Figure 1). The state has ranked 40th or below in America’s
Health Rankings for 25 of the last 26 years; in 2017, Kentucky hovered at 42nd for overall health
ranking. In the area of health outcomes, Kentucky ranks high in cancer deaths, high for preventable
hospitalizations, and high in cases of acute hepatitis C infection (Table 1). Changing the deeply
ingrained health culture to one that emphasizes preventive care has been a challenge; however,
progress has been steadily achieved.
The 2016 Kentucky Behavioral Risk Factor Surveillance System (KyBRFS) demonstrates the
following:
24.5% of adults are current smokers, which ranks 49th overall. The national average is
17.5%.
19.5% of mothers smoked during their pregnancy, a decline from 26.1% in 2000. In 2014,
the national average was 8.4%.
29.8% of adults report physical inactivity, which is 6.7% greater than the national average.
Kentuckians report having experienced 4.6 days of poor mental health in the last 30 days,
which is 0.8 days (i.e., < 15 hours/30 days) greater than the national average.
9
KENTUCKY STATE HEALTH IMPROVEMENT PLANFigure 1. Kentucky's Overall National Health Ranking reported from America’s Health Rankings (1990-2017).
While most of Kentucky’s average health outcome rates are far below the national average, data
from KyBRFS shows that Kentuckians with lower educational achievement (less than high school
completion vs. college graduate) and with lower annual income (less than $25,000 annual
household income vs. $50,000 or more) suffer from:
Up to three times higher rates of diabetes
Double the rate of coronary artery disease
Over four times higher rates of poor health habits (i.e., smoking)
Triple the number of reported poor mental health days
These numbers are troubling considering that Kentucky is home to five of the 13 counties in the
nation with the lowest median annual household incomes.1 Approximately 25% of Kentucky
children live in households with income below the national poverty level and 12% live in extreme
poverty meaning that they live in a household with income 50% of the poverty level.2
As is true in many states, Kentucky has been affected by the opioid epidemic. The Centers for
Disease Control and Prevention (CDC) ranks Kentucky third overall in the number of opioid
overdose deaths as of 2015. In a recent report, the CDC named 220 counties in the United States
that are at-risk for a rapid HIV outbreak related to the injected drugs. Kentucky, primarily in the
eastern portions, is home to 54 of those 220 counties.
1
United States census. Small Area Income and Poverty Estimates (SAIPE) Program, SAIPE State and County Estimates
for 2015.
2
2017 KIDS COUNT Data Book, The Annie E. Casey Foundation.
10
KENTUCKY STATE HEALTH IMPROVEMENT PLANRanking Measure Values from 2017 Report
Substance Use Disorder
9th Drug Dependence or Abuse – Youth 4.1% of children aged 12-17
49th Drug Deaths 25.5 deaths per 100,000
Smoking
49th Smoking – Adults 24.5%
47th Tobacco Use – Youth 9.6% of children aged 12-17
46th Tobacco Use – Pregnant Women 19% of live births
50th Cancer Deaths 233.6 per 100,000
Obesity
44th Obesity – Adults 34.2%
38th Overweight or Obese – Youth 33.5% of children aged 10-17
46th Persons Diagnosed with Diabetes 13.1%
46th Physical Inactivity – Adults 29.8%
44th Breastfed 18.5% of infants exclusively for 6 months
Adverse Childhood Experiences
42nd ACE Scores > 2 26.9% of children aged 1-17
38th Children in Poverty 20.7%
38th Infant Mortality 6.9 deaths per 1,000 live births
38th Low Birthweight 8.7% of live births
46th Have a Protective Home Environment 31.4% of children aged 0-5*
44th Have a Protective Home Environment 16.3% of children aged 6-17*
44th Teen Births 32.4 per 1,000 women aged 15-19
8th Homeless Family Households 3.0 per 10,000 households
16th Unintended Pregnancies 47.0% of pregnancies*
45th Food Insecurity 17.3% of households
Integration of Health Access
40th Primary Care Physicians 120.6 per 100,000
76.8 discharges per 1,000 Medicare
50th Preventable Hospitalizations
enrollees
47th Premature Deaths 10,042 years lost per 100,000
9th Lack of Health Insurance 5.6% of total population
25th Dentists 54.6 per 100,000
Table 1. Examples of Kentucky Rankings from America's Health Rankings Report (2017)
*America’s Health Rankings 2016 – most recent data available
11
KENTUCKY STATE HEALTH IMPROVEMENT PLANConnecting to the Community
On March 22, 2017, the Kentucky Department for Public Health (DPH) convened a meeting of
stakeholders inclusive of public health advocates and a varied group of citizens. The attendees
included representatives from local health departments, colleges and universities, professional
organizations, faith-based organizations, mental health community, legislators, civic groups,
managed care organizations, non-profit organizations, and hospital organizations. The goal of this
meeting was to present the 2017 State Health Assessment Update (SHA) and to develop goals for
this State Health Improvement Plan (SHIP).
This meeting was facilitated by Angela Carman, DrPH, Associate Dean for Practice and Workforce
Development with the University of Kentucky College of Public Health, and included an overview
of Public Health 3.0, which sought to engage multiple sectors and community partners to generate
collective impact and improve social determinants of health. Dr. Carmen presented a review of the
Community Health Improvement Plans (CHIPs) that Kentucky local health departments have
adopted to help assure alignment between state and local goals. The most recognized strategic
initiative in the CHIPs was substance use disorder followed closely by obesity. DPH then provided
a presentation on Adverse Childhood Experiences and the data supporting the SHA.
All stakeholders divided into smaller workgroups to review the data and collectively determine
what critical areas Kentucky should focus our resources on in order to improve health outcomes.
Each workgroup presented to the assembly. After a dynamic discussion, the larger assembly
identified five priorities through collective impact:
Substance Use Disorder
Smoking
Obesity
Adverse Childhood Experiences
Integration to Health Access
Additionally, the group identified five underlying topics that were interwoven throughout each of
the five priority focus areas. Although these fabric issues emerged as secondary priorities, each
could stand alone as a priority because of their inter-connectedness with each of the broader
focus areas. Workgroups related their own goals and strategies back to these fabric issues:
Data Collection and Analysis
Health in All Policies
Economic and Community Engagement/Development
Environmental Health
Mental Health
12
KENTUCKY STATE HEALTH IMPROVEMENT PLANBefore dismissing, workgroups outlined their strategy for developing these focus areas to provide
goals and measureable strategies that Kentucky can achieve in the next five years. For the next
three months, these stakeholders would participate in routine in-person and telephone
conferences to prepare goals, strategies, and measurements that support the five focus areas. The
Kentucky SHIP Committee used the information from these sessions to produce this document.
The workgroups anticipated that they would continue to regularly meet and update one another
on the status of the goals, strategies, and measures. Over the next five years, they plan to
convene and refine Kentucky’s work plan for improved health.
The workgroups presented a thorough understanding of each of their focus areas, and developed
significantly more content than could be presented in the SHIP. The information on these individual
focus topics were of such importance, the SHIP Committee has recommended that each
workgroup produce a supporting document for each of their focus areas that will separately
support the work being done in the commonwealth currently, analyze more data to support that
work, and discuss initiatives needed to improve our health outcomes.
A summary of the “Planning with Partners to Improve Kentucky’s Health” meeting can be found
by visiting: http://chfs.ky.gov/NR/rdonlyres/A6742868-0B36-4341-B2AE-
1D0E99CB0A29/0/DPHPlanningwithPartners.pdf.
13
KENTUCKY STATE HEALTH IMPROVEMENT PLANState Health Assessment
In 2013, DPH completed a comprehensive state health assessment (SHA). More than 1,300
Kentuckians responded to an electronic survey, which served to identify Kentucky’s priority health
issues. The top ten health issues perceived were access to care, obesity, drug and alcohol, cancer
(all kinds), tobacco use, mental health, diabetes, maternal and child health, heart disease and
stroke, and physical activity.
In 2017, DPH released a SHA Update. This data stands in support of the 2013 assessment in many
areas. However, several emerging health issues have been identified and require further analysis.
One such example is rising rates of hepatitis C infection. The 2017 State Health Assessment
Update may be found at http://chfs.ky.gov/NR/rdonlyres/490FEA8C- 0C46-47F8-8CE5-
CDAF970E1190/0/The2017KentuckyStateHealthAssessmentUpdate31517.pdf.
14
KENTUCKY STATE HEALTH IMPROVEMENT PLANHealth Equity as a Framework
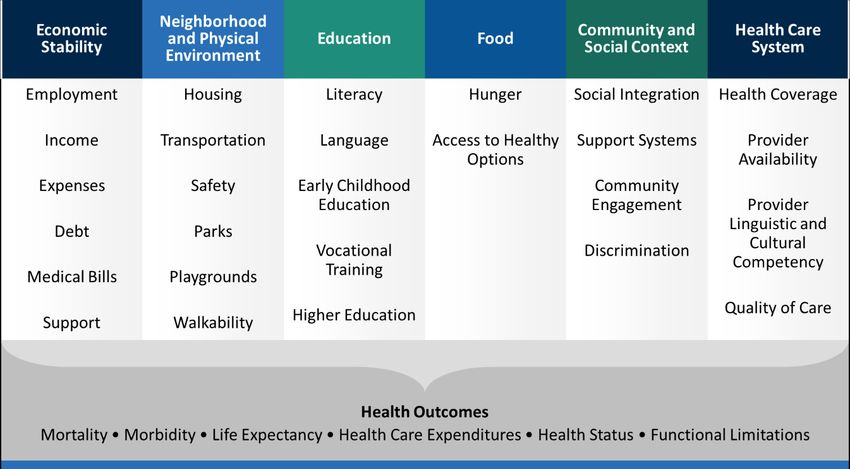
Social determinants of health (SDOH) are defined in Healthy People 2020 (HP2020) as “…the
conditions in which people are born, live, work, and age that affect their health.” 1
SDOH include socioeconomic status, educational achievement, locality, employment, access
to care, and other factors as shown in Figure 2. Health literature has effectively demonstrated
the association between SDOH and adverse health outcomes. Achieving health equity will
require addressing these SDOH through population-based and targeted methods focused on
the areas with the greatest need. Targeting disparities and inequities among the SDOH
provides an opportunity to greatly improve the commonwealth’s overall health.
Health equity is defined as “…the attainment of the highest level of health for all people.” 1
To accomplish this, we must strive to eliminate the inequities, which are unfair, or unjust
differences in health outcomes between populations based on race, ethnicity, gender,
income, locality, or other social conditions. These inequities are often rooted in social
injustices, both conscious and unintentional, which render individuals and populations
vulnerable to adverse health outcomes.
Figure 2. Social determinants of health. Adapted from the Kaiser Family Publication regarding the SDOH, found by visiting:
http://www.kff.org/disparities-policy/issue-brief/beyond-health-care-the-role-of-social-determinants- in-promoting-
health-and-health-equity/
15
KENTUCKY STATE HEALTH IMPROVEMENT PLANIntroduction
Traditional approaches to improving health outcomes have focused on providing everyone with
the same resources and healthcare services. Emerging evidence and trends have shown that not
all populations benefit from this “one size fits all” approach. Population-based strategies that
account for the unique differences within populations and communities are more effective for
improving public health.1 Using an equity framework to address the SHIP focus areas is a tool that
will help ensure that all Kentuckians have an opportunity to live long, healthy, and productive lives
regardless of income, education, gender, or race/ethnicity. The Kentucky Department for Public
Health and stakeholders have recognized the relationship between equity and health outcomes
and are committed to reducing social inequities in each of the five focus areas.
Many opportunities exist in Kentucky to promote health equity. Socioeconomic factors, such as
extensive poverty and poor educational achievement, along with other social indicators, such as
access to care and food insecurity, provide opportunities to create a culture of health in all
communities across the commonwealth.
Achieving health equity for the diverse communities across the state is possible. KyBRFS and other
data sources have identified existing disparities among diverse populations defined by race and
ethnicity, gender, and geography. Policy and practices at the institutional and organizational levels
also impact inequities and must be included in efforts to improve health and health outcomes.
Public health has historically addressed health disparities by focusing on the risk factors for
disease and conditions using the medical model as the context. Using a Framework of Health
Equity (Figure 3) shifts the focus to social factors such as schools, neighborhoods, workplaces,
gender, and class. The Framework of Health Equity provides a structure to focus on social and
ecological factors as major contributors that impact our health and health outcomes. This
Framework of Health Equity will serve as the lens through which each priority focus area is
examined.
Substance Use Disorder
Like much of the nation, Kentucky is affected by the opioid epidemic. In 2016, over 1,400 Kentucky
deaths were reported due to overdose and more than 70,000 survived an overdose event. Despite
education and awareness efforts, increase in harm reduction strategies and many other efforts,
these numbers continue to increase.
SDOH such as low socioeconomic status, unemployment, no social cohesion, and hopelessness
have been linked to the development and propagation of substance abuse. In addition, research
also observes that geographic location, poverty, and educational attainment are associated with
this pervasive disorder. These inequities must be addressed if we are to truly impact the opioid
and substance use disorder epidemic in the state.
16
KENTUCKY STATE HEALTH IMPROVEMENT PLANFigure 3. Framework for Health Equity adapted by ACPHD from the Bay Area Regional Health Inequities Initiative (Summer 2008).
Smoking
Disparities also exist in tobacco use among racial ethnic groups in Kentucky. Although black
residents initiate smoking later and smoke fewer cigarettes than their white counterparts, they
are more likely to die from smoking related diseases.2,3,4 Persons in Appalachia when compared
to non-Appalachian residents are also disproportionately impacted having higher mortality rates
from lung cancer and other smoking related diseases.4,5 Addressing these inequities through
evidence-based interventions will help reduce the morbidity and mortality from tobacco use and
exposure in these disparate populations. Children in Kentucky who experience adverse childhood
experiences (ACEs) are more likely to use tobacco as adults3. Prevention and cessation strategies
must account for the unique challenges, assets, and intersections of identities within Kentucky
populations disproportionately impacted by tobacco.
Socioeconomic status is highly associated with smoking prevalence. Low-income adults and adults
with low educational attainment are more likely to be current smokers, and less likely to have
successful quit attempts6. In Kentucky, the prevalence of cigarette smoking among adults with an
annual household income below $25,000 is 42.2%, compared to 19% for those with an income of
$50,000 or more. The smoking rate among adults with less than a high school education is 45%,
compared to 10.5% among college graduates.3
Significant disparities in smoking prevalence also exist between lesbian, gay, bisexual and
transgender (LGBT) individuals and their heterosexual counterparts. In Kentucky, the smoking
prevalence among the LGBT population in 2014 was 43.7%, compared to 25.8% among
heterosexual individuals.7
17
KENTUCKY STATE HEALTH IMPROVEMENT PLANObesity
Although obesity impacts the entire commonwealth, it disproportionately affects some
populations more than others. Residents in eastern Kentucky, persons with intellectual and
developmental disabilities (IDD), and racial and ethnic minorities experience an increased burden.
Inequities related to food insecurity, food deserts, lack of walkable communities, mobility status
and safety are all social indicators widening the disparity gap among certain geographical areas
and populations within the state. Many of our communities in eastern Kentucky as well as Black
and Hispanic populations throughout the state have limited access to care, limited income, and
other barriers that place them at greatest risk for poor health outcomes related to obesity.
Policies, institutional and structural barriers, and social norms that impact these communities need
to be addressed if a cultural shift is to occur providing a more equitable and healthy place for
disadvantaged individuals to live.
Obesity prevention efforts in Kentucky’s communities include a multi-sector approach identified in
the CDC, Health Impact in Five Years (HI-5). There are two interventions under Hi-5: 1)
Interventions Changing the Context and 2) Interventions Addressing the Social Determinants of
Health.
Adverse Childhood Experiences
Adverse childhood experiences (ACEs) are stressful or traumatic experiences occurring before age
18 that disrupt the safe and nurturing environments that children need to thrive. Social,
economic, and cultural factors can widen the disparity gap in populations affected by ACEs.
Research has shown an association between ACEs and health-related risk behaviors such as
substance use disorder, tobacco and alcohol use, pregnancy and paternity before age 20, and
eating disorders. Additionally, health outcomes such as cardiovascular disease, obesity, cancer,
and even premature death have been tied to ACEs.8 Current research is examining the impact of
ACEs in youth that are in the juvenile justice, education, and foster care systems. Current findings
suggest a disproportionate impact based on race, gender, and socioeconomic status. Though ACEs
are a relatively new focus in the public health field, there are many opportunities to prevent and
mitigate ACEs to reduce morbidity and mortality within the commonwealth and build resiliency.
Integration to Health Access
SDOH and equity are pressing issues related to health access. Our Kentucky team’s working
definition of integration to health access is “to ensure all Kentuckians have access to integrated
medical, dental, behavioral, and social services to improve and maintain their health through the
development of coordinated, multi-disciplinary systems of care.” Resources such as
transportation, the ratio of health care professionals, and the number of health care facilities have
to be considered on both micro and macro levels. To accomplish the goal of access to integrated
healthcare, a multidisciplinary approach is required. The population must know how to obtain the
18
KENTUCKY STATE HEALTH IMPROVEMENT PLANcare they need—where to go, the type of insurance plan and benefits available to them, and how
to use their insurance. Additionally, we cannot dismiss the importance of building community
trust with healthcare providers as well as health systems. Establishing those relationships among
the people who live and work in a community is critical to improving access and enabling everyone
to be a key agent of change, improving not only their health, but the health of their
community. The identification of community leaders to work with both traditional and non-
traditional health care delivery systems can help to create innovative and targeted solutions.
Summary
For each focus area above, we examined the underlying SDOH, which may be found in the
preceding subsections and are summarized in Figure 4 below.
Figure 4. Social determinants of health as defined in the five focus areas of the SHIP.
1
U.S. Department of Health and Human Services. “The Secretary’s Advisory Committee on National Health Promotion
and Disease Prevention Objectives for 2020. Phase I report: Recommendations for the framework and format of
Healthy People 2020. Section IV. Advisory Committee findings and recommendations.” (2008).
https://www.healthypeople.gov/sites/default/files/PhaseI_0.pdf Accessed August 17, 2017.
2
Kentucky Youth Risk Behavioral Survey (YRBS). Kentucky High School Survey, 2014.
3
Kentucky Behavioral Risk Factor Surveillance System (KyBRFS), 2015
4
Kentucky Cabinet for Health and Family Services and Kentucky Personnel Cabinet. The 2017 Diabetes Report.
Frankfort, KY: KY Cabinet for Health and Family Services, Department for Medicaid Services, Department for Public
Health, Office of Health Policy, and KY Personnel Cabinet, Department of Employee Insurance, 2017.
5
Age-Adjusted Cancer Mortality Rates by County in Kentucky, 2010 - 2014. Based on data released June 2016. Kentucky
Cancer Registry: Cancer Rates Info. Retrieved Jul 21, 2017, from http://cancer-rates.info/ky/
6
Gilman, S. E., Abrams, D. B., & Buka, S. L. (2003). Socioeconomic status over the life course and stages of cigarette use:
initiation, regular use, and cessation. Journal of Epidemiology & Community Health, 57(10), 802-808.
7
Kentucky Behavioral Risk Factor Surveillance System (KyBRFS), 2014
8
The Adverse Childhood Experiences (ACE) Study; Centers for Disease Control and Prevention. Retrieved Nov. 4, 2016.
19
KENTUCKY STATE HEALTH IMPROVEMENT PLANFabric Issues
During the March 2017 “Planning with Partners to Improve Kentucky’s Health” symposium,
stakeholders identified five focus areas for improving the health of Kentuckians. These five
domains were included in the State Health Improvement Plan (SHIP). In addition, five fabric issues
were also identified for attention. These issues consistently recurred during the conversation and
were woven directly into each of the focus areas such that, in order to accomplish the five focus
area goals, investigation of the fabric issues must also be undertaken.
Access to Data Collection and Analysis
Rapid advances in technology and the increasing need to validate programs has led to exponential
growth in data collection, storage, and interpretation in relation to healthcare applications. The
value of representative and accurate data and the ability to perform meaningful analysis is vital to
inform policy and regulation. Realizing the importance of this issue, the Cabinet for Health and
Family Services (CHFS) is undertaking the merger of numerous databases to improve policy and
program planning and to determine outcomes accurately.
Using technology to post dashboards of data, such as the dashboards planned for this SHIP, will
allow governmental staff, policy partners, and the public to access the data with greater ease.
Annual data review and analysis related to the five focus areas of the SHIP will help identify trends
and gaps in data and achievement and will help inform partners through multiple communication
methods. Many of the desired measures in each focus area currently do not have an established
baseline, which emphasizes the need for focused data gathering, sharing, and monitoring.
The CDC has amassed a comprehensive database of adult obesity rates, physical activity, and
nutritional habits of adults using the information from the annual KyBRFS telephone survey. The
Youth Risk Behavior Survey (YRBS) collected by the Kentucky Department of Education (KDE)
samples middle and high school students on similar data points. These data sources are critical to
decision making in the state, but do not provide the level of granularity that is necessary to fuel
change.
Data sources related to the opioid crisis in Kentucky have advanced rapidly, which reflects the
severity of Kentucky’s opioid crisis. The Kentucky Injury Prevention and Research Center (KIPRC)
has worked with the Justice Cabinet Office of Drug Policy to analyze data surrounding the state’s
opioid crisis. The Kentucky All Schedule Prescription Electronic Reporting (KASPER) tracks all
controlled substances prescribed in Kentucky and can analyze morphine milligram equivalent dose
(MME), prescribing by medical specialty and geographic area. The Kentucky Neonatal Abstinence
Syndrome Registry can be cross-referenced with the Childhood Fatality Review to determine
locations in need of more resources to prevent infant death. Yet, more information is needed to
develop predictive modeling of at-risk areas to shape policy and target interventions.
20
KENTUCKY STATE HEALTH IMPROVEMENT PLANThe CDC also has a robust database for tobacco use in Kentucky gathered via KyBRFS and YRBS.
The Kentucky Tobacco Quitline has a data collection component to evaluate use and successful
quit attempts, but more information from the public is not tracked.
Health in All Policies
In order to change our culture to one focused on health, it is critical that we emphasize that health
is the foundation of all activities, policies, and regulations. Health is interwoven in all activities of a
person’s life—work, play, eating, and sleeping. Some examples of health-focused policy include
smoke-free workplaces, opportunities for physical activity and the environment to safely move,
childcare with comprehensive staff training, healthy nutritional options, and the knowledge to
appropriately access quality health care.
Economic Development and Community Engagement
Kentucky’s SHA demonstrated a correlation between lower income levels and increased
prevalence of chronic disease and poor health habits. Communities with a lower economic status
are unable to focus resources on programs aimed to improve health outcomes; rather these
communities apply their limited resources to more immediate obstacles. This creates a vicious
cycle in which preventable problems multiply.
Environmental Health
Science continues to link our health and wellbeing to the surroundings where we live, work, and
play. A healthy society cannot be expected to prevail if it does not have clean air, good water
quality, lack of environmental contaminants, or if its surroundings are unsafe or improper for
physical activity. It is necessary that we evaluate our state’s environment and ensure that it is
conducive to developing and maintaining a healthy population.
Mental Health
Mental health is a foundational area for all five of the focus areas. Tobacco use and substance
abuse disorder incidence is greater in those with mental health disorders. Obesity is often a
symptom of underlying depression and results in poor self-esteem. Moreover, obesity may be the
side effect of mental health treatment medication. As noted in the Adverse Childhood Experiences
focus area discussion, stresses occurring during childhood have profound and lasting negative
mental health effects. Sadly, many with health coverage do not know how to use such benefits to
seek mental health care. Mental health and its associated sequelae must be at the forefront of our
approaches to remodeling healthcare and healthcare access in the commonwealth.
21
KENTUCKY STATE HEALTH IMPROVEMENT PLANAreas of Focus
to Improve Health Outcomes
22
KENTUCKY STATE HEALTH IMPROVEMENT PLANSubstance Use Disorder
Kentucky has been heavily afflicted by the opioid crisis, which is affecting much of our country.
Along with Pennsylvania, Ohio, Tennessee, and West Virginia, Kentucky was one of the first states
in which this indiscriminate disease reached epidemic proportions. No part of the commonwealth
is unaffected, but northern and eastern Kentucky, especially rural communities, have been most
plagued.
The progression from prescribed opioids to illegal street opioids (e.g., heroin) has been seen
throughout Kentucky. As evidence to this end, Kentucky has seen rather steep increases in heroin
overdoses in the last five years.1 The addition of fentanyl and carfentanil to the illegal drug market
further increased overdose deaths.
In 2016, Kentucky had over 1,400-overdose deaths.2 One of the goals of HP2020 is reduction of
drug-induced deaths. Addressing this epidemic is a top priority across all levels of Kentucky’s
infrastructure. While great strides have been made, much remains to be accomplished.
The Substance Use Disorder (SUD) Workgroup developed a three-pronged approach to assess
goals and strategies necessary to ending this crisis. Three subgroups of team members from
across the state were developed to focus attention on this three-pronged approach. These
include:
Prevention
Harm Reduction
Treatment
Many of our measures do not have a baseline as these areas have not been addressed in the past.
There is an emphasis in monitoring these areas as an opportunity for data collection and
establishing baselines for future goals.
23
KENTUCKY STATE HEALTH IMPROVEMENT PLANData
The Kentucky opioid data are staggering and the cost to human life and wellbeing is severe.
Second highest overall poisoning emergency department (ED) visit rate (majority were
drug-related) in 20141
Fifth highest drug overdose fatality rate in 20162
Third highest neonatal abstinence syndrome (NAS) rate in 20133
Over half of the opioid overdose ED visits were billed to Medicaid (57%), 16% were billed
to commercial insurance, and 11% were billed to Medicare1
Successes
The opioid crisis has infiltrated our population indiscriminately. All economic and social strata are
afflicted. The magnitude of this crisis has led to new alliances and partnerships. Our legislature has
passed innovative and strong legislation to help reverse this problem.4
Kentucky now has laws to eliminate the proliferation of “pill-mills” that allowed excessive
prescribing of opioids in non-quality medical settings.
The legislature authorized harm reduction syringe exchange programs with local approval
by boards of health and local government to curb the spread of associated infectious
diseases and offer those with SUD to be closer to the network of care and offer treatment
options.
New statutes were written that increased funding for the availability of intense outpatient
and inpatient treatment for SUD.
The number of SUD inpatient facilities for pregnant and parenting women with children
has increased fourfold.
Commonly known as a “Good Samaritan Law,” the legislature enacted a statute that
protects people from prosecution when they report a drug overdose. Calling 911 during an
overdose can mean the difference between life and death, but some witnesses had
avoided calling due to fear of arrest.
Kentucky Medicaid approved payment for peer support specialists to work with patients to
give assistance to those with SUD.
Increasing numbers of physicians have obtained a license to prescribe buprenorphine to
offer medication assisted therapy (MAT).
The number of Kentucky methadone clinics has doubled.
The Justice Cabinet is offering extended release naloxone to inmates prior to release and
planning case management to get them into MAT and mental health care after release.
Data collection techniques are continuing to strive for real-time information to guide
future initiatives.
24
KENTUCKY STATE HEALTH IMPROVEMENT PLANChallenges
Harm reduction strategies are becoming more accepted and employed throughout the
commonwealth. As a result, we are experiencing improvement is some outcomes associated with
intravenous drug abuse. However, these programs are not universally accepted. Gaining buy-in
remains a challenge.
Funding, from both public and private entities, has increased to help fight this epidemic. Kentucky
Medicaid has increased funding for addiction treatment, but more is needed. Naloxone distribution
has been very successful in Kentucky. However, the program needs more funds to meet the state’s
needs.
The progression from prescribed opioids to illegal street drugs is a growing problem now that
physicians have begun diminishing the prescribing of opioids over the last five years. A growing
partnership with law enforcement agents is necessary to both raise awareness and end the sale of
these deadly drugs in Kentucky.
Opportunities
The Commonwealth of Kentucky will continue to work toward enhancing the availability of
prevention, harm reduction, and treatment for all citizens.
Governor Bevin has launched the “Don’t Let Them Die” campaign, which will allow
multiple organizations to receive high visibility as they develop new and innovative means
to reach the SUD population as well as their families/friends.
Governor Bevin and the General Assembly have dedicated $32 million in this biennium to
address the opioid epidemic.
FindHelpNowKY.org, a patient treatment locator website, was launched in January 2018 to
work in conjunction with the Naloxone Locator website.
KASPER (Kentucky All Schedule Prescription Electronic Reporting) is ready to link non-fatal
overdose hospital data to a patient’s record of controlled substance prescriptions.
Kentucky received funding from the 21st Century Cures Act to fund the Kentucky Opioid
Response Effort (KORE), a multi-cabinet effort to focus on the SUD population of:
o Pregnant and parenting women
o Recently incarcerated individuals re-entering society
o Adolescents
o Those in a non-fatal overdose setting
1
KIPRC. Age-Adjusted Drug Overdose Mortality Rate, 2010-2015. http://www.mc.uky.edu/kiprc/injury-topics/drug-
overdose.html
2
Drug overdose deaths in the US, 1999–2016. NCHS Data Brief. www.cdc.gov/drugoverdose/data/statedeaths
3
Ko JY, Patrick SW, Tong VT, Patel R, Lind JN, Barfield WD. Incidence of Neonatal Abstinence Syndrome — 28 States,
1999–2013. MMWR Morb Mortal Wkly Rep 2016;65:799–802. DOI: http://dx.doi.org/10.15585/mmwr.mm6531a2
4
https://odcp.ky.gov/Pages/default.aspx
25
KENTUCKY STATE HEALTH IMPROVEMENT PLANGoals, Strategies, and Measures
[PREVENTION] GOAL 1: Promote early childhood education in kindergarten through fourth grade on personal development.
Strategy 1.1: Pilot programs in multiple counties to institute Measure 1.1.1: Decrease age at onset of any substance use
personal development in young children that stress the importance Baseline: 12.6 years of age (2016)
of physical activity, diet, and responsible decisions on avoidance of Target: 13 years (2022)
tobacco and drugs. Data Source: DPH; KDE, YRBS
Justification: Prevention begins with strong personal development in
children. Many children do not receive such guidance in their home
setting (see Adverse Childhood Experiences section). These programs
will work to increase resilience in our children.
[PREVENTION] GOAL 2: Decrease non-medical use of pain relievers in Kentucky.
Strategy 2.1: Promote techniques for private citizens to eliminate Measure 2.1.1: Increase number of community sponsored drug
unused drugs from their medicine cabinets through in-home take-back and in-home medication destruction programs
destruction programs and expanded take-back programs in police, Baseline: Unknown (2016)
fire departments, and pharmacies. Target: Establish baseline and double the number of programs
(2022)
Justification: Easy availability of medications in the home is known Data Source: Local Kentucky Agency for Substance Abuse Policy
to present opportunities that some use to initiate their SUD journey. (KY-ASAP), Justice Cabinet, Office of Drug Control Policy
Removing this easy access can curb the initiation of drug use.
.
26
KENTUCKY STATE HEALTH IMPROVEMENT PLANStrategy 2.2: Enhance education of healthcare professionals on Measure 2.2.1: Increase number of professional organizations
appropriate opioid prescribing. Engage professional boards that hold conferences (individual and collaborative) with focus
(medicine, dentistry, nursing) to collaborate in development of in- on substance use disorder
person and on-line educational opportunities consistent with their Baseline: Unknown (2016)
specialty organizations. Include techniques to educate the public on Target: Establish baseline and initiate at least one statewide
realistic expectations of adequate pain control vs pain-free. conference on opioid prescribing with collaboration among
health professional boards (2022)
Justification: Thoughtful opioid dispensation has been a focus of Data Source: DPH; Department for Behavioral Health,
national professional organizations as well as the CDC. A statewide Developmental and Intellectual Disabilities (BHDID)
effort would strengthen our collective knowledge in those that serve
our citizens.
[PREVENTION] GOAL 3: Enhance the use of non-opioid pain reduction therapies before prescribing opioids.
Strategy 3.1: Eliminate barriers to the use of non-opioid therapies Measure 3.1.1: Increase number of insurance carriers that
for pain management. encourage the use of non- opioid therapies for chronic pain
management
Justification: Research supports the use of alternative therapies Baseline: Unknown (2016)
(e.g., acupuncture, massage therapy, physical therapy, and Target: Establish baseline and increase by 5% (2022)
meditation) as useful treatment for chronic pain. However, Data Source: Claims data from Department of Insurance,
cumbersome authorization of these treatments hinders their use. Kentucky Employee Health Plan and Department for Medicaid
Services (DMS)
27
KENTUCKY STATE HEALTH IMPROVEMENT PLAN[HARM REDUCTION] GOAL 4: Improve experience of patients reporting to Emergency Departments with non-fatal overdose.
Strategy 4.1: Revise statute that requires physicians that order Measure 4.1.1: Increase number of HIV and hepatitis C tests
Human Immunodeficiency Virus (HIV) testing to be responsible for ordered on patients with the diagnosis of non-fatal overdose
test result notification (KRS 214.181). Baseline: Unknown (2016)
Target: Establish baseline and increase by 5% (2022)
Justification: The culture of Emergency Department (ED) Data Source: Kentucky Health Information Exchange
management has changed since this law was written. The intent to
assure patient protection with notification for the ordering physician
is not practical as ED professionals work in many settings, making
this notification impractical. Granting hospitals the authority to
notify patients of HIV test results will avail the patient more
opportunity to receive needed testing when presenting to the ED
with a non-fatal overdose.
[HARM REDUCTION] GOAL 5: Increase the distribution and use of naloxone across Kentucky.
Strategy 5.1: Coordinate the distribution and data collection of Measure 5.1.1: Increase naloxone distribution to patients with
naloxone through one central position in DPH using funding sources SUD
from all levels of state government. Develop technology to promote Baseline: Unknown (2016)
voluntary reporting of naloxone distribution to patients with SUD, Target: Establish baseline and increase by 5% (2022)
their families and friends, first responders, pharmacists, emergency
management, local health departments, hospitals, and EDs. Collect Measure 5.1.2: Reduce number of overdose deaths
outcome data whenever naloxone is used in the field. Baseline: 1,354 (2016)
Target: 1,284 (2022) – 5% reduction
Justification: The rapid use of naloxone can reduce overdose deaths.
Expanding the availability of naloxone to the non-using and using Measure 5.1.3: Reduce number of ED visits for non-fatal
populations promotes reversal of overdose and potential overdose
opportunities for receiving SUD treatment. Baseline: 13,190 (2016)
Target: 12,530 (2022) – 5% reduction
28
KENTUCKY STATE HEALTH IMPROVEMENT PLANMeasure 5.1.4: Increase number of Mobile Harm Reduction
Unit deployments per 6 months
Baseline: 17 (2017)
Target: 30 (2022)
Data Source: DPH, Mobile Harm Reduction Program and
Kentucky Injury Prevention and Research Center (KIPRC);
Kentucky Harm Reduction Coalition; DPH, Office of Vital
Statistics
[TREATMENT] GOAL 6: Increase the availability of evidence-based treatment for SUD for all Kentuckians.
Strategy 6.1: Encourage the expansion of Medicaid coverage to Measure 6.1.1: Increase number of patients served in
include methadone therapy as a covered service. methadone clinics
Baseline: Unknown (2016)
Justification: Methadone is an evidence-supported therapy for Target: Establish baseline and increase by 5% (2022)
treatment of substance use disorder. Increasing access to
methadone therapy may decrease the number of overdose deaths, Measure 6.1.2: Increase number of treatment visits in
decrease intravenous drug use and its sequelae, and allow persons methadone clinics
with SUD to become functioning members of society. Baseline: Unknown (2016)
Target: Establish baseline and increase by 5% (2022)
Measure 6.1.3: Increase number of methadone clinics
Baseline: Unknown (2016)
Target: Establish baseline and increase by 5% (2022)
Strategy 6.2: Encourage the use of paraprofessional providers in the Measure 6.2.1: Increase number of insurance carriers that
treatment of substance use disorders (i.e., paramedicine cover paraprofessional services
technicians, peer support specialists, and community health Baseline: Unknown (2016)
workers). Target: Establish baseline and increase by 5% (2022)
Justification: Utilization of peer networks has been shown to Measure 6.2.2: Increase number of paraprofessional services
increase entry into treatment. provided
29
KENTUCKY STATE HEALTH IMPROVEMENT PLANYou can also read