THE INVESTOR'S GUIDE TO THE NEW ZEALAND BEVERAGES INDUSTRY 2017 - MBIE
←
→
Page content transcription
If your browser does not render page correctly, please read the page content below

THE INVESTOR’S GUIDE TO THE
NEW ZEALAND BEVERAGES INDUSTRY 2017
Part of the New Zealand Food & Beverage Information Project
FINAL REPORT; v1.02; June 2017
STEERING & GUIDANCE                                                                Projected market information, analyses and conclusions contained herein are         Unless otherwise noted, all photos used in this discussion document were
                                                                                   based (unless sourced otherwise) on the information described above and on          provided by the New Zealand Story resource (www.nzstory.govt.nz),
This project would not have been possible without the strong guidance of our       Coriolis’ judgment, and should not be construed as definitive forecasts or          purchased by Coriolis from a range of stock photography providers (as
Steering Committee. In particular, we would like to thank Andrew McCallum          guarantees of future performance or results. Neither Coriolis nor its officers,     documented where required), or are low resolution, complete product/brand
of MBIE for his tireless energy in keeping this project on track, while at the     directors, shareholders, employees or agents accept any responsibility or           for illustrative purposes used under fair dealing/fair use for both “research
same time pushing us forward.                                                      liability with respect to this document.                                            and study” and “review and criticism”. Our usage of them complies with New
                                                                                                                                                                       Zealand law or their various license agreements.
Draft versions of parts of this document were distributed to key firms for         Coriolis wishes to draw your attention to the following limitations of the
comment, addition or correction. This was done in the form of emails and           Coriolis report “New Zealand Beverages Industry 2017“ (the Coriolis Report)         Cover image: Shutterstock (XiXinXing)
phone calls. We thank those who helped us in this process for their time and       including any accompanying presentation, appendices and commentary (the
effort. We also thank those who provided their photos.                             Coriolis Commentary):                                                               Where appropriate, this document is Copyright © 2017 Coriolis and MBIE.
                                                                                                                                                                       However, please feel welcome to use, refer to and cite this research.
We are grateful for all of the input we have received, but the report is ours      a. Coriolis has not been asked to independently verify or audit the
and any errors are our own.                                                        information or material provided to it by, or on behalf of the Client, or any of
                                                                                   the parties involved in the project;
Finally, we acknowledge the support of the Ministry of Business, Innovation
and Employment (MBIE), New Zealand Trade and Enterprise (NZTE) and the             b. the information contained in the Coriolis Report and any Coriolis
Ministry of Primary Industries (MPI). It is their funding that has made this       Commentary has been compiled from information and material supplied by
report possible.                                                                   third party sources and publicly available information which may (in part) be
                                                                                   inaccurate or incomplete;
CONSTRAINTS & INHERENT LIMITATIONS
                                                                                   c. Coriolis makes no representation, warranty or guarantee, whether express
This work was commissioned by the Ministry of Business, Innovation and             or implied, as to the quality, accuracy, reliability, currency or completeness of
Employment (MBIE) and prepared by Coriolis. This work is based on                  the information provided in the Coriolis Report and any Coriolis Commentary,
secondary market research, analysis of information available or provided to        or that reasonable care has been taken in compiling or preparing them;
Coriolis by our client, and a range of interviews with industry participants and
industry experts. Coriolis have not independently verified this information        d. the analysis contained in the Coriolis Report and any Coriolis Commentary
and make no representation or warranty, express or implied, that such              are subject to the key assumptions, further qualifications and limitations
information is accurate or complete.                                               included in the Coriolis Report and Coriolis Commentary, and are subject to
                                                                                   significant uncertainties and contingencies, some of which, if not all, are
The report is dated June 2017 and Coriolis accepts no liability for, and has not   outside the control of Coriolis; and
undertaken work in respect of, any event subsequent to that date, which may
affect the report.                                                                 e. any Coriolis Commentary accompanying the Coriolis Report is an integral
                                                                                   part of interpreting the Coriolis Report. Consideration of the Coriolis Report
Key global trade data analysed in all sections of the F&B Information project      will be incomplete if it is reviewed in the absence of the Coriolis Commentary
are calculated and displayed in US$. This is done for a range of reasons:          and Coriolis conclusions may be misinterpreted if the Coriolis Report is
                                                                                   reviewed in absence of the Coriolis Commentary.
-   It is the currency most used in international trade
-   It allows for cross country comparisons (e.g. vs. Denmark)                     Coriolis is not responsible or liable in any way for any loss or damage
-   It removes the impact of NZD exchange rate variability                         incurred by any person or entity relying on the information in, and the
-   It is more comprehensible to non-NZ audiences (e.g. foreign investors)         Recipient unconditionally and irrevocably releases Coriolis from liability for
-   It is the currency in which the United Nations collects and tabulates          loss or damage of any kind whatsoever arising from, the Coriolis Report or
    global trade data                                                              Coriolis Commentary including without limitation judgments, opinions,
                                                                                   hypothesis, views, forecasts or any other outputs therein and any
Anyone should feel free to call the authors if any of the material cannot be       interpretation, opinion or conclusion that the Recipient may form as a result
understood or accessed. We always welcome opportunities to discuss our             of examining the Coriolis Report or Coriolis Commentary.
research with our readers and users.
                                                                                   The Coriolis Report and any Coriolis Commentary may not be relied upon by
                                                                                   the Recipient, and any use of, or reliance on that material is entirely at their
                                                                                   own risk. Coriolis shall have no liability for any loss or damage arising out of
                                                                                   any such use.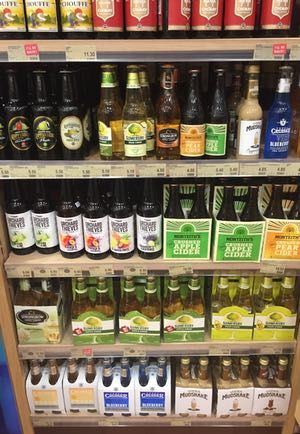
TABLE OF CONTENTS

INTRO                  01                   02                    03                     04                      05
Context &              Market               Production            Categories             Growth &                Firms
Conclusions            Overview                                                          Innovation              Performance

Pages 3-10             Pages 11-24          Pages 25-39           Pages 40-49            Pages 50-64             Pages 65+

+ Purpose              + Global situation   + Wine                + Overview             + Horizons for growth   + Enterprises

+ Situation summary    + Consumption        + Beer                + Category             + Emerging export       + Employment
                                                                    Segmentation           stars
+ Drivers of success   + Import demand      + Juice                                                              + Turnover
                                                                  + Exports by product   + Mega-trends driving
+ Investment           + Export supply      + Alcoholic Spirits                            change                + Ownership
  opportunities
                       + Key markets        + Water                                      + Innovation & new      + Foreign investors
+ SWOT                                                                                     products
                       + Market growth      + Production                                                         + Acquisitions
+ Supply chain
                                            + Regional activity                                                  + Investment

                                            + Key inputs                                                         + Rebranding

                                            + Growth upside                                                      + Leadership

                                                                                                                 + Firm Profiles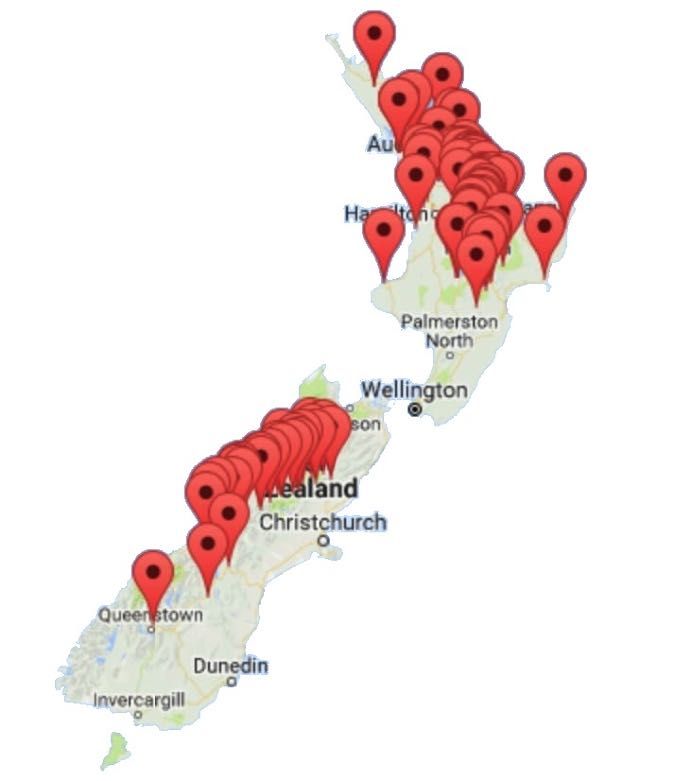
PURPOSE Why did the New Zealand government undertake this project?

  What is the purpose of the project?                 What benefit will this bring to businesses?       How will government use the reports?

   The project presents a comprehensive,               – As support for raising capital                  While the government collects large amounts of
   business-focused overview of the total New          – As a base of market intelligence to enable      industry data, little of this has an investor or
   Zealand food and beverage industry.                   business to be much more targeted in their      industry-driven perspective.
                                                         own market research
   The project pulls together the available            – Reviewing and informing offshore market         This information will provide much greater
   information on the food and beverage industry         development (including export and               insight into the industry, which is useful for a
   into one place, in a form which is familiar and       investment) strategies                          range of policy developments, from regulatory
   useful to business. The reports contain analysis    – Assisting in identifying areas of innovation    frameworks to investment in science and skills
   and interpretation of trends and opportunities        and R&D for the future                          and facilitating access to international markets.
   to materially assist with business strategy and
                                                       – Identifying strategic partners and
   government policy.
                                                         collaborators                                   In particular, a single source of factual
                                                       – Enabling a company to benchmark                 information will enable government agencies to
   The information will be of vital use to               performance with that of its competitors        better coordinate their efforts across the system
   businesses, investors, government, and                                                                and be more responsive to addressing industry
                                                       – Monitoring industry activity
   research institutions as the industry expands                                                         issues.
   and diversifies. This industry view will be very    – Gaining a better understanding of their own
   useful to government, enabling better dialogue        industry sector
                                                       – Identifying internal capability needs or        All project resources are available online at:
   and the opportunity to address issues
   collectively.                                         external inputs                                 www.foodandbeverage.govt.nz

                                                                                                                                                             4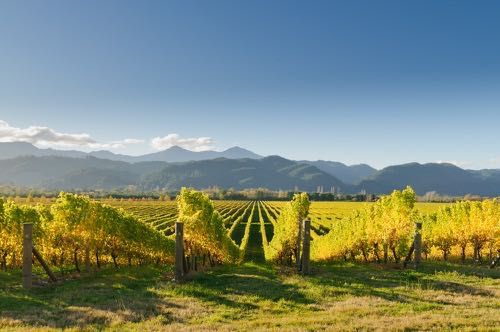
SITUATION SUMMARY: WINE The New Zealand wine industry has shown rapid growth driven by
Marlborough Sauvignon Blanc; some diversification into new varieties and new regions is occurring

NEW ZEALAND WINE                                        foreign owned and on-going acquisitions are              falling consumption and falling prices, have in turn
                                                        occurring. As a result foreign ownership now plays a     triggered a decrease in global wine area and
The New Zealand wine industry has achieved              big part in the wine industry, and these global firms    production, particularly in the three largest wine
spectacular growth over the last 40 years, going from   with their global sales resources and reach, provide a   producers (France, Italy & Spain). On-going changes
NZ£51 in exports in 1960 to NZ$1.6b in 2016. Today      path-to-market for introducing global consumers to       to EU subsidy systems have accelerated the process.
New Zealand competes successfully with major wine       New Zealand wines.
producers, both old world (e.g. France, Germany) and                                                             New Zealand’s success to date in wine has been
new (e.g. Australia). New Zealand has achieved an       That being said, there is a substantial group of         primarily in the Anglo-Saxon four (USA, Canada, UK
overall premium price position in–market on par with    successful medium sized New Zealand owned                & AU). Luckily these markets have had stable-to-
France (which has been producing wine for ~2,000        wineries that, in many ways, are the key force driving   increasing consumption. However, it would be in the
years).                                                 industry quality and innovation forward (e.g. light      interest of New Zealand producers to develop new
                                                        wine development).                                       markets to reduce this concentrated reliance on these
International success to date has been built almost                                                              markets.
exclusively on Marlborough Sauvignon Blanc which
has become a “must-have” wine for major wine                                                                     China is a rapidly emerging growth market for global
players. However good Marlborough wine area is          COMPETITORS                                              wine and is now the fourth largest wine importing
now almost all used. This may be a good thing as        New Zealand wine competes directly with that from        country in the world by value. China is now New
Marlborough now has almost as much area in grapes       other premium temperate climate countries,               Zealand’s sixth wine export destination and growing.
as Burgundy.                                            particularly France, Germany, cooler parts of the US     Available in-market data suggests - at a high level -
Emergent secondary regions are 20 years behind          (e.g. Oregon) and Chile.                                 that the growth of New Zealand wine is at the
Marlborough in terms of development. Hawkes Bay,                                                                 expense of French wines (i.e. the two are close
Waipara and Central Otago stand out as the next best                                                             substitutes for consumers).
prospects.     However, other than Hawkes               CONSUMERS/MARKETS
Bay/Gimblett Gravels Syrah and Central Otago Pinot
                                                        Global oversupply has been ongoing, pushing down
Noir most regions have yet to find “their” wine and
                                                        prices. These falling prices have impacted New
the experience of Europe suggest this could take
                                                        Zealand wines.
some time.
                                                        At the same time wine consumption is declining in
Wine production is a fast growing industry for New
                                                        many EU markets (France, Italy, Spain) for social,
Zealand, with a number of firms, ranging from very
                                                        lifestyle and economic reasons. These twin forces,
large to very small. Many large wineries are now

Source: Coriolis; interviews                                                                                                                                             5
SITUATION SUMMARY: OTHER BEVERAGES Outside wine, the New Zealand beverage sector is primarily
focused on production for domestic consumption; however, exports are growing strongly for many products

SPIRITS                                                                   scale, point-of-purchase control and distribution                         Smaller innovators emerging outside core soft-drinks.
                                                                          economics.     New Zealand’s three mainstream                             Organic-producer Phoenix (Charlie’s/TBDC) owned
Prior to 2000 there is a wide range of small spirit                       brewers focused on domestic consumption are: DB                           by Asahi.
ventures, producing small scale niche spirits for the                     Breweries (Heineken), Lion (Kirin) and Independent
domestic market. At the same time Independent                             (Asahi).                                                                  A large range of premium adult beverages are gaining
Liquor launched RTD2 spirit beverages primarily for                                                                                                 traction across multiple channels.
domestic consumption and export to Australia.                             This situation is changing rapidly with the emergence
                                                                          of a burgeoning craft brewing scene. New Zealand                          JUICE
Everything changed with the launch, rapid growth and                      now has a range of smaller/micro breweries, rising
financial success of 42 Below which created global                                                                                                  New Zealand exports apple and kiwifruit juice,
                                                                          with the growth of craft beer. Leaders in this space                      primarily as a secondary product of the fresh fruit
awareness of New Zealand as a super-premium                               include Moa Brewing, McCashin’s, Harrington’s and
spirits provider. In the wake of 42 Below a large                                                                                                   industry. However New Zealand imports +20% more
                                                                          many other smaller, innovative firms.                                     juice than it exports and domestic fruit production
number of new firms have entered the industry with a
wide range of products and brands.                                        New Zealand is a currently a minor beer exporter1,                        cost structures suggest a premium/niche strategy.
                                                                          and imports more beer than it exports. However, beer                      WATER
Independent Liquor, recently purchased by Asahi, is                       exports have surged in the last few years. The
the largest player in spirits. Independent initially                      country is known for its specialty hops and both uses                     New Zealand has excellent theoretical potential to
developed its business around flavoured RTD drinks,                       these domestically and exports them.                                      produce and export premium bottled water. A
however it is diversifying into other alcoholic                                                                                                     number of brands and companies have moved into
beverages. The two main brewers also produce and                          SOFT-DRINKS/FLAVOURED BEVERAGES                                           this premium space (e.g. One, Antipodes and Palaeo).
pack spirits, as well as distribute imported products                                                                                               However, to date, little of this potential has been
and brands.                                                               Non-alcoholic beverages are relatively consolidated
                                                                          across two international companies that primarily                         realised.
There are a range of other smaller firms in spirits                       manufacture for domestic consumption:
achieving strong growth and the sector is well
positioned for further growth (see related project                        − Coca-Cola Amatil, Australian-listed Asia-Pacific
2012 Spirits Opportunity report).                                           licensee of Coca-Cola;

BEER                                                                      − Frucor, former Apple & Pear Marketing Board juice
                                                                            business, now a division of Suntory (Japan); maker
Globally, mainstream beer brewing has been                                  of V energy drink and the Pepsi licensee in New
dominated by large companies mainly leveraging                              Zealand.

1. RTD = ready-to-drink; 2. Mexico, for example, exports 80x as much beer as New Zealand; NZ currently exports about as much beer as the Dominican Republic                                                 6
DRIVERS OF SUCCESS New Zealand’s success in beverages has three key drivers

              IDEAL CLIMATE & SOILS                                                 EFFICIENT PEOPLE & SYSTEMS                              LOCATION & MARKETS

                      Low production                                                              Trusted by                                      High share in key
                           cost                                                                   consumers                                           products

-   Temperate climate similar to Italy or France                         -      Innovative New World wine producer that burst   -   Excellent proximity to East & South-East Asian
                                                                                onto the global wine scene in the 1980’s            markets
-   Temperature extremes moderated by
    surrounding ocean                                                    -      Industry highly focused on export success       -   CER agreement with Australia

-   Isolated location protected by natural barriers                      -      Large pool of skilled people                    -   NZ was the first developed country to sign a free
                                                                                                                                    trade deal with China (2008)
                                                                         -      Strong systems and support networks

                                                                         -      Well-organised, cohesive industry

Source: photo credit (NZStory and images under license from shutterstock.com)                                                                                                           7
INVESTMENT OPPORTUNITIES Beverages are a major opportunity for investors; wine has shown rapid
growth; opportunities exist in second tier wine regions, cider, premium spirits and other beverages

WINE                                                      positioning in premium wine. Peer group countries          require a unique or more differentiated product (as
                                                          (e.g. UK, Sweden) suggest strong future growth             was the case with wine).
New Zealand Sauvignon Blanc wine is now a “must-          possible. However, there are limited entry vehicles.
have” component of the portfolio for major global         At this point in the life cycle, opportunities exist for   SOFT DRINKS
wine companies. Three of the top five US wine             start-ups into the space. Greenfields entry by global
companies and three of the largest European alcoholic                                                                In soft drinks, while both Frucor/V and
                                                          player with a strong transferrable skill set also suits.   TBDC/Charlie’s/Phoenix are attractive, but both are
beverage companies are active in New Zealand. In
addition, three of the top five Australian wine           CIDER                                                      now Japanese owned. A range of smaller firms exist.
companies are in New Zealand.                                                                                        WATER
                                                          New Zealand is a major apple producer and exporter.
There are some opportunities for further investment       Recently the cider industry in New Zealand has             There are potential opportunities in exporting bottled
in Marlborough. However, geographical constraints         experienced strong growth, both for domestic               water. However, at this late point in the global life-
place limitations on further growth in Marlborough.       consumption and export. Exports have shown strong          cycle, meaningful success will require global best
                                                          growth over the past decade, primarily to Australia.       practice marketing (cf. Lynda Rae Resnick/Fiji
Large wine firms are either foreign owned by global       While there are a large number of producers, most
majors or committed NZ family owners (i.e. Delegat                                                                   Water).     Best fit would be for investor with
                                                          export volume is produced by the two main brewers          transferrable capability.
and Villa Maria both have committed owners).              (Heineken/DB & Kirin/Lion).
Opportunities exist for new investment in next tier
down of firms (e.g. Giesen, Allan Scott, etc.).           BEER
However these firms are looking for smart investment
which gives them access to a global salesforce and a      New Zealand produces hops and barley and has
route to market.                                          ~150+ years of beer brewing experience. After a long
                                                          period of flat exports, beer exports have recently
Investors with transferrable skills or those looking to   started growing. However to date limited demand for
unlock hidden value should investigate emergent           New Zealand beer has been developed in markets
secondary regions (i.e. “the next Marlborough”).          beyond Australia. Microbreweries are small and
                                                          growing, but most currently have a domestic focus.
SPIRITS                                                   However, Moa Breweries has listed on the NZX and is
New Zealand has clear potential in premium alcoholic      making an export push.
beverages, building, in part, on New Zealand              Future export success by New Zealand beer will

                                                                                                                                                                              8
SWOT ANALYSIS The New Zealand beverage industry is well positioned for further growth, but pressures
will continue
STRENGTHS WEAKNESSES
- Islands in the middle of the South Pacific that have the area of Italy, but with only - Large number of small producers with limited economies of scale
the population of Singapore; therefore relatively unspoilt
- High debt levels of many small and medium sized producers
- Strong and growing success in premium/super-premium wine
- Highly dependant on four countries (AU, UK, USA and Canada)
- Achieves a strong price premium for wine in key markets (similar to France)
- Increasing exports of bulk wine
- New Zealand Sauvignon Blanc now a “must have” for global wine companies
- Lack strong super-premium heritage brands as demanded by brand and status
- Growth in market share in key markets (e.g. USA) conscious Asian consumers
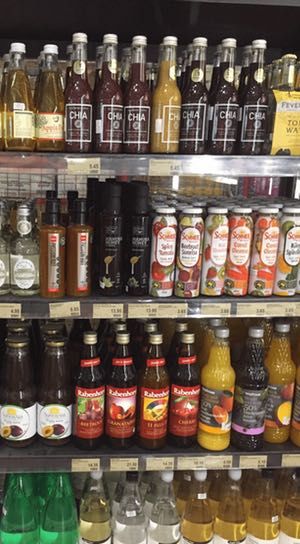
- Innovative and quality-focused producers (e.g. Chia+Kawa) - No deep cultural unique “spirits” associated with New Zealand
- Closer shipping distances to Asia compared to European competitors - Long shipping distance to traditional western markets
- Demonstrated capabilities in beverage production - Unlike traditional sectors, no major ($1b+) New Zealand owned champion growing
and driving New Zealand brand position in beer, wine or other beverages
- On-going growth and success of Frucor/V, and Charlies/Phoenix in non-alcoholic
drinks category - Limited culture of super-premium branding or positioning (e.g. relative to France)
- Emergent success in spirits (e.g. Stolen) - Not a major producer of many base ingredients of typical beverages (e.g. oranges)
OPPORTUNITIES ISSUES/THREATS/RISKS
- Continued income growth in Asian markets - Ongoing consolidation of the industry
- Rapidly growing demand for premium alcoholic beverages in Asia - Difficult finding good distributors to gain access into key markets
- Low share in Europe (two thirds of global wine consumption) outside British Isles - Continued growth of bulk wine trade reducing the value of wine
- Joint in-market activity spreading cost of marketing - Continued growth of retail brands/store brands in wine
- Strong and growing demand in Asia for premium fortified wines/wine based spirits - Limited opportunity shipping “water” around the world if it isn’t a premium product
(e.g. cognac)
- Changing consumer sentiment or government policy
- Reduction of global “wine ocean” supporting higher prices
- Failure to achieve large scale export traction outside wine
- Leverage success of New Zealand wine industry; build on awareness of New
- Hollowing out of management skills in New Zealand industry due to foreign
Zealand in wider premium beverages segments
ownership (relative to Denmark or Holland for example)
- Wide range of New Zealand unique plants available as flavouring (e.g. 42 Below
Manuka honey)
9
SUPPLY CHAIN The New Zealand beverage industry has a relatively straight forward supply chain that
delivers to consumers worldwide

SIMPLIFIED MODEL OF NEW ZEALAND BEVERAGE SUPPLY CHAIN
Model; 2017

                                                                                                                                 Domestic
                                                       Imported                              Grocery                             market                                            Supermarkets &
                                                       beverages                             wholesale                                                                             other retail

                  Apple/pear growing                   Soft drink                                                                  Distributor                                     Liquor specialists
                                                       manufacturing                                                               wholesaler

                  Other fruit                          Cider manufacturing                   Liquor                                                                                Hospitality/
                  growing                                                                    wholesale1                                                                            Foodservice
                  (rem. A013)

                  Hops/other                           Beer manufacturing
                  ingredients/
                  imports

                                                       Spirit manufacturing                  Seafreight                            Beverage/liquor                                 Supermarkets &
                                                                                             Airfreight                            wholesale1                                      other retail
                                                                                                                                   (in-market)

                  Grape                                Wine making                                                                                                                 Hospitality/
                  growing                                                                                                                                                          Foodservice
                                                                                                                                 International
                                                                                                                                 markets

1. There may be one or more layers of wholesaling, depending on product or market; some wholesale functions may be captive inside retailers or foodservice operators; Source: Coriolis                  10
Global
Market Overview
+ Consumption + Key markets
+ Global trade + Market growth
01
+ Import demand
+ Export supplyNew Zealand has a strong position in the growing global beverages trade
PRODUCTION DEMAND: IMPORT MARKETS
- Beverages are a huge global market spread across a wide range of - Total global cross-border demand for beverages was US$116b in
products 2015; Europe (including inter-EU) is the single largest market,
- In terms of final litres consumed, the key products are tap water, followed by E/SE Asia ($20.5b) and the US ($20.3b)
tea, packaged water, beer and carbonated soft drinks - China, various other E/SE Asian countries and the USA stand out
for beverage import market growth
GLOBAL TRADE - Markets vary in average beverage import price, with Japan, China,
much of E/SE Asia and the USA standing out as high value markets
- Global cross-border beverage trade volumes are growing (5.6%
CAGR) with moderate price gains across the cycle leading to SUPPLY: EXPORTERS
export value growth
- On the supply side, Europe (including inter-EU) dominates the
DEMAND: PRODUCT CATEGORIES global beverage trade followed by the US; overall New Zealand is a
strong second-tier supplier
- Total global cross-border beverage trade is spread across a wide - New Zealand in “on a roll” in beverages and has gained global
range of products, though bottled wine ($22.7b), beer ($12.7b), export share in the past decade; the country appears to be closing
Whiskeys ($10.9b) and wider soft drinks ($17.5) stand out for size in on Ireland and Australia
- “Other flavoured beverages,” gin, “other alcoholic spirits,” soft - New Zealand achieved a solid growth performance in beverage
drinks, beer and mineral water stand out for global growth over the exports over the past five years, beating Europe and Australia in
past five years rate of growth
- Imports vary in their average beverage price paid per litre, with - The average export price received for beverages varies among
sparking wine, spirits and bottled wine standing out for achieving countries, with New Zealand outperforming almost all competitors,
high average prices including France
12Beverages are a huge global market spread across a wide range of products; however, in terms of final litres
consumed, the key products are tap water, tea, packaged water, beer and carbonated soft drinks
TOTAL HUMAN FLUID CONSUMPTION GLOBAL PURCHASED BEVERAGE CONSUMPTION BY FINAL VOLUME
Litres; t; 2016 Litres; b; 2016
Packaged
Carbonated soft drinks
Non-Alcoholic
Fruit & veg juices
14% 4%
Ready-to-Drink
(NARTD)
~47%
Packaged water
19%
Other
10%
Purchased
Tap water 40%
60%
Drinking milk Alcoholic
See dairy
10%
report Beverages
(On & Off Trade)
Beer ~15%
12%
Hot drinks Coffee
~28% 6%
TOTAL = 4.4 trillion litres See processed
foods report Wine
2%
Spirits
Tea 1%
22%
Cider RTDs
0% 0%
TOTAL = 1,800 billion litres
Note: Both tea and coffee will use tap water; drinking milk includes dairy-based drinks; tea includes mate and herbal blends
Source: UN FAO Aquastat database; UN “Water for People, Water for Life”; OIV; Can Markets; Drinks Business; Kirin Beer University Report; Euromonitor; Statista; Coriolis estimates & analysis 13Global cross-border beverage trade volumes are growing (5.6% CAGR) with moderate price gains across the
cycle leading to export value growth
GLOBAL EXPORT VOLUME AVERAGE GLOBAL EXPORT PRICE GLOBAL EXPORT VALUE
L; b; 2005-2015 US$/l; actual; 2005-2015 US$; b; 2005-2015
90.0 $1.80 $140
10y CAGR
4.2% 10y CAGR 10y CAGR
1.3% 5.6%
80.0 $1.60
$120
70.0 $1.40
$100
60.0 $1.20
$80
50.0 $1.00
X =
40.0 $0.80
$60
30.0 $0.60
$40
20.0 $0.40
$20
10.0 $0.20
- $0.00 $0
2005
2006
2007
2008
2009
2010
2011
2012
2013
2014
2015
2005
2006
2007
2008
2009
2010
2011
2012
2013
2014
2015
2005
2006
2007
2008
2009
2010
2011
2012
2013
2014
2015
Note: data excludes “other [bulk] water” is as reported sender FOB; Source: UN FAO database; Coriolis classification and analysis 14Total global cross-border beverage trade is spread across a wide range of products, though bottled wine
($22.7b), beer ($12.7b), Whiskeys ($10.9b) and wider soft drinks ($17.5) stand out for size
TOTAL GLOBAL BEVERAGE IMPORT VALUE BY PRODUCT OR PRODUCT CATEGORY Total = $116.2
US$; b; FOB; 2015
$0.6
$2.4
$14.1 $31.8 $35.2 $14.7 $17.5
Apple juice
Brandy/Cognac $1.7
$6.1
Apple juice, unsweetened
$0.4
Orange juice not-frozen sweetened Soft drinks
$1.7 $7.2
Whiskeys Orange juice not-frozen unsweetened
$10.9 $1.9
Wine, bottle
$22.7
Frozen orange juice
Beer
$1.7
Mineral water
$12.7
$2.4
Liqueurs
$2.9
Vodka
$2.2
Rum
Gin $1.0
$0.9
Other flavoured beverages
$10.3
Other alc. Spirits Other juices
Wine, bulk $4.3 $7.4
$3.2
Sparkling wine Ethyl Alcohol
$5.8 $7.0
Cider; other fermented
$1.4
Grape must
$0.1
Juices
Soft Drinks
Water
Vinegar
Beer Wine Spirits
Note: 2015 is latest available globally; data is as reported sender FOB; Source: UN Comtrade database; Coriolis analysis 15“Other flavoured beverages,” gin, “other alcoholic spirits,” soft drinks, beer and mineral water stand out for
global import growth over the past five years
5Y IMPORT GROWTH MATRIX: 5Y VOLUME VS. 5Y CAGR VALUE VS. VALUE 2015 BY PRODUCT
L; b; % of US$; US$b; FOB; 2010 vs. 2015
10%
Gin
5Y CAGR
Other flavoured beverages
value
US$; 10-
15
Other alc. Spirits
5%
Brandy/Cognac Cider; other fermented
Sparkling wine
Other juices Vinegar Whiskeys Ethyl Alcohol
Frozen orange juice
Mineral water Soft drinks
Beer
Wine, bulk
Apple juice, unsweetened Wine, bottle
Orange juice not-frozen unsweetened
Grape must
Rum
Liqueurs
0%
Apple juice
Vodka
Bubble size is proportional to beverage import
$3
value in 2015; a bubble this size is US$3b
Orange juice not-frozen sweetened
-4%
-1.00 -0.50 0.00 0.50 1.00 1.50 2.00 2.50 3.00 3.50 4.00
5Y Change in volume (l; b) of beverages imported; 10-15
Note: 2015 is latest available globally; data is as reported sender FOB; Source: UN Comtrade database; Coriolis analysis 16Imports vary in their average beverage price paid per litre, with sparking wine, spirits and bottled wine
standing out for achieving high average prices
TOTAL GLOBAL BEVERAGE IMPORT VOLUME VS. AVERAGE PRICE BY PRODUCT/PRODUCT CATEGORY
L; m; US$/l; actual; 2015
$14.63
Average
import
value per
kilogram
US$/l
2015
$7.30
$6.84
$6.17
$5.59
$3.78
$3.58
$3.48
$2.11
Weighted average $1.96
$1.62
$1.46
$1.24
$1.24
$1.18
$0.99
$1.13
$1.00
$0.85
$0.77
$1.18
$0.71
$0.61
$0.54
$0.31
Sparkling wine
Brandy/Cognac
Whiskeys
Liqueurs
Gin
Rum
Vodka
Other alc. spirits
Orange juice not-frozen sw.
Frozen orange juice
Grape must
Vinegar
Cider; other ferm.
Apple juice
Orange juice not-froz unsw.
Apple juice, unsw.
Wine, bottle Other juices Ethyl Alcohol Other flavoured bev. Beer Wine, bulk Soft drinks Mineral water
Proportional to import volume in 2015
Note: therefore area under chart is proportional to import value (volume x $/l); Source: UN Comtrade data; Coriolis analysis and classifications 17Total global cross-border demand for beverages was US$116b in 2015; Europe (including inter-EU) is the
single largest market, followed by E/SE Asia ($20.5b) and the USA ($20.3b)
GLOBAL BEVERAGE IMPORT VALUE BY RECEIVING COUNTRY/REGION
US$; b; FOB; 2015
$2.5 $31.0 $53.0 $3.2 $4.4 $1.6 $20.5 Total = $116.2
Singapore
United Arab Emirates
United Kingdom $2.2
$8.7
$1.1
India
$0.5
Vietnam
$1.8
Malaysia
Germany $0.7
Thailand
$8.0 $0.6
Other SE Asia
USA $2.0
$20.3
Australia
Netherlands
$1.9
$5.8
Japan
$3.2
France
SS Africa
$4.9
$3.2
Belgium South Korea
$3.9 $1.4
Other NA/ME/CA
Other S Asia
$3.3
Hong Kong SAR
$1.1
$2.6
Canada
$5.3
Other Europe
$19.5
China
$0.3
NZ
$4.4
Mexico
$1.1
Brazil
Panama $0.8
Other Pacific
$0.5
$0.3
Other Americas Belarus Other E Asia
$2.9 Russia $0.2 $1.6
$1.5 Turkey
$0.5
SS Africa
NA/ME/CA
Australasia Americas Europe S Asia E/SE Asia
Note: 2015 is latest available globally; data is as reported sender FOB; Source: UN Comtrade database; Coriolis analysis 18China, various other E/SE Asian countries and the United States stand out for beverage import market growth
5Y IMPORT GROWTH MATRIX: 5Y VOLUME VS. 5Y CAGR VALUE VS. VALUE 2015 BY RECEIVING COUNTRY/REGION
L; b; % of US$; US$b; FOB; 2010 vs. 2015
18% Other S Asia
5Y CAGR 15% Vietnam China
import
Panama
value
US$; 10-
Other SE Asia
15
Other Pacific
Belarus
10% Turkey United Arab Emirates
Hong Kong SAR Brazil USA
Other E Asia
Malaysia Singapore South Korea
Mexico Australia
5% Thailand Other NA/ME/CA
Japan
Other Americas
Canada
India
Belgium
SS Africa Netherlands Other Europe
UK
0% NZ
Germany
France
Bubble size is proportional to beverage import
$3
value in 2015; a bubble this size is US$3b
-5% Russia
-0.5 0.0 0.5 1.0 1.5 2.0 2.5 3.0
5Y Change in import volume (l;b) of beverages imported; 10-15
Note: 2015 is latest available globally; data is as reported sender FOB; Source: UN Comtrade database; Coriolis analysis 19Markets vary in average beverage import price paid, with Japan, China, much of E/SE Asia and the USA
standing out as high value markets
GLOBAL BEVERAGE IMPORT VOLUME VS. AVERAGE IMPORT PRICE BY KEY MARKET
L; b; US$/l; actual; 2015
$4.40
Average
$4.03
import
value per
kilogram
$3.59
US$/l;
2015
$2.83
$2.63
$2.48$2.29
$2.22
$2.12
$2.07
$1.98
$1.94
$1.87
$1.84
$1.68
$1.65
$1.64
$1.50
$1.50
Weighted average $1.42
$1.22
$1.19
$1.18
$1.17
$1.17
$1.16
$1.16
$1.10
$1.08
$1.05
$0.99
$0.87
$0.81
$0.58
Belarus
Other NA/ME/CA
Other SE Asia
Other Pacific
India
Other Americas
Netherlands
SS Africa
South Korea
Panama
Russia
UK
Mexico
Brazil
Canada
UAE
NZ
Other S Asia
Japan
China
Australia Turkey
Malaysia
Other E Asia
Singapore
Thailand
Hong Kong SAR
Vietnam
Belgium France Germany Other Europe USA
Proportional to import volume in 2015
Note: therefore area under chart is proportional to import value (volume x $/l); Source: UN Comtrade data; Coriolis analysis and classifications 20On the supply side, Europe (including inter-EU) dominates the global beverage trade followed by the United
States; overall New Zealand is a strong second-tier supplier
TOTAL GLOBAL BEVERAGE EXPORT VALUE BY SENDING COUNTRY/REGION Total = $116.2
US$; b; FOB; 2015
$0.8
$2.0
$1.8
$3.3 $22.2 $74.2 $12.1
France Singapore
$16.5 $2.8
New Zealand
USA
$1.3
$8.6
India
$0.3
United Kingdom
$10.0 Thailand
$2.0
Canada
Italy
$0.9
$8.9
China
Brazil
$2.1
$3.1 Germany
$6.6
Netherlands
$6.6 Hong Kong SAR
$1.3
Australia
Mexico
$1.9
$4.7
Other S Asia
$0.4
Chile Other Europe
$2.1 $24.6 Other E Asia
$3.8
Argentina
$1.3
Guatemala
Other Pacific
$0.3
$0.1
Other Americas
$1.3 Turkey Belarus
Russia
$0.5 $0.1
$0.5
SS Africa
NA/ME/CA
S Asia
E/SE Asia
Australasia Americas Europe
Note: 2015 is latest available globally; data is as reported sender FOB; Source: UN Comtrade database; Coriolis analysis 21New Zealand is “on a roll” in beverages and has gained global export share in the past decade; the country
appears to be closing in on Ireland and Australia
BEVERAGE EXPORT MARKET SHARE: NEW ZEALAND VS. SELECT PEERS
% of total global trade value; US$; 2005-2015
3.4%
2.9%
2.9%
2.2% 2.2% 2.2%
2.2%
2.0%
2.0%
10Y Change
1.9%
1.8%
1.8% 1.8% 1.8% 1.8%
1.7% 1.7%
1.7%
Chile 0.3%
1.6% 1.6% 1.6% 1.6% Australia -1.8%
1.5% 1.6% 1.6% 1.5%
1.5%
1.5% 1.5%
70%
1.3% 1.3%
1.2% 1.3%
1.2% 1.2% Ireland -0.7%
1.1% 1.1% 1.1%
1.0% 1.0%
New Zealand 0.4%
20% 1.0% 1.0% 1.0%
0.9% 0.9%
0.9% 0.9% 0.9% 0.9%
0.8%
0.8% 0.8% 0.8% Canada -0.6%
0.7% 0.7%
2005 2006 2007 2008 2009 2010 2011 2012 2013 2014 2015
Note: 2015 is latest available globally; data is as reported sender FOB; Source: UN Comtrade database; Coriolis analysis 22New Zealand achieved a solid growth performance in beverage exports over the past five years, beating both
Europe and Australia in rate of growth
5Y EXPORT GROWTH MATRIX: 5Y VOLUME VS. 5Y CAGR VALUE VS. VALUE 2015 BY EXPORTING COUNTRY/REGION
L; b; % of US$; US$b; FOB; 2010 vs. 2015
16%
Thailand
5Y CAGR India
export
value US$; 14%
10-15
Hong Kong SAR
12% Other E Asia
10%
Other S Asia Russia
Singapore
8% Guatemala USA
Mexico
China
6% New Zealand
Netherlands
Chile
4%
Turkey
Italy Other Europe
United Kingdom
2% Argentina
NA/ME/CA France
Brazil Germany
0% Canada
Bubble size is proportional to beverage export $3
-2%
value in 2015; a bubble this size is US$3b
Australia
Other Americas
-4% SS Africa
-0.5 0.0 0.5 1.0 1.5 2.0 2.5 3.0 3.5 4.0
5Y Change in export volume (l; b) of beverages imported; 10-15
Note: 2015 is latest available globally; data is as reported sender FOB; Source: UN Comtrade database; Coriolis analysis 23The average export price received for beverages varies among countries, with New Zealand outperforming
almost all competitors, including France
TOTAL GLOBAL BEVERAGE EXPORT VOLUME VS. AVERAGE EXPORT PRICE BY KEY MARKET
L; m; US$/l; actual; 2015
High value
re-export
$6.29
Average
$6.07
export
value per
kilogram
US$/l
2015
Whisky &
Spirits
$3.55
$2.85
$2.24
$2.06
$2.03
$1.74
$1.60
$1.57
$1.55
$1.54
$1.33
$1.24
$1.35 Weighted average $1.96
$1.13
$1.08
$1.11
$0.97
$0.96
$0.82
$0.81
$0.71
$0.65
$0.53
$0.47
$0.46
$0.43
Singapore
Hong Kong SAR
United Kingdom
Other E Asia
New Zealand
France
Chile
Argentina
Italy
Australia
India
China
USA
Netherlands
Canada
Mexico
Other Europe
Germany
SS Africa
Other Americas
Other S Asia
Turkey
Brazil
NA/ME/CA
Belarus
Guatemala
Other Pacific
Thailand
Russia
Proportional to export volume in 2015
Note: therefore area under chart is proportional to import value (volume x $/l); Source: UN Comtrade data; Coriolis analysis and classifications 24New Zealand
Production
+ Wine + Production
+ Beer + Regional activity
02
+ Juice + Key inputs
+ Alcoholic Spirits + Growth upside
+ WaterNew Zealand can continue to to grow beverage production for the foreseeable future
WINE PRODUCTION OTHER BEVERAGE PRODUCTION
New Zealand is a rapidly emerging New World wine region with New Zealand can and does produce a range of other beverages
significant capacity for future growth and no major production beyond wine, again with few limitations on potential production
challenges volumes
- Wine is New Zealand’s largest beverage export - New Zealand produces significant volumes of both key beer
- New Zealand grape area and wine production has grown ingredients (hops and barley); beer production trending down in
dramatically over the past twenty years in response to growing recent years reflecting the market movement to “less but better
global demand for New Zealand wine quality”
- Absolute area growth is coming from Sauvignon Blanc; of other - New Zealand is a major global producer and exporter of apples and
varietals, Pinot Gris and Pinot Noir are achieving traction kiwifruit, as well as developing and pioneering a wide range of new
- New Zealand has wineries spread across the country; however, varieties and species
about two-thirds of grape area is in Marlborough - New Zealand has significant quantities of raw materials available to
- As the largest, most mature region, Marlborough leads in terms of produce alcoholic spirits
both (1) tonnes per winery and (2) tonnes per hectare - New Zealand has an abundant supply of quality natural water and
- While Marlborough is clearly the leading region, a number of the thousands of springs; natural springs are located primarily in two
smaller regions are growing, particularly recognised red producers zones (Taupo Volcanic Zone and the Southern Alps Zone)
Hawke’s Bay (Syrah), Canterbury/Waipara (Pinot Noir), and - Due to its unique history, New Zealand has a range of unique or
Central Otago (Pinot Noir) signature ingredients and flavours suitable for use in beverages
- Peer group performance suggests New Zealand has significant
potential capacity to increase wine area over the mid-to-long run
26New Zealand is a rapidly emerging New World wine region with significant capacity for future growth with no
major impediments or capacity constraints
OTHER
WINE
BEVERAGES
27WINE PRODUCTION New Zealand grape area and wine production has grown dramatically over the past
twenty years in response to growing global demand for New Zealand wine
NEW ZEALAND GRAPE AREA NEW ZEALAND WINE PRODUCTION
Hectares; 1977-2016 L; m; 1977-2016
40,000 350,000
35,000
30,000
25,000 300,000
20,000
15,000
10,000
250,000
5,000
0
1961
1963
1965
1967
1969
1971
1973
1975
1977
1979
1981
1983
1985
1987
1989
1991
1993
1995
1997
1999
2001
2003
2005
2007
2009
2011
2013
2015
200,000
NEW ZEALAND GRAPE PRODUCTION
Tonnes crushed; 1977-2016 150,000
500,000
450,000
400,000 100,000
350,000 Low
300,000 year
250,000
200,000 50,000
150,000
100,000
50,000
0 0
1963
1965
1967
1969
1971
1973
1975
1977
1979
1981
1983
1985
1987
1989
1991
1993
1995
1997
1999
2001
2003
2005
2007
2009
2011
2013
2015
1961
1963
1965
1967
1969
1971
1973
1975
1977
1979
1981
1983
1985
1987
1989
1991
1993
1995
1997
1999
2001
2003
2005
2007
2009
1961
2011
2013
2015
Source: MAF/MPI; NZWine Annual Report ; UN FAO FAOSTAT database; Coriolis analysis 28Absolute area growth is coming from Sauvignon Blanc; of other varietals, Pinot Gris and Pinot Noir are
achieving traction
WINE AREA BY VARIETY GROWTH MATRIX: WINE AREA BY VARIETY
Ha; 2006/2016 Ha; 2006/2016
Excludes unknown
0.15
10y ABS 10y CAGR
36,192
833 Other red 210 2.9%
Tonnes
1,271 Merlot -149 -1.1%
per ha
Pinot Gris
5,573 Pinot Noir 1,510 3.2% 0.10
Sauvignon Blanc
Cabernet Sauvignon -248 -6.1%
283
781 Other White 8 0.1%
2,455 Pinot Gris 1,693 12.4%
767 Riesling -86 -1.1%
0.05
21,780
Other red
623
Pinot Noir
1,420
4,063
0.00 Other White
531 -2,000 0 2,000 4,000 6,000 8,000 10,000 12,000 14,000
773 Merlot Riesling
762 21,016 Sauvignon Blanc 12,156 9.0% Chardonnay
853
-0.05
8,860
Cabernet Sauvignon
Bubble size is proportional to total grape 5,000
production; a bubble this size is 10,000t
3,779 Muller Thurgau
3,211 Chardonnay -568 -1.6% -0.10
116 2 Muller Thurgau -114 -32.7%
2006 2016 Tonnes per winery
Source: NZWine Annual Report (various years); Coriolis analysis 29New Zealand has wineries spread across the country; however, about two-thirds of grape area is in
Marlborough
NUMBER OF WINERIES BY REGION OF NEW ZEALAND HECTARES OF GRAPES BY REGION OF NEW ZEALAND
Units; 2016 Hectares; 2016
Gisborne
Auck/North 430
1,448 4%
Other 5 1% 1%
Cant/Wai 1,436
4%
Central
Otago
1,943 6%
Auck/North 134 Hawke's Bay
20% Central Otago 133 4,744 13%
20%
Wairarapa
Gisborne 1,002 3%
18 3%
Nelson 1,169 3%
Cant/Wai 64 9%
Hawke's Bay 76
11%
Wairarapa 68 10% Marlborough, 141, Marlborough,
21% 24,020 , 66%
Nelson 36
5%
TOTAL = 675 wineries TOTAL = 36,192 hectares
Source: NZWine Annual Report 2016; NZW Vineyard Register Report 2015-2018; Coriolis analysis 30As the largest, most mature region, Marlborough leads in terms of both (1) tonnes per winery and (2) tonnes
per hectare
NZ: NUMBER OF WINERIES VS. TONNES PER WINERY NZ: REGIONAL AREA VS. TONNES PER HECTARE
Units; t/unit; 2016 Hectares; tonnes/hectare; 2016
2,293 13.5
11.0
9.1
8.6
8.5
Tonnes Tonnes
/winery /hectare
886
5.0
4.7
3.6
565
279
1.4
190
1.1
74 69
12 62
Marlborough
Gisborne
Hawkes Bay
Nelson
Canterbury
Wairarapa
Otago
Auckland
Northland
Waikato
Marlborough
Gisborne
Hawkes Bay
Nelson
Canterbury
Wairarapa
Northland
Waikato
Auckland
Otago
# of wineries Area in grapes
Source: NZWine Annual Report 2016; NZW Vineyard Register Report 2015-2018; Coriolis analysis 31While Marlborough is clearly the leading region, a number of the smaller regions are growing, particularly
those recognised red producers Hawke’s Bay (Syrah), Canterbury/Waipara (Pinot Noir), and Central Otago
(Pinot Noir)
GRAPES CRUSHED IN VINTAGE BY REGION PRODUCTION MATRIX: T/WINERY VS. T/HA VS. TOTAL
T; 2006/2011/2016 T; 2015/16
10y ABS 10y CAGR 15
420,356
1,377 Auck/North -437 -2.7%
15,944 Gisborne -2,105 -1.2%
Tonnes
per ha
Marlborough
42,958 Hawke's Bay 9,671 2.6%
5,049 Wairarapa 2,041 5.3%
10,028 Nelson 4,405 6.0%
324,592
1,626 Gisborne
14,450
35,533 10
3,598 Nelson
7,854 Hawkes Bay
Canterbury
182,886 Auck/North
1,814 323,290 Marlborough 209,854 11.0%
18,049
5 Wairarapa
33,287 Otago
244,893
3,008
5,623
113,436 Bubble size is proportional to total grape
10,000
production; a bubble this size is 10,000t
9,119 14.8%
12,170 Cant/Waipara 0
9,485 Central Otago 4,565 7.1%
3,051 7,104 49 9,177 Other 0 500 1,000 1,500 2,000 2,500
4,612 6 363 357 50.7%
2006 2011 2016 Tonnes per winery
Source: NZW Annual Reports various years; NZW Vineyard Register Report various years; Coriolis analysis 32Peer group performance suggests New Zealand has significant potential capacity to increase wine area over
the mid-to-long run
GROWTH MATRIX OF WINE AREA: % TOTAL AREA VS. M2/PERSON VS. TOTAL WINE AREA
% of hectares; hectares/person; hectares; 2015 or 2016
250
Wine area
/person
m2
2015 Spain
Portugal
200
150
France
Italy
100 Greece Romania
Bulgaria
New Zealand
Hungary
50 Austria
Bubble size is proportional to total wine area
100,000
A bubble this size is 100,000 hectares
Germany
0
0.0% 0.5% 1.0% 1.5% 2.0% 2.5%
Wine area as a percent of total land area; % of km2; 2015
Source: OIV; NZ Winegrowers; CIA World Fact Book; Coriolis analysis 33New Zealand can and does produce a wide range of other beverages beyond wine with few limitations on
potential production volumes
OTHER
WINE
BEVERAGES
34BEER PRODUCTION New Zealand produces significant volumes of both key beer ingredients (hops and
barley); beer production trending down in recent years reflecting the market movement to “less but better
quality”
NEW ZEALAND HOP PRODUCTION NEW ZEALAND BEER PRODUCTION
Tonnes; 1977-2014 Tonnes; 1961-2014
1,000 450,000
900
800
700 400,000
600 Ongoing shift to
500 “less but better quality”
400 350,000
300
200
100
300,000
0
1977
1979
1981
1983
1985
1987
1989
1991
1993
1995
1997
1999
2001
2003
2005
2007
2009
2011
2013
250,000
NEW ZEALAND BARLEY PRODUCTION 200,000
Tonnes; 1961-2015
700,000
150,000
600,000
500,000
100,000
400,000
300,000
200,000 50,000
100,000
0 0
1961
1963
1965
1967
1969
1971
1973
1975
1977
1979
1981
1983
1985
1987
1989
1991
1993
1995
1997
1999
2001
2003
2005
2007
2009
2011
2013
1961
1963
1965
1967
1969
1971
1973
1975
1977
1979
1981
1983
1985
1987
1989
1991
1993
1995
1997
1999
2001
2003
2005
2007
2009
2011
2013
Source: MAF/MPI; UN FAO FAOSTAT database; Coriolis analysis 35FRUIT FOR JUICE & CIDER New Zealand is a major global producer and exporter of apples and kiwifruit, as
well as developing and pioneering a range of new varieties and species
NEW ZEALAND FRUIT PRODUCTION EXAMPLES OF FRUIT DEVELOPED OR PIONEERED IN NZ
Tonnes; 1961-2014 Select examples; 2017
1,400,000
A P P LES KIWIFRUIT OTHER FRUIT
Granny Smith* Hayward Feijoa
1,200,000
Wine grapes Splendour (dominant global) Tamarillo
Gala Bruno Passionfruit
1,000,000 Royal Gala Alison Kiwiberries
Other fruit Braeburn EnzaGreen Kiwano
Jazz EnzaGold Blueberries
800,000 Envy Zespri Gold (various cultivars)
Pacific Rose Zespri Sungold Blackcurrants
Pacific Beauty Zespri SweetGreen (various cultivars)
600,000 Kiwifruit
Pacific Queen KiwiKiss
Smitten
400,000 Maxie
Sweetie
200,000 Apples
0
1961
1963
1965
1967
1969
1971
1973
1975
1977
1979
1981
1983
1985
1987
1989
1991
1993
1995
1997
1999
2001
2003
2005
2007
2009
2011
2013
* Appeared in Australia but was developed/improved in New Zealand; Source: MAF/MPI; UN FAO FAOSTAT database; Coriolis analysis 36ALCOHOLIC SPIRITS INPUTS New Zealand has significant quantities of raw materials available to produce
alcoholic spirits
NEW ZEALAND WHEY PRODUCTION NEW ZEALAND GRAIN PRODUCTION
Tonnes; 1977-2014 Tonnes; 1961-2016
1,200,000
25,000
20,000
15,000 1,000,000
Other grains
10,000
5,000
Total whey, including whey
processed into alcohol 800,000 Barley
0
1961
1963
1965
1967
1969
1971
1973
1975
1977
1979
1981
1983
1985
1987
1989
1991
1993
1995
1997
1999
2001
2003
2005
2007
2009
2011
2013
600,000
NEW ZEALAND SUGAR REFINING PRODUCTION & IMPORTS Corn
Tonnes; 1961-2014
300,000
400,000
250,000 Imported
200,000
150,000 Wheat
200,000
NZ
100,000 Refined
50,000
0
0
1961
1964
1967
1970
1973
1976
1979
1982
1985
1988
1991
1994
1997
2000
2003
2006
2009
2012
2015
1961
1963
1965
1967
1969
1971
1973
1975
1977
1979
1981
1983
1985
1987
1989
1991
1993
1995
1997
1999
2001
2003
2005
2007
2009
2011
2013
Source: MAF/MPI; Statistics NZ; UN FAO FAOSTAT database; Coriolis analysis 37WATER New Zealand has an abundant supply of quality natural water and thousands of springs; natural
springs are located primarily in two zones (Taupo Volcanic Zone and the Southern Alps Zone)
AVAILABLE WATER: NEW ZEALAND VS. SELECT PEERS LOCATIONS OF SPRINGS IN NEW ZEALAND
L; m or km3 as given; 2015 Presence; known sites; 2017
Water per 80
person
L; m; 2015 333.5 cubic kilometres of
renewable water/year
New Zealand TAUPO
70
VOLCANIC
ZONE
60
50
40
SOUTHERN
ALPS
Fiji ZONE
30
20
10 Bubble size is proportional
to renewable water; a 100
bubble this size is 100 km3
France Italy
0
0 200 400 600 800 1,000 1,200 1,400 1,600
Water per square kilometre L; m; 2015
Source: CIA World Fact Book; nzhotpools.co.nz; Coriolis analysis 38UNIQUE FLAVOURS Due to its unique history, New Zealand has a range of unique or signature ingredients
and flavours suitable for use in beverages
Manuka Gold
Feijoa
Honey Kiwifruit
Kawakawa
(Unique native Kiwifruit Titoki
plant)
39New Zealand
Category Performance
+ Overview
+ Category Segmentation
03
+ Exports by productNew Zealand has a strong position in wine and is emerging across a wide range of other beverages
OVERVIEW BY CATEGORY
- New Zealand has a strong beverages platform and - New Zealand has rapidly growing wine exports on the back of
produces all six major categories of beverages; New Marlborough Sauvignon Blanc, which is now a “must have”
Zealand has real strength in wine and is growing and varietal across most major markets; Pinot Noir also achieving
emerging in other categories growing recognition
- Wine currently accounts for 83% of New Zealand - New Zealand has had growing volumes of beer and cider
beverage exports, followed by soft drinks (7%) and a exports, driven by increased interest in authentic, craft &
range of other minor beverages premium; cider, in particular, appears well positioned for
growth beyond Australia
- Average export price varies by category, with wine
standing out for high prices; wine is maintaining, but not - New Zealand has a fast evolving alcoholic spirits industry that
growing pricing, across greater volumes; most other is seeking its “signature” spirit in a large and growing global
products shifting to quality market
- New Zealand is growing its share of the global wine trade, - New Zealand non-alcoholic beverages growing well, driven by
but only maintaining share across most other beverages; juices and other flavoured beverages; Australia still the largest
cider appears to have stalled after solid growth (needs to market, but E/SE Asia emerging (particularly Japan and
transition beyond Australia) China)
41New Zealand has a strong beverages platform and produces all six major categories of beverages; New
Zealand has real strength in wine and is growing and emerging in other categories
HIGH-LEVEL CATEGORIES
WINE BEER/CIDER SPIRITS JUICES SOFT DRINKS WATER
#1 Global Focused on Focused on Regionally strong in Focused on Emerging
Sauvignon Blanc Australia Australia specific products Australia rapidly
- New Zealand Sauvignon - Well regarded globally for - Sector in early stages of - Building on New Zealand’s - Early pioneer in energy - Huge hypothetical
Blanc “owns” the category the quality of its hops growth curve strength in export fruit, drinks (“V”) potential for growth
and is now a “must have” particularly in apples and
- Benefiting from global shift - Emerging sector driven by kiwifruit - Growing strongly in a - Strong fundamentals
- Refreshing/summer to craft/specialty strong marketing and “post-CSD” environment
afternoon positioning to unique products - Pioneer of a range of new [Carbonated Soft Drinks] - Wide range of pioneers
females (vs. reds) - Leveraging long-term NZ fruits and fruit varieties
strength in hops and - Rapid innovation underway - Good fit with “Brand NZ” - Second generation firms
- Emerging in Pinot Noir and apples - No real leverage to date of and existing strengths in with strong products
other reds - Still seeking “unique” existing strong fruit brands select fruits presentation and
- Growth coming from position beyond “me-too” (e.g. Zespri, Jazz, Pacific marketing (e.g. Antipodes)
- Strong growth for 30+ years global multinationals (e.g. spirits Rose) - Strong traction in “natural” doing well
Kirin, Heineken, Asahi) and positioned carbonated
- Strong and growing market local innovators juices - Premium new comers
share across Anglo markets Palaeo and OnePure
- Cider, in particular, stands
- Growing rapidly in Asia out as having clear
leverage and good long
- Attracting global brand term growth prospects
leaders (e.g. LVMH Moët
Hennessy Louis Vuitton)
EXAMPLE PRODUCTS UNDER THESE CATEGORIES
- Wine, bottles - Beer - Whisky/Whiskey - Apple juice - Soft drinks - Bottled water
- Sparkling wine - Vodka - Kiwifruit/other juices - Other flavoured beverages - Other water (e.g. bulk)
- Bulk wine - Gin
42Wine currently accounts for 83% of New Zealand beverage exports, followed by soft drinks (7%) and a range
of other beverages
NEW ZEALAND EXPORT VALUE BY BEVERAGE SEGMENT NEW ZEALAND EXPORT VALUE BY BEVERAGE SEGMENT
US$; b; 2015 US$; b; 2005-2015
$1,370
$29
$14
$1,290 $1,284
$1,260 Beer
$34 $26
$15 $11 Cider
$45
$14
$1,135
$28
$12
Spirits $24 2% Other
7% $966
$26
Juice $51 4% $10
$815
$15 $2 $788
$16 $4
$1,123
Soft drinks, $90 , $722
$14 $2 $1,030
7% $985 $1,073 Wine
Water $7 1%
$895
Wine $1,073 83% Vinegar $2 0%
Beer $26 2%
$523 $774
Cider $11 1% $11 $1
$453 $644
$14 $637
$560
$396
$332
$44 $32 $29
$45
$24 Spirits
$36 $68 $70 $60
$37 $47 $67 $51 Juice
$35
$30 $29 $34 $48 $38
$31 $36
$24 $97 $102 $107 $90 Soft drinks
$67 $64 $67 $82
$50 $52 $55
$3 $3 $8 $5
$1 $5 $4 $5
$1 $6
$1 $6
$1 $7
$1 $7
$2 Water
Vinegar
2005 2006 2007 2008 2009 2010 2011 2012 2013 2014 2015
Source: UN Comtrade database (from NZ Customs data); Coriolis classifications and analysis 43Average export price varies by category, with wine standing out for high prices; wine is maintaining, but not
growing pricing, across greater volumes; most other products shifting to quality
NEW ZEALAND EXPORT VOLUME VS. AVG $/L: BY SEGMENT GROWTH MATRIX: 10Y NUMBER VS. 10Y CAGR $/L VS. $/2015
L; millions; US$/l; actual; 2015 L; US$/l; US$; 2005-2015
6% Limited growth;
shift to quality
Average $3.30
10Y CAGR
NZ export of average Juice
value/l NZ export
US$/l Spirits
2015 value per Water
litre 4%
Vinegar
US$/l Low/no price gains,
05-15 though much
greater volumes
Weighted average $2.51
2%
$2.03 Beer
Wine
0%
$1.84 Soft drinks
$1.56
-2%
$1.20
$0.97
-4%
$0.75
$0.64
Higher total
dollars & volumes
at lower prices
-6% Bubble size is proportional to
export value in 2015; a $100m
Cider
bubble this size is US$100m
-8%
Juice
Spirits
Cider
Soft drinks
Beer
Water
Wine
-50 0 50 100 150 200 250
Vinegar
10y growth in export volume; l; m; 2005-2015
Proportional to NZ export volume in 2015
Source: UN Comtrade database (from NZ Customs data); Coriolis classifications and analysis 44New Zealand is growing its share of the global wine trade, but only maintaining share across most other
beverages; cider appears to have stalled after solid growth (needs to transition beyond Australia)
NEW ZEALAND SHARE OF WORLD EXPORT VALUE BY CATEGORY NEW ZEALAND SHARE OF WORLD EXPORT VALUE BY CATEGORY
US$; % of US$; 2015 % of US$; 2005-2015
3.4% Wine
3.4% 3.2%
NZ share
3.0% 3.0%
of total
global 2.8%
trade; % 2.7%
of $;
2015 2.5%
2.2%
2.0%
1.8%
1.6%
1.0%
1.0%
0.9% 0.9% 0.9%
0.8%
0.8% Cider
0.6% 0.6% 0.6% 0.6%
0.5% 0.6% 0.5%
0.5% 0.5% 0.5% Soft drinks
0.4% 0.4%
0.3%
0.4% 0.4%
0.3%
0.3% 0.4%
0.4% 0.4% 0.3% Juice
0.3% 0.3% 0.3% Water
0.3% 0.3% 0.3% 0.3% 0.3%
0.2% 0.2% 0.3% 0.2%
0.2% 0.2% 0.3% 0.3%
0.2% 0.2% Beer
0.2%
0.1% 0.1% 0.2%
0.2% 0.2% 0.2%
0.1% 0.1% 0.1%
0.1% 0.1% 0.1% 0.1% 0.1% 0.1% 0.1% Spirits
0.0%
2005 2006 2007 2008 2009 2010 2011 2012 2013 2014 2015
Cider
Vinegar
Water
Wine Soft drinks Juice Beer Spirits
Proportional to total global export value in 2015
Source: UN Comtrade database (from NZ Customs data); Coriolis classifications and analysis 45You can also read