Medium Term Budget Policy Statement 2019 - Western Cape Government Provincial Treasury - Western Cape ...
←
→
Page content transcription
If your browser does not render page correctly, please read the page content below
Western Cape Government
Provincial Treasury

Medium Term
Budget Policy Statement
2019
Provincial Treasury
Private Bag X9165
7 Wale Street
Cape Town
8000
South Africa
tel: +27 21 483 5618
Email: pt.communication@westerncape.gov.za

www.westerncape.gov.za

PR459/2019
ISBN: 978-0-621-47986-7
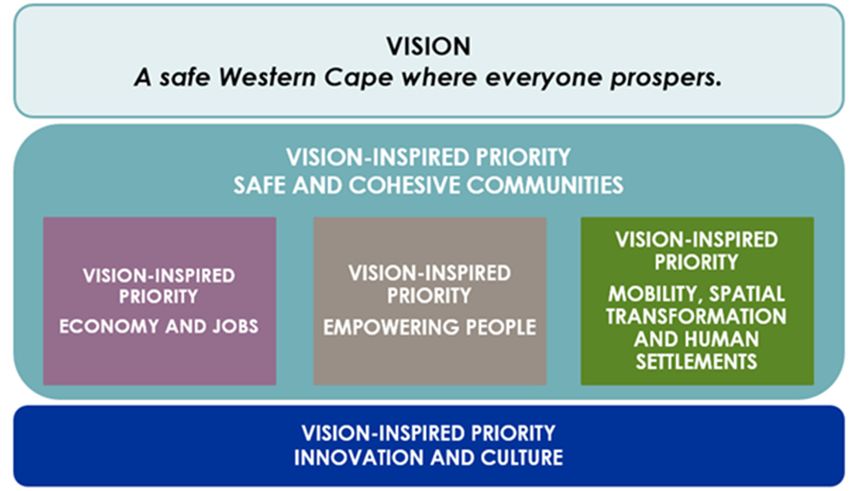
Foreword
The 2019 Medium Term Budget Policy Statement (MTBPS) is set within a context of
pronounced fiscal uncertainty which is further hampered by a pessimistic national
economic outlook.

Through the 2019 MTBPS, the Western Cape Government demonstrates its continued
commitment to fiscal sustainability, and credible planning and budgeting practices.

The 2019 MTBPS outlines the Western Cape’s fiscal response to existing pressures and
illustrates the budget policy priorities of this Province. Despite the unsustainable national
fiscal environment, the Western Cape Government remains steadfast in its approach
to managing key budgetary risks, responding to socio-economic dynamics and
ensuring that service delivery in the Western Cape is not compromised by the
implications of prevailing national economic and fiscal risks.

The upcoming 2019 – 2024 Provincial Strategic Plan, articulates the Western Cape
Government’s renewed commitment to building “A safe Western Cape where
everyone prospers”.

Through the Western Cape Government’s five Vision Inspired Priorities, this government
will work hard to ensure a Province that is safer, attracts investment, boosts economic
growth and creates jobs, empowers people and that transforms the spaces we live in.
These priorities are underpinned by a citizen-centric culture which encourages
innovation and embeds the principles of good governance.

Strengthened collaboration and partnerships with the private sector, civil society and
other spheres of government will play a pivotal role in delivering more efficient and
effective services to ensure that we meet the needs of those living in the Western Cape.

I’d like to offer my sincere appreciation to my fellow Cabinet members, Provincial
Treasury colleagues, officials from other Western Cape Government departments and
our key partners for their valuable contributions to the 2019 Western Cape Medium
Term Budget Policy Statement.

Mr David Maynier
Minister of Finance and Economic Opportunities
26 November 2019
2019 Medium Term Budget Policy Statement

Contents

 Chapter 1     Economic context and outlook
               Introduction                                                    1
               Developments in the global economy                              2
               Developments in the South African economy                       3
               Economic developments in the Western Cape                       6
               Labour market trends                                            7
               Socio-economic developments                                     9
               Conclusion                                                     12

 Chapter 2     The Western Cape Fiscal Response
               Introduction                                                   13
               Economic and Fiscal Risks                                      14
               Western Cape Fiscal Risk Statement                             15
               Western Cape Government Fiscal Strategy                        16
               Implementing the Western Cape Government Fiscal Strategy       17
               2020 MTEF: Provisional Fiscal Framework                        18
               Provincial Equitable Share                                     20
               Provincial Own Receipts                                        24
               Conclusion                                                     28

 Chapter 3     Budget policy priorities
               Introduction                                                   29
               Global, national and provincial policy context                 30
               Medium term provincial budget policy framework                 30
               Medium term budget policy priorities                           33
               Safe and Cohesive Communities                                  33
               Economy and Jobs                                               37
               Empowering People                                              45
               Mobility, Spatial Transformation and Human Settlements         48
               Innovation and Culture                                         50
               2019 Adjusted Estimates                                        53
               Conclusion                                                     54

 Glossary                                                                     55

                                                                          i
2019 Medium Term Budget Policy Statement
Tables
Chapter 1: Economic context and outlook
Table 1.1 Global economic outlook, 2019 - 2020 2
Table 1.2 South African economic outlook, 2019 - 2022 5
Table 1.3 Real GDPR growth rates of the Western Cape economy by 7
district
Table 1.4 Labour market aggregates, 2014 and 2019 8
Chapter 2: The Western Cape Fiscal Response
Table 2.1 Western Cape provisional fiscal framework 19
Table 2.2 Summary of Provincial Equitable Share data updates 21
Table 2.3 Summary of estimated Provincial Receipts raised in the Province 25
Table 2.4 Western Cape Provincial Receipts by source 26
Figures
Chapter 1: Economic context and outlook
Figure 1.1 Performance of the Western Cape economy relative to the 6
global and national economies, 2009 - 2019
Figure 1.2 Western Cape population by district, 2019 10
Chapter 3: Budget policy priorities
Figure 3.1 Common themes across all districts 31
Figure 3.2 Western Cape Government Vision Inspired Priorities 33
iiAcronyms
AAGR Average Annual Growth Rate
AFR Asset Finance Reserve
AIDS Acquired Immune Deficiency Syndrome
APFYD Agricultural Partnership for Youth Development
ASEZ Atlantis Special Economic Zone
BFI Budget Facility for Infrastructure
COPC Community Oriented Primary Care
CPI Consumer Price Index
CYCCs Child and Youth Care Centres
DGS Digital Government Strategy
DHIS District Health Information System
DOA Department of Agriculture
DOCS Department of Community Safety
DSP District Safety Plans
DTPW Department of Transport and Public Works
ECD Early Childhood Development
EDB Ease of Doing Business
EGRA Early Grade Reading Assessment
EIIF Ecological Infrastructure Investment Framework
EMS Emergency Medical Services
EPWP Expanded Public Works Programme
EU European Union
GDP Gross Domestic Product
GDPR Gross Domestic Product per Region
GHS General Household Survey
HIV Human Immunodeficiency Virus
HPV Human Papillomavirus
ICT Information Communication Technology
IDPs Integrated Development Plans
IDZ Industrial Development Zone
IMF International Monetary Fund
IPP Independent Power Producer
iii2019 Medium Term Budget Policy Statement JDA Joint District Approach LEAP Law Enforcement Advancement Plan LURITS Learner Unit Record Information Tracking System MS2B Municipal Service to Business MTBPS Medium Term Budget Policy Statement MTEC Medium Term Expenditure Committee MTEF Medium Term Expenditure Framework MVL Motor Vehicle Licence MYPE Mid-Year Population Estimates NCDs Non-communicable Diseases NDP National Development Plan NHI National Health Insurance NHWs Neighbourhood Watches NPO Non-Profit Organisation NSC National Senior Certificate PPI Producer Price Index PPP Public Private Partnership PRASA Passenger Rail Association of South Africa PSDF Provincial Spatial Development Framework PSP Provincial Strategic Plan PV Photovoltaic RMB/BER Rand Merchant Bank/Bureau for Economic Research RSEP Regional Socio-Economic Projects RTR Red-Tape Reduction SANDF South African National Defence Force SARB South African Reserve Bank SBIDZ Saldanha Bay Industrial Development Zone SCOA Standard Chart of Accounts SDF Spatial Development Framework SDG Sustainable Development Goals SEA School Evaluation Authority SEZ Specific Economic Zone SOC State Owned Company SoS School of Skills iv
2019 Medium Term Budget Policy Statement

Stats SA   Statistics South Africa
STEAMAC    Science, Technology, Engineering, Arts, Mathematics, Agriculture,
           Coding and Cloud Computing
STI        Sexually Transmitted Infection
TB         Tuberculosis
TVET       Technical and Vocational Education and Training
T2P        Transform to Perform
US         United States
VIP        Vision Inspired Priority
WC         Western Cape
WCCCRS     Western Cape Climate Change Response Strategy
WCED       Western Cape Education Department
WCG        Western Cape Government
WCIDWRP    Western Cape Integrated Drought and Water Response Plan
WCLA       Western Cape Liquor Authority
WoSA       Whole of Society Approach
WoW        Western Cape on Wellness

                                                                         v
1
Economic context and
outlook
In summary
Global economic growth for 2019 is forecast to moderate to 3.0 per cent - the slowest rate since 2009.
The South African economy is forecast to grow by 0.5 per cent in 2019, a downward revision from
1.5 per cent expected earlier in the year.
Economic output in the Western Cape is projected to rise by 0.7 per cent in 2019, following an estimated
increase of only 0.2 per cent in 2018, before accelerating to 1.2 per cent in 2020.
While some progress has been made in respect of education and health outcomes, challenges such as
unemployment and crime remain.
█ Introduction
The current economic environment and outlook, articulated in this
chapter, sets the context for and informs the national and provincial
fiscal policy and budget decisions. The global and national
economies have deteriorated, with growth estimates for 2019, as
well as the economic outlook revised downward. The Western Cape
economic growth is expected to accelerate in 2019, buoyed by
recovering agricultural output and the services sector. The
provincial economy is forecast to grow in line with the national
economy in 2020.
Progress has been made on several key education and health
outcomes. While the Western Cape Government has implemented
programmes to improve economic growth and socio-economic
development in the Province, challenges such as unemployment
and crime remain.
12019 Medium Term Budget Policy Statement
█ Developments in the global economy
In the October 2019 World Economic Outlook publication, the
International Monetary Fund (IMF) lowered its forecast for global
growth for 2019 by 0.2 percentage points from July 2019 to
3.0 per cent (see Table 1.1). The IMF cites the drag caused by trade
policy uncertainty, mainly the ongoing tension between the US and
China, as one of the key reasons behind the lower forecast. The IMF
expects an acceleration to 3.4 per cent in 2020.
Table 1.1 Global economic outlook, 2019 - 2020
Difference from
Forecast July 2019 forecast
(% change) (% points)
2018 2019 2020 2019 2020
World output 3.6 3.0 3.4 -0.2 -0.1
Advanced economies 2.3 1.7 1.7 -0.2 0.0
Emerging and developing economies 4.5 3.9 4.6 -0.2 -0.1
Source: International Monetary Fund, 2019
Economic growth in Growth in advanced economies is set to slow from 2.3 per cent in
advanced economies 2018 to 1.7 per cent in both 2019 and 2020. The forecast for most
adjusted lower for 2019 economies was lowered for 2019, but no change was made to 2020
as upward revisions to some regions, mainly the United States (US),
countered downward adjustments to others such as Europe. The US
forecast for 2020 was lifted by 0.2 percentage points compared to
the July 2019 forecast. This is, in part, because the US economy
remains supported by accommodative monetary policy and a
strong labour market which is supportive of consumer spending.
However, there are increasing signs that retaliatory Chinese tariffs
are hurting the US agricultural sector. Overall, US growth is expected
to slow to 2.4 per cent in 2019 and 2.1 per cent by 2020 as the boost
from earlier fiscal policy stimulus fades. In the Euro area, growth was
adjusted downwards by 0.2 percentage points to 1.4 per cent for
2020, mainly driven by a lower forecast for Germany. The German
economy is still negatively affected by the roll-out of new car
emission standards in Europe - although the impact should fade
through 2020 - and falling external demand.
In emerging markets, growth is expected to decline to 3.9 per cent
in 2019 before accelerating to 4.6 per cent in 2020. Both the 2019
and the 2020 forecast were adjusted lower compared to the July
2019 forecast, mainly due to softer growth in China. Escalating trade
tariffs and government measures to curtail debt accumulation have
negatively impacted the Chinese economy. As such, the IMF
forecast growth to slow to 5.8 per cent by 2020 – down from
6.6 per cent in 2018. The Indian economy, in contrast, is expected to
grow at a faster pace of 7.0 per cent in 2020, from an expected
2Chapter 1: Economic context and outlook
6.1 per cent in 2019. The economy is expected to be boosted by the
lagged impact of monetary policy easing, tax cuts and broader
regulation changes. Growth in sub-Saharan Africa is forecast to
remain unchanged at 3.2 per cent in 2019 before accelerating to
3.6 per cent in 2020. Most oil-exporting nations, including Nigeria, are
forecast to benefit from recent higher oil prices. The exception is
Angola, where the economy is still forecast to contract in 2019 due
to a fall in oil production.
Beyond 2020, the IMF expects growth in advanced economies to
stabilise around 1.6 per cent as improved productivity growth will be
countered by slower labour force growth, due to aging populations.
Emerging market growth is forecast to settle around 4.8 per cent.
However, this rate masks a divergence among regions with
emerging and developing Asia anticipated to grow at a much
faster rate than the other regions.
In addition to the downward revision to the growth outlook, the risks Most risks to the global
around the forecast identified by the IMF remain skewed to the outlook are of a
geopolitical nature
downside. Most of the risks are of a geopolitical nature and include:
A further escalation of trade tensions resulting in disruptions to
global supply chains. This also includes the continued possibility -
although waning - of a no-deal Brexit.
A sudden change in sentiment resulting in a loss in risk appetite.
This could expose existing financial vulnerabilities worldwide and
may result in significant capital outflows in emerging markets.
Over the longer term, the threat posed by cyberattacks on
financial infrastructure as well as the negative impact of climate
change.
█ Developments in the South African economy
Economic growth eased to 0.8 per cent in 2018 from 1.4 per cent in
2017. During the first quarter of 2019, a 3.1 per cent
quarter-on-quarter 1 contraction was recorded as activity in the
primary sector2, in particular, declined. This contraction was partly
due to Eskom electricity outages. Economic growth rebounded to
3.1 per cent quarter-on-quarter in the second quarter of 2019.
Leading the recovery were the mining sector and the tertiary sector,
most notably the finance, insurance, real estate and business
services sector.
1 Seasonally adjusted and annualised.
2 The primary sector consists of the agriculture, forestry and fisheries and mining and
quarrying subsectors.
32019 Medium Term Budget Policy Statement
Outlook for SA economy Data so far for the third quarter of 2019 suggests that the growth
adjusted downward for momentum eased substantially. This includes the RMB/BER Business
2019 - 2021 Confidence Index which fell to a 20-year low of 21 in the third
quarter of 2019, from 28 in the second quarter of 2019. Business
confidence fell in four of the five sectors surveyed namely, retail,
wholesale, manufacturing and building. Therefore, despite the
sharp uptick in activity in the second quarter of 2019, the economy
remains muted. According to the National Treasury, economic
growth of only 0.5 per cent is expected for 2019 before accelerating
to 1.2 per cent in 2020. This represents a downward revision of 1.0
and 0.5 percentage points for 2019 and 2020 respectively, relative
to the February 2019 forecast. In all, the National Treasury expects
economic growth to average 1.1 per cent between 2019 and 2021
compared to 1.8 per cent forecast in February 2019.
On an annual basis, household consumption rose by 1.0 per cent in
the first half of 2019. While still growing, persistently high
unemployment, increases in the fuel price and tax hikes have
curtailed spending on non-essential items. Looking ahead, a mild
acceleration in household consumption is expected as disposable
income and employment gradually improve.
Private sector fixed After contracting by 1.6 per cent in the first quarter of 2019, fixed
investment rebounded investment spiked in the second quarter of 2019. This was largely due
in the second quarter of to a sharp rise in private sector fixed investment, in part due to further
2019 developments related to the Independent Power Producer (IPP)
programme. Public sector fixed investment, in contrast, contracted
in the first half of 2019. The National Treasury expects overall capital
outlays to contract in 2019 before recovering in 2020. Growth in fixed
investment is predicted to quicken thereafter through to 2022. This is
expected to be as a result of a gradual improvement in business
confidence and continued investment by the IPP programme.
Government consumption rose by 1.8 per cent in 2018 and is
estimated to remain stable with similar growth projected for 2019.
However, government expenditure is projected to slow noticeably
in 2020 and 2021. This is in line with the National Treasury’s aim to
reduce spending on goods and services.
4Chapter 1: Economic context and outlook
Table 1.2 South African economic outlook, 2019 - 2022
Actual Estimate Forecast
2018 2019 2020 2021 2022
Percentage change unless otherwise indicated
Final household consumption 1.8 1.3 1.3 1.5 1.7
Final government consumption 1.9 1.8 1.8 1.1 0.6
Gross fixed capital formation -1.4 -0.8 0.8 1.3 1.8
Exports 2.6 -1.7 2.5 2.8 3.1
Imports 3.3 1.1 1.9 2.6 3.0
Real GDP growth 0.8 0.5 1.2 1.6 1.7
GDP at current prices (R billion) 4 874 5 132 5 449 5 804 6 187
CPI inflation 4.7 4.3 4.9 4.9 4.8
Current account balance (% of GDP) -3.5 -3.4 -3.5 -3.5 -3.5
Source: South African Reserve Bank, National Treasury, 2019
Inflation has remained reasonably subdued thus far in 2019, with Inflation well within
both CPI and PPI rising by 4.1 per cent year-on-year in September target band thus far in
2019
2019. The National Treasury expects inflation to average 4.3 per cent
in 2019 before accelerating to 4.9 per cent in 2020. The somewhat
higher projected inflation in 2020 is mainly due to the likelihood of
higher electricity tariffs as well as higher meat and grain prices,
which would negatively impact on consumer spending.
Due to the benign inflation profile and domestic growth concerns,
the South African Reserve Bank (SARB) lowered the repurchase rate
by 25 basis points in July 2019 to 6.5 per cent. However, at the
September 2019 meeting the SARB kept the rate unchanged. A
significant risk to the interest outlook remains the movement in the
rand exchange rate as a determinant of imported inflation.
Several risks to the national economic outlook noted in the 2019
Provincial Economic Review and Outlook have already
materialised. These include the further state intervention and
financial support to state owned companies (SOCs) and tax
revenue underperformance. Risks to the outlook include continued
support to SOCs declining business confidence, the intensification of
global trade tensions which will place additional pressure on the
rand, and economic growth underperformance. Collectively, these
risks have resulted in a downward revision of Moody’s 2020 growth
outlook for South Africa from 1.5 per cent to 1.0 per cent.
52019 Medium Term Budget Policy Statement
█ Economic developments in the Western Cape
WC growth slowed to After slowing to 1.1 per cent in 2016, economic growth in the
0.2 per cent in 2018 Western Cape edged somewhat higher to 1.2 per cent in 2017.
Growth is estimated to have slowed to only 0.2 per cent in 2018. The
economic slowdown nationally was exacerbated in the Province by
the adverse supply shocks, particularly in the agriculture and related
sectors.
Figure 1.1 Performance of the Western Cape economy relative to the
global and national economies, 2009 - 2019
6
5
4
y-o-y % change
3
2
1
0
-1
-2
2009 2010 2011 2012 2013 2014 2015 2016 2017 2018 2019
World South Africa Western Cape
Notes: World and South Africa figures for 2019 are estimates.
Western Cape figures for 2018 and 2019 are estimates.
Source: International Monetary Fund, Statistics South Africa, Western Cape Provincial
Treasury, 2019
WC economy to register Economic output in the Western Cape is still expected to rise by
mild acceleration in 0.7 per cent in 2019, despite the downward adjustment to the
2019 National Treasury’s forecast for the South African economy.
A number of factors are expected to support growth in the
Western Cape economy. Firstly, output in the agricultural sector in
the Western Cape is likely to recover as drought conditions ease.
The caveat is that part of this improvement is due to base effects
and it is expected that a full recovery in agricultural production, to
pre-drought levels, will be a gradual, multi-year process. Secondly,
the Western Cape economy remains more services orientated than
the rest of the economy. Within this, the finance, insurance, real
estate and business services sectors dominate. During the first half of
2019, these sectors grew by 2.7 per cent year-on-year nationally.
Given the sector’s size in the Western Cape, it is likely that the
Province benefitted more from the growth in this sector than the rest
of the economy.
6Chapter 1: Economic context and outlook
The Western Cape economy is forecast to expand by 1.2 per cent WC economy set to
in 2020. This is in line with the National Treasury’s forecast for South grow in line with national
estimates in 2020
Africa’s economic growth.
Spatial aspects of the Western Cape economy
The Cape Town Metropolitan Area is the hub of economic activity
in the Province and accounted for 72.2 per cent of total provincial
economic output in 2017. The second biggest district economy in
the Province is that of the Cape Winelands (11.3 per cent), followed
by the Garden Route (7.6 per cent). Between 2008 and 2017 the
economy of the Western Cape grew by an average of 2.0 per cent
per annum.
Table 1.3 Real GDPR growth rates of the Western Cape economy by
district
Real GDPR 2017 % of % GDPR growth
Metro/District R’billion WC GDPR (2008 - 2017)
Cape Metro 284.7 72.2% 1.9
West Coast 19.5 4.9% 2.4
Cape Winelands 44.6 11.3% 2.4
Overberg 13.5 3.4% 2.8
Garden Route 29.9 7.6% 2.3
Central Karoo 2.0 0.5% 2.2
Western Cape 394.3 100.0% 2.0
Source: Quantec Research, 2019
Growth within the Cape Metro has been bolstered by the
performance of the agriculture, forestry and fishing as well as the Overberg District
general government sectors that grew at an average annual rate registered fastest growth
of 4.4 and 3.2 per cent respectively between 2008 and 2017. Outside between 2008 and 2017
of the Cape Metro, all districts achieved growth above the
provincial average. Although coming from a comparatively low
base, the fastest growth over the reference period was recorded in
the Overberg District, which grew at an average of 2.8 per cent.
Growth within the Overberg District was largely driven by strong
economic performance in the Swellendam (3.6 per cent) and
Theewaterskloof (3.3 per cent) municipal areas. In turn, the growth
within these two municipal areas were mostly supported by strong
showings of the construction as well as the finance, insurance, real
estate and business services sectors.
█ Labour market trends
National employment has grown by an annual average of
1.6 per cent per annum between the third quarters of 2014 and 2019
to almost 16.4 million. While this is marginally slower than the rate of
growth of the working age population, the labour force has
72019 Medium Term Budget Policy Statement
however grown substantially faster. Western Cape employment
grew by an average annual growth rate of 2.7 per cent over the
same period, adding 312 000 jobs to the Province and bringing
employment to almost 2.5 million. This represents growth that
exceeded the rate of growth in both the Province’s working age
population and labour force.
SA unemployment rate Nationally, narrow unemployment grew by almost 1.6 million over
at 29.1 per cent, while the 5-year period, equivalent to a growth rate of 5.5 per cent per
WC unemployment rate
annum. This translates into an increased national unemployment
at 21.5 per cent
rate of 29.1 per cent in the third quarter of 2019 compared to
25.4 per cent five years earlier. In contrast, narrow unemployment in
the Western Cape remained virtually constant and stood at 683 000
in the third quarter of 2019. This resulted in a two-percentage point
decline in the provincial unemployment rate, from 23.6 per cent to
21.5 per cent over the same period. Thus, by the third quarter of
2019, while the Province accounted for 15.2 per cent of the
country’s employed population, it accounted for only 10.1 per cent
of the unemployed.
Table 1.4 Labour market aggregates, 2014 and 2019
2014Q3 2019Q3 Change
Thousands Thousands Thousands Per cent
Western Cape
Working age population 4 200 4 664 465 2.1 p.a.
Employment 2 182 2 494 312 2.7 p.a. *
Narrow unemployment 675 683 8 0.2 p.a.
Narrow labour force 2 857 3 177 320 2.1 p.a. *
Expanded unemployment 747 809 62 1.6 p.a.
Expanded labour force 2 928 3 303 374 2.4 p.a. *
Non-searching unemployed 71 125 54 11.9 p.a. *
Narrow unemployment rate 23.6% 21.5% - 2.1 percentage points
Expanded unemployment rate 25.2% 24.5% - 0.7 percentage points
South Africa
Working age population 35 489 38 582 3 094 1.7 p.a.
Employment 15 117 16 375 1 258 1.6 p.a. *
Narrow unemployment 5 151 6 734 1 583 5.5 p.a. *
Narrow labour force 20 268 23 109 2 841 2.7 p.a. *
Expanded unemployment 8 436 10 272 1 836 4.0 p.a. *
Expanded labour force 23 552 26 647 3 094 2.5 p.a. *
Non-searching unemployed 3 285 3 538 253 1.5 p.a. *
Narrow unemployment rate 25.4% 29.1% 3.7 percentage points
Expanded unemployment rate 35.8% 38.5% 2.7 percentage points
Note: An asterisk (*) denotes a statistically significant change between 2014 and 2019 at
the 95 per cent level of confidence.
Source: Development Policy Research Unit, Statistics South Africa (2014; 2019)
8Chapter 1: Economic context and outlook
Expanded unemployment nationally grew by 1.8 million or at an Provincial expanded
average annual rate of 4.0 per cent over the last five years. This unemployment grew by
only 1.6 per cent
translates into an increase in the national expanded unemployment
rate from 35.8 per cent in the third quarter of 2014 to 38.5 per cent
in the third quarter of 2019. Provincially expanded unemployment
grew by 62 000, or at an average annual rate of 1.6 per cent
over the same period, however the Province’s expanded
unemployment rate decreased from 25.2 per to 24.5 per cent over
this period.
The marginal growth in the number of expanded unemployed in the
Province was driven by growth in the number of non-searching
unemployed, which grew at an average annual rate of
11.9 per cent over the last five years, albeit from a low base of just
71 000. It is important to note that in the last two of those five years
there has been a reversal in the growth trend, with non-searching
unemployed decreasing by 2.5 per cent and 7.3 per cent
respectively. The Province accounts for 3.5 per cent of the country’s
non-searching unemployed, up slightly from 2.2 per cent in 2014.
Working-age adults in the Western Cape are more likely to
participate in the labour force than is the case nationally. The labour
force participation rate is estimated at 68.1 per cent in the third
quarter of 2019 in the Province, compared with 59.9 per cent
nationally. Nationally, this is 0.4 percentage points higher than the
third quarter of 2018, while provincially it is 0.4 percentage points
lower. The relatively low unemployment rates combined with
relatively high labour force participation rates ensure a relatively
high employment-to-population ratio in the Western Cape. This ratio
is estimated at 53.5 per cent in the third quarter of 2019,
1.0 percentage points down from a year earlier, but
11.1 percentage points higher than the national rate of
42.4 per cent. This means that, while more than half of the Province’s
working age population was employed in the third quarter of 2019,
this was true of slightly more than two out of five of the national
working age population.
█ Socio-economic developments
Population dynamics
Population dynamics have a big influence on socio-economic WC population
developments of the Province. The Western Cape accounts for estimated at 6.8 million
11.6 per cent of the national population with 6.844 million people
living in the Province in 2019. The majority of the provincial
population reside in the City of Cape Town, followed by the Cape
Winelands, while the Central Karoo remains the least populous
district.
92019 Medium Term Budget Policy Statement
Figure 1.2 Western Cape population by district, 2019
West Coast
6.6%
Cape Winelands
13.5%
Overberg
4.3%
Garden Route
9.0%
City of Cape Town
65.6% Central Karoo
1.1%
Source: Stats SA, 2019
Provincial population At 28.8 per cent, the Province has a relatively large population
projected to grow to below the age of 15 years. This population cohort is likely to slowly
7.6 million by 2025
shrink due to the falling total fertility rate3 in the Province which is
estimated to reach 2.00 between 2016 and 2021 from 2.33 per
woman between 2001 and 2006. In-migration will thus play a larger
role in population growth in the Province with an expected net
inflow of more than 361 000 residents between 2016 and 2021. The
provincial population is projected to grow at an average annual
rate of 1.7 per cent to 7.586 million by 20254. The spatial distribution
of the provincial population is not expected to change substantially
over the projected horizon.
Education
Almost 1.1 million The number of learners enrolled in public ordinary schools in the
learners enrolled in Western Cape totalled 1 064 268 in 2019 – a 15.8 per cent increase
public ordinary schools from 2013. These learners are mostly concentrated in three metro
in Western Cape education districts, which together accommodate more than
50 per cent of all learners enrolled in the Province. The Metro districts
also contribute the most to the burgeoning learner enrolment
numbers in the Province, with the same three districts accounting for
an additional 23 539 learners into public education over the last
three years. Preliminary projections estimate learner numbers to
increase to 1.127 million by 20225.
Learner performance in Mathematics and Language is tracked
through the annual systemic tests conducted in Grades 3, 6 and 9.
Since 2013, there have been significant improvements in learner
3 Number of live births per 1 000 women aged 15 to 44 in a calendar year.
4 Western Cape Department of Social Development, 2019
5 Western Cape Education Department, 2019
10Chapter 1: Economic context and outlook
performance in Grade 6 and Grade 9 mathematics as well as
Grade 6 language which improved by 14.1 percentage points,
8.7 percentage points and 15.5 percentage points respectively.
However, in more recent years the incidence of decline in learner
performance in both areas have become more frequent.
The percentage of learners who passed the National Senior
Certificate (NSC) in 2018 was 81.5 per cent, compared to the
Increase in proportion of
78.2 per cent national average. Despite a decline in the provincial matriculants eligible for
pass rate, from 82.2 per cent in 2017, some notable improvements B degree programme
were recorded in the quality of passes of those who wrote the entry in 2018
examination in 2018. Of the 41 350 candidates who wrote the exam,
21 492 (42.3 per cent) attained a B degree pass. This is an
improvement from the 39.1 per cent who qualified in the previous
year.
Health
Life expectancy in the Province continues to improve. Life
expectancy amongst males in the Province is currently estimated at
65.7 years and females at 71.1 years, compared to 61.5 years for
males and 67.7 years for females nationally.
Recent mortality trends in the Province shows that Ischaemic heart
disease (8.2 per cent) was the leading cause of death in the
Province in 2016, followed by diabetes mellitus and HIV/AIDS,
respectively, at 8 per cent. Death as a result of HIV/AIDS declined
from 8.5 per cent recorded in 2015. The decline may be partly due
to the continued expansion of the HIV/AIDS programme over the
last several years. This has led to consistent improvements in the
proportion of HIV positive people knowing their status, receiving their
treatment and achieving viral suppression from 42.6 per cent in
2016/17 to 46.6 per cent in 2018/19. The programme expansion has
resulted in a low mother-to-child transmission rate of 0.3 per cent by
2018/19. It is projected that almost 315 500 public health service
patients will be on antiretroviral treatment by 2022/23, up from just
over 278 000 in 2018/19.
The leading causes of premature mortality during 2016 were Interpersonal violence
interpersonal violence (11.3 per cent), HIV/AIDS (10.9 per cent) and was the leading cause
of premature mortality in
Tuberculosis (7.6 per cent). The mortality trends continue to display
the Province in 2016
a gender bias, with interpersonal violence being the leading cause
of death and premature mortality amongst males in the Province.
Crime
Crime has a negative effect on the quality of life and economic
development. According to the most recent Stats SA Victims of
Crime Survey, the Western Cape had the largest portion of
112019 Medium Term Budget Policy Statement
households exposed (1.32 per cent) to assaults in 2018/19.
Households with younger heads were more likely to experience
assault than households with elderly heads. The number of murders
and culpable homicide reported to the South African Police Service
in the Western Cape increased with 4.1 per cent between 2017/18
and 2018/19, the highest growth rate of all provinces.
The Survey further showed that 6.0 per cent of households in the
Western Cape experienced incidences of housebreaking, while
1.4 per cent of households were exposed to home robbery in
2018/19. According to the survey, approximately 40 per cent of
home robberies in South Africa remain unreported. Households in
the lowest income bracket and those in the highest income bracket
were found to be most likely to experience housebreaking. The
likelihood of home robbery is however inversely related to the age
of the head of the household.
A large portion of South Africa’s reported cases of malicious
WC had largest
proportion of households damage to property and arson were found to have occurred in the
exposed to street Western Cape (25.1 per cent). Only 41 per cent of victims were
robbery satisfied with police services after reporting of deliberate damaging,
burning or destruction of residential dwellings. People in the Western
Cape and Gauteng were more likely to be victims of theft of
personal property than people in other provinces. The
Western Cape had the largest portion of households exposed to
street robbery (1.91 per cent) in the country, with males more likely
to be victims of street robbery than females.
█ Conclusion
Despite a weaker national economy, the Western Cape economy
is expected to recover in 2019 following the contraction in the
previous year. Provincial employment has improved over the last 5
years, as has unemployment.
The national economic environment described in this chapter has
significant implications for the national and provincial fiscal
environment. To maintain fiscal stability, the Western Cape
Government Fiscal Strategy continues to inform the provincial fiscal
response. The chapters that follow outline the Western Cape
Government’s fiscal response to the current economic
environment, as well as the strategic priorities and interventions to
boost economic and employment growth and improve socio-
economic development outcomes.
122
The Western Cape Fiscal
Response
In summary
The South African economic and fiscal outlook has significantly deteriorated.
Struggling state-owned companies, specifically Eskom, remain a risk to the fiscal outlook.
The Western Cape Government Fiscal Strategy provides stability, credibility, and transparency in the way
the fiscal envelope is compiled while guiding key fiscal policy decisions.
The Western Cape Government will continue to apply measures of fiscal consolidation to keep the Province
on a sustainable fiscal path.
Principles for determining the 2020 MTEF provisional fiscal framework include specific interventions to
reduce expenditure and enhance revenue collection.
█ Introduction
This chapter provides an outline of the Western Cape Governments’
fiscal response to the weaker economic and fiscal environment. The
2019 National Medium Term Budget Policy Statement confirmed the
deteriorating national fiscal outlook, as the budget deficit and
national debt continues to grow. The Western Cape Government
Fiscal Strategy was proactively developed based on early market
signals of prolonged weak economic growth to mitigate the
potential impact on the sustainability of the provincial fiscal
framework. The main objective of the Strategy is to ensure the
sustainability and credibility of the provincial fiscus, while placing the
citizen at the centre of delivery and supporting economic growth
and socio-economic development.
132019 Medium Term Budget Policy Statement
█ Economic and Fiscal Risks
National economic environment
South Africa’s economic growth continues to fall short of what is
National economic
needed to alleviate high unemployment, poverty and inequality.
growth fails to alleviate
Despite the recovery from the first quarter contraction, the national
unemployment, poverty
and inequality economy remains fragile. The national economy is expected to
grow by just 0.5 per cent in 2019, compared to the 1.5 per cent
economic growth forecast at the time of the 2019 National Budget.
While growth is expected to improve to 1.2 per cent in 2020, it
remains constrained by exposure to international geopolitical
developments and declining business and consumer confidence.
In addition, South Africa continues to face a number of structural
problems such as high unemployment, low growth and decreasing
competitiveness, which require urgent intervention. The most
immediate and urgent risk to economic growth is that of Eskom and
the related energy security issues and the solvency of other SOCs.
This yields broad-based risks to economic growth over the short to
medium term as well as risks for the national fiscal framework.
National fiscal environment
National Governments’ countercyclical fiscal policy has not
Growing national debt
translated into stronger economic growth. The low economic
as revenue collection
growth has impacted on national revenue collection, requiring
falls short
national government to increasingly finance the budget deficit.
National debt and associated debt-service costs have increased to
an expected 60.8 per cent of GDP in 2019/20 and 64.9 per cent in
2020/21. By 2022/23, debt-service costs are expected to exceed
spending on health, community development and economic
development.
The national expenditure outlook nonetheless sees non-interest
expenditure increase by R23 billion in 2020/21, before decreasing by
R8.2 billion in 2021/22, relative to the 2019 National Budget. These
net changes include increases in non-interest spending for
additional support to Eskom; and reductions mostly in goods and
services, and current and capital transfers.
In a bid to narrow the revenue shortfall and slow spending growth
over the 2020 MTEF, the National Treasury has reduced national
departments’ baselines and decreased planned transfers to local
and provincial governments over the outer years of the MTEF. It must
be noted, that the budget baseline reductions are to some extent
contingent upon a wage agreement between the National
Treasury and organised labour on future adjustments to wage bill
14Chapter 2: The Western Cape Fiscal Response
growth. Given recent tax increases, there is limited scope for further
tax revenue bolstering.
The National Treasury has identified three primary fiscal risks over the Lower growth, increased
medium term that, if realised, would have a significant impact on SOC dependency
public finances. First; is lower than anticipated economic growth among primary risks to
resulting in lower revenue collection, which would have a significant fiscal sustainability
impact on service delivery. Second; is the inability to implement the
governance and operational reform at SOCs, leading to further
pressures on fiscal resources. Last; is increased pressures on
provincial and municipal budgets, negatively impacting on their
ability to meet debt obligations. Further risks include a significantly
above inflation public sector wage agreement.
To encourage robust debate on reforms required to stimulate the
national economy, the National Treasury published a discussion
paper titled “Economic Transformation, Inclusive Growth, and
Competitiveness: Towards an Economic Strategy for South Africa” in
August 2019. The paper identifies and supports short and medium-
term policy priorities by thematic growth reforms which have the
potential to boost economic growth.
Reforms to reduce the dependency of SOCs on the national fiscus
are at various stages of development. The Department of Public
Enterprises, in its recently released paper titled “Road Map for Eskom
in a Reformed Electricity Supply Industry”, proposes to unbundle
Eskom into three distinct entities, that is, generation, transmission and
distribution. The reforms aim to ensure a sustainable electricity
supply by addressing Eskom’s operational and financial challenges.
█ Western Cape Fiscal Risk Statement
The Western Cape Fiscal Risk Statement was published in 2016 as
Greatest risk to the
part of the 2017 - 2020 Western Cape Medium Term Budget Policy
Provincial fiscus is that of
Statement. The Statement outlined a number of risks such as the
a reduced fiscal
fragile economic growth, lower provincial own revenue collection, envelope
the changing provincial demographic profile, unsustainable
government personnel expenditure, water security and the spillover
effects of the drought. Since then, several risks have materialised
and new emerging risks have been identified. These include
increased safety concerns and incidents of violent crime as well as
uncertainty regarding the fourth industrial revolution. At present, the
greatest risk to the provincial fiscus is that of a reduced fiscal
envelope. Should this risk materialise, the level of service delivery
across all sectors of government could be compromised. This
includes, amongst others:
152019 Medium Term Budget Policy Statement
The inability to appoint enough teachers to accommodate
learner growth numbers resulting in an increasing teacher-learner
ratio.
Non-compliance with infrastructure norms and standards
leading to overcrowding and the occupation of unsafe
buildings.
Decreased access to- and quality of- public health services and
standards with longer waiting times for emergency services, and
even longer waiting times for non-emerging medical treatments,
resulting in declining health outcomes.
The inability to adequately provide social services and support to
vulnerable children, older persons, persons with disabilities and
victims of violence and disasters.
Scaling back of infrastructure services will adversely impact on
construction, modernisation, refurbishments, and maintenance
of provincial facilities and the provincial road network.
█ Western Cape Government Fiscal Strategy
The Western Cape Government will continue to implement the
WCG Fiscal Strategy
provides stability, Western Cape Government Fiscal Strategy. The Strategy provides
credibility, and stability, credibility, and transparency in the way the fiscal envelope
transparency is compiled and guides key fiscal and budget policy decisions.
The Western Cape Government Fiscal Strategy is enabled through
three budget elements:
Balanced budget - ensures that sufficient room exists within
provincial reserves to respond to its mandate and to deal with
any shocks, while giving effect to its budget policy priorities.
Expenditure management - ensures that Compensation of
WCG will continue to
build on its established Employees, Goods and Services, Transfers, and Infrastructure
fiscal and budget policy budgets are within sustainable and credible levels and finding
principles the appropriate mix of expenditure items to achieve the
sustainability and efficiency of spend.
Revenue management - enhance and optimise revenue
collection and the application of own revenue for policy
initiatives as well as revenue enhancement initiatives. It also
includes engagements with the National Treasury on the
appropriateness and responsiveness of the National Fiscal
Transfer System.
16Chapter 2: The Western Cape Fiscal Response
The Strategy is underpinned by four fiscal and budget policy
principles:
Allocative efficiency - ensures a balanced allocation of
resources that reflects the priorities of the Western Cape
Government and programme effectiveness based on evidence,
with a greater focus on reprioritisation and trade-offs.
Fiscal sustainability - ensures the continuous and stable delivery
of services without major and/or sudden disruptions in budget
allocations which could potentially be caused by economic and
fiscal constraints.
Fiscal consolidation - ensures the reduction of government
expenditure or the rate by which government expenditure
increases, in a responsible manner, whilst simultaneously
increasing government revenues.
Fiscal discipline - ensures that departments and enterprises
remain within budget limits and avoid unauthorised, irregular,
fruitless and wasteful expenditure.
█ Implementing the Western Cape Government
Fiscal Strategy
The Western Cape Government has prepared for the eventuality of
WCG has prepared for
a weaker economic and fiscal environment by embedding the the eventuality of
Western Cape Government Fiscal Strategy elements and weaker growth
implementing its principles in all budget decisions. This ensures the
sustainability of public finances and makes provision for fiscal space
to cope with any adverse supply shocks by building up provincial
reserves.
The Western Cape Government will continue to focus on fiscal
consolidation to keep the Province on a sustainable fiscal path. The
adoption of measures to boost revenue collection and the
implementation of proactive debt management are key to
achieving sustainability. Further measures implemented include the
Compensation of Employees reduction strategy and a review of
procurement strategies, amongst others. In addition, the Province
will continue to explore alternative measures to fund its infrastructure
development, further details of which are contained in Chapter 3.
Ongoing steps to strengthen oversight over departments and
entities will be key over the medium term as well as strict adherence
to budget policy principles.
172019 Medium Term Budget Policy Statement
Integrated Service The Integrated Service Delivery approach is a key enabler of the
Delivery key in Fiscal Strategy. The approach supports co-planning, co-budgeting
implementing WCG and co-implementation across provincial departments and
Fiscal Strategy between spheres of government operating within the Western
Cape, thereby facilitating greater efficiency, sustainability and
responsiveness in service delivery. The 2020 MTEF Budget process will
continue to take an Integrated Service Delivery approach, and in
doing so, places the citizen at the centre of delivery through the
Western Cape Government’s Vision Inspired Priorities.
█ 2020 MTEF: Provisional Fiscal Framework
Overall fiscal framework
Due to the deteriorating economic and fiscal environment, higher
interest payments, lower than anticipated tax returns and
unbudgeted support to SOCs, transfers from national government
will grow at a slower rate than in the past. Over the medium term,
government proposes to allocate 48.1 per cent of available non-
interest expenditure to national departments, 43 per cent to
provinces and 8.9 per cent to local government.
Provincial transfers will Over the 2020 MTEF, national government resources will grow at an
be reduced by annual average of 2.3 per cent, provincial resources by 6.1 per cent
R20.3 billion over the and local government resources by 6.2 per cent. Provincial transfers
2020 MTEF
will be reduced by R20.3 billion over the 2020 MTEF, of which the
Provincial Equitable Share is to be reduced by R7.3 billion and direct
Conditional Grants are to be reduced by R13 billion.
Table 2.1 provides the consolidated position of the Western Cape
provisional fiscal framework. Total national transfers, inclusive of the
Provincial Equitable Share and Conditional Grants to the Province,
amount to R68.454 billion in 2020/21, R73.438 billion in 2021/22 and
R77.746 billion in 2022/23; which amounts to a total of R219.638 billion
over the 2020 MTEF.
18Chapter 2: The Western Cape Fiscal Response
Table 2.1 Western Cape provisional fiscal framework
Adjusted Estimate Medium term estimate Total
R'000 2019/20 2020/21 2021/22 2022/23 2020 MTEF
Transfers from National 64 247 630 68 454 210 73 437 703 77 746 242 219 638 155
Equitable share 51 290 593 55 464 365 59 551 995 63 194 020 178 210 380
Conditional grants* 12 843 082 12 989 845 13 885 708 14 552 222 41 427 775
Conditional grants rollover 113 955 - - - -
Own receipts 2 406 216 2 384 540 2 487 954 2 607 376 7 479 870
Asset Financing Reserve 935 339 645 931 334 555 315 000 1 295 486
PRF Financing 1 027 570 719 739 375 363 402 000 1 497 102
Provincial Revenue Fund: Tax Receipts 602 305 633 321 668 154 700 225 2 001 700
Total 69 219 060 72 837 741 77 303 729 81 770 843 231 912 313
Percentages
Transfers from National 92.8% 94.0% 95.0% 95.1% 94.7%
Equitable share 74.1% 76.2% 77.0% 77.3% 76.8%
Conditional grants 18.6% 17.8% 18.0% 17.8% 17.9%
Conditional grants rollover 0.2% 0.0% 0.0% 0.0% 0.0%
Own receipts 3.5% 3.3% 3.2% 3.2% 3.2%
Asset Financing Reserve 1.4% 0.9% 0.4% 0.4% 0.6%
PRF Financing 1.5% 1.0% 0.5% 0.5% 0.7%
Provincial Revenue Fund: Tax Receipts 0.9% 0.9% 0.9% 0.9% 0.9%
Total 100.0% 100.0% 100.0% 100.0% 100.0%
* Conditional Grant Allocations to Provinces have yet to be determined.
The Western Cape draws its resources from the following four
sources:
Provincial Equitable Share transfer from national government;
Conditional Grant transfers from national government;
Provincial Own Revenue; and
Accumulated Financing Reserves.
The Provincial Equitable Share transfer is an unconditional transfer
allocated to provinces based on a redistributive formula, and is the
Western Cape’s principal revenue source. The scope with which to
allocate the Provincial Equitable Share across priorities is
constrained by the public service wage bill as well as the delivery of
core social functions such as health and education, given their
personnel intensity.
Conditional Grants is the second largest source of funding for the
Western Cape. In the main, Conditional Grant funding is designed
to fund national priorities and compensate provinces for
cross-boundary population flows in respect of specialised services,
such as tertiary health services.
192019 Medium Term Budget Policy Statement
Provincial Own Receipts About 6 per cent of total provincial revenue is derived from
important source of Provincial Own Receipts and from Provincial Reserves built up over
supplementary revenue
previous years. While small in comparison with national transfers,
for the Province
these are important supplementary revenue sources for the
Western Cape fiscus.
█ Provincial Equitable Share
Provincial Equitable Share formula and data updates
Several key changes to The Provincial Equitable Share formula has undergone a review
the PES formula process over the past few years. Key changes relate to the data
implemented
sources used in the education component. The change from using
the SNAP data to the Learner Unit Record Information Tracking
System (LURITS) data to measure school enrolment commenced in
the 2018 MTEF1.
This change was implemented using a three-year phase-in,
meaning that in the 2018 MTEF, the data comprised of two-thirds
from the old SNAP data and one-third from LURITS. In the 2019 MTEF,
the data comprised of two-thirds from LURITS and one-third from
SNAP. As from 2020, the education component will be fully reliant on
the LURITS data set.
In addition, the change to the age cohort data from using Census
data to using data on the 5 - 17 age cohort data from the annual
Stats SA Mid-Year Population Estimate commenced in the 2019 MTEF
and will be fully phased-in by the 2021 MTEF. With this change it is
possible to update the age component on an annual basis, unlike
the previous reliance on Census data where such an update was
only possible every 10 years.
To ensure that the formula is reflective of inter-provincial changes,
PES data updates
translated to an the individual Provincial Equitable Share components are subject to
additional R2.188 billion the annual technical data updates. In this way those provinces that
for the WC over the experience higher growth in the demand for services and/or
2020 MTEF population changes relative to other provinces are compensated.
For the Western Cape, these data updates translate to an
additional R2.188 billion over the 2020 MTEF.
Table 2.2 summarises the various components of the Provincial
Equitable Share formula and the data sources used. The impact of
these data updates on the Provincial Equitable Share are phased-
1 The key difference between these two datasets is that the LURITS tracks learners
throughout their learning years, whereas SNAP data is a count of the number of
learners present on the 10th day of each academic year.
20Chapter 2: The Western Cape Fiscal Response
in over the three-year MTEF period, to smooth the impact of these
data changes on individual provinces.
Table 2.2 Summary of Provincial Equitable Share data updates
Weight Component Data used
48% Education 2019 Mid-Year Population Estimates
2019 LURITS
27% Health 2019 Mid-Year Population Estimates
Insured population (2018 GHS)
Risk adjusted index
Patient load data (DHIS 2017/18 - 2018/19)
16% Basic 2019 Mid-Year Population Estimates
3% Poverty 2019 Mid-Year Population Estimates
Income and Expenditure Survey 2010/11
1% Economic GDPR 2017
5% Institutional Distributed equally amongst provinces
Additional funding for policy priorities
The 2020 MTEF sees three new adjustments allocated outside of the
Provincial Equitable Share formula to fund national policy priorities
within the social development sphere. Although being funded
separately to the Provincial Equitable Share formula, these funds are
still transferred as part of the Provincial Equitable Share through
additional funds reprioritised from national government.
Over the 2020 MTEF, R59.715 million has been allocated to the Additional funding
Western Cape to sustain the employment of social workers in areas received over 2020 MTEF
to address social
with a high prevalence of gender-based violence, substance abuse
challenges
and issues affecting children.
The Western Cape will receive R17.041 million over the 2020 MTEF to
assist in efforts to address the social and structural drivers of HIV, TB
and STIs and gender-based violence. This will enable the Province
to continue to support non-profit organisations (NPOs) implementing
Social Behaviour Change programmes.
Toward ensuring that provinces improve access to sanitary dignity
for indigent girl learners, funds were added to the Provincial
Equitable Share for 2019/20. Over the 2020 MTEF, R31.531 million has
been provided to continue the rollout of this project. These funds
were divided across provinces in terms of the proportion of
Grade 4 – 12 girl learners in quintile 1 – 3 schools in each province.
212019 Medium Term Budget Policy Statement
Changes to national Conditional Grants proposed over the
2020 MTEF
The following section shows changes to national Conditional Grants,
however allocations to provinces still need to be determined:
Comprehensive Agricultural Support Programme
Funding over the 2020 MTEF will be reprioritised to fund improved
Reforms to several
conditional grants laboratory capacity, border controls and inspections by the
proposed National Department. This is to support animal and plant health to
maintain exports as exports depend upon sound biosecurity and the
capacity to quarantine animal and plant products. Improvements
to biosecurity capacity are important so that South Africa maintains
sufficient quality in its exports to continue exporting to the European
Union and other markets.
Reforming the funding of informal settlements upgrading
In the 2019 MTEF Budget, there was an introduction of dedicated
windows for the upgrading of informal settlements where
20 per cent of the Human Settlements Development Grant and
30 per cent of the Urban Settlements Development Grant was
ring-fenced for informal settlements upgrading, subject to new
planning requirements. The planning requirements relate to having
a province and/or city-wide plan for how informal settlements
would be prioritised and sequenced for upgrading. Provinces and
cities have however struggled to meet the planning requirements in
the timelines that have been provided and have also been subject
to technical issues relating to the new requirements.
Policy directive on Furthermore, the National Department of Human Settlements is still
Informal Settlements to finalise the policy directive on the Informal Settlements Upgrading
Upgrading and People’s
programme and the Peoples Housing Process programme. The
Housing Process
directive will give clarity on the programmes’ intent and guidance
programme to be
finalised on the design, purpose, conditions, and expected output and
outcomes of the new grants.
The intention was to introduce the windows in the 2019 Budget for a
period of one year then to divide the funds into separate informal
settlements upgrading grants from 2020/21 onwards. However there
has not been enough time to assess the performance of these new
windows to decide whether the windows should become fully
fledged grants for the upgrading of informal settlements. Several
issues were raised at the City Budget Forum in August 2019 but most
metros agreed that the informal settlements window should be
extended for another year before a new informal settlements grant
is introduced.
22You can also read