IMPACTS OF SEVERE NATURAL CATASTROPHES ON FINANCIAL MARKETS - CAMBRIDGE CENTRE FOR RISK STUDIES NATCAT AND FINCAT CORRELATION
←
→
Page content transcription
If your browser does not render page correctly, please read the page content below
Cambridge Centre for Risk Studies
NatCat and FinCat Correlation

IMPACTS OF
SEVERE NATURAL
CATASTROPHES
ON FINANCIAL
MARKETS
The Cambridge Global Risk Index aims to measure the global risk outlook from 22 threats across 300 cities. Wide
streams of research across multiple disciplines are required to power the creation of the Cambridge Global Risk Index.
Cambridge Centre for Risk Studies acknowledges the generous support provided for this research by the following
organisations:

The views contained in this report are entirely those of the research team of the Cambridge Centre for Risk Studies
and do not imply any endorsement of these views by the organizations supporting the research, or our consultants and
collaborators.

Paper Citation:
Cambridge Centre for Risk Studies, Impacts of Severe Natural Catastrophes on Financial Markets, March 2018.

or

Mahalingam, A., Coburn, A., Jung, C. J., Yeo, J. Z., Cooper. G., Evan, T., Impacts of Severe Natural Catastrophes on
Financial Markets, March 2018.

Copyright © 2018 by Cambridge Centre for Risk Studies.

Cambridge Centre for Risk Studies
University of Cambridge Judge Business School
Trumpington Street
Cambridge, CB2 1AG
United Kingdom
enquiries.risk@jbs.cam.ac.uk
www.jbs.cam.ac.uk/risk
Impacts of Severe Natural Catastrophes on
              Financial Markets

                          Contents

Executive Summary								                            5

Introduction					                                    9

Objectives of the Study                             13

Trillion Dollar Natural Catastrophe Scenarios				   15

Impacts on the Economy and Financial Markets			     36

Further Discussion							                           44

Conclusions			                                      53

References							                                   55
Impacts of Severe Natural Catastrophes on Financial Markets
Section 1: Executive Summary
In this report we explore the potential for very large natural catastrophes to trigger market shocks and subsequent
economic downturns that would have an impact on both sides of an insurance company’s balance sheet: the
losses that would be paid out in claims from their property casualty underwriting portfolio and the devaluations
and reduction in returns that would occur to the financial assets in their investment portfolio.
To date, few natural catastrophes have registered any impact on the shape of the global market. The most
costly natural catastrophe of history, 2005’s Hurricane Katrina, moved the New York Stock Exchange by less
than a single percentage point with its $150 billion in direct damages. The last decade has presented a growing
number of high-cost natural catastrophes (six have caused destruction costing $10 billion or more), and 2017
represented a record year for loss as a result of significant floods, earthquakes and hurricanes impacting major
economies, such as Hurricane Harvey in the Southern USA, Hurricane Maria in the Caribbean, and major
mudslides in India, Bangladesh and Nepal. Despite this devastation, trading volumes remain steadily high and
investment portfolios do not appear to have been impacted by these relatively localised but severe disasters.
Historically it has been man-made risks that have posed the greatest threats to market continuity; events such
as the 1929 Wall Street Crash and 2008’s subprime financial crisis caused significant enough shocks to distort
global markets. These events removed more than $10 trillion in anticipated GDP from economies across the
world. Since 2009, the Cambridge Centre for Risk Studies has modelled a number of hypothetical scenarios
as stress tests for investment portfolios and financial risk management, including GDP output and investment
hygiene, and that would cause significant levels of market impact: a territorial war between China and Japan, a
virulent flu pandemic, and a breakdown of the European Union, etc. In 2014, a study into the macroeconomic
impact of a global mass protest movement, ‘Millennial Uprising’ (also sponsored by Munich Re). In each of these
cases, both historical and hypothetical, the Centre observed that direct and indirect economic losses of over $1
trillion are those that correlate to significant detrimental change in the markets.
Given the increase in accrued damages from natural catastrophes worldwide, the growing exposure from
industrialisation of developing nations and network of global industry and high-cost assets, the potential loss
vectors for future natural catastrophes are growing. Climate change is a factor, contributing to the frequency of
floods, hurricanes and droughts. If a future natural catastrophe could cause a disruption of economic output of
a trillion dollars or more, could this trigger a stock market devaluation that would impact investment portfolios?
Over the course of several years, the Cambridge Centre for Risk Studies has identified a number of potential
‘Trillion Dollar Nat-Cats’, by using the Cambridge Global Risk Index to identify cities at risk from major natural
catastrophes. From these, six scenarios across three threat groups are featured and analysed extensively in
this report for their potential effect on markets and investment portfolios.
Scenario summaries
The six scenarios consist of two major earthquakes, two tropical windstorm events, and two volcanic eruptions.
These are each extreme events with remote return periods, but entirely plausible from our understanding of
geological and climate sciences. Two separate scenarios are presented for large magnitude earthquakes
impacting modern megacities. The first of these is a magnitude 7.7 earthquake on the Newport-Inglewood fault
system impacting Los Angeles and the surrounding area, including ports, airports, and industry, causing over
$850 billion in damages. The second scenario is of a magnitude 8.3 earthquake in the Kantō subduction zone
affecting Tokyo and parts of central Japan, compounded by an accompanying tsunami. The Tokyo earthquake
event is estimated to cause $1.37 trillion in damages, both insured and uninsured. In both cases, recovery from
the quake takes several years and requires substantial government stimulus.
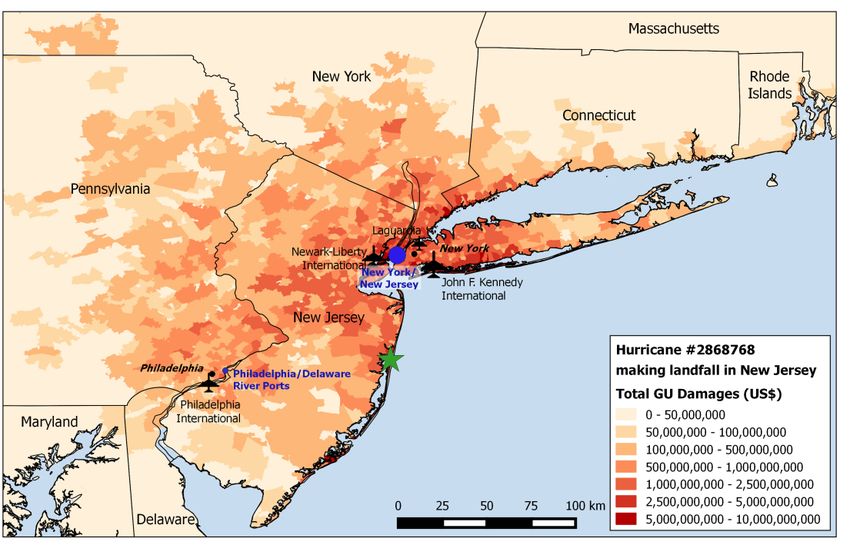
The first of the two hurricane scenarios impacts Miami and the Florida coast, causing $1.35 trillion in damage,
including extensive property loss in the affected areas. The second is a transitioning hurricane that retains wind
strength as its track takes it over the property concentrations of the East Coast of United States including New
York and the New Jersey area, causing $1.15 trillion in damage. Hurricane recovery periods are significantly
shorter than the earthquake events – around one and two years, respectively.
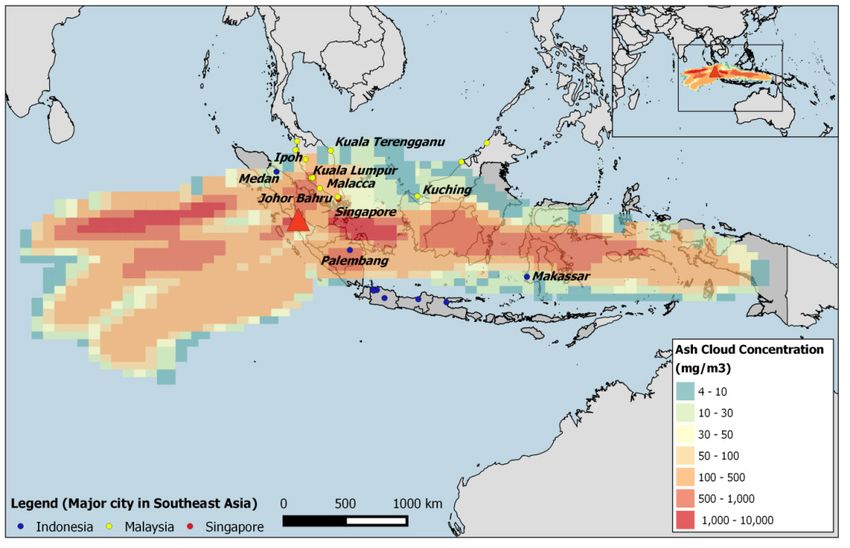
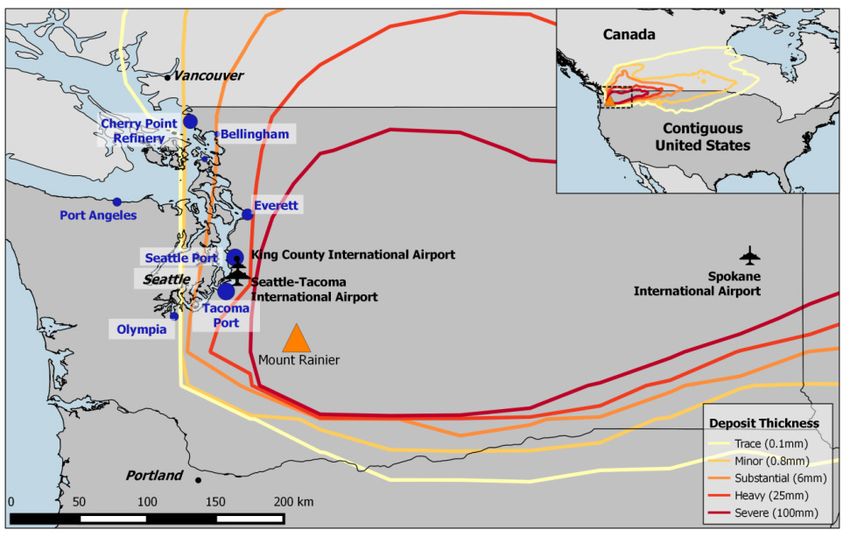
The third threat class concerns large scale VEI 6 eruptions of two historically active volcanos with the potential
to impact high concentrations of exposure in the regions around them. The first is the eruption of Mount Marapi
5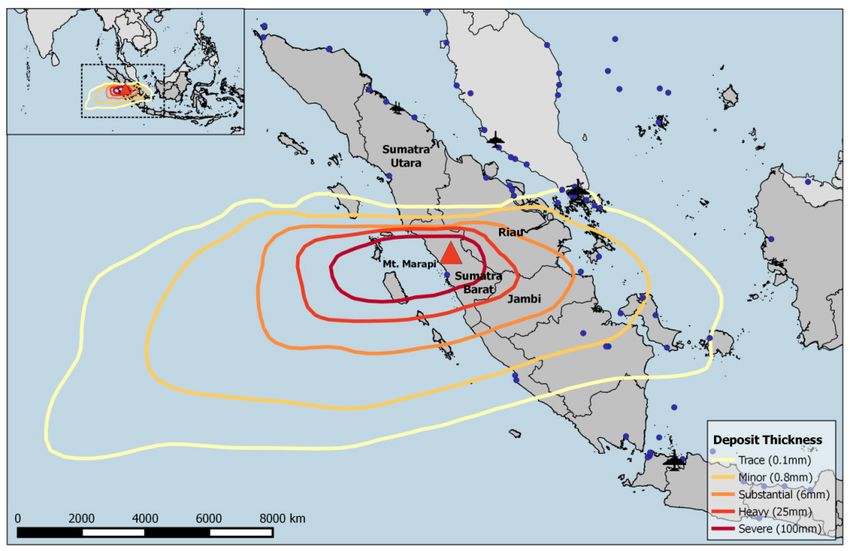
Cambridge Centre for Risk Studies

in West Sumatra, Indonesia, which last erupted in 1815, causing significant climatic change worldwide. Tephra
deposits from this eruption are distributed across Singapore and Malaysia by prevailing winds, affecting air
travel and disrupting vital global supply chains. The second scenario describes the eruption of Mount Rainier
in Washington, United States, which buries several major US airports and sea ports in tephra. Tephra deposits
are swept as far away as the east coast of Canada, impacting air travel following the eruption. In both cases,
global temperatures are affected by the eruptions, leading to three years of climate abnormalities, global food
shortages and soaring inflation.

Economic and market consequences
Each of these scenarios is highly destructive and results in the destruction of around a trillion dollars of physical
property and infrastructure, and affects populations of millions of people. It disrupts the business activities of
entire regions, and halts the economic output for a lengthy period of time, taking several years for the economy
to recover. The economic impacts are also felt far beyond the damaged region itself. Customers, suppliers,
and trading partners of disrupted businesses are also affected, in neighbouring regions and even in far-away
countries. The interconnectivity of modern business means that the spill-over effects result in consequential
amplifiers of this shock throughout the global economy.
We estimate that these events trigger reduced growth in global GDP for several years following the event, with
total loss of the GDP that might otherwise be expected (GDP@Risk) ranging from $1.9 trillion (Tokyo earthquake)
to $7.6 trillion (eruption of Mount Rainier). These are significant multiples of the costs of the property damage
loss. None are quite large enough on their own to trigger a global recession (negative growth for more than two
quarters) although some come close and cause several years of weakened national economies. The weakened
economies that result would be more vulnerable to any other shocks that could occur coincidentally during the
recovery period, and make a recession more likely.
These economic effects are of sufficient magnitude that they have significant effects on the financial markets,
much more severely than natural catastrophes have had in the past. Market shocks include the devaluation
of various classes of investment assets, changes in interest rates, changes in currency exchange rates and
sovereign credit ratings, and bond yields, even in high quality asset classes. Equity markets, which are typically
volatile to shocks and news events, have strong temporary downturns. Stock exchanges in the countries directly
impacted are worst affected, but all major exchanges around the world see contagion from this effect and suffer
lesser versions of the same shocks. Estimates of likely drops in stock exchange share price indices range from
a 6% crash on the Nikkei following the Tokyo earthquake to a 20% loss to the S&P500 after the Mount Rainier
eruption.
There are a few winners as well as many losers – with disparities favouring the sectors that gain from future
reconstruction investment, and competitors of the disrupted businesses gaining in market share.

Investment portfolio impacts
We model a high quality investment portfolio representing typical structures similar to those reported by major
global insurance and reinsurance companies, with an asset composition of geographical markets and financial
instruments that reflect the expected liabilities and exposures of their underwriting activities in international
markets around the world. The nature of high quality investment portfolios is that they are robust to short term
market fluctuations, but these investment portfolios are not immune to the levels of market depreciations that
occur from events of this magnitude. We estimate that the perturbations in the markets that would result from
these scenarios would mean a reduction in returns to typical investment portfolios of this type in the single
figures of percentage reductions, for example 6% in the event of the Florida hurricane scenario, with some
potential for double digit reductions in returns from some variations in portfolio structure. Other types of portfolio
structures, representing other investment strategies that might be typical of other types of institutional investors,
such as those looking for aggressive growth, conservative or balanced investment strategies, are likely to see
more severe reductions in yields depending on their asset mix and geographical structures.

Variation in impacts and durations
These six events, chosen for their approximate scale of destruction, do not all have the same impacts on the
financial markets. The role of the United States as a driver of the global economy means that events that occur

6
Impacts of Severe Natural Catastrophes on Financial Markets

in the US and impact the direct output of the US economy are more significant and have a larger spill-over
than those occurring elsewhere. The duration of the recovery is significant in determining the overall economic
consequence, which will have implications for how government and foreign investment would potentially respond
to try to minimise reconstruction time when events of this scale occur. The ensuing changes in inflation, interest
rates, employment, national debt levels, foreign investment, and other macroeconomic factors affect a wide
variety of financial investment asset classes that will affect the returns from the mix of these in any investment
portfolio.

How many events could trigger similar scales of losses?
This report examines six potential natural catastrophe scenarios that could trigger a loss of a trillion dollars
or more in either physical damage or loss to economic output. We have demonstrated that this level of loss
is above the threshold that would cause correlated reduced returns from an insurance investment portfolio
combined with large underwriting loss pay outs. There are potentially several more candidate scenarios beyond
these six, for natural or climatic events on a similar or worse scale that could cause loss to both sides of the
insurers’ balance sheet.
In generating the Cambridge Global Risk Index, an estimate of potential shocks to the global economy that
could result from threat events impacting cities that generate around half of the world’s GDP, the research
team at the Cambridge Centre for Risk Studies identified natural catastrophe scenarios with potential for trillion
dollar economic losses.1 In addition to evaluating the earthquakes, windstorms, and volcanic eruptions that
could potentially impact major concentrations of economic exposure around the world, the study also identified
further scenarios. These include rare and extreme events such as the potential for multiple river systems to
flood multiple major cities in Europe, a typhoon and associated flooding impacting the South China coastline;
extreme flooding in many cities in Asia during an extreme monsoon season; a tsunami that impacted many cities
around the Pacific rim; and other climatic and geophysical risks.
It is also possible that market-impacting losses could result from multiple natural catastrophe events occurring in
a single year or within a season of a few months. Several smaller events could cause a combined loss that would
be sufficient to trigger the kinds of market consequences described here, particularly if they occurred within a
short period of time. These could be coincidental occurrences of independent events, such as the occurrence
of earthquake events at the same time as windstorms. It could also result from a sequence of weather events
that may have underlying correlation, such as a series of hurricanes making landfall on highly populated regions
during an active season, or from a destructive hurricane in the US transitioning into an extra-tropical cyclone
that hits Europe with strong wind speeds. Underlying weather cycles such as the North Atlantic Oscillation and
El Niño Southern Oscillation could result in clusters of severe weather events on different sides of the globe,
including hurricanes, typhoons, monsoon rain fall patterns, wild fires, and droughts.

How much worse could it get?
For this study we selected events of large magnitude, around the trillion dollar threshold of loss that would cause
effects on the market. More destructive events are possible, and these would cause significantly greater market
impacts. Multi-trillion events, or even larger, would be even more disruptive to the markets and potentially result
in even greater depreciations to investment portfolios and balance sheet impacts. This report has not analysed
how increased scales of loss would impact insurers’ balance sheets, but estimates suggest that increases in the
scale of loss from a destructive event could have non-linear consequences – i.e. these could potentially cause
tipping points for large scale devaluation of investment portfolios and major balance sheet impacts.
The magnitudes of the chosen scenarios are thought to be towards the upper end of current scientific constraints,
but it is plausible that even larger magnitude events could occur. Certain circumstances could also make these
example scenarios even more destructive and costly than our best estimate assumptions – secondary follow-on
perils such as major flood events following hurricanes, or conflagrations following earthquakes, could greatly
increase the total resultant loss. Volcanic eruptions can occur that are orders of magnitude larger than the VEI
6 (‘colossal’) events we model – there have been more than 60 known VEI 7 (‘super-collossal’) eruptions in
geological history and records of VEI 8 (‘mega-collossal’) eruptions.

1
    Cambridge Centre for Risk Studies (2016); Global Risk Outlook for 2017

                                                                                                                     7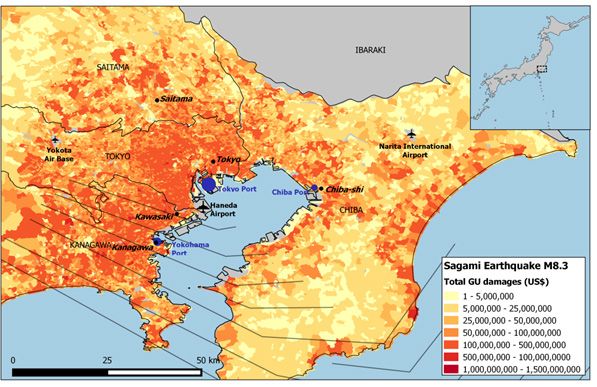
Cambridge Centre for Risk Studies

All large-scale catastrophes are followed by cost inflation as a result of suddenly increased demand for repair
and reconstruction resources. Our modelling assumes standard assumptions about post-disaster inflation rates,
but demand-driven inflation is very non-linear and under more pessimistic assumptions cost escalation could
make a disaster very much more expensive, and greatly increase the recovery time, both of which would
generate more impact on the financial markets.
Our assessment assumes that markets react rationally and proportionately. It is possible that markets could
respond more negatively to these events. For example if a future catastrophe were to impact concentrations of
headquarters of high value companies – perhaps Silicon Valley in Northern California, or clusters of locations
of the big companies of the digital economy (Google, Apple, Facebook, Amazon), even if the companies
themselves are not disabled from functioning, then investor sentiment could mark down these sectors more
strongly and cause market downturns beyond those expected.
The scenarios could potentially have even more economic impact if they were compounded by follow-on
catastrophes. The 2011 Tohoku earthquake in Japan triggered a tsunami that caused a nuclear meltdown.
Similar follow-on catastrophes could magnify the impact of a trigger event. Natural catastrophes could potentially
cause widespread and lengthy power outages and disruptions to communications and information technology
that could prove to be bigger amplifiers of economic loss than has been expected here. Catastrophes exploit the
weaknesses in a system. It is possible to imagine scenarios where a natural catastrophe damaged a biological
research laboratory and enabled the release of a pathogen that caused a global pandemic. There are events in
history where natural catastrophes have triggered geopolitical crises, and resulted in social unrest, political and
civil disorder, regional conflicts, and interstate wars. A natural catastrophe may not need to be the cause of a
further crisis – any additional events that coincidentally occur while the region and the economy is still weakened
and recovering will have a stronger market impact than if they happened at another time. And conversely if the
natural catastrophe were to occur during a period of economic or financial crisis, the consequences could be
very much more severe.
Finally, it is also possible that very much larger market impacts could also occur from several large magnitude
natural catastrophe events occurring in a single year or season. The insurance industry is becoming used to
ever-increasing record years for total losses from major catastrophes. An extreme year could see unexpectedly
large numbers of massive catastrophes coinciding in different regions of the world, with a resultant market
perturbation that would be damaging for the balance sheet.

How likely is this scale of loss?
In Section 4, we present the six scenarios in detail and conclude with a summary of the return periods of
the loss level that each scenario represents for its own geographical market and peril. Each has a very low
annual probability, i.e. a long return period, mostly over a thousand years, so individually each scenario might
potentially be discounted as being too remote to be of concern to enterprise risk managers. However, the return
period for an occurrence of any one of these events, which has the ability to disrupt market returns from high
quality investment portfolios, is estimated to be around 1-in-200 years, around the benchmark for Solvency II
capital requirements.
The number of events that could cause balance sheet impacts from underwriting loss combined with reduced
investment returns may make this a material consideration for capital risk management.
The commonly-accepted assumption that market risk has a very low correlation with underwriting risk, may
be challenged by work of this type. There are clearly levels at which market risk can be triggered by large loss
events.
The use of scenarios derived from catastrophe science and events for which probabilities can be estimated is
a tractable method for assessing the correlation between market risk and underwriting risk. A scenario-based
method could potentially offer a higher confidence assessment for correlation assumptions that could inform or
replace conventional methods, such as copula modelling.
Reports like this one and models of scenario events can be used to improve tail correlation assumptions between
market risk and underwriting risk.

8
Impacts of Severe Natural Catastrophes on Financial Markets

Section 2: Introduction

Correlation between Market Risk and Underwriting Risk
Investment assets are subject to market volatility. In the Great Financial Crisis after 2008, insurers saw
devaluations of their investment assets in the order of 20%, with some individual insurance companies disclosing
asset devaluations of over 50%.2 In addition to reducing an insurer’s ability to pay claims, this reduction in
size of the investment portfolio diminishes an insurer’s income – typically 20% of an insurer’s income comes
from investment returns. Economic downturns and recessions also play a part in market volatility: demand for
insurance shrinks, lapse rates increase, and premium rates soften.
Risk benchmarks
Property Natural Catastrophe is one of the most volatile classes of insurance, with the potential for large claims
pay outs from natural hazard events, such as tropical storms, earthquakes, and floods. Insurers must satisfy
regulators that they hold sufficient capital for specific return periods of loss. Regulations are different in each
market, but Solvency II insurance regulation in European markets is benchmarked to 0.05% annual probability
of exceedance of loss (1-in-200).
It is a commonly accepted assumption that market risk has a very low correlation with underwriting risk, i.e. that
downturns in the market are rarely triggered by the incidence of natural catastrophes and the claims pay outs
that result. This assumption is borne out from analysis of large numbers of natural catastrophes that have caused
insurance industry losses over past decades and stock market asset valuation fluctuations over the same period
– there is very little statistical correlation between the two. There is the chance of random coincidence but no
evidence that natural catastrophes cause stock market adjustments or that market adjustments trigger natural
catastrophes.
Relative scale of losses
The fact that natural catastrophes do not typically move markets is not in itself surprising. Even the largest
catastrophes seen in recent years have had little effect on the main stock exchanges. Significant natural
catastrophes cause losses of tens of billions of dollars of destruction of which insurance pay outs that cover
only a small proportion of the cost. There have been six natural catastrophe events costing $10 billion or more in
the past decade. However these losses are relatively minor in comparison with the scale of the money markets:
in on an average day NYSE trading volumes are around $169 billion.
Impact of major natural catastrophes
The costliest natural catastrophe recorded to date is the 2005 landfall of Hurricane Katrina in Louisiana, with an
estimated destructive cost of around $150 billion, of which $62 billion was covered by the insurance industry.3
This is less than a single percentage point of movement on the New York Stock Exchange. The markets were
generally unmoved by the Hurricane Katrina loss: the S&P500 index saw an eight-day 3% rally in the days
following the hurricane.
The second most expensive natural catastrophe in history, at around $122 billion reconstruction cost, was
the 2011 Tohoku earthquake, tsunami, and subsequent nuclear power plant meltdown in Japan. The events
caused initial market turbulence; the Tokyo Nikkei index declined 1.7% on the same day though later rallied.4
International markets across the world dipped slightly with European stocks down 1%, but US markets were
trended upwards and continued doing so after the earthquake.
Other major natural catastrophes have tended to have similarly minimal impacts on the markets.5 The world’s
most destructive tsunami on 26 December 2004 killed 230,000 people in 14 countries around the Indian Ocean
but there was no obvious impact from the world’s stock markets: the S&P dipped 3.8% 20 trading days later but
later rallied by as much as 35%.

2
    Schich (2009)
3
    Munich Re (2015)
4
    CNN (2011)
5
    Nasdaq (2011)

                                                                                                                 9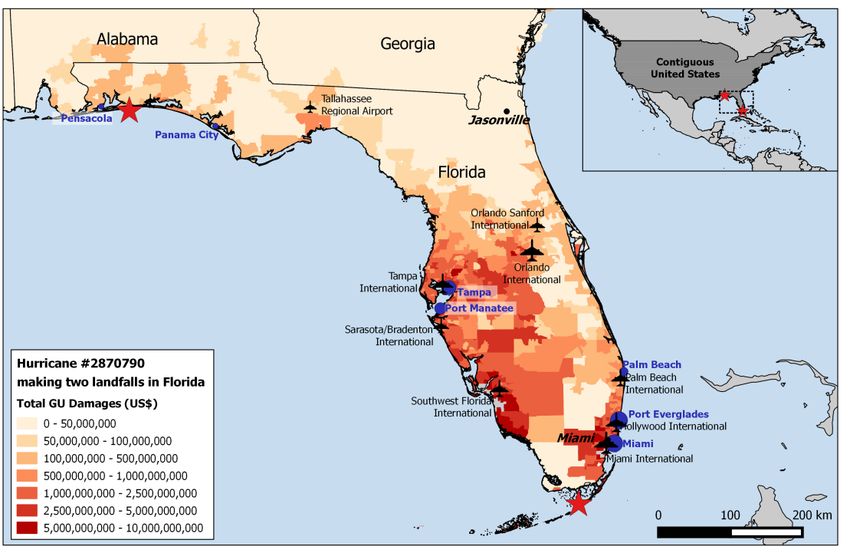
Cambridge Centre for Risk Studies

World Trade Center Attack, 9/11, 2001
The most recent catastrophe with a significant impact on markets was the 9/11 attack on the World Trade
Center and Pentagon building, with destructive costs estimated at over $90 billion, of which around $32 billion
was covered by the insurance industry.6 Stock markets were closed for the week following the attack. When the
market re-opened, the S&P continued its decline from pre-9/11 (it had previously fallen 16%) and lost a further
11.6% in four trading days. The downturn was relatively short-lived and most market indices recovered to pre-
9/11 levels within a month.
Could any natural catastrophe cause a market correction?
Is it possible that a natural catastrophe could cause a market correction that would have a significant material
impact on an insurer’s investment portfolio? In this report, we determine the potential for very large catastrophes
to trigger market shocks and subsequent economic downturns that would have an impact on both sides of an
insurance company’s balance sheet.

What kind of events cause market shocks?
Market adjustments and devaluations occur periodically from a wide range of different causes. The markets
typically refer to a devaluation of the stock market by up to 5% as a ‘correction’. When a devaluation of 10% or
more occurs within a single quarter, this is commonly referred to as a ‘crash’.7 A crash may have a more sustained
fall, but most reach the trough of their decline within a six-month period. Recovery from a financial crisis can
take many years and a weakened economy can be fragile and experience further crises and devaluations
during the recovery. Devaluations of the stock market beyond 15-20% have typically triggered some period of
recession (continued negative growth in the economy), with very large stock market crashes, such as the Wall
Street Crash of 1929, and the Great Financial Crisis of 2008, being followed by lengthy periods of recession and
stagnant or slow economic recovery.
Studies of past stock market crashes provide historical catalogues of events with measurements of peak-to-
trough falls as indicators of the severities of the market correction.8

          Crashes Greater Than                            Number of Crises                            Average Interval (Yrs)
                     10%                                            12                                             16
                     20%                                             9                                             21
                     40%                                             6                                             32
                     80%                                             1                                            190
Table 1:  US Stock Market Crashes since 1800, by peak-to-trough severity
Table 1 summarises the historical catalogue of 28 financial crises by their peak-to-trough severity in the United
States since 1800 – i.e. the % of total value of the stock market lost in the crash, from peak measurement to
the bottom of the cycle, typically within a period of less than six months. This shows that, for example, a market
crash where the stock market has decreased by 20% or more has occurred on average every 21 years over the
past two centuries, and a crash of over 40% has occurred on average every 32 years.
The causes of financial crises are conventionally divided into:
           •    exogenous shocks: triggers from outside the financial system such as a war or a political event;
           •    endogenous shocks: the financial system corrects valuations or adjusts credit and liquidity.
Less than 10% of financial crises are exogenous. The larger and more frequent causes of stock market crashes
are endogenous, where traders lose confidence in market fundamentals and withdraw credit or force a run on
banks. The triggers for these include asset value bubble collapses, banking runs, pricing shocks, sovereign
defaults, and potentially more recently technological threats such as flash crashes. The Cambridge Centre for
6
    Grossi (2009)
7
    Business Insider (2017)
8
   Reviews of Historical Catalogues of Financial Crises are presented in, for example, Reinhart and Rogoff (2010) and Allen and Gale
(2009). A standardised catalogue of historical financial crises has been derived from original research by Cambridge Centre for Risk Studies
(publication in preparation)

10
Impacts of Severe Natural Catastrophes on Financial Markets
Risk Studies has studied several of these financial crisis mechanisms and developed stress test scenarios as
hypothetical examples.9
Severity of events causing stock market shocks
CCRS analyses historical and hypothetical events to understand how the economic fundamentals of an event
are correlated to the potential market corrections that would result. Economic output is commonly affected by
events that occur, and lost economic production relative to the output that would have been expected without
the event occurrence – ‘GDP@Risk’- is a measure of the event severity. CCRS estimates GDP@Risk for
hypothetical events and, where possible, for historical events. CCRS has published more than 12 stress tests
with an estimate of GDP@Risk to the global economy. These studies have also included macroeconomic
modelling of the effect of these events on key stock market indicators, such as the S&P500. Historical events
have well recorded stock market movements, and, although economic output loss is less verifiable, it can be
reasonably estimated.
Modelled Macroeconomic Impact & Stockmarket Index Value
10%
Hurricane Katrina, US 2005
Guangdong-2 NPP Meltdown
0% Modelled
Millennial Social Unrest S2
FR2 Freeze US NE
Cy ber Power Historical
-10% 9/11 Terror Attack NY
Grid Blackout
NE US X1
Stockmarket -20%
Sub-Prime GFC 2008
Shock -30%
Reduction of S&P500
Eurozone Meltdown S2
-40%
Index in One Quarter
-50%
Sao Paulo Pandemic S2
-60%
China-Japan Conf lict X1
-70%
-80% 1929 Wall Street Crash
-90%
10 100 1,000 10,000 100,000
10 Billion 100 Billion 1 Trillion 10 Trillion 100 Trillion
GDP@Risk
$ Economic Output Loss from Event
Figure 1: Economic Output Loss and Stock Market Shock from Events, exhibiting the impact of trillion
dollar effects on market values
Figure 1 posits a plot of the economic output loss from events, both modelled and historical, correlated with
the amount of stock market devaluation shock in a single quarter. The horizontal axis of economic output loss
is presented on a logarithmic scale. A number of these plotted events are hypothetical and are analysed using
macroeconomic modelling techniques. Historical events are shown with recorded stock market devaluation and
estimated global output loss as GDP@Risk.
This chart shows that events that cause very large economic output losses can trigger significant stock market
shocks. Minor events are indistinguishable from daily volatility in the markets and market corrections. The
inflection point for the level of severity of economic output loss that is correlated with identifiable stock market
movements appears to be from around the 1 trillion loss level.
Trillion dollar scenarios
CCRS considers that systemic market impacts occur when event shock losses exceed $1 trillion. The focus of
much of the research work being undertaken at CCRS is on catastrophe scenarios that have the potential to
trigger economic output losses in excess of a trillion dollars. The Centre is currently studying potential ‘trillion
dollar scenarios’ from a wide range of causes, including finance economics and trade risks, geopolitics and
9
Financial crisis mechanisms studied by CCRS include asset bubble collapse (Global Property Crash Stress Test Scenario); sovereign
default (Eurozone Meltdown Stress Test Scenario); De-Americanization of the global financial system (Dollar Deposed Stress Test Scenario);
food and oil price spiral (High Inflation World Stress Test Scenario)
11Cambridge Centre for Risk Studies security, technology and space, health and humanity as well as the natural catastrophe risks being explored in more detail here. If a natural catastrophe event could cause a disruption of economic output of a trillion dollars or more, estimates strongly suggest this has the potential to trigger a stock market devaluation that would impact investment portfolios. Physical Destruction (Stock Loss) vs Economic Output Loss (Flow Loss) The most notable characteristic of natural catastrophes is the destruction of physical assets – damage to property, machinery, and infrastructure. The severity of destruction of a natural catastrophe is typically measured in terms of the total cost of destroyed physical assets, usually as a repair cost, reconstruction estimate, or lost value of the damaged property. This is sometimes referred to as the ‘economic loss’, or ‘ground-up loss’, to distinguish it from the insurance pay out, which is typically only a proportion of the total repair bill. In this report, we distinguish the ‘destructive cost’ of an event from its ‘loss of economic output’. Economic output is lost during a destructive event when the physical means of production are put out of action, or are unable to function because of damage to power, transportation, and utility infrastructure, and the labour pool is made homeless or unable to travel to work. In addition, demand for goods are typically reduced during the initial societal disruption and loss of earnings for the affected population, which increases the economic impact of the event. (The stimulus to the local economy of reconstruction investment is considered below). Third party estimates of ‘economic loss’ (destructive cost) from an event may, in addition to the costs of damaged property, sometimes include business interruption loss, which is a limited amount of lost revenue or profit that depended on the buildings that were damaged beyond usability. It does not typically describe all the lost economic output that results from a destructive event of this type. Insurance coverages often pay out for business interruption loss from a damaged commercial property, so this estimate may be included in the ‘economic loss’ or ‘ground-up loss’ as an input into the estimate of insurance liability for an event. In economics terms, the difference between ‘destructive’ cost and loss of economic output (‘economic loss’) is one of ‘stock’ against ‘flow’. A natural catastrophe typically causes a lot of stock loss and as a result also causes a flow loss. The full impact of a catastrophe is the combined total of stock loss and flow loss. Flow loss is much more difficult to assess than stock loss, which the statistical catalogue principally estimates. Catastrophes in the early 20th century appear to have caused significantly more destructive cost than economic output loss, even in the most industrialised and advanced economic regions of the world. This may be changing as economic growth is outstripping property appreciation, economic productivity is becoming more vulnerable to disruption, and increasingly interconnected global trading relationships are amplifying localised disruption throughout the trading network. In this study, we model the economic loss from six very destructive natural catastrophes. For these six events, the economic output loss (flow loss) is typically three times the destructive cost (stock loss) of the event. We believe that for large catastrophe events of the future, economic output loss will far exceed the destructive cost. Trillion dollar natural catastrophes So far, there has not been a natural catastrophe that has generated an economic loss of a trillion dollars. However, it is worth considering whether events of this magnitude are possible, and what geographies, markets, and assets they would compromise if they did. The record for the costliest catastrophes is continuously being broken. In 1992, Hurricane Andrew in Florida USA caused $25 billion in damage at the time ($43 billion adjusting to 2017). In 1995, the Californian Northridge Earthquake in set a new record of $49 billion ($90 billion adjusting to 2017). By 2005, Hurricane Katrina’s record was for $150 billion ($211 billion in 2017). In 2017, Hurricane Harvey became the costliest natural disaster in the United States since Katrina, with an estimated destructive cost of $125 billion. The increasing cost of the most extreme events is driven by the accumulation and increasing value of assets in areas of hazard, rather than an increase in the severity of events, although over time we are also likely to experience even more extreme magnitude events that each have very long return periods. If the cost of the most extreme events continues to increase, then it may be only a matter of time before we experience the first trillion dollar natural catastrophe. 12
Impacts of Severe Natural Catastrophes on Financial Markets

Section 3: Objectives of the Study

Motivation
Empirical analysis suggests that destructive natural catastrophes have become more costly and more frequent
over recent decades.10 This is mainly due to the increased exposures in the areas at risk, with rising wealth and
increased population concentrations in hazardous areas such as coastal regions and earthquake-prone cities.
It is also possible that the occurrence of extreme weather events could be becoming more frequent as a result
of climate change, although scientific evidence for this is hotly debated.
The insurance market visualises risk transfer into a top-down hierarchy where losses cascade through from the
insured policyholders to the ultimate bearers of risk – the re/insurers. When a natural catastrophe occurs, the
extent of physical damage determines total economic losses, although a large proportion is usually uninsured
(red arrow in Figure 2 below). The insured losses, therefore, are borne by the global insurance market (blue
arrows). Claims first affect the primary insurers, but as they only absorb part of these losses, a proportion of
this direct exposure is transferred to reinsurers. Among reinsurers, this concentrated risk is diversified through
retrocession, while passing only a fraction of losses to the broader financial markets and other institutions
through securitisation. Thus, re/insurers retain most of this natural catastrophe related risk.

Figure 2:  Nat Cat Risk Transfer within the global insurance industry (Data source: von Dahlen and von
Peter, 2012; Re-analysis: Cambridge Centre for Risk Studies)
In this research, we present an illustration of the risks posed by highly plausible but extreme natural catastrophes
(“Nat Cats”). These scenarios are meant to serve as representative examples of such catastrophes and do not
constitute any predictions. Our analysis is aimed at improving the understanding of the potential impact of
catastrophes on the economy and financial markets, to assist with financial investment planning, contingency
planning and operational risk management, and to help insurers and reinsurers with assessments of balance
sheet risks from underwriting losses combined with reductions in investment returns.

10
     Global Reinsurance Forum (2014)

                                                                                                                 13
Cambridge Centre for Risk Studies Each Nat Cat scenario may reveal aspects of potential vulnerability for an organisation but these are primarily intended to identify pathways for improving overall resilience to exogenous shocks with wide-ranging impacts. Research Questions In line with our motivation for this study, we set out to answer three key research questions: 1. What are the macroeconomic impacts of natural disasters such as earthquakes, hurricanes and volcanic eruptions? 2. To what extent do these natural catastrophes affect financial and capital markets? 3. What are the financial impacts of such disaster events on standardized portfolios and investments? Literature Review The academic literature on this subject is plagued with mixed conclusions on the severity of the impacts of such disasters on the financial markets; most studies were carried out at a regional scope and therefore do not extend across borders. There exists a notable gap in literature uncovering the linkages on the international economic spill-over effects of major natural disasters and also in understanding optimal policy responses in the aftermath of a disaster (Zaman, Cavallo, and Noy 2010). While most of these studies provide empirical evidences based on original research, they tend to be limited in scope partly due to data availability and suffer from lack of sufficient elaboration on the intuition behind the transmission of shocks through the system. Natural disasters can have wide-ranging effects on the real economy such as lower growth characterized by GDP loss due to loss of property and life, inflation for certain goods due to excess demand, deteriorating trade balance leading to exchange rate fluctuations, to name a few (Abe et al. (2014); Groth et al. (2011); Melecky and Raddatz (2015); Hochrainer (2000); Parker (2016)). These impacts necessitate the need for: government intervention in the form of aid programs, investing in infrastructure and providing fiscal stimulus for boosting economic growth; and central bank intervention to maintain financial stability in financial markets through appropriate policy measures to provide the required liquidity and dampen asset price volatilities. Moody’s report on understanding the impact of natural disasters describe the multi-pronged effects at the sovereigns and supra-nationals level when a country is hit by a natural disasters (Moody’s 2016). They note that such disasters affect countries by: (i) contracting economic output, (ii) increasing poverty, (iii) worsening trade and fiscal balances, (iv) increasing debt-to-GDP levels and (v) exerting downward pressure on exchange rates while exerting upward pressure on prices. Certain natural disasters also render equity markets vulnerable ((Worthington and Valadkhani (2004); (Ferreira and Karali 2015)) as they impact return rates based on expected recovery times. Foreign exchange markets, however, tend to be less impacted by natural disasters due to government intervention to limit volatility and adjust interest rates following major destructive events (Hatase, et al (2013)). 14
Impacts of Severe Natural Catastrophes on Financial Markets

Section 4: Trillion Dollar Natural Catastrophe Scenarios

Selecting scenarios
We selected six examples of natural catastrophe scenarios that could potentially cause around a trillion dollars
of destruction cost to rebuild damaged property and built infrastructure. It is not an exhaustive list of all candidate
scenarios around the world that could cause a trillion dollars of property loss but is intended as illustrative
examples. We chose two examples from each of the most destructive insured perils of earthquake, tropical
windstorm (hurricane, typhoon, cyclone), and volcanic eruption. Flood was considered but in many areas of
the world flood risk is not a standard exposure of the private insurance market, more typically being covered by
national pools or government programmes.
This meant focussing on the areas where very large concentrations of populations, commerce, and high value
property could potentially be impacted by large magnitude events, determined by the local seismicity, cyclonic
meteorology, and locations of active volcanoes. The largest high value concentrations at risk also tend to be
the areas of highest insurance penetration in developed economies, so these represent potential exposures for
large international insurers. We were not concerned about the probabilities of these events occurring – by their
definition, events of this scale are rare and have long return periods. We consider the likelihood of events of this
scale later in this report.
Cambridge Global Risk Index
An indicator of cities most at risk from natural catastrophes is provided by the Cambridge Global Risk Index,
updated each year by Cambridge Centre for Risk Studies since 2015. We used our own studies of potential large
magnitude events and the likelihood of these impacting 300 cities worldwide that constitute over half of global
GDP, to identify cities with the greatest risk of economic output loss from the selected threats of earthquake,
tropical windstorm, and volcanic eruption. The risk index, GDP@Risk, is a measure of annual expected loss,
derived from convolving the frequency and severity of events from minor to catastrophic. This index provides
a ranking of cities most at risk from disruption to their economic output, but does not provide estimates of the
potential property damage costs of these events.
RMS Natural Catastrophe Models
We are grateful for the generous assistance provided by Risk Management Solutions, Inc., in providing output
from their natural catastrophe models to help us select candidate scenarios, and for the detailed modelling of
the property damage that would result from the scenarios selected.
Volcanic Eruption Risk Analysis
We are grateful to the volcanologists from the Department of Geography at University of Cambridge for their
assistance in screening and prioritizing the volcanoes of the world by their potential to impact regions of high
property value with large magnitude explosive eruptions, to select the candidate scenarios.

                                                                                                                    15
Cambridge Centre for Risk Studies
Earthquake scenarios
Figure 3: Risk of Economic Shock from Earthquake. Cities of the world most at risk from disruption to
their economic output by destructive earthquakes. (source: Cambridge Global Risk Index)
Most earthquakes of small and moderate magnitude are unable to generate a trillion dollars of property damage.
The geographical extent of the earthquake footprint is unlikely to encompass the quantities of property and
the intensities of ground shaking generated are unlikely to cause damage levels at that scale. A loss as high
as a trillion dollars can only result from a very large magnitude earthquake generating strong ground shaking
intensities over a wide area, occurring near the centre of a large metropolitan concentration of high value
property. The cities where the seismology suggests that this scale of loss could be possible are Los Angeles and
San Francisco in United States, and Tokyo in Japan.
RMS maintains a North American Earthquake Model and a Japan Earthquake model. These models consist of
tens of thousands of stochastic simulations of earthquakes that are located on known faults and that represent the
state-of-the-art in likelihood of fault rupture, attenuation patterns of ground shaking, engineering assessments of
vulnerability of different types of property, and potential for follow-on disasters. This is combined with a database
of the total industry exposure of locations, types, and value of property across the geographical areas that are
impacted. RMS provided the event loss table from their models to help us identify candidate scenarios that fit
the criteria we were looking for. Events were selected and RMS provided detailed geographical loss analysis
of each of these events. The return period of losses are taken from considering the probability of that level of
loss being exceeded in the entire geographical model – i.e. the annual probability of exceeding the loss level
generated by the selected Los Angeles scenario from all earthquake events in North America and the annual
probability of exceeding the selected Tokyo scenario loss level from all earthquake events in Japan. Note that
this loss analysis was carried out prior to the release of the RMS version 17 NAEQ model.
EQ-LA: Newport-Inglewood Earthquake
RMS Analysis Summary
• 2011 US FFEQ ILC
• Analysis Vintage: Sept 2015
16Impacts of Severe Natural Catastrophes on Financial Markets
• Event Name: CA Newport-Inglewood Flt – All Seg FM2 c
• Maximum Magnitude: 7.7
• Event ID: 20077557
• Source ID: 1461
• Scenario Analysis: Shake + Fire + EQSL with PLA
• Analysed with Industry Exposure Database: 2011 US FFEQ ILC; Building, Contents, BI value per
postal code
• Earthquake Casualty Analysis
• Scenario Analysis: Worker’s Compensation, 2014 Cost Severities
• Scenario Analysis: Shake Only no PLA
• Analysed with Industry Exposure Database: EDM: 2011 US WC IED; Number of employees per
postal code
Event description and modelled losses
The magnitude 7.7 (Mw) Newport-Inglewood earthquake strikes the right-lateral fault line in Southern California,
which is part of the continental transform San Andreas Fault. The RMS modelled loss from this earthquake
is $863.1 billion in total damages, both insured and uninsured. This estimation reflects damage arising from
claims under property, content, workers’ compensation, and business-interruption policies, as well as the costs
of demolition, clean-up, and reparations.
Analysis of impact to the economy
To the modelled estimate of property destruction, Cambridge Centre for Risk Studies has added an analysis
of the impact of this event on the economy of the region, and its spill-over effects to the national economy and
international trading partners, including how long it would take for output and consumption to return to normal.
Recovery from the devastating Los Angeles’ earthquake takes several years. Personal consumption dips 89%
in the first year after the event due to population displacement and supply restrictions. National potential output
also falls by 11% due to the destruction of physical and human capital stocks. Exacerbated by port closures,
national import and export rates fall by a maximum of 8% during the first six months of modelled recovery.
Although industrial output slowly recovers to pre-disaster levels thereafter, the impact of the earthquake reflects
a permanent loss to the economy.
The estimated value of capital stock damages are summarised in Table 2 below:
Table 2: Estimates of capital stock value destroyed by the Newport-Inglewood earthquake
(Source: RMS)
Capital Stocks Amount (Billion US$)
- Physical (Building, contents, Business interruption)
Residential 372.4
Commercial 476.5
- Human (Total Casualty: 71,251)
Workers’ Compensation 14.2
Total capital stock value 863.1
Exposure information and industry-wide implications by trade
Figure 4 further illustrates the extent of impact caused by the earthquake, overlaid with major ports located in
the disaster zone. Most of the coastal airports and seaports are severely damaged and must be shut down
immediately following the earthquake.
17Cambridge Centre for Risk Studies
Figure 4: Newport-Inglewood earthquake - Total ground-up damages estimated by RMS and overlay of
major ports affected in the disaster zone (Source: RMS)
Most ports are restored to operating conditions within two quarters, although it will take almost one year for
aviation and maritime traffic to resume pre-disaster levels. Table 3 details the list of affected major ports that are
shut down following the earthquake.
Table 3: Summary list of major ports damage by proportion in the Los Angeles disaster zone11
List of major ports damaged in the Los Angeles disaster zone
Airports in California, US Enplanement, 2014
Ontario International 2,037,346
Los Angeles International 34,314,197
John Wayne Airport 4,584,147
San Diego International 9,333,152
Total US airports affected 50,268,842
Total US enplanement (2014) 759,987,683
Proportion of airports affected (by % of US) 6.6%
Seaports in California, US Port calls capacity 2014
El Segundo Offshore Oil Terminal 27,904,402
11
Datasets retrieved from US Federal Aviation Administration, Passenger Boarding for US Airports (Online). Available from: http://www.faa.
gov/airports/planning_capacity/passenger_allcargo_stats/passenger/; US Department of Transportation, Maritime Administration (Online).
Available from: http://www.marad.dot.gov/resources/data-statistics/
18Impacts of Severe Natural Catastrophes on Financial Markets
Port of Long Beach 159,070,439
Port of Los Angeles 114,320,388
Port San Diego 5,285,314
Port Hueneme 5,374,104
Total US seaports affected 311,954,647
Total US port calls capacity (2014) 3,418,774,062
Proportion of seaports affected (by % of US) 9.1%
Consolidating damages and long-term recovery efforts
Recovery from the devastating Los Angeles’ earthquake takes several years. Personal consumption dips 89% in
the first year due to population displacement and supply restrictions because of disrupted maritime and aviation
traffic. National potential output also falls by 11% as a result. Exacerbated by port closures, national import and
export rates fall by a maximum of 8% during the first six months of recovery. Although industrial output slowly
recovers to pre-disaster levels thereafter, the impact reflects a permanent loss to the economy.
The government is also assumed to implement stimulus packages by raising bond yields to minimise foreign
investors’ capital flight, and hasten and facilitate reconstruction, which boost private consumption, business
investment, and public investment temporarily. Global stocks are expected to rebound quickly, while weaker,
domestically-tied companies are expected to weaken further. The economic growth rates are spurred in the
second year before the economy pulls back and stabilizes to almost pre-disaster levels.
EQ-TKY: Tokyo Earthquake
RMS Analysis Summary
• RMS Japan EQ Model
• Analysis Vintage: Sept 2015
• Event Name: Sagami_1703 M8.1
• Maximum Magnitude: 8.3
• Event ID: 803097
• Source ID: 3486
• Analysed with Industry Exposure Database: 2015 JPEQ EED: Building values only per Chome
• Scenario Analysis: Shake + Fire no PLA
• Tsunami Analysis: Global Tsunami Scenario Catalog; RiskLink Tsunami Accumulation Footprints
Event description and modelled losses
A magnitude 8.3 (Mw) earthquake strikes along the Sagami Trough, impacting the densely-populated Kantō
Region, including the Tokyo Metropolis. Over 36 million people live in the Tokyo metropolitan area and another
43 million in the wider Kantō Region. The underwater fault rupture of the Sagami earthquake generates a series
of significant tsunami waves that inundate parts of the coastline.
The RMS modelled loss estimate is that the Tokyo earthquake would lead to US$ 1.37 trillion in total damages,
both insured and uninsured. This estimation reflects damages arising from claims under building value across
all lines of business.
The associated tsunami loss is estimated to add a further 10% to the shaking damage. Tokyo Bay acts as a
natural buffer, protecting Tokyo city, the region with the highest concentration of exposure. Historical tsunami
wave heights recorded in the area are well within tidal range.
The total estimated value of capital stock damage is summarised in Table 4 below.
Table 4: Estimates of capital stock value damaged by the Sagami earthquake (Source: RMS)
Capital Stocks Amount (Billion US$)
Earthquake
Commercial 360.7
19Cambridge Centre for Risk Studies Residential 829.2 Industrial 53.8 Total shaking damage 1,243.7 Tsunami (< 10% shaking damage) 124.4 Total capital stock value destroyed 1,368.1 Analysis of impact to the economy To the modelled estimate of property destruction, Cambridge Centre for Risk Studies has added an analysis of the impact of this event on the economy of the region, and its spill-over effects to the national economy and international trading partners, including how long it would take for output and consumption to return to normal. Full recovery from the Tokyo earthquake would take several years. Personal consumption dips to 79% in the first year due to population displacement and restricted supplies from the disrupted maritime and aviation traffic. National potential output also falls up to 21% due to the destruction of capital stocks. Further exacerbated by port closures, national import and export rates fall by almost 40% during the first six months. Although industrial output slowly recovers back to pre-disaster levels, the impact of the earthquake reflects a permanent loss to the economy. Figure 5 illustrates the extent of impact caused by the earthquake overlaid with the location of major cities and ports lying within the disaster zone. Most of the coastal airports and seaports are severely damaged due to the shake and tsunami waves and are shut down immediately after the disaster. Figure 5: Tokyo earthquake - Total ground-up damages estimated by RMS and overlay of major ports affected in the disaster zone (Source: RMS) Most ports are restored to operating conditions within two quarters, although it takes almost a year for aviation and maritime traffic to resume at pre-disaster levels. Table 5 details the list of major affected ports that had to be shut down following the natural catastrophe. 20
You can also read