SOCIO-ECONOMIC IMPACT ASSESSMENT FOR THE PROPOSED PLAN-8 INFINITE ENERGY GRAHAMSTOWN WIND ENERGY PROJECT - August 2013
←
→
Page content transcription
If your browser does not render page correctly, please read the page content below
SOCIO-ECONOMIC IMPACT ASSESSMENT
 FOR THE PROPOSED PLAN-8 INFINITE
ENERGY GRAHAMSTOWN WIND ENERGY
             PROJECT

              August 2013

                                    i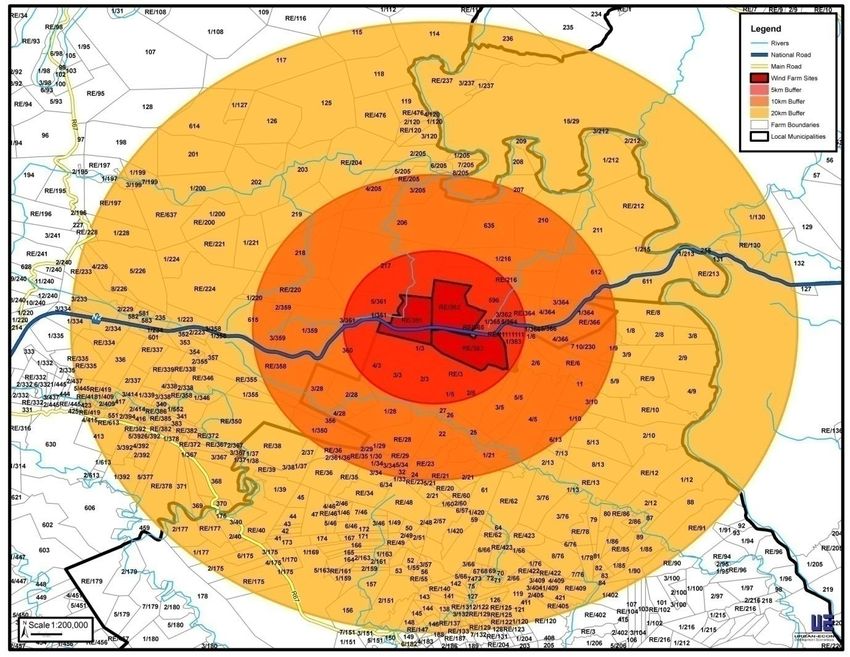
Report prepared for:
Plan-8 Infinite Energy
PO Box 3804, Cape Town, 8000
info@plan-8.co.za

Prepared by:
Urban-Econ Development Economists
49 Parliament Street Port Elizabeth
ec@urban-econ.com

                                      ii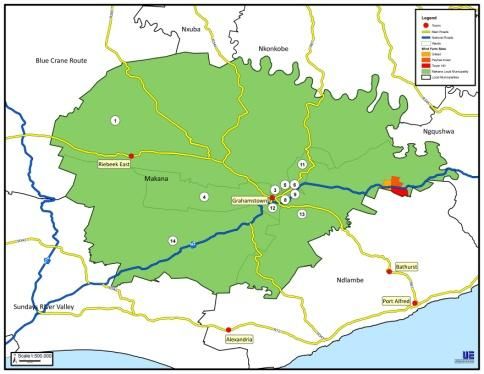
TABLE OF CONTENTS

1.         INTRODUCTION                                                                               1
     1.1    Study goals and objectives                                                                1
     1.2    Project Background and Locality                                                           2
     1.3    Study methodology                                                                         4
     1.4    Study area delineation                                                                    8
2.         POLICY AND PLANNING ENVIRONMENT                                                            10
     2.1    National informants                                                                       10
     2.2    Key provincial guidelines                                                                 12
     2.3    Local guidance                                                                            14
     2.4    Synopsis                                                                                  15
3.         SOCIO-ECONOMIC PROFILE OF THE STUDY AREA                                                   16
     3.1    Population, Income and Employment Profile                                                 16
     3.2    Spatial development and composition                                                       18
     3.3    Economic Profile                                                                          20
     3.4    Profile of the immediately affected environment                                           22
4.         IMPACT ASSESSMENT ASSUMPTIONS                                                              23
     4.1    Grahamstown wind farm assumptions                                                         25
     4.2    Assumptions regarding potential losses in the area affected by visual
            impacts                                                                                   27
5.         EVALUATION OF IMPACTS AS A RESULT OF THE WIND FARM                                         32
     5.1    Defining Economic Impacts                                                                 32
     5.2    Construction phase impacts                                                                34
     5.3    Operational phase impacts....................................................................52
     5.4    Decommissioning phase impacts                                                             65
     5.5    Net effect and trade-off analysis                                                         66
6.         RECOMMENDATIONS                                                                            69
7.         ENVIRONMENTAL MANAGEMENT PLAN                                                              71
     7.1    Construction phase                                                                        71
     7.2    Operational phase                                                                         79
REFERENCES:                                                                                           85

                                                                                                           iii
CHAPTER 1- NTRODUCTION
Coastal Environmental Services (CES) is undertaking an Environmental Impact Assessment (EIA) on
behalf of Plan 8 Infinite Energy (Plan-8) with regards to a planned wind farm to the East of
Grahamstown in the Eastern Cape Province. This socio-economic impact assessment (SEIA) forms
part of a range of specialist studies that make up part of the EIA process. This document discusses
activities undertaken to evaluate the nature of socio-economic impacts associated with the
proposed Plan-8 infinite energy wind farm.
1.1 STUDY GOALS AND OBJECTIVES
The national guidelines for conducting Socio-Economic Impact Assessments indicate that the overall
aim of a SEIA is to understand the current social and economic environment and use it as a baseline
for predictions and measurements (DEAT, 2006). More specifically, this study seeks to determine
and assess all potential positive and negative socio-economic impacts of the proposed development
and contrast it against the “do-nothing” alternative to identify whether the proposed development
will have a net positive or a net negative effect on the society and economy. Specific objectives of
the study include:
Generating a profile of the local and regional economy in order to understand the economic
dynamics, potential and challenges of the area
Developing a profile of the affected environment which would then represent the “do nothing”
alternative
Identifying all possible positive and negative socio-economic impacts that could be expected to
arise from the project during both the construction and operational phases of the development
Where possible, quantify socio-economic impacts using an economic model developed on the
basis of a Social Accounting Matrix (SAM) or other techniques
Determine the significance of potential impacts using criteria determined by the environmental
practitioner
Compare various alternatives and advise on the most advantageous option
Provide, where possible and when necessary, practical mitigation measures to reduce or
completely eliminate the potential negative impacts of the proposed development
11.2 PROJECT BACKGROUND AND LOCALITY
Plan-8 Infinite Energy, a renewable energy company, plans to develop a wind powered electricity
generation facility (known as a “wind farm”) approximately 30km outside of Grahamstown along the
N2 in an easterly direction towards East London, in the Eastern Cape Province of South Africa. The
proposed site is on the farms Gilead, Tower Hill and Peynes Kraal, and the project area lies within
the Makana Local and Cacadu District Municipal jurisdictions. The location of the proposed wind
farm is presented in Map 1. Grahamstown is the major urban settlement within the Makana
municipality and is the centre of formal business , administrative capital and host to several civic,
public and educational institutions. Other secondary urban settlements are found at Salem, Riebeck
East and Alicedale.
Map 1: Location of proposed wind farm
Source: Urban-Econ GIS Unit (2013)
2The site of the proposed wind energy project is located in Ward 13 approximately halfway between
Grahamstown and Peddie (a smaller town that services rural subsistence agrarian communities) in
the Ngqushwa Local Municipality. The site is located on the N2 national road and is surrounded by a
combination of game, livestock and crop farms. These are private ventures with limited resident
populations on-site. As such, the immediate surrounds of the proposed wind energy site do not have
significant built-up footprints (these land uses typically require low labour intensities to achieve
sustainable yield returns). Higher concentrations of settlement are found at Collingham Towers,
Trentham Towers, Pershoek, Fraser’s Camp Coombs, Fort Brown and Committee’s Drift.
The proposed wind farm is planned to comprise up to a maximum of 22 turbines, each with a
nominal power output ranging between 2 and 3 MW (megawatts). The final configuration of the
wind farm (in terms of number of turbines to be constructed and actual power output rating of the
turbines) will be confirmed once funding has been secured.
Apart from the turbines to be constructed, the wind farm will also have supporting infrastructure.
Powerlines (overhead) to connect the wind farm to the national grid will be constructed. This will be
supported by a sub-station which will be built. Other infrastructure to be provided includes roads for
internal access on the farms and small buildings for maintenance, storage and operation control.
31.3 STUDY METHODOLOGY
1.3.1 Economic Impact Assessment Method
Socio-Economic Impact Assessment studies are undertaken to determine, evaluate, and where
possible, quantify the effects of an intervention. This intervention could be either an existing activity
within the economy or a new activity (i.e. the development of the Grahamstown Wind Farm).
Socio-economic impacts generated by an intervention can be disaggregated in terms of the initial or
direct impacts that occur when the intervention begins. Such impacts in turn trigger secondary and
further flow-on rounds of impacts thereby creating a multiplier effect. This multiplier effect can be
either positive or negative. In pure economic terms these impacts are expressed as indirect and
induced effects, where:
Indirect effects relate to the changes in economic indicators that are triggered along the
upstream industries that supply goods and services to the intervention
Induced effects refer to the changes in economic indicators that are stimulated by changes in
consumption expenditure of households that were directly or indirectly affected by the
intervention.
In addition to the above, two additional types of socio-economic impacts can be distinguished.
These include:
Secondary impacts that are caused by the intervention, but that are further removed in distance
or take a greater amount of time to materialise, but are still reasonably foreseeable. Secondary
impacts generally relate to changes in land use patterns, economic performance, changes to the
character of a community and property values in the vicinity of the interventions location.
Cumulative effects are the results of incremental consequences of the intervention when added
with other past, present and anticipated future interventions. Cumulative effects consider the
manner in which the impacts of a project may affect or be affected by other projects. Such
effects are generally difficult to identify as they require a complete knowledge of local
conditions and development plans, and accordingly are sometimes even more difficult to
quantify.
Projection of the initial impacts and multiplier effects are usually done by employing an input-output
model or a General Equilibrium Model. The use of these models in socio-economic impact
assessments allows for the quantification of potential impacts in terms of a number of economic
indicators such as production, Gross Value Added (GVA), employment and income. The scale of
these impacts is dependent on the size and diversification of the economy under analysis which in
turn determines the leakage. Secondary and cumulative effects can be identified through an expert
4opinion technique, consultations, development matrices and interviews. Such impacts can be
difficult to quantify. Overall, a socio-economic impact analysis that includes the assessment of
primary impacts, multiplier effects, secondary impacts and cumulative effects provides a
comprehensive assessment of potential impacts. It furthermore assists in ranking the intervention
suing a methodology prescribed by the Department of Environmental Affairs.
The socio-economic impact assessment made use of the economic models based on the Eastern
Cape Social Accounting Matrix (SAM) developed in 2006 and adjusted to represent 2013 figures. The
SAM is a comprehensive, economy-wide database that contains information about the flow of
resources that takes place between the different economic agents in this case the Eastern Cape
economy. The selection of this model in the assessment it attributed to the expected spatial
distribution of procurement during both the construction and operational phases of the project.
1.3.2 Impact Evaluation Model
All impacts identified were evaluated in terms of the extent, duration, magnitude, probability and
significance. The model also assesses whether impacts will be positive or negative, in line with DEAT
(2006) guidelines. The following approach was used to assess each of these aspects of the impact:
Table 1: Impact evaluation model
Aspect Ranges
Affected site/s (1)
Surrounding Area (2)
Local economies (3)
Extent (E)
National (4)
International (5)
Very short term, 0-1 years (1)
Short term, 2-5 years (2)
Duration Medium term, 5-15 years (3)
(D) Long term, 15+ years (4)
Permanent (5)
Small, no effect on environment (0)
Minor, no impact on processes (2)
Magnitude Low, slight impact on processes (4)
(M) Moderate, process continue in modified way (6)
High, processes temporarily ceases (8)
Very high, complete destruction of patterns and permanent cessation of processes
5Aspect Ranges
(10)
Very improbable, probably will not happen (1)
Improbable, some possibility, but low likelihood (2)
Probability Probable, distinct possibility (3)
(P) Highly probable, most likely (4)
Definite, impact will occur regardless of any prevention measurers (5)
Calculated using the following formula S = (E+D+M)P
< 30 points: Low (i.e. where this impact would not have a direct influence on the
decision to develop in the area)
Significance
30-60 points: Medium (i.e. where the impact could influence the decision to develop
(S)
in the area unless it is effectively mitigated
60 points: High (i.e. where the impact must have an influence on the decision
process to develop in the area).
In addition to the above, each impact is evaluated in terms of the following:
The degree to which the impact can be reversed (Reversible or Not)
The degree to which the impact may cause irreplaceable loss of resources (Yes or No)
The degree to which the impact can be mitigated (Yes or No)
It is important to state that the evaluation undertaken using this method will in many cases be based
on subjective criteria that are difficult to quantify at a high percent confidence interval. This is a
result of the nature of this project whereby:
Wind energy is a relatively new form of energy (at this scale) in the South Africa context
Given the relatively new nature of this form of energy production, there is very limited
historical data on factors such as its impact on tourist visits, land prices and business value in
a context similar to that of the proposed Makana wind farm.
The results of the impact evaluation model are thus to a great degree based on a
combination of reviewed literature and results of surveys administered (as discussed in the
next section.
Where results of the literature review diverge significantly from those of the surveys
administered, a middle-ground approach is adopted in order to consider both extreme cases
and arrive at a likely outcome
Emphasis is thus to be drawn away from the numerical value of the significance rating and
more to the issues discussed (extent, duration, magnitude and probability). Although these
are often subjective matters (given the absence of historical data on which to base
econometric modelling for extrapolation of trends). It is thus recognised that while no
6absolute value can be ascertained to the impacts identified in this report, it is still important
to identify these potential impacts and highlight some of the critical issues that will apply in
the specific case of the proposed Plan-8 Infinite Energy Grahamstown wind farm.
1.3.3 Data Collection
As part of the data collection process for the socio-economic impact assessment of the
Grahamstown wind farm the following activities were undertaken:
Review of planning documents
In order to document the socio-economic context of the study area within the Makana Local
Municipality, important policy, planning and strategic documents were reviewed, referenced and
used to inform this SEIA.
Literature Review
In order to substantiate the findings of the socio-economic impact assessment a number of
secondary research documents have been considered as they relate to the proposed wind farm.
These documents include academic journals and studies available on the internet or in print media.
It is intended that these documents substantiate the baseline profile while at the same time
providing context to the project.
Interviews with stakeholders
Interviews were undertaken as part of the SEIA to collect information from key parties that are likely
to be interested in and affected by the proposed wind farm. These interviews were primarily
conducted telephonically. These interviews formed the basis of the primary data collection and
assisted with the gathering of baseline information as well as establishing the stakeholder’s
perceptions, interests and concerns. The survey template which was used is attached as an
appendix to this report. Results of this survey are presented in an aggregate form throughout this
report. This is done in order to preserve the confidentiality of the results. As such, responses are not
presented per farm/property/ land owner or respondent.
It is recognised that responses to the survey may be based on subjective opinions that are difficult to
quantify. Despite this shortcoming, it was however still important to gauge the perceptions of
identified interested and affected parties as they represent local community, business and
government interests.
Site visits
Trips were made to the site in order to gain a contextual knowledge of its surrounding land uses.
71.4 STUDY AREA DELINEATION
Study area delineation depends on the type of economic activity that is analysed and the perceived
spread of economic impacts that are expected to be generated from the project during both the
construction and operational phases. The municipal area where the site is located is likely to
experience some direct, indirect and induced impacts resulting from the activities on the site;
however, it is unlikely that a local economy can be sufficiently diversified to supply all materials and
services and support construction and operational activities from start to finish. Economic impacts
therefore tend to extend beyond municipal boundaries and spread throughout the entire national
economy.
For the purpose of this study both a primary and secondary study area were delineated. These are
discussed in more detail in the subsequent section.
1.4.1 Primary study area
The primary study area (hereafter referred to the local area) refers to the locality where the direct
economic impacts of the proposed development will be concentrated. The primary study area is
defined based on the actual location of the proposed development, proximity to skilled and unskilled
labour, position relative to suppliers of products and data availability.
Based on these criteria the Makana Local Municipality was selected as the smallest administrative
units for which current economic and demographic data can be obtained.
1.4.2 Secondary and tertiary study areas
The secondary study area is where the majority of indirect and induced effects will be concentrated.
Although the proposed wind farm is located an estimated 30 kilometres from Grahamstown it is
anticipated that a portion of construction inputs will be sourced from the Nelson Mandela Bay
Metro, situated an estimated 130 kilometres from the proposed development site.
This suggests that the Nelson Mandela Bay Metro will likely benefit more from the indirect and
induced effects of the development than the Makana Local Municipalities. The procurement of
construction inputs are however unlikely to be limited to the Nelson Mandela Bay Metro and will
likely be sourced from other parts of the Eastern Cape. Accordingly the Eastern Cape was selected
as the secondary area.
South Africa was chosen to be the tertiary study area as the proposed wind farm is likely to benefit
South Africa’s overall domestic expenditure both directly and indirectly.
81.4.3 Visually affected study area
Through consultation with other specialists on the project team and the review of the minutes of
various public participation meetings that have been held, it is evident that the most significant
environmental impacts associated with the proposed development of the wind farm are the visual
impact. The public participation process also highlighted the fact that some of the current economic
activities located in the vicinity of the development (including game farming) could potentially be
adversely affected by the proposed project through visual disturbance.
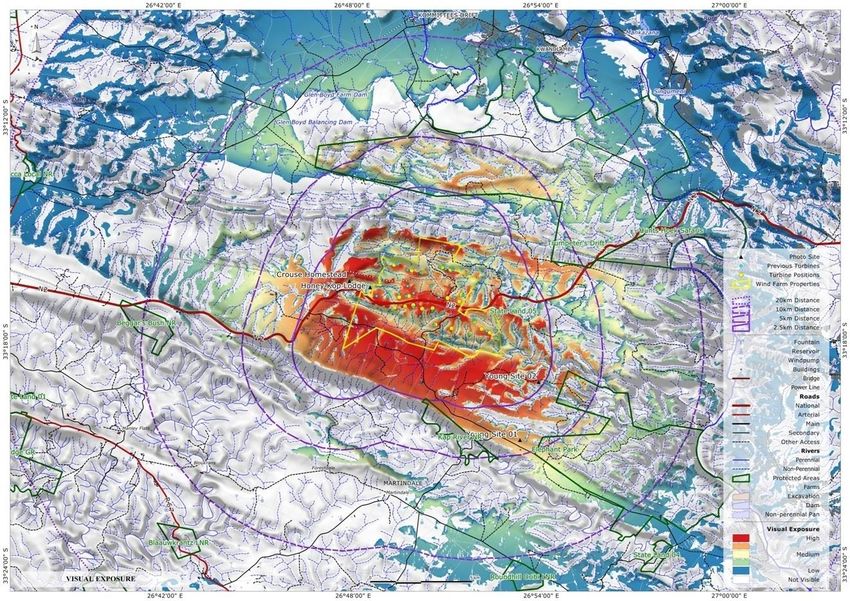
Map 2: Cumulative visual exposure on the proposed facility and affected farms
Source: Mapthis Visual Impact Assessment Study (2013)
In order to determine, and where possible quantify, the secondary economic impacts that can
potentially be induced by the proposed Grahamstown Wind farm, a visually affected zone was
delineated. This area was restricted to the potential visual exposure that was determined by the
visual specialist on the project team. This area is illustrated in Map 2 above.
9CHAPTER 2- POLICY AND PLANNING ENVIRONMENT
This chapter examines the key legislation and polices relevant to the proposed development and
includes a review of pertinent national, provincial and local polices that have a direct bearing on the
development.
The overall aim of this review process is to provide insight into the government’s priorities and plans
in terms of renewable energies. This assists in determining the importance of the project with
regard to the development objectives of the various spheres of government as well as in identifying
potential developmental conflicts that the project might create. A brief review of the most relevant
documents is provided in this section.
2.1 NATIONAL INFORMANTS
2.1.1 National Energy Act (2008)
Seeks to, in its preamble; facilitate the increased generation and consumption of renewable
resources while at the same time taking into account environmental management requirements and
the interactions amongst economic sectors.
2.1.2 The White Paper on Renewable Energy (2003)
Sets a target of generating 10 000 GWh from renewable energy sources by 2013, which is equivalent
to two units of a combined coal power plant with a capacity of 660 MW. The energy generated
should come primarily from biomass, wind, solar and small scale hydro. This renewable energy is to
be utilised for power generation and non-electric technologies such as solar water heating systems
and bio-fuels.
2.1.3 National Climate Change Response Paper Green Paper (2010)
Focuses on making a fair contribution towards the stabilisation of greenhouse gas emissions and
adapting and managing climate change impacts. The Paper proposes a number of approaches of
dealing with climate change impacts with respect to selected sectors. Energy, in this context, is
considered to be one of the key sectors that provides for possible mitigation to address climate
change. Some of the responses proposed include:
Diversifying the energy mix
Using market based measures such a carbon tax, to motivate and drive diversification of the
energy mix
Establish a business environment for the successful development of renewable energy
manufacturing industry in the country
Design and roll out ambitions Research and Development Projects aimed at diversifying the
energy mix
Review and scale up the 2013 targets of generating 10 000 GWh of renewable energy
102.1.4 The New Growth Path Framework (2010)
Is the government’s programme of action that focuses firstly on the creation of decent employment
opportunities through the support of labour intensive sectors and secondly on ensuring long term
growth through the support of advanced industries.
As a starting point, employment creation is planned to be stimulated in a few sectors including the
green economy. Government plans to create 300 000 employment opportunities in the green
economy alone by 2020, more than two thirds of which is intended to be created in construction,
operation and maintenance of new environmentally friendly infrastructure.
2.1.5 The Integrated Resource Plan 2010 – 2030 (2011)
Projected that and additional capacity of 56 539 MW will be required to support the country’s
economic development and ensure adequate reserves over the next 20 years. The required
expansion is more than twice the size of the existing capacity of the system.
A significant component of the above mentioned plan is the expansion of the use of renewable
energy sources to reduce carbon emissions involved in generating electricity. Overall, the proposed
plan implies a total generating capacity of 9 200 MW from wind by 2030.
2.1.6 National Development Plan (NDP)
Vision 2030 was formulated by the National Planning Commission and released on 11 November
2011. The NDP proposes to create 11 million employment and grow the economy at an average rate
of 5.4% per annum by 2030. The NDP also seeks to ensure that half of the new future generation
capacity comes from renewable energy sources. It furthermore recognises the importance of the
transition to a low carbon economy. As such the NDP suggests the following:
Support carbon budgeting
Establish an economy wide price for carbon by 2030 complemented by energy efficiency and
demand management interventions
Set a target of 5 million solar water heaters by 2030
Implement zero emission building standards that promote energy efficacy
Simplify regulatory regime to encourage renewable energy, regional hydroelectric initiative and
independent power producers (IPPs)
112.2 KEY PROVINCIAL DOCUMENTS
2.2.1 The Eastern Cape Industrial Development Strategy (2011)
Sets out a number of strategic goals which include positive economic growth, ensuring that
economic growth leads to labour absorption and ensuring that existing employment are retained.
In pursuit of these goals the Industrial Development Strategy identifies the need for:
R&D and innovation
Skills development
Improving infrastructure and logistics
Providing developmental finance
Promoting investment, trade and exports
Developing institutional structures
The achievement of these strategic goals is planned through the development of several key sectors
including:
Tourism Capital goods
Chemicals and Petrochemicals Green industries
Agriculture and agroprocessing Automotive
The Industrial Development Strategy also seeks to develop an industrial base for the manufacturing
of components required for the production of solar cells, solar panels and certain components of
wind turbines.
2.2.2 The Eastern Cape Sustainable Energy Strategy (2012)
Seeks to lay out the provinces strategic direction in terms of the renewable energy industry. The
focus of the strategy is to encourage sustainable, affordable and environmentally friendly energy
production by creating an enabling environment for energy production and sustainable technology,
skills and industry development. This is to be achieved through several initiative including:
An intensive training programme among relevant decision makers with respect to renewable
energy project approvals
The establishment of an implementation task team to provide potential investors with a one-
stop-shop for renewable energy information in the province
Development of a provincial locational perspective of renewable energy
Lobbying Eskom to expedite and strengthen the transmission capacity of the former Transkei
area
12Lobbying the Department of Energy to set out long-terms programme for the procurement of
renewable energy generation
Through the purist of these initiatives the Eastern Cape Province seeks to become a leading and
preferred destination for renewable energy investment in South Africa.
132.3 LOCAL GUIDANCE
2.3.1 The Cacadu District Municipality IDP (2012-2017)
Identifies investment in alternative energy such as wind turbines, nuclear and hydro-electric as
potential projects with significant economic spinoffs for the region. The IDP is guided by the
National Policy Directive Medium Term Strategic Framework (MTSF) which includes a paragraph on
the need to continue with the program to build, revamp and maintain electricity infrastructure,
including generation, distribution and reticulation to ensure sufficiency and sustainability of supply
and development of alternative energy sources
2.3.2 The Makana IDP (2012-2017)
Reference is made to investigating projects that explore alternative energy sources through the
cultivation of renewables. The development of wind farms is also a listed project in the IDP.
2.3.3 The Makana LED Strategy (2009)
As part of it strategic vision, identifies the need to move towards a green and environmentally
sustainable economy. The LED Strategy further identifies the need for a reliable source of electricity
as it promotes development and business confidence. The development of wind farms was
associated as a positive step towards ensuring electricity generation.
142.4 SYNOPSIS
The review of the policy environment suggests that utilisation of renewable energy sources in South
Africa is considered to be an integral means of reducing the carbon footprint of the country,
diversifying the national economy and reducing poverty. Any project contributing to the above
mentioned objectives can therefore be considered strategically important to South Africa.
From a provincial and municipal policy perspective the facilitation of renewable energy projects and
interventions that related to the broader green economy are seen as a priority. The Eastern Cape
Provincial Industrial Development Strategy makes particular reference to the need to develop green
industries which includes renewable energies. Likewise the Makana municipality has noted the
importance of wind energy in its IDP and is actively seeking to promote such developments.
15CHAPTER 3- SOCIO-ECONOMIC PROFILE OF THE STUDY AREA
This chapter documents various aspects of the primary study area including, population and
household numbers, income levels and employment. In addition, the chapter also reviews the
economic structure and performance of the study area. This chapter incorporate outcomes from the
latest 2011 National Census.
The intention of this review is to provide an overview of the socio-economic context of the area so
as to better understand the dynamics of the area and to inform the SEIA process.
3.1 POPULATION, INCOME AND EMPLOYMENT PROFILE
Selected demographic information is presented in Table 2. The Makana Local Municipality falls
within the Cacadu District Municipality and accounts for 19.2% of the district population, making it
the second most populous locality after the Kouga Local Municipality. Population growth between
2001 and 2011 was 0.6%. This does not compare favourably with the Cacadu District Municipality’s
population growth rate, which grew at 1.5% over the same period. These figures strongly suggest
the possibility of out-migration due to the limited number of employment opportunities available in
the area. These limited employment opportunities likely force people and households to move
closer to urban centres that have greater potential for employment.
Table 2: Overview of the primary study areas population structure, 2011
Indicator Makana Local Municipality
Area (km2) 4 379
Population 80 390
Number of Households 21 388
2
Population density (km ) 18.3
Average household size 3.7
Population growth rate (2001-2011) 0.6%
Average monthly household income R 2,444
Source: Stats SA (2012)
The disposable average monthly income of households was 63.5% lower than that of the Cacadu
District Municipality (R 6,687). The number of households that earn no income is 42% , compared to
a provincial and district figure 15.7% and 12.8% respectively. These figures are indicative of the high
level of poverty within the area, further highlighted by the fact that only 11.6% of households in the
Makana Local Municipality earn more than R 3,200 per month.
16Table 3: Employment profile of the primary study
Indicator Makana Local Municipality
Employed 65.5%
Unemployment Rate 32.5%
Not Economically Active 48.9%
Labour force participation rate 51.1%
Source: Stats SA (2012)
As seen in Table 3, the review of the employment profile indicates that almost a third of the
economic active population is unemployed. The unemployment rates and labour force participation
rate was notably worse than that of the Cacadu District Municipality (Unemployment rate: 24.9%;
Labour force participation rate: 54.8%).
The implication of employment statistics presented in Table 3 are that
There is likely to be a high rate of worker discouragement (people that have given up looking
for work)in the area as a result of opportunities for employment being very limited
The local labour force is likely to be very under-skilled as a result of limited working
opportunities
The bulk of employment is likely to be in Grahamstown as farming operations in rural
settings within Makana are typically not labour-intensive due to the nature of crops and
livestock produced and the region’s natural attributes.
173.2 SPATIAL DEVELOPMENT AND COMPOSITION
3.2.1 Land use: Agriculture
The Makana municipality has a small urban population with the majority of residents living in rural
settings. The rural land is primarily used for either commercial agricultural activities (i.e. livestock,
game farming) or conservation. The agricultural statistics compiled by StatsSA (2007)1 for the
Eastern Cape Province suggest that the Albany Magisterial District and the Somerset East Magisterial
District, both of which have similar boundaries to the Makana Local Municipality are predominately
used for livestock farming (including game). This is further indicated that only 0.2% of the land
within the two municipalities was used for either crop or horticultural farming in 2007.
As indicated in Table 4, livestock farming is dominated by sheep and goat farming and to a lesser
extent cattle farming. The sale of livestock products (i.e. milk and cream, wool and mohair)
generated an additional R 95.01 million is gross farming income for farmers within the primary
study. The sale of wool and mohair accounted for approximately 40.1% of this value (R 38.16
million).
Table 4: Agricultural statistics for the Albany and Somerset East Magisterial Districts in 2007
Field Crops Horticulture Livestock
Livestock total 326 550
Land used 2 097 ha Land used 857 ha
Livestock sold 115 391
R 4.94 R 12.89 R 119.13
Production Production Gross Income
million million million
Lucerne Pineapples
Sheep (57%),
Dominant (92%), Maize Dominant (87%), Dominant
Goats (26%),
Crops (5.5%), Wheat Crops Tomatoes livestock
Cattle (12%)
(2.5%) (10%)
R 15,041 per
Average Average Average R 1,036 per
R 2,356 per ha ha
Production Production Income animal
Source: Stats SA (2007)
3.2.2 Land use: Tourism
Tourism, in particular those activities that are related to eco-tourism, game farming and cultural
tourism, were identified as some of the major economic development priorities in the primary study
1
2007 is the most recent year from which it is possible to obtain municipal level agricultural statistics.
18area. In this context, the Makana Local Municipality has identified several tourism development
zones (Makana LM, 2004) namely:
Alicedale – Riebeek East – Sidbury
Seven Fountains – Salem
Grahamstown district
Fort Brown – Great Fish River Reserve
193.3 ECONOMIC PROFILE
Table 5: GDP-R structure between 2005 and 2011 in Constant 2005 prices
Sector 2005 2011 CAGR 2005-2011
Primary Sectors 1.9% 0.8% -9.2%
Agriculture and hunting 1.9% 0.8% -11.0%
Mining and quarrying 0.0% 0.0% -7.3%
Secondary Sectors 8.3% 7.1% -0.2%
Manufacturing 4.7% 3.4% -3.2%
Electricity, gas and water 1.4% 1.0% -3.5%
Construction 2.2% 2.7% 6.0%
Tertiary Sectors 89.8% 92.1% 1.4%
Trade 10.4% 8.7% -0.8%
Transport and communication 6.9% 5.5% -1.8%
Finance and business services 17.9% 19.6% 3.7%
Community services 17.3% 17.8% 2.6%
General government 37.2% 40.3% 3.5%
TOTAL REAL GDP-R R 1.95 bil R 2.14 bil 2.1%
Source: Quantec (2012)
Over the last six years, the Compounded Annual Growth Rate (CAGR) was 2.1% which means that it
grew slower than both the provincial (2.9%) and national economies (3.1%) (Quantec, 2012). This
can be attributed to the size and diversity of these municipalities’ economies relative to the Eastern
Cape and South Africa.
As evident from Tables 5 and 6 the agricultural sector has experienced a significant decline both in
terms of its economic output and its employment levels between 2005 and 2011. This sharp decline
could possibly be attributed to the longstanding drought that the area has recently experienced.
The local area has also experienced a gradual movement away from traditional livestock farming
towards game farming and eco-tourism.
The local agricultural sector includes limited subsistence farming, unlike other areas in the Eastern
Cape where this practice is more dominant. The presence of this subsistence agricultural means that
the number of households that are dependent on agricultural activities for income could be slightly
greater than the figures presented in Table 6. This is due to the fact that the table only indicates
those individuals that are formally employed in the agricultural sector.
Agricultural activities are labour intensive, thus a small decline in the size of the sector would
generally lead to greater employment losses than for example in utilities, which tend to be more
20capital intensive. The agricultural sector is also frequently one of the largest employers in rural
areas and it is for these two reasons that the sector is generally prioritised in development
strategies.
Table 6: Employment structure
Sector 2005 2011 Change 2005-2011
Primary Sectors 20.9% 6.2% -20.48%
Agriculture and hunting 20.9% 6.2% 7.66%
Mining and quarrying 0.0% 0.0% -7.74%
Secondary Sectors 10.8% 8.5% -8.86%
Manufacturing 3.5% 2.5% -5.69%
Electricity, gas and water 0.3% 0.2% -2.99%
Construction 7.1% 5.8% -0.46%
Tertiary Sectors 68.3% 85.2% 3.82%
Trade 16.4% 16.1% 0.57%
Transport and communication 1.8% 2.1% 3.03%
Finance and business services 7.5% 11.0% -2.66%
Community services 19.9% 24.2% -20.48%
General government 22.6% 31.8% 7.66%
TOTAL EMPLOYMENT 23 505 19 996 -7.74%
Source: Quantec (2012)
213.4 PROFILE OF THE IMMEDIATELY AFFECTED ENVIRONMENT
3.4.1 Land use profile
The map below shows farm numbers of properties within a 20 kilometre radius of the site of the
proposed Grahamstown wind farm. The purpose of the map is to provide a spatial perspective to the
locality of the site in relation to properties in the immediately affected environment. The map
contains properties with different levels of visual exposure to the wind farm (ranging from no impact
to high impact) and is meant to provide a reference point to Map 1 and Map 2 from earlier on in this
document. The distance of 20km is used in order to provide congruence with Map 2 from this
document, whilst providing additional detail in comparison to Map 1 from this document. The
distances provided (20km, 10km and 5km) are thus not representative of deemed viasul impacts, but
merely to provide spatial reference points. Farm numbers were used rather than farm names as it is
recognised that colloquial names are often used as reference points for farms, and these may not
always match with farm names registered at the Surveyor General’s offices. The map informs the
profiling undertaken in this section.
Map 3: Farm numbers of the immediately affected environment
Source: adapted by Urban-Econ GIS using data from 1map.co.za,
22The land on which the wind farms are located is currently used for livestock and crop farming.
The area surrounding the proposed Grahamstown Wind farm is to large extent used for game
farming , hunting and eco-tourism. Livestock farming (sheep, goats and cattle ) and to a lesser extent
crop farming (Lucerne, horticulture and maize) is also undertaken on some properties. Some of the
land is used solely for the purposes of rearing animals for resale to the hunting industry. Other
properties are dedicated to hunting activities while others are dedicated to accommodation of
tourists that do not hunt on the properties. Such accommodation facilities host people that visit the
area for hunting, as well as other activities . accommodation facilities range from low-end chalets to
luxury units.
It must be noted that a number of properties have mixed uses. As such some properties are used for
both conventional farming (livestock rearing or crop) and game farming and hunting. Properties with
mixed land uses typically cater to the local tourism market and rear animals for this market.
It is important to point out that some farm owners declined to respond to the questionnaire used to
gather information for this report. Furthermore, contact details of other farm owners were not
available at the time this report was written.
3.4.2 Socio-economic profile of the affected area
From the data obtained from surveyed farmers it is estimated that agricultural operations (including
hunting and tourism) in the directly affected area employ approximately 240 people, the majority of
whom are temporary employees. Based on the survey results it is estimated that a further 212
people permanently reside on these farms. These farms generate an average annual revenue of R
578,102 although the game/tourism farms in the area tend to generate significantly higher earnings
than crop or livestock farming.
Table 7: Selected socio-economic description of properties by dominant income generating activity
No. of farm No of people employed Average annual
Land use
Owners Permanent Temporary Total revenue
Hunting/tourism 13 65 71 136 R 891,871
Crop farming 3 13 37 50 R 273,100
Livestock farming 7 20 34 54 R 126,104
TOTAL 23 98 142 240
23It is important to distinguish between farm portions and farm owners. One farm owner may own
several farm portions of one or multiple farms. As such, the number of farm owners listed in the
table above is not a direct indication of collective or total ownership of farms in the region. It was
found that some farms were owned by more than one owner, and similarly some farm owners
owned multiple farms or farm portions.
It is recognised that many farms in the area practice a combination of crop, livestock and hunting
activity. As such, most farms are involved in all three land uses as shown in Table 7 to varying
extents. Table 7 shows the dominant activity currently undertaken on farms that were surveyed. In
addition to the information presented in Table 7, the following observations were made regarding
land use and the area’s socio-economic profile :
Crops cultivated include maize, potatoes, butternut, tomato, cabbage, Lucerne, oats and
proteas
Livestock animals reared for sale and kept for production of food products include goats,
sheep and cattle
Hunting includes plains-game animals such as Zebra, Eland, Kudu, Warthogs, Caracals,
Duikers, Nyala, Bushbuk, Waterbuck, Blesbok, Hartebeest, Ostriches, Impala, Wildebeest
and Reedbuck. Some specialist/rare species are also stocked on some farms
Hunting includes biltong farming by mainly local tourists and trophy hunting by mainly
international tourists
Other sources of revenue on surveyed farms include kaolin mining, value addition of
livestock products (e.g. abattoir)
Most of the biltong hunters in the area are repeat visitors. They stay on average two to
three days and hunt a few times per season (July to August).
Trophy hunters tend to visit based on package tours of 5-7 days and tend to visit once every
3 years.
International tourists seldom hunt on mixed use farms however several local farmers offer
concessions to professional hunters to hunt on their land.
Some of the farms have accommodation facilities for visitors
Game farms receive visitors mostly between March and November
Almost all the tourists (96%) that visit farms exclusively catering for game In contrast farms
that use hunting to supplement income from livestock/stock farming tend to have a majority
of domestic visitors (69%)
Some of the game farms earn income through the trading of live game.
Eco-based tourism in forms such as photography, trails is also undertaken in the area
Other notable forms of activity include Spekboem recovery and historical tourism (e.g. forts
used in military tours by groups of historical organisations.
24CHAPTER 4- IMPACT ASSESSMENT ASSUMPTIONS
This chapter of the report describes the assumptions used in the socio-economic impact assessment
study and specifically in the economic modelling exercise which aims to quantify the economic
impact of the project. The assumptions presented in this chapter refer to:
Construction, operation and decommissioning assumptions applicable to the project as provided
by Plan-8 Infinite Energy.
Assumptions associated with the visual impacts resulting from the project and the related
potential losses of affected businesses
4.1 GRAHAMSTOWN WIND FARM ASSUMPTIONS
The proposed facility is to have a maximum installed capacity of 67.5 MW. The assumptions specific
to the phases of the project’s lifespan are provided in the following paragraphs.
4.1.1 Construction phase assumptions
The following assumptions regarding the construction phase of the proposed wind farm are made:
The construction of the facility is planned to commence in 2015 contingent on the project being
selected under the Renewable Energy Independent Power Producer Procurement (RE IPPP)
Programme.
The total investment into the establishment of the facility is valued at R 1,320,832,500 in 2013
prices, of which R 528,035,916 will be spent within the South African economy and the rest on
imported goods and services.
Only local expenditure is considered in this analysis.
Of the South Africa spend across all phases, 83.66% will be incurred on the procurement of
goods and services and the rest will be spent on labour costs.
About 27.1% of the localised spending for all phases will be incurred in the local area, of which R
82.17 million will be spent on supply chain and R 25.08 million will be spent on labour.
The construction of the facility will create an estimated 142 project specific personnel of which
86 employment positions will be created for local labour. These employment positions will
comprise of the following occupations:
4 managers and highly skilled professionals
16 skilled artisans and supervisors
66 low skilled individuals (security and general labourers)
254.1.2 Operational phase assumptions
The assumptions regarding the operational phase of the project used in the modelling exercise are
as follows:
Operations are expected to reach full capacity in 2017 , having commenced in the 2nd quarter of
2016
The facility will operate for 20 years and will generate about R 230,296,400 per annum in
revenue (2013 prices).
The operations and maintenance cost of the facility will be valued at R 16,148,300 in 2013 prices
per annum, of which R 5,657,163 will to be spent in the country (under Operations and
Maintenance Contract).
The greatest share of local spending will be directed at covering labour costs associated with the
employment of 10 permanent workers .
The required workforce of the entire facility includes 4 highly skilled positions (i.e. engineers,
programmes), 4 skilled positions and 4 positions for security personnel, welfare officers and
other general personnel. South African residents will fill all of these positions and most will
come from the local area.
Up to 5% of turnover generated by the wind farm will be invested in social development and
economic development projects in and around surrounding communities. Details of these
projects are contained in the community needs analysis and assessment document which is
available from Plan-8 infinite energy. social and economic development projects will be
undertaken at the site of the wind farm as well as in Collingham towers, Eluxolweni, Pershoek,
Fingo village and Trentham Park. This amounts to an average potential total of R11,514,820 per
year for 20 years.
4.1.3 Decommissioning phase assumptions
The costs of decommissioning the plant are not yet known. Given the nature of wind technology
and the unlimited wind resource, it is highly likely that instead of decommissioning the plant, it will
be refurbished in order to extend its lifespan beyond the 20 year period.
264.2 ASSUMPTIONS REGARDING POTENTIAL LOSSES IN THE AREA AFFECTED BY VISUAL IMPACTS
The most significant environmental impact that can be associated with the development, and that
can generate negative socio-economic effects for the area, is the visual impact created by the
constructed wind turbines. As described earlier, the immediately affected environment is
characterised primarily by tourism activity related to hunting and other related activities.
During the operation of the wind farm, farming operations will be able to continue as is currently
undertaken on part of the land not taken up by permanent wind farm infrastructure (turbines,
substation, control building etc.). It is not envisaged that significant changes will occur to land use
once the wind farm has been built, and animals will be free to graze across the site with landowners
being able to continue to use the land in the same manner as they did prior to the establishment of
the wind farm. Similarly, cultivation of crops will still be possible on the remaining extent of the farm
on which the turbines will be installed.
Accordingly the revenue generated through livestock and crop farming is not going to be affected by
the visual disturbances in the area. The opposite however applies to the tourism and game farming
industries. The following paragraphs describe the sensitivity of the tourism industry and game farms
towards the visual disturbances and provide an estimation of the potential loss in revenue that could
result from the establishment of the wind farm.
4.2.1 Assumptions regarding sensitivity of tourists to visual disturbances
Based on the outcomes of the surveys conducted with local land owners, the majority of the
revenue generated by game farms in the immediately affected environment comes from
international tourists with the rest being derived from domestic visitors. International tourists
visiting farms in the area are almost exclusively trophy hunters. Some of these international tourists
however do engage in other activities such as bow hunting, photography, painting etc. Domestic
tourists are mainly biltong hunters. A small number of domestic tourists also visit the area for
relaxation and game viewing.
International tourists are expected to be fairly sensitive to a visual disturbance in the area. One of
the reasons international tourists visit the area is to experience a “Wild Africa” and to hunt/view
game. Any outside disturbance that would affect this “Wild Africa” experience is therefore likely to
negatively impact the level of satisfaction that these tourists experience. It was however indicated
that one of the critical factors that international hunters consider when visiting local game farms is
the quality of the trophy. In many cases this is the chief concern of international hunters.
It was also noted that many of the international tourists visiting local game farms are repeat visitors
and have been referred to the farms by friends and family. This means that any visual disturbance
27that would affect the experience of international visitors would impact on their decision to return to
the respective game farm. It is also probable that these international visitors would likely spread the
word about their experience to other potential tourists meaning that, in a case where the
experience is unsatisfactory, international tourists may not make referrals to the game farms.
Domestic tourists are also expected to be sensitive to visual disturbance that affect their sense of
places, as well as their experience of the game farms. Biltong hunters are however expected to be
less sensitive than trophy hunters or even domestic visitors interested in eco-tourism. This is largely
due to the fact that small groups of biltong hunters primarily hunt for meat and biltong and are
generally not very demanding as far as their facilities and environment are concerned. The situation
might differ if corporate groups are examined. Corporate tourists are likely to be more demanding
with regard to facilities and thus more sensitive to the ambience created by the surrounding
environment.
It is important to note that for both international and domestic tourists the visual experience of the
area is but one factor that is considered when visiting a game farm. Other factors include inter alia:
Location and quality of the facilities
Variety and abundance of wildlife
Quality of the trophy (for hunting tourists)
Relationship with the farm owner
In order to determine the sensitivity of various groups towards the visual disturbances created by
the proposed development, a telephonic perception survey was conducted with professional
hunters operating in the area, as well as local game farms situated in the area. Based on the
outcomes of this survey as well as other qualitative and quantitative assessments (as discussed and
referenced throughout chapter 5 of this document) the following assumptions were made:
International tourists
A maximum of 50% of international tourists would definitely change their decision to visit
the area if there was a high visual disturbance associated with the wind farm. A small
visual impact created by the wind farm though was of a lesser concern. Nevertheless it still
might result in an estimated 15% of tourists choosing not to visit the respective farms. This
means that as word spreads and usual repeat tourists visit the game farm that is within
visual impact of the wind farm, the potential decline in the number of international tourists
could range between 15% and 50% depending on the distance from the facility.
Domestic tourists
Domestic tourists are also assumed to be sensitive towards the visual impact but to a
slightly lesser degree than international tourists. Based on the qualitative and quantitative
28assessments, between 10% and 40% of domestic visitors to game farms would change their
decision to visit the farm depending on the extent of the visual impact.
4.2.2 Assumptions regarding the extent of visual effects on properties and revenues
Using the visual impact index map developed by mapthis (2013) as seen in Map 2 with respect of the
proposed wind farm, assumptions with regard to the sensitivity of the specific game farms towards
the visual impact were made.
The first step was determining the degree to which a specific farm would be visually affected by the
wind farm. Thereafter, the following was taken into account to determine the rating of that impact
from a socio-economic perspective:
The visual index determined by mapthis (2013)
The location of accommodation facilities
The extent to which the visual impact would spread over the entire property
The existing visual disturbances (i.e. existing power lines) on the properties
The range used to rate the sensitivity of the farm towards visual impacts was as follows:
Low visual exposure: Turbines not particularly noticeable to the viewer. Minimal change in the
surroundings
High & moderate visual exposure: Turbines dominant , clearly noticeable or recognisable to the
viewer. Exceptional viewer sensitivity and viewpoints associated with tourism or recreational
attractions. Noticeable change in surroundings
This is based entirely on the visual exposure as shown in Map 2 and discussed in the revised
Visual Impact study submitted as part of the EIR . Ranges of distance were not used in the
assessment of visual exposure as the nature of the region’s relief would result in under- or over-
representation of properties.
Consideration was made of the percentage of land within the farm cadastrals that was classified
as high, moderate or low visual exposure. As such, if only low percentages of the land division’s
extents were classified as high/ medium/ low visual exposure, this would be reflected in the
tables below.
The nature of activity on each property was also factored in this assessment. As such, it was
assumed that properties that are engaged in tourism related activates such as hunting and
accommodation solely would be more sensitive to the degree of visual exposure than those
involved in mixed activity (with hunting that typically caters to biltong hunters and other
domestic tourists).
29For the purpose of considering potential losses to farm revenue, the following scenarios are
presented, incorporating the possibilities of extreme outcomes as well as a moderate outcome. The
scenarios assume different degree of change in tourist behaviour as a result of the establishment of
the wind farms .
Monetary values are assigned to these scenarios showing results of the estimated potential losses
for tourism and game farms that could occur in Table 8. It must be noted that these are based on
scenario testing. Distinction is also made between farms with low visual exposure (turbines not
particularly noticeable to viewers) and those with moderate (recognisable to the viewer) and high
visual exposure (dominant or clearly noticeable).
Scenario 1 Scenario 2 Scenario 3
Low degree of visitor Moderate degree of High degree of visitor
Description
sensitivity visitor sensitivity sensitivity
High & Low High & Low High & Low
moderate visual moderate visual moderate visual visual
Change in visual exposure exposure visual exposure exposure exposure
international property property exposure property property property
tourist property
visitors -10% -5% -35% 17% -60% -30%
High & Low High & Low High & Low
Change in moderate visual moderate visual moderate visual visual
domestic visual exposure exposure visual exposure exposure exposure
tourist property property exposure property property property
visitors property
-8% -4% -28% -14% -50% -25%
Table 8: Potential estimated production losses associated with visual impacts (R’ millions; 2013
prices)
Scenario 1 Scenario 2 Scenario 3
Low degree of visitor Moderate degree of High degree of visitor
Description
sensitivity visitor sensitivity sensitivity
High & Low High & Low High & Low
Change in moderate visual moderate visual moderate visual visual
international visual exposure exposure visual exposure exposure exposure
tourist exposure
visitors R0.62m R0.19m R2.3m R0.6m R4.11m R1.11m
30High & Low High & Low High & Low
Change in
moderate visual moderate visual moderate visual visual
domestic
visual exposure exposure visual exposure exposure exposure
tourist
exposure
visitors
R0.09m R0.05m R0.3m R0.16m R0.61 m R0.30m
As indicated in Table 8, the potential losses to the local game farming, tourism and associated
industries due to the construction of the wind farm could range between R0.94 million and R6.13
million per annum in 2013 prices.
31CHAPTER 5- EVALUATION OF IMPACTS AS A RESULT OF THE WIND FARM
This chapter of the report seeks to describe and evaluate the economic and social impacts that are
expected to occur as a result of the development of the Grahamstown Wind farm. This chapter also
provides a net effect and trade off analysis of the development of the wind farm in order to
determine the preference of one option over another. This chapter has separated the assessment of
the Grahamstown Wind farm into the projects three lifecycle phases namely construction,
operation, decommissioning.
5.1 DEFINING ECONOMIC IMPACTS
Economic impacts can be defined as the effects (positive or negative) on the level of economic
activity in a given area(s). The net economic impact is usually measured as the expansion or
contraction of an area’s economy, resulting from the changes in (i.e. opening, closing, expansion or
contraction of) a facility, project or programme.
5.1.1 Types of economic impacts
The net economic impact of an exogenous change in the economy will be translated according to
various direct and indirect economic effects, as are defined below:
Direct economic impacts: are the changes in local business activity occurring as a direct
consequence of public or private activities in the economy, or public programmes and policies.
Furthermore, increased user benefits lead to monetary benefits for some users and non-users
(individuals and businesses) within the geographical area:
For affected businesses, there may be economic efficiency benefits in terms of product
cost, product quality or product availability, stemming from changes in labour market
access, cost of obtaining production inputs and/or cost of supplying finished products to
customers. For affected residents, benefits may include reduced costs for obtaining goods
and services, increased income from selling goods and services to outsiders, and/or
increased variety of work and recreational opportunities associated with greater location
accessibility.
Indirect and induced impacts: The direct benefits to business and the residents of communities
and regions may also have broader impacts, including:
Indirect business impacts – business growth for suppliers to the directly affected
businesses and potential growth of municipal revenue due to raised taxes and service
levies.
32You can also read