QUANTIFYING THE SOCIO-ECONOMIC IMPACTS of HARMFUL ALGAL BLOOMS
←
→
Page content transcription
If your browser does not render page correctly, please read the page content below
QUANTIFYING THE SOCIO-ECONOMIC
IMPACTS of HARMFUL ALGAL BLOOMS
in SOUTHWEST FLORIDA in 2018
Project Sponsored by the West Coast Inland Navigation District and The Marine Industries Association of
Southwest Florida and Tampa Bay

                                                             Christa Court, Joao Ferreira , Andrew Ropicki,
                                                                                   Xiaohui Qiao, Bijeta Saha
                                                                 University of Florida Institute of Food and
                                                                            Agricultural Sciences (UF/IFAS)
                                                                  Food & Resource Economics Department
                                                                                                   July 2021

Food and Resource Economics Department
Gainesville, Florida
ACKNOWLEDGEMENTS
   This research report was developed through funding        the research team and photos for this report. We would also
from the West Coast Inland Navigation District (WCIND) and   like to thank all industry representatives that completed the
The Marine Industries Association of Southwest Florida and   surveys on the 2018 Red Tide event, this information was
Tampa Bay. Valuable information for the study was provided   invaluable to this research product. Finally, the project team
by Justin McBride, Executive Director of WCIND as well as    would like to acknowledge the support of Dr. Jin-won Kim
John Good and several members of The Marine Industries       in the analysis of the impacts of the 2018 Red Tide event on
Association of Southwest Florida and Tampa Bay who           Airbnb properties.
provided their time and knowledge through discussions with
TABLE OF CONTENTS
Executive Summary.......................................................... 3                   Economic Impacts of the 2017-2019 Red Tide Event....... 21

Introduction...................................................................... 4              Marine Recreational Activity............................................ 21
                                                                                                   Table 5. Marine charter/for-hire responses
Background...................................................................... 5
                                                                                                   by county..............................................................................23
  Harmful Algal Bloom Science............................................. 5                       Table 6. Percentage of respondents offering
                                                                                                   each trip type.......................................................................23
  Socio-Economic Impacts of Harmful Algal Blooms.......... 6                                       Table 7. Presence of Red Tide in local waters at
  Characteristics of Southwest Florida................................. 8                          any time during the event..................................................23
    Figure 1. Distribution of population in Southwest                                              Table 8. Percentage of respondents indicating
    Florida Counties, July 1, 2019..............................................9                  Red Tide was present in local waters by month............. 24
    Figure 2. Percent change in population,                                                        Table 9. Average revenue change by trip type
    April 1, 2010 to July 1, 2019.................................................9                during the event when Red Tide was
                                                                                                   present locally......................................................................25
    Figure 3. Annual population as of July 1 by county.........9
                                                                                                   Table 10. Average revenue change by trip type
    Figure 4. Population breakdown by race,                                                        during the event when Red Tide was not
    July 1, 2019...........................................................................10      present locally......................................................................26
    Figure 5. Proportion of the population that is                                                 Table 11. Average revenue change after the Red
    65 years and over................................................................10            Tide event ended (February 2019 to
    Figure 6. County-level Industry Output in                                                      December 2019)..................................................................26
    Southwest Florida, 2001 - 2020........................................ 11                      Table 12. Percentage change in annual revenue
    Figure 7. County-level Employment in Southwest                                                 from an average year for locally impacted operators.... 27
    Florida, 2001 - 2020........................................................... 11             Table 13. Marine recreational business responses
    Figure 8. County-level breakdown of Southwest                                                  by county.............................................................................. 27
    Florida employment by industry                                                                 Table 14. Percentage of respondents offering each
    (2-Digit NAICS), 2018..........................................................12              trip type.................................................................................29
    Table 1. Top Location Quotient (LQ) in a marine-                                               Table 15. Presence of Red Tide in local waters at
    dependent industry by county.......................................... 13                      any time during the event..................................................29
    Table 2. Location Quotients for select                                                         Table 16. Percentage of respondents indicating
    marine-dependent industries in Southwest Florida......14                                       Red Tide present in local waters by month......................29
    Table 3. Temporal change in employment for                                                     Table 17. Average revenue change by business
    select marine-dependent industries in                                                          segment during the event when Red Tide was
    Southwest Florida................................................................14            present locally..................................................................... 30
    Table 4. Temporal change in employment for                                                     Table 18. Average revenue change by business
    boat dealers in Southwest Florida.....................................14                       segment during the event when Red Tide was
    Figure 9. Share of Visitors by Region of Destination                                           not present locally...............................................................31
    (VISIT FLORIDA Vacation Regions), 2017..........................15                             Table 19. Average revenue change by business
    Figure 10. Composition of total tourist development                                            segment after the Red Tide event ended
    taxes collected in Southwest Florida counties,                                                 (February 2019 to December 2019).................................31
    2007 - 2017 average............................................................16              Table 20. Percentage change in annual revenue
  2017-2019 HAB Events in Florida.................................... 16                           from an average year for locally
                                                                                                   impacted operators.............................................................32
    Figure 11. Geographical location of 2018 water
    sample collection and respective cell count................... 17                             Tourism activity................................................................ 32
    Figure 12. Prevalence of 2018 Red Tide in                                                       Table 21. Fixed-effects models with
    Southwest Gulf Area of Florida counties and                                                     LSDV estimators.................................................................. 34
    the Rest of Florida...............................................................18            Figure 14. Conceptual diagram of the Price,
  2018 Blue-Green Algae Event.......................................... 18                          Quantity and Mixed effects in a presence of a
                                                                                                    shock in the market........................................................... 34
    Figure 13. Cyanobacteria concentration
    measurements in Lake Okeechobee, 2018.................... 20                                    Table 22. Airbnb losses in Southwest Florida counties
                                                                                                    by price, quantity and mixed-effects...............................35
Broader Regional Economic Impacts............................... 35                             Property-related Activity.................................................40
    Table 23. Tourism losses associated with Red                                                    Figure 15. Tax base of residential properties
    Tide events............................................................................36       within 5 miles of the coast in each county
    Table 24. Economic Impacts of the Tourism                                                       of Florida (2018)..................................................................41
    reduction associated with Airbnb market decline..........37                                     Figure 16. Percentages of residential property
                                                                                                    value within 5 miles of the coast in each
Conclusions.................................................................... 39                  county (2018)...................................................................... 42
Future Research Directions............................................. 39                      References...................................................................... 43
  Fishing Activity................................................................. 39

  Tourism Activity................................................................40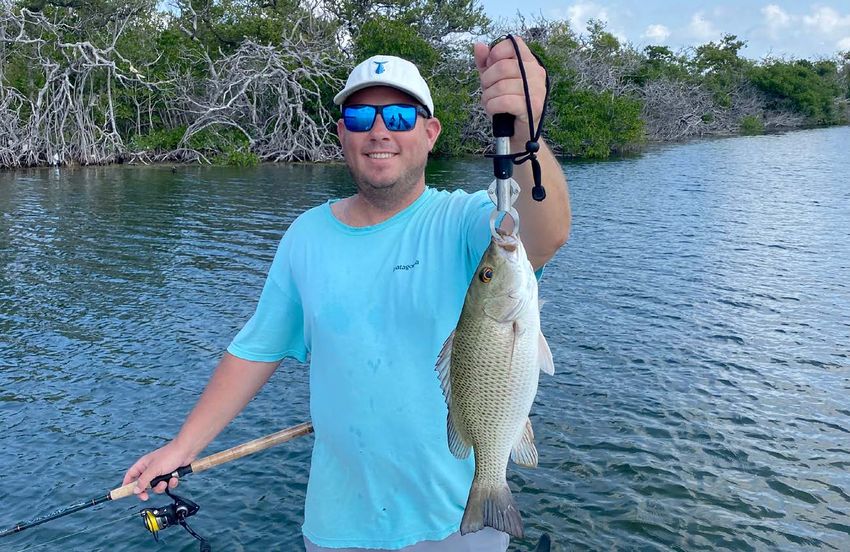
EXECUTIVE SUMMARY
   Algal blooms occur when natural algae in lakes, rivers, and         VISIT FLORIDA, an accredited destination marketing
coastal zones are stimulated to grow out of control through         organization for the state, estimated that 131.4 million
natural processes or by elevated levels of nutrients in the         visitors came to Florida in 2019, breaking the record for
water. Algal blooms that produce dangerous toxins that are          number of visitors for the 10th year in a row. The Southwest
detrimental to the plants, animals, people, and ecosystems in       Florida region attracts tourists from across the state,
the affected areas are known as harmful algal blooms (HABs).        throughout the nation, and around the world. County-level
Florida was impacted by two significant HAB events between          data compiled from VISIT FLORIDA reports for the years
late 2017 and early 2019. A large Red Tide event occurred           2007 - 2017 suggest that the eight-county Southwest Florida
on the Gulf Coast and was observed on the Atlantic coast of         region of interest is responsible for collecting an average of
Florida in 2018. Additionally, blue-green algae affected fresh      24% of the state’s tourist development taxes.
waters in South Florida including the Caloosahatchee and St            Surveys of for-hire/charter fishing and diving operations
Lucie Estuaries.                                                    as well as marine recreation industries indicate significant
   When human communities are exposed to HABs, there                impacts resulting from the 2018 Red Tide event, including:
can be significant economic losses and damages, which                  • Averages calculated for for-hire/charter operations
often depend on the size, severity, timing, and duration of              responding to the survey (n=59) indicate:
the event. However, data limitations often make it difficult
to determine the exact extent and value of these economic                – 61% decrease in sales revenues (average across all trip
impacts to local economies. This report was commissioned by                types) during the 2018 Red Tide event, when Red Tide
the West Coast Inland Navigation District and the Southwest                was present locally.
Florida Marine Industries Association to document the                    – 10% decrease in sales revenues (average across all trip
economic impacts of the 2017-2019 HABs in Southwestern                     types) during the 2018 Red Tide event, when Red Tide
Florida, where data allow.                                                 was not present locally.
   The region of interest, Charlotte, Collier, Hillsborough, Lee,        – 28% decrease in sales revenues (average across all
Manatee, Monroe, Pinellas, and Sarasota Counties, was home                 trip types) during the remainder of 2019 (February -
to more than 4.7 million people as of July 1, 2019, which is               December), after the 2018 Red Tide event had ended.
an increase of nearly 700,000 (or 17%) as compared to April            • Averages calculated for marine recreation operations
1, 2010. In 2019, the regional economy of Southwest Florida              responding to the survey (n=59) indicate:
generated $452 billion in industry output, nearly $255 billion
                                                                         – 36% decrease in sales revenues (average across all trip
in value added or Gross State Product, and supported nearly
                                                                           types) during the 2018 Red Tide event, when Red Tide
2.8 million fulltime and part-time jobs. The economy of
                                                                           was present locally.
Southwest Florida is not only significant in size, representing
                                                                         – 7% decrease in sales revenues (average across all trip
roughly 22% of the state economy in terms of both
                                                                           types) during the 2018 Red Tide event, when Red Tide
industry output and employment, but is also quite diverse
                                                                           was not present locally.
with significant activity in sectors ranging from finance to
                                                                         – 15% decrease in sales revenues (average across all
agriculture and from manufacturing to healthcare services.
                                                                           trip types) during the remainder of 2019 (February -
   The economy of Southwest Florida is inextricably linked
                                                                           December), after the 2018 Red Tide event had ended.
to the Gulf of Mexico, with which it shares several hundred
miles of shoreline. The Gulf and its associated resources are          Statistical analyses of the impacts of the presence of
important contributors to the region’s aesthetics as well as        Red Tide on the price and quantity of Airbnb property
culture, and provide critical ecosystem services that improve       reservations reveals that each water sample with a
the lives and wellbeing of its many residents as well as its        concentration of Karenia brevis above 100,000 cells per liter:
visitors. Marine-dependent industries such as commercial               • Reduces the average daily rate of Airbnb properties in a
fishing, marine aquaculture, seafood processing, water                   county by $0.446
transportation, and those that provide marine recreation               • Decreases tourist demand for Airbnb properties by 345
opportunities are directly dependent on the resources                    reservation days
that the Gulf provides. Additionally, when tourists visit the
region they purchase local goods and services that might
not appear directly linked to the Gulf but do represent
economic activity that is supported by marine-dependent
activities such as recreational fishing, boating, beachgoing,
kayaking, etc.

                                        Quantifying the Socio-Economic Impacts of Harmful Algal Blooms in Southwest Florida in 2018 3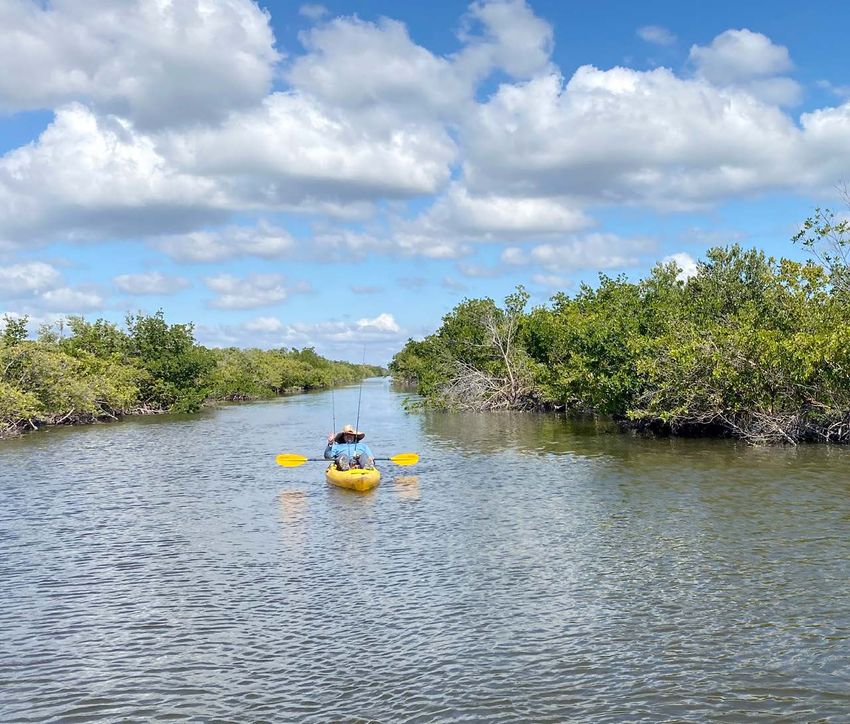
Further modeling suggests that declines in Airbnb                    Although the occurrence of HABs precedes modern
property visits result in a decline in local visitor spending. We    development in Florida, increasing population, the expansion
estimate that:                                                       of urban environment, and incidental changes have increased
  • Direct impacts of the 2017-2019 Red Tide event are more          the frequency, duration, and intensity of some blooms
    than $184 million                                                (Burns, 2008). Consequently, Floridians and others have
  • Broader regional economic impacts were estimates                 become more concerned about the threats and harmful
    based on these direct impacts, leading to estimates of           effects of these blooms. Accurate and defensible estimates
    total economic impacts that include:                             of the economic impacts of HABs can inform discussions
                                                                     surrounding measures and policies aimed at decreasing
    – Over $317 million in industry output (sales                    the frequency and intensity of HABs and mitigating their
      revenue) impacts                                               consequences.
    – Over $195 million in total value-added impacts
    – Over $120 million in total labor income impacts
    – Over $45 million in total federal, state, and local
      tax impacts
    – Nearly 3,000 job-years lost.

INTRODUCTION
   Algal blooms occur when natural algae in lakes, rivers, and       high-salinity waters. Fish kills are often associated with Red
coastal zones are stimulated to grow out of control through          Tide events. Excess land-based nutrients flowing into Florida
natural processes or by elevated levels of nutrients in the          estuaries and coastal waters in stormwater runoff might
water. Algal blooms that produce dangerous toxins that are           exacerbate the growth of HABs. Additionally, blue-green
detrimental to the plants, animals, people, and ecosystems in        algae affected fresh waters in South Florida including the
the affected areas are known as harmful algal blooms (HABs).         Caloosahatchee and St Lucie Estuaries. The ongoing blue-
Several types of naturally occurring HABs exist including            green algal bloom was linked to federally directed outflows
those caused by cyanobacteria (e.g. blue-green algae) and            from Lake Okeechobee into the Caloosahatchee River and
the marine dinoflagellate Karenia brevis, commonly known             St. Lucie canal/river. Blue-green algal blooms can get large
as “Red Tide”. HABs can cause respiratory distress and               enough to block sunlight from reaching submerged plant life.
skin irritation in humans and marine animals, contaminate            The algae also reduce the presence of oxygen in surrounding
shellfish, cause fish kills, create dead zones in the water, raise   waters causing hypoxic conditions for fish and other
treatment costs for drinking water, and harm industries and          marine life.
recreational users that depend on clean water withdrawals               HABs are associated with economic losses and damages.
or in situ use (Adams et al, 2018). Several HABs have                Continued population growth and coastal development
occurred in Florida over the last 15 years including multiple        increases the likelihood of negative economic effects
Red Tide events along the Gulf Coast (2005, 2017-2019), in           resulting from HAB events. With some types of HABs
Choctawhatchee Bay (2006), and along the Northeast coast             increasing in frequency, these blooms will continue to be a
(2007); HABs caused by other dinoflagellates in Southwest            major concern for the State of Florida due to their harmful
Florida (2010), off Florida’s Panhandle (2011), and in Collier       nature (Burns, 2008). This report was commissioned by
and Lee Counties (2011); a brown tide event in the Indian            the West Coast Inland Navigation District and The Marine
River Lagoon (2012); and localized blooms of golden algae            Industries Association of Southwest Florida and Tampa Bay
that have been occurring since 2005 (Florida FWC, 2018).             to document the economic impacts of the 2017-2019 HABs
   Florida was impacted by two significant HAB events                in Southwestern Florida, where data allow. Accurate and
between late 2017 and early 2019. A large Red Tide event             defensible estimates of the socio-economic impacts of HABs
occurred on the Gulf Coast and was also observed on the              can inform discussions surrounding measures and policies
Atlantic coast of Florida in 2018. Unusually, this Red Tide          aimed at decreasing the frequency and intensity of HABs and
event along the Gulf coast persisted into the cool winter            mitigating their consequences by identifying the economic
months in 2019. Red Tide blooms most often occur in the              sectors and activities most at risk.
ocean and nearshore coastal waters as this algae thrives in

4 Quantifying the Socio-Economic Impacts of Harmful Algal Blooms in Southwest Florida in 2018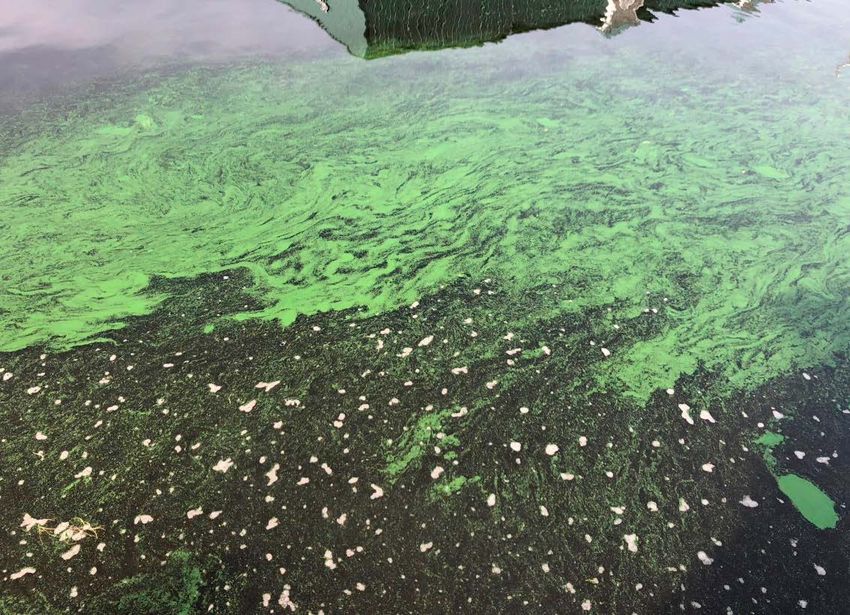
BACKGROUND
   The conceptualization and measurement of the                        Karenia brevis produces brevetoxins, which are potent
socioeconomic impacts of a particular HAB event requires an        neurotoxins that can remain in the water, aerosolize into the
underlying understanding of general HAB science, previously        air, and bioaccumulate within the food chain (Anderson et
identified pathways through which HABs impact human                al., 2002). Red Tide events can result in water discoloration
communities, the economic and demographic characteristics          (reddish brown) as well as illness in humans, and mortality
of the region of interest, and the characteristics of the          events for fish and other marine life. When encountering
specific event of interest.                                        toxic water or air, healthy individuals might experience
                                                                   skin irritation, and upper respiratory symptoms such as
Harmful Algal Bloom Science                                        nose and throat irritation, eye tearing, sneezing, and/or
    Recent estimates indicate that there are more than 70,000      coughing (Backer et al., 2005), whereas individuals with
species of algae throughout the world (Guiry, 2012). Under         respiratory ailments such as asthma and COPD can suffer
the right conditions, some species are capable of multiplying      from both upper and lower respiratory symptoms along
substantially in number to result in a “bloom”; however not        with changes in lung function when encountering significant
all species or algal blooms are harmful to humans or the           amounts of these brevetoxins in the air (Fleming et al., 2005,
environment. While algae can be classified in many different       2007; Milian et al., 2007). Ingestion, i.e. consumption of
ways (e.g., scientific classification, classification based on     brevetoxin-contaminated shellfish, can result in neurotoxic
morphological features, etc.), the algal species that can          shellfish poisoning (NSP), which is considered a critical issue
cause HABs are generally divided into two groups – those           by both Florida residents and visitors (Kirkpatrick et al.,
found in coastal or marine environments and those that             2004a). NSP can cause serious illness with symptoms like
are freshwater algae. HAB-causing algae can also be                nausea, diarrhea, pupil dilation, loss of motor coordination,
differentiated based on the impacts of the HAB events.             and turnaround of hot and cold sensations (Poli, 2000) with
Hallegraeff et al. (2003) define these subgroups as: 1)            some individuals requiring days of emergency and intensive
species that typically produce harmless water discoloration        hospital care (Watkins et al., 2008). The ecology and the
but can deplete dissolved oxygen levels and harm marine            economy experience detrimental consequences because
life (e.g. dinoflagellates Akashiwo sanguinea, Gonyaulax           of this bloom affecting marine mammals, birds, fish, and
polygramma, Noctiluca scintillans, Scrippsiella trochoidea;        humans.
cyanobacterium Trichodesmium erythraeum, etc.); 2) species             Cyanobacteria. Cyanobacteria, also known as blue-green
that can cause a variety of respiratory, gastrointestinal, and/    algae, are actually a type of bacteria. Cyanobacteria are
or neurological illnesses as a result of the specific toxins       commonly found in freshwater environments, especially
that they produce, some of which can even spread through           accumulating in slow flowing water reservoirs, lakes, and
the food chain to humans (e.g. dinoflagellate Karenia brevis       rivers, however cyanobacteria are also found in estuarine
(marine), which produces a brevetoxin that can cause skin          and marine waters and terrestrial environments. Florida’s
and respiratory issues and potentially neurotoxic shellfish        subtropical environment and the eutrophic (nutrient-
poisoning (NSP); cyanobacteria Anabaena circinalis                 dense) nature of the lakes, springs, rivers, estuaries, and
(freshwater) and Microcystis aeruginosa (freshwater), which        other marine environments make it a natural home to
produce neurotoxins and peptide hepatotoxins that can              cyanobacteria.
cause cyanobacterial toxin poisoning, etc.); and 3) species            Several species of cyanobacteria can be hepatotoxic,
that are generally noticed within aquaculture environments         neurotoxic, and/or dermatotoxic and cause HAB events.
that harm fish and invertebrates by damaging their gills           These species include Microcystis, Dolichospermum
(e.g. diatoms Chaetoceros concavicorne, C. convolutus;             (previously Anabaena), Aphanizomenon, Raphidiopsis
dinoflagellates Karenia mikimotoi, K. brevis, etc.).               (previously Cylindrospermopsis) and Planktothrix (Collins,
    The two organisms that commonly cause HAB events in            2020; U.S. EPA, 2020). CyanoHABs can result in water
Southwest Florida and are of interest in this particular report    discoloration, floating “muck mats” that can cause oxygen
are Karenia brevis and cyanobacteria.                              depletion, and can potentially create health risks for humans,
    Karenia brevis. Karenia brevis is a marine dinoflagellate      pets, and livestock via toxins that can cause nausea, skin and
that is capable of dense accumulation that can result in           eye irritations, tumor production, and in some cases even
the marine HAB events commonly referred to as Red Tide             death (U.S. EPA, 2020).
(Killberg-Thoreson et al., 2014). This species is common               HAB Events. HAB events, whether caused by Karenia
in marine waters throughout the Gulf of Mexico but Red             brevis or cyanobacteria, occur when the organism is
Tide events are most frequent along the coastal regions of         stimulated to grow at a much faster rate than usual. Algal
Southwest Florida (NOAA, 2021).                                    growth requires just three things: sunlight, slow-moving

                                       Quantifying the Socio-Economic Impacts of Harmful Algal Blooms in Southwest Florida in 2018 5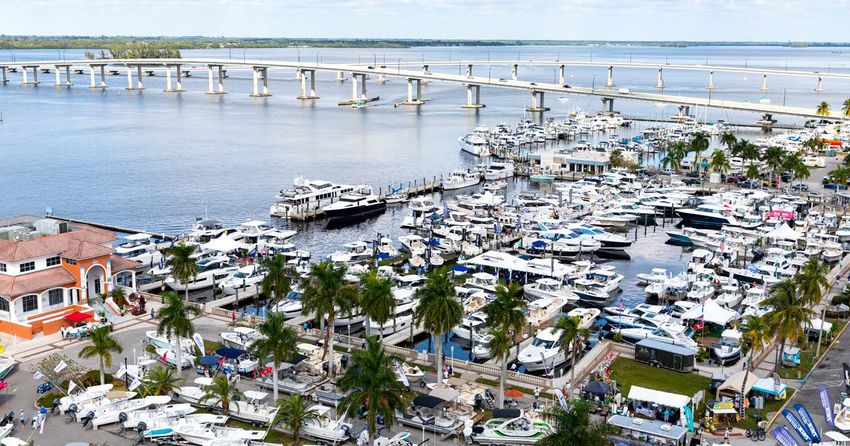
water, and nutrients (specifically phosphorus [P] and               exchanged within an existing market and as such have
nitrogen [N]). However, the source(s) of the stimulus that          no market price. While both types of value can provide
triggers rapid growth is often a complex set of conditions and      important information and insights and likely should
can include:                                                        both be used within a multi-criteria analysis, decision
  • Increases in nutrient levels (for example phosphorus and        makers should take care when attempting to compare,
      nitrates) from natural processes such as ocean upwelling      contrast, and combine estimates derived from market- and
      or human-derived sources such as fertilizer run-off from      non-market-based methods.
      residences and agricultural lands, sewage discharges,             There are several examples of market-based approaches
      and run-off from urban areas and industrial facilities        to estimating the economic impacts of HAB events. Jin et
  •   Changes in ocean currents (El Niño, La Niña) or water         al. (2008) measured the differences of value and quantity of
      flows, such as those associated with drought or extreme       shellfish landings with and without Red Tide to estimate the
      precipitation                                                 direct economic impacts of the 2005 event on commercial
  •   Changes in water temperature, particularly increases in       shellfish fisheries in Maine and Massachusetts. Their work
      temperature                                                   revealed that the total direct impact in terms of sales
  •   Changes in chemical factors such as pH or turbidity           revenues was $2.4 million in Maine, including losses in the
  •   Changes in the local ecology (how organisms interact          softshell clam and mussel fisheries. Total direct impacts
      with each other) (U.S. CDC, 2017)                             on the commercial shellfish industry in Massachusetts was
                                                                    estimated to be as high as $18 million. Bechard (2019)
   Although the occurrence of algal blooms precedes                 constructed a time series econometric model to study the
modern development in Florida, increasing population, the           effects of HABs on the restaurant and hotel/lodging sector
expansion of urban environment and the incidental changes           of Sarasota County, Florida between 2006 and 2018. The
have increased the frequency, duration, and intensity of            findings showed that the revenue of lodging and restaurant
some blooms (Burns, 2008). Consequently, Floridians and             sectors were significantly reduced by Red Tide blooms;
others have become more concerned about the threats and             during persistent blooms, monthly sales decreased by 5-7%
harmful effects of these blooms.                                    in hotels and by 1.25-2.5% in restaurants. Similarly, Bechard
                                                                    (2020) specifically looked at Red Tide events lasting more
Socio-Economic Impacts of Harmful Algal Blooms                      than 17 days and found that growth rates in lodging fell by
   The physical, environmental, and human health effects            1–2% for each additional day of Red Tide and growth rates
of HABs can also lead to mandatory or voluntary changes in          in the foodservice sector fell by roughly 0.5–1%. Wolf and
behavior that result in significant economic consequences,          Klaiber (2017) assessed the impact of HABs on the nearby
especially related to marine-dependent activities or activities     property values across 6 Ohio counties surrounding 4 inland
that occur in close proximity to the coast. Several reviews of      Ohio lakes between 2009 and 2015. After matching the
the existing academic literature associated with quantifying        housing transactions with lake proximity measures, they
the economic consequences of HABs and other coastal                 employed a detailed hedonic analysis to evaluate the effect
hazard events have been published in recent years (Adams            of algae concentration and proximity to the lake on the
et al., 2018; Botzen et al., 2019; Botzen, Deschenes, and           property values. They showed capitalization losses associated
Sanders, 2019). Detailed overviews of past academic and             with near lake homes between 11% and 17% rising to above
institutional work on the socioeconomic impacts of HABs             22% for lake adjacent homes. In the case of Grand Lake Saint
can also be found in the Workshop Proceedings report and            Marys, they found one-time capitalization losses exceeding
annotated bibliography that was compiled by the HAB Socio-          $51 million for near lake homes which dwarfs the State of
economics Planning Committee, who recently organized a              Ohio’s cleanup expenditure of $26 million.
workshop sponsored by the U.S. National Office for Harmful              Examples of the non-market approach to measuring
Algal Blooms at the Woods Hole Oceanographic Institution            losses associated with HAB events also exist. Zhang and
(WHOI) and the NOAA National Centers for Coastal Ocean              Sohngen (2018) quantitatively estimated the welfare
Science (NCCOS) on the Socio-economic Effects of Harmful            losses suffered by Ohio’s Lake Erie recreational anglers
Algal Blooms in the United States (Proceedings of the               due to freshwater HAB events. Using a mail survey data of
Workshop on the Socio-economic Effects of Harmful Algal             recreational anglers, they constructed a choice experiment
Blooms in the United States, 2021; Socio-Economic Impacts           based on a Random Utility Maximization model and found
of Harmful Algal Blooms: A Zotero Bibliography, 2021).              that there was a significant and substantial willingness to
   The most basic distinction regarding approaches used to          pay by anglers for reduction in HABs. For instance, anglers
estimate economic impacts is whether the consequences               are willing to pay on average $40 to $60 per trip for a policy
are measured as changes in “market” or “nonmarket”                  that cuts upstream phosphorus loadings by 40%. Wolf et
value. Market-based methods estimate losses associated              al. (2019) examined both the effect of Escherichia coli (E.
with changes in the quantity of goods or services sold              coli) and HABs on recreational behavior using survey data
or demanded and/or the prices of those goods, in other              collected from recreational visitors to Lake Erie during the
words, market changes. Non-market valuation methods                 summer of 2016. Using simulations based on latent class
are used to estimate the value of goods and services,               models of recreation choice, they found that beachgoers
often environmental or recreational in nature, that are not         and recreational anglers would lose $7.7 million and $69.1

6 Quantifying the Socio-Economic Impacts of Harmful Algal Blooms in Southwest Florida in 2018
Quantifying the Socio-Economic Impacts of Harmful Algal Blooms in Southwest Florida in 2018 7
million, respectively. They also recovered heterogeneity in         of the complexities involved in understanding the full set
recreators’ aversion toward algae and E. coli, with recreational    of relationships between marine, freshwater, and coastal
beachgoers are more averse to E. coli and recreational              resources and the human communities that they support
anglers are more averse to HABs. Finally, Shan et al. (2019)        and satisfy, which is crucial to effective policy response
employed a choice experiment to investigate the public’s            (Nierenberg et al., 2010; Kirkpatrick et al., 2006; Whitehead
willingness to pay for the governance of green tides in             et al., 2003; Kasperson et al., 1988; Kuhar et al., 2009).
Yellow Sea, China. Based on the survey data collected in
Jiaozhou Bay in 2018 and the random parameter logit models          Characteristics of Southwest Florida
estimated, they concluded that the average willingness to pay          The region of interest for this study is the Southwestern
per respondent household in Jiaozhou Bay was 214.45 China           Florida peninsula including the counties of Charlotte,
Yuan (CNY) each year for green-tide ecological restoration          Collier, Hillsborough, Lee, Manatee, Monroe, Pinellas, and
and that the total annual ecological and recreational damage        Sarasota. This region encompasses areas of the state that
caused by green tides was approximately 2.02 billion CNY            are colloquially known as the Sun Coast, Cultural Coast,
(USD 0.30 billion).                                                 Lee Island Coast, Paradise Coast, and the Florida Keys.
    Increasing trends in the occurrence and duration of HAB         This area boasts sunny weather, world-class beaches,
events suggests that the chances of both producers and              well-known performance and media art installations and
consumers experiencing a HAB event that impacts their               festivals, innumerable marine- and nature-based recreational
behavior, revenues, and expenditures are growing. Continued         opportunities, and the metropolitan areas of Tampa-St.
population growth and coastal development also increases            Petersburg-Clearwater, North Port-Sarasota-Bradenton,
the likelihood and scope of the negative economic effects           Punta Gorda-Cape Coral-Ft. Myers, and Naples-Marco Island
resulting from Red Tide events. Several discussions are             - making it attractive to both the individuals that call it home
underway at the local, state, and federal levels on how best        and those for which it is only a temporary “home away from
to mitigate and/or prevent HABs or the impacts of HABs.             home”.
Accurate and comprehensive estimates of the socioeconomic
impacts of these events will help decision-makers assess            Demographics
the usefulness and efficiency of different policy options. The         These eight counties in Southwest Florida were home to
applications and methods reviewed above indicate that when          more than 4.7 million people as of July 1, 2019, which is an
reliable and accurate data associated with relevant activities      increase of nearly 700,000 (or 17%) as compared to April
are available or are able to be collected via survey techniques,    1, 2010. As shown in Figure 1, a majority (68%) of these
then HAB and location specific estimates of the resulting           residents reside in Hillsborough, Pinellas, and Lee Counties.
economic and welfare impacts of HABs can be calculated.             Figure 2 displays the percentage change in population from
    Despite all of these examples demonstrating documents           April 1, 2010 through July 1, 2019. Nearly all counties in
the impacts of particular HABs on specific industries in a          the eight-county Southwest Florida region grew at a faster
variety of geographic locations, there is still a lot to learn      rate than both the State of Florida and the United States
in terms of the short-term and long-term socioeconomic              (U.S.). The overall population in Pinellas County grew at the
impacts of HAB events. Adams et al. (2018) appropriately            same rate as the entire U.S. (6.3%), whereas Monroe County
suggested that in addition to continued assessments of              grew by just 1.6%. It is important to note that the State of
acute short-term impacts, future research should explore            Florida’s population grew at more than twice the rate of the
the lagged impacts of HABs (both in space and time) as well         U.S. (14.2% versus 6.3%), with the remaining six counties in
as methods for estimating the indirect economic impacts of          Southwestern Florida growing at or above this rate. The two
HABs. Evolving research on the public health, brand-value,          fastest growing counties in this region between 2010 and
and seafood consumption impacts of HABs as well as risk             2019 are Manatee (24.9%) and Lee (24.5%). Figure 3 displays
perception and risk preferences of individuals as they relate       the annual population of each county over time from 2001 to
to HABs can also be used to further our understanding               2019 and also denotes the significant growth in the region.

8 Quantifying the Socio-Economic Impacts of Harmful Algal Blooms in Southwest Florida in 2018
Figure 1. Distribution of population in Southwest Florida Counties, July 1, 2019.
Data Source: U.S. Census Bureau QuickFacts, 2021.
30%
25%
20%
15%
10%
5%
0
Figure 2. Percent change in population, April 1, 2010 to July 1, 2019.
Data Source: U.S. Census Bureau QuickFacts, 2021.
1,600,000
1,400,000
1,200,000
1,000,000
800,000
600,000
400,000
200,000
0
Figure 3. Annual population as of July 1 by county.
Data Source: IMPLAN© Data Library.
Quantifying the Socio-Economic Impacts of Harmful Algal Blooms in Southwest Florida in 2018 9Figure 4 displays the breakdown of county-level population that is of Hispanic or Latino origin (each ≤ 10%) as
populations in Southwest Florida by race alongside similar compared to the state and the U.S. Manatee County (16.9%)
data for the U.S. and the State of Florida. Florida’s population and Lee County (22.5%) are similar to the national average or
breakdown is similar in composition to the U.S. with a slightly state average respectively and all other counties in the region
larger proportion of the population that is Black or African exceed the state average and range from 25.3% (Monroe) to
American (alone) and a slightly lower proportion of the 29.7% (Hillsborough).
population that is Asian (alone), American Indian or Alaska Finally, Figure 5 presents the percentage of the population
Native (alone), or Two or More Races. With the exception in each Southwest Florida county that is 65 years or older
of Hillsborough County, the counties of Southwest Florida as compared to the U.S. and Florida in 2019. The State of
have a larger proportion of their populations that are White Florida has long been a popular retirement destination and
(alone) as compared to both the state and nation, with other unsurprisingly Florida has a larger population of persons 65
races making up between 10% and 17% of each county-level and older (20.9% as compared to 16.5%). With the exception
population. The State of Florida also has a significantly higher of Hillsborough County (14.5%), each county in Southwest
proportion of the population of Hispanic or Latino origin Florida has an even larger proportion of the population that is
as compared to the U.S. (26.4% versus 18.5%). Within the over the age of 65, ranging from 23.7% in Monroe County to
Southwest Florida region, Charlotte, Sarasota, and Pinellas 40.8% in Charlotte County.
Counties have a considerably lower percentage of the
120%
100%
80%
60%
40%
20%
0
Figure 4. Population breakdown by race, July 1, 2019.
Data Source: U.S. Census Bureau QuickFacts, 2021.
45%
40%
35%
30%
25%
20%
15%
10%
5%
0
Figure 5. Proportion of the population that is 65 years and over.
Data Source: U.S. Census Bureau QuickFacts, 2021.
10 Quantifying the Socio-Economic Impacts of Harmful Algal Blooms in Southwest Florida in 2018Regional Economy Figure 7 displays county-level statistics on employment
In 2019, the regional economy of Southwest Florida (fulltime and part-time jobs) from 2001 through 2020, again
generated $452 billion in industry output, nearly $255 showing a pattern of growth after The Great Recession. The
billion in value added or Gross State Product, and paid largest economy in the region both in terms of industry
nearly $135 billion in employee compensation to individuals output and employment is Hillsborough County, followed by
employed in nearly 2.8 million fulltime and part-time jobs. Pinellas County and Lee County, which encompass the cities
Figure 6 displays county-level statistics on industry output of Tampa Bay, St. Petersburg, Ft. Myers, and Cape Coral.
(i.e. sales revenues in producer prices) from 2001 through
2019, showing steady growth after The Great Recession
(2007-2009) in nearly all counties.
200,000
180,000
160,000
140,000
120,000
100,000
80,000
60,000
40,000
20,000
0
Figure 6. County-level Industry Output in Southwest Florida, 2001 - 2020.
Data Source: IMPLAN© Data Library.
1,000,000
800,000
Total Employment
600,000
400,000
200,000
0
‘01 ‘02 ‘03 ‘04 ‘05 ‘06 ‘07 ‘08 ‘09 ‘10 ‘11 ‘12 ‘13 ‘14 ‘15 ‘16 ‘17 ‘18 ‘19
Figure 7. County-level Employment in Southwest Florida, 2001 - 2020.
Data Source: IMPLAN© Data Library.
Quantifying the Socio-Economic Impacts of Harmful Algal Blooms in Southwest Florida in 2018 11The economy of Southwest Florida is not only significant economy is heavily service-oriented, with significant activity
in size, representing roughly 22% of the state economy in in industries that provide services such as health care,
terms of both industry output and employment, but is also transportation, and waste management to local populations
quite diverse with significant activity in sectors ranging from as well as accommodation and entertainment to visitors.
finance to agriculture and from manufacturing to healthcare For further information related to the regional economy
services. Figure 8, presents the breakdown of employment in Southwest Florida, see the Southwest Florida Economic
in each industry group, by county. The top 5 industry groups Almanac Series and the monthly Regional Economic
in the region in terms of employment include Healthcare and Indicators reports from Regional Economic Research Institute
Social Assistance, Retail Trade, Accommodation and Food at Florida Gulf Coast University (Neto et al., 2020; Neto et al,
Services, Professional, Scientific, and Technical Services, and 2021).
Administrative and Support and Waste Management and
Remediation Services. In terms of employment, the region’s
350,000
300,000
250,000
200,000
150,000
100,000
50,000
0
Figure 8. County-level breakdown of Southwest Florida employment by industry (2-Digit NAICS), 2018.
Data Source: IMPLAN© Data Library.
12 Quantifying the Socio-Economic Impacts of Harmful Algal Blooms in Southwest Florida in 2018It is also worth noting that the economy of Southwest that comprise the economic base of a certain geographical
Florida is inextricably linked to the Gulf of Mexico, with area (Leigh, 1970; Isserman, 1977). The LQ compares the
which it shares several hundred miles of shoreline. The Gulf concentration of industry activity within a region with the
and its associated resources are important contributors industry activity in a larger geographical area such as the
to the region’s aesthetics as well as culture, and provide state or a country. If the LQ for a particular industry is greater
critical ecosystem services that improve the lives and than one, then the industry is considered a “basic sector” and
wellbeing of its many residents as well as its visitors. Marine- is responsible for exports from the region, which brings new
dependent industries such as commercial fishing, marine money into the region. Alternatively, nonbasic (or service)
aquaculture, seafood processing, water transportation, industries support the basic industries, households, and
and those that provide marine recreation opportunities are other institutions within a region.
directly dependent on the resources that the Gulf provides. Data on employment from the U.S. Bureau of Labor
Additionally, when tourists visit the region they purchase Statistics (BLS) are used to estimate LQs for the Southwest
local goods and services that might not appear directly Florida counties of interest to determine which marine-
linked to the Gulf but do represent economic activity dependent industries can be considered a part of the
that is supported by marine-dependent activities such as county’s economic base. In this case, we compare the
recreational fishing, boating, beachgoing, kayaking, etc. employment concentration for each industry within the
county with the employment concentration of that industry
Marine-dependent industries in the U.S. Table 1 displays the marine-dependent industry
One metric for discerning the role of a particular industry with the greatest LQ for each county.
within a regional economy is the location quotient (LQ) - a
popular and well-studied indicator that identifies the sectors
Table 1. Top Location Quotient (LQ) in a marine-dependent industry by county.
NAICS Industry County LQ
487210 Scenic and Sightseeing Transportation, Water Monroe 87.7
483114 Coastal and Great Lakes Passenger Transportation Charlotte 36.1
713930 Marinas Manatee 24.5
713930 Marinas Hillsborough 20.9
114119 Other Marine Fishing Sarasota 17.0
487210 Scenic and Sightseeing Transportation, Water Collier 12.9
114119 Other Marine Fishing Pinellas 8.6
Source: Author estimations using data from U.S. Bureau of Labor Statistics (BLS).
Quantifying the Socio-Economic Impacts of Harmful Algal Blooms in Southwest Florida in 2018 13Table 1 indicates that several marine industries do qualify Florida but it is important to highlight that it employs around
as basic industries at the county level with Scenic and 2,000 individuals in these Southwest Florida counties alone.
Sightseeing Transportation by Water and Marinas revealing Table 4 presents the number of employees working (or
high levels of concentration. Significant concentrations of number of establishments when employment data are not
employment are also observed in the Other Marine Fishing disclosed [*]) in the Boat Dealers industry in 2016 and 2019.
sector in Hillsborough and Pinellas Counties. Finally, in
Charlotte County the marine industry with the largest LQ Table 3. Temporal change in employment for select
is Coastal Passenger Transportation. Since the Scenic and marine-dependent industries in Southwest Florida.
Sightseeing Transportation by Water and Marinas sectors are
present in all of the counties of the region, Table 2 presents Scenic and Sightseeing
Marinas
the LQ’s for these two industries for all eight counties of this Transportation, Water
region and in Florida, when compared with the U.S. economy. 2016 2019 2016 2019
Charlotte 220 238 30 33
Table 2. Location Quotients for select marine-dependent
Collier 312 375 30 38
industries in Southwest Florida.
Hillsborough 10* 12* 5* 9*
Scenic and Sightseeing
Marinas Lee 255 269 0* 1*
Transportation, Water
Manatee 11* 14* 1* 1*
Charlotte 6.9 9.0
Monroe 355 332 73* 82*
Collier 12.1 4.6
Pinellas 651 591 206 258
Hillsborough 1.0 0.7
Sarasota 319 436 11* 11*
Lee 6.6 3.0
Source: U.S. Bureau of Labor Statistics (BLS).
Manatee 3.7 3.1
Monroe 85.9 23.6
Pinellas 5.8 3.2 Table 4. Temporal change in employment for boat dealers in
Southwest Florida.
Sarasota 3.2 1.7
Florida 2.1 3.2 Boat Dealers
Source: Author estimations using data from U.S. Bureau of Labor 2016 2019
Statistics (BLS). Charlotte 12* 12*
With the exception of Hillsborough County, which seems Collier 165 210
to depend less on these two sectors, these two sectors do Hillsborough 163 144
seem to qualify as a part of the economic base in each of the Lee 550 526
other counties and the state (but to a lesser extent). Monroe,
Charlotte, Collier, and Lee Counties have a consistently Manatee 211 235
high concentration of these two activities, which means Monroe 31* 30*
that disturbances to activity associated with the marine- Pinellas 608 611
dependent industries can more directly affect the county
Sarasota 210 186
economy. The presence of these activities in these regions
has also been increasing over time. Indeed, employment Source: U.S. Bureau of Labor Statistics (BLS).
data demonstrate that Marinas and Scenic and Sightseeing
Transportation by Water have an increasing relevance in this Tourism
area of Florida. The white-sand beaches, other outdoor recreation
Table 3 shows the evolution of employment levels (or opportunities, entertainment, and other cultural amenities of
number of establishments when employment data are not the Southwest Florida region attract tourists from across the
disclosed [*]) between 2016 and 2019 in these areas. The state, throughout the nation, and around the world. VISIT
values, whether measured in employees or establishments, FLORIDA, an accredited destination marketing organization
are consistently increasing between 2016 and 2019 further for the state, estimated that 131.4 million visitors came to
demonstrating the importance of these activities within the Florida in 2019, breaking the record for number of visitors for
Southwest Florida counties and suggesting that a significant the 10th year in a row. Detailed information available from the
number of individuals rely on the marine-dependent latest iteration of VISIT FLORIDA’s Visitor Study (2017) indicate
industries for income. that an estimated 38% of visitors to the state have a
Finally, one additional type of business operation that is destination that is within the Central West, Southwest, or
directly linked with several marine-dependent industries Southeast Vacation Regions, each of which include (though
and the recreational use of coastal and inland waters is boat are not exclusively composed of) counties within the region
dealers. This industry is geographically distributed around of interest for this report (Figure 9). It should be noted that
14 Quantifying the Socio-Economic Impacts of Harmful Algal Blooms in Southwest Florida in 2018Miami, The Everglades, and the locations of several world- remainder arriving by other means such as car, bus, or boat.
class freshwater springs and rivers also fall within these three Only 24% of visitors stay in paid hotel accommodations,
vacation regions. another 26% stay in paid non-hotel accommodations such
as rental properties, and the other 50% stay in non-paid
accommodations meaning that they stayed with relatives or
friends that live in the area or perhaps they themselves own
a second-home or rental property in the area.
In an average year, a majority (> 60%) of trips to the
Southwest Florida Vacation Region occur in the Winter
(Dec. - Feb.) and Spring (Mar. - May). In this region, an
overwhelming number of trips (> 92%) are for leisure
purposes including vacation/getaway (44%) and visiting
relatives or friends (37%). Trip-level averages for all types of
visitors suggest expenditures of $101 dollars per trip-day per
visitor (not including transportation). The average stay for
visitors within this region is 5-6 nights and the top activities
engaged in are consistently reported as beachgoing or
waterfront activities, shopping, culinary/dining experiences,
and visiting outdoor parks (national or state parks).
County-level data compiled from VISIT FLORIDA reports
Figure 9. Share of Visitors by Region of Desti- for the years 2007 - 2017 suggest that the eight-county
nation (VISIT FLORIDA Vacation Regions), 2017. Southwest Florida region of interest is responsible for
Data Source: VISIT FLORIDA, 2017 Florida Visitor Study. collecting an average of 24% of that state’s tourist
development taxes. Figure 10 details the average
Focusing on the Southwest Vacation Region as most composition of total tourist development taxes collected in
representative of our eight-county Southwest Florida study the region by county from 2007 to 2017, suggesting that a
area, data compiled from VISIT FLORIDA reports for the years majority of the tourist development taxes for the region are
2007 - 2017 suggest that the average age of visitors to this collected in counties with popular waterfront (Gulf beaches
region is 52 years old with an average household income level and Tampa Bay) destinations (Pinellas, Lee, Monroe,
of $111,0001. On average, just under half of this Vacation Hillsborough Counties).
Region’s visitors arrive via air transportation (46%) with the
Annual values reported were not adjusted for inflation.
1
Quantifying the Socio-Economic Impacts of Harmful Algal Blooms in Southwest Florida in 2018 15and water quality, including the presence and concentration
of K. brevis and declaration of Red Tide events for several
decades. The HAB Monitoring Database, published by the
FWRI, covers the period from 1954 to the present and
include over 125,000 records with geographic coordinates,
the cell count for K. brevis and other algal species in cells
per liter, and a variety of other water quality measurements
such as temperature, salinity, and dissolved oxygen. While
ongoing throughout the calendar year, sampling efforts
associated with this dataset are correlated with the intensity
and the duration of bloom events. Red Tide events are
classified by intensity (number of cells of K. brevis present
per liter of water). A Red Tide event can be categorized as
‘not present’ (background levels of 1,000 cells or less), ‘very
Figure 10. Composition of total tourist development taxes low’ (> 1,000 - 10,000 cells/L), ‘low’ (> 10,000 - 100,000
collected in Southwest Florida counties, 2007 - 2017 average. cells/L), ‘medium’ (> 100,000 - 1,000,000 cells/L) and
Data Source: 2007 - 2017 Florida Visitor Reports, VISIT ‘high’ (> 1,000,000 cells/L). When cell abundance is equal
FLORIDA. to or exceeds 5,000 cells/L (‘very low’), there are shellfish
harvesting closures. When a Red Tide event reaches the ‘low’
category, probable effects of the event include respiratory
2017-2019 HAB Events in Florida irritation and fish mortality. Water discoloration is typically
There were two distinct HAB events in Southwest Florida present at ‘medium’ or ‘high’ classifications and the negative
between late 2017 and early 2019 - a Red Tide event that effects become more probable.
occurred between October of 2017 and January of 2019 Figure 11 displays the location of each of the 2018 FWRI
and a blue-green algae event that was observed in Lake data observations with water samples that indicated K. brevis
Okeechobee and the St. Lucie and Caloosahatchee canal concentrations classified as ‘medium’ and ‘high’ denoted
systems in the summer of 2018 (Krimsky et al., 2018). in red. While this particular event began in late 2017 and
ended in early 2019, we have focused on 2018 observations
2017-2019 Red Tide Event
to summarize at an annual level. Water sampling efforts
The Florida Fish and Wildlife Conservation Commission,
occur statewide, but the prevalence of 2018 water
through the Fish and Wildlife Research Institute (FWRI), has
samples indicating ‘medium’ and ‘high’ levels of K. brevis
been monitoring and publishing data on water conditions
concentrations in the Southwest Florida region is obvious,
16 Quantifying the Socio-Economic Impacts of Harmful Algal Blooms in Southwest Florida in 2018with some occurrence in the Panhandle (occurred in late that month. Information for coastal counties outside of the
2018 after Hurricane Michael passed through the region) and Southwest Florida region of interest were aggregated to
along the Atlantic coast. report statistics for the rest of the state, i.e. all other coastal
For the purposes of estimating economic impacts of a counties in Florida. As Figure 12 highlights, the period and
HAB event, it is not only important to know if a Red Tide was intensity of the 2018 Red Tide event varied by county. In Lee
present in significant concentrations at some point in 2018 County, there is a clear peak observed in August, while in
but also the timing and duration of this presence. Figure Charlotte County, the number of tests above 100,000 cells/
12 displays the number of tests above 100,000 cells/L for liter were persistently between 15 and 40 between June
Red Tide (‘medium’ or ‘high’ classifications) in the counties and November, making it difficult to distinguish its peak,
of our Southwest Florida region as well as the share that and in Hillsborough County the Red Tide was practically
those tests represent in the overall number of tests for the nonexistent. It should be noted that these variations could be
region. This figure highlights not only the number of times influenced by how marine water sample tests are assigned
a Red Tide was detected as present during a certain month to counties. In the Rest of Florida, a peak in the number of
in a certain county, but also the size of the points as visible blooms is observed in October, coinciding with the presence
on the figure reflects the ratio of the number of times the of Red Tide observations following Hurricane Michael in
county was tested to have a Red Tide in that month above the Panhandle but the number of tests that revealed a
the threshold level of 100,000 cells/liter and the number severe bloom is significantly less than those observed in the
of times water sample was collected from that county in Southwest region.
Figure 11. Geographical location of 2018 water sample collection and respective cell
count. Data Source: Map generated by authors based on FWRI HAB Monitoring Database.
Quantifying the Socio-Economic Impacts of Harmful Algal Blooms in Southwest Florida in 2018 17Figure 12. Prevalence of 2018 Red Tide in Southwest Gulf Area of Florida counties and the Rest of Florida.
2018 Blue-Green Algae Event sediments caused by Hurricane Irma that impacted the
Blue-green algae are naturally occurring in Lake region in September 2017, a blue-green algae event was first
Okeechobee. The lake’s subtropical location, shallow waters, observed by satellite imagery from the National Oceanic and
and history of nutrient enrichment via human activities Atmospheric Administration’s National Ocean Service
contribute to favorable conditions for algal growth. (Phlips et (NOAA/NOS) in June 2018 (Krimsky et al., 2018). Figure 13
al. 1993; Havens et al. 1994; Flaig and Havens 1995, Havens displays the cyanobacteria concentration measurements for
2013; Paerl and Huisman 2008; Krimsky et al., 2018). Lake Okeechobee in 2018, estimated from satellite-based
Presumably induced by an increased nutrient influx from imagery provided by Copernicus Sentinel-3 data from
throughout the watershed, delivered by record-setting EUMETSAT.
rainfall in May 2018, and the resuspension of nutrient-rich
18 Quantifying the Socio-Economic Impacts of Harmful Algal Blooms in Southwest Florida in 2018You can also read


