Beyond Petrostates The burning need to cut oil dependence in the energy transition
←
→
Page content transcription
If your browser does not render page correctly, please read the page content below

Beyond           arbon Tracker
                           Initiative

Petrostates
The burning
need to cut
oil dependence
in the energy
transition

February 2021
Beyond Petrostates

    About Carbon Tracker
    The Carbon Tracker Initiative is a team of financial specialists making climate risk real in today’s capital
    markets. Our research to date on unburnable carbon and stranded assets has started a new debate on how
    to align the financial system in the transition to a low carbon economy.

    www.carbontracker.org            |   hello@carbontracker.org

    About the Authors
    Mike Coffin – Senior Analyst
    Mike joined Carbon Tracker in 2019, and is currently focussing on identifying transition risk within the oil
    and gas industry as the global energy system evolves. He has co-authored reports to assess impacts at the
    company level, including Breaking the Habit/Fault Lines and Balancing the Budget, alongside writing on
    company climate ambitions in Absolute Impact. Other research themes include executive remuneration and
    verification of company actions.
    Prior to joining Carbon Tracker, Mike worked as a geologist for BP for 10 years on projects across the
    upstream, from early access to development.

    Axel Dalman – Junior Analyst
    Axel works in the Oil, Gas & Mining team as a junior analyst. He is currently responsible for the team’s
    research on executive remuneration and also co-authored the report Pipe Dreams which dealt with Canadian
    oil sands pipelines.
    Prior to joining in 2020, Axel worked at Fitch Solutions as a senior country risk analyst focused on the Middle
    East, advising senior corporate decisionmakers on macroeconomic and political risk.

    Andrew Grant – Head of Climate, Energy & Industry Research
    Andrew co-leads Carbon Tracker’s research, with a focus on content and methodologies across the team. He
    joined Carbon Tracker in 2014, leading research on oil & gas and coal mining, and has authored a number
    of Carbon Tracker’s major reports on these sectors.
    Prior to joining Carbon Tracker, Andrew formerly worked at Barclays Natural Resources Investments, a private
    equity department of Barclays that committed capital across a range of commodities and related industries.
    Andrew has previous experience in remuneration and corporate governance at Barclays Capital and New
    Bridge Street LLP.

    Acknowledgements
    The authors would like to thank Kingsmill Bond, Mark Fulton, and Catharina Hillenbrand von der Neyen for
    their inputs. Report design and typeset by Margherita Gagliardi (Carbon Tracker).

2
www.carbontracker.org

Table of Contents

 4    Key Findings

 6    Executive Summary

 11   Preface: Equity and Policy in Mitigating Impacts

 11   The challenges facing fossil fuel-reliant economies
 13   Domestic policy actions
 15   International actions

 17   Introduction
 18   Carbon Tracker’s Least Cost Approach
 20   A note on Covid-19

 21   Global Implications of Lower Demand

 29   Impact at the Country Level
 29   Identifying the petrostates
 31   Potential revenue shortfall
 32   Vulnerability
 35   Impact on populations

 37   Fiscal Flexibility

 42   Considerations and Recommendations

 44   References

 46   Appendix I: Methodology

 49   Appendix II: Additional Results

                                                                                    3
Beyond Petrostates

    Key Findings

In this report we explore the impact on oil      Bahrain, Timor-Leste, Equatorial Guinea,
and gas-producing government revenues            Oman and South Sudan.
as the world moves away from fossil fuels.
The results illustrate the challenges facing         Over 400 million people live in the 19
hydrocarbon-dependent countries, and             most vulnerable countries (tiers 4 and 5); six
highlight the need for urgent policy action to   petrostate and four “emerging petrostate”
help mitigate the impacts.                       countries are already considered as having
                                                 low human development by the UN.
    Lower fossil fuel demand and prices
will have significant implications for fiscal        The petrostates are already at
sustainability in oil and gas-producing          historically high levels of indebtedness, but
countries.                                       differ in their financial position and ability
                                                 to respond to these changes. Some have
   Under a low carbon scenario,                  significant sovereign wealth funds while
combined global government oil and gas           access to credit varies drastically.
revenues worldwide could be $13 trillion
lower than expected (51% less) over the             We      highlight   important     policy
next two decades compared with business-         considerations to mitigate this impact:
as-usual expectations of continued growth in
demand and firm long-term oil prices.            •   It is in everyone’s interests to minimise
                                                     global temperature rise.
    The 40 petrostates could see a gap of
$9 trillion vs expectations; 50% of these        •   Petrostates will need to act now to
countries face a shortfall of over half of           transition away from a dependence
their hydrocarbon revenues in the next               on fossil fuel revenues. Propping up a
20 years under a low-carbon outcome, as              failing oil and gas industry has huge
both national oil company (NOC) earnings             opportunity cost.
and taxation receipts fall. The most oil and
gas-reliant countries (as a % of GDP) are        •   Further, the international community
predominantly in the Middle East, North and          has strong incentives to support this
West Africa and South America.                       journey. We summarise potential policy
                                                     options available in the context of the
    We produce an indicator of overall               “just transition”.
fiscal vulnerability to revenue stranding
by combining potential oil and gas revenue       •   Petrostates face a prisoner’s dilemma
shortfall with current dependence on                 – collective supply restraint helps avoid
hydrocarbon revenues (% of total revenues            oversupply and support prices, but
from oil and gas).                                   states individually will want to maintain
                                                     or boost production. A disorderly
   Tier 5 (most vulnerable) countries face           transition may lead to even greater
an overall potential revenue shortfall of            government revenue shortfalls.
over 40%, including Angola, Azerbaijan,
4
www.carbontracker.org

 Image Credit: WORKSITE Ltd.

                          5
Beyond Petrostates

     Executive summary

Highlighting the need for                                    The energy transition will
accelerated policy action                                    reduce government revenues
                                                             from oil and gas…
The adverse physical implications of
climate change are known to weigh most                       All else being equal, as demand falls,
heavily on the world’s poor and less                         fewer oil and gas projects will need to be
developed communities, with poverty and                      incentivised to supply the market, cutting
disadvantage increasing for those countries                  long-term prices compared to assumptions
least able to bear it as the world warms. This               of continued demand growth. Hence, both
humanitarian dimension provides one of the                   lower volumes and prices affect government
key imperatives for the global community to                  revenues from National Oil Companies
act to prevent climate change.                               (NOCs) and private sector taxes/fees.

However, such a fundamental shift as                         To understand the implications, we use the
decarbonising the world economy will                         IEA’s Sustainable Development Scenario
involve trade-offs, in particular for the                    (SDS, 50% chance of limiting warming to
populations of economies that are heavily                    1.65°C) as a low-carbon demand scenario
reliant on fossil-fuel production, which                     and illustratively assume a flat real long-term
face lower government revenues and job                       oil price of $40/bbl1 to model revenues. As
losses. Accordingly, this has led to the                     a baseline proxy for “industry expectations”,
principle of a “just transition”, making sure                we use demand volumes under the IEA’s
that populations are helped to manage the                    Stated Policies Scenario, STEPS, and assume
transition in a way that is fair and equitable.              Rystad Energy’s base case price outlook
These discussions aren’t new of course, but                  ($60/bbl long-term).
the increasing pace and inevitability of the
energy transition means increased urgency.                   …with global revenues falling
In this report we explore the broad impacts                  short of expectations by $13
on government revenues from upstream                         trillion to 2040
oil and gas production using a bottom-up,
least-cost methodology, in order to both lay
                                                             Compared with industry expectations, total
bare the scale of the issue and to highlight
                                                             government revenues would be $13tn lower
the most vulnerable as a call to action for
                                                             over the next two decades under the low-
policymakers and the wider international
                                                             carbon scenario – a 51% drop (Figure 1).
community. We hope that our analysis
                                                             80% of this gap in revenues is driven by
provides a useful data underpin and fresh
                                                             lower prices, rather than lower volumes.
injection of impetus into the development of
decarbonisation pathway that is just for all.

1            The $40/bbl price is illustrative, and based approximately on the marginal breakeven cost of supply under
the IEA’s Sustainable Development Scenario in our analysis.

6
www.carbontracker.org

FIGURE 1. 2021-2040 GOVERNMENT REVENUE UNDER DIFFERENT DEMAND/PRICE
SCENARIOS

 Source: IEA, Rystad Energy, CTI analysis
Notes: Industry Expectations = demand pathways from the IEA’s STEPS scenario, using Rystad Energy’s long-term
price assumption ($60/bbl). Low-carbon = demand pathways from the IEA’s SDS scenario, using a long-term price
assumption of $40s/bbl. MENA = Middle East and North Africa. * 2010-2019 and 2015-2019; averages extrapolated
to 20-year values for comparability.

The impact of reduced                                   TABLE 1. IMPACT OF LOW-CARBON
government revenues varies                              SCENARIO ON OIL AND GAS REVENUES,
                                                        REGIONS – CHANGE VS INDUSTRY
regionally
                                                        EXPECTATIONS

The Middle East and North Africa (MENA)                                              Low-carbon
region outperforms most others in the low-                Region                     vs Industry
                                                                                     expectations
carbon scenario due to its production cost
advantage, but low prices mean it still                            Asia                        -57%
experiences average future revenues over
                                                                  Europe                       -50%
40% lower than over the downturn of the past
five years (2015-2019), and significantly                         MENA                         -43%
lower than levels of the past decade.
                                                                   Africa                      -58%

                                                           Lat. Am. & Caribbean                -66%

                                                                 Oceania                       -30%

                                                              North America                    -77%

                                                        Source: IEA, Rystad Energy, CTI analysis

                                                                                                           7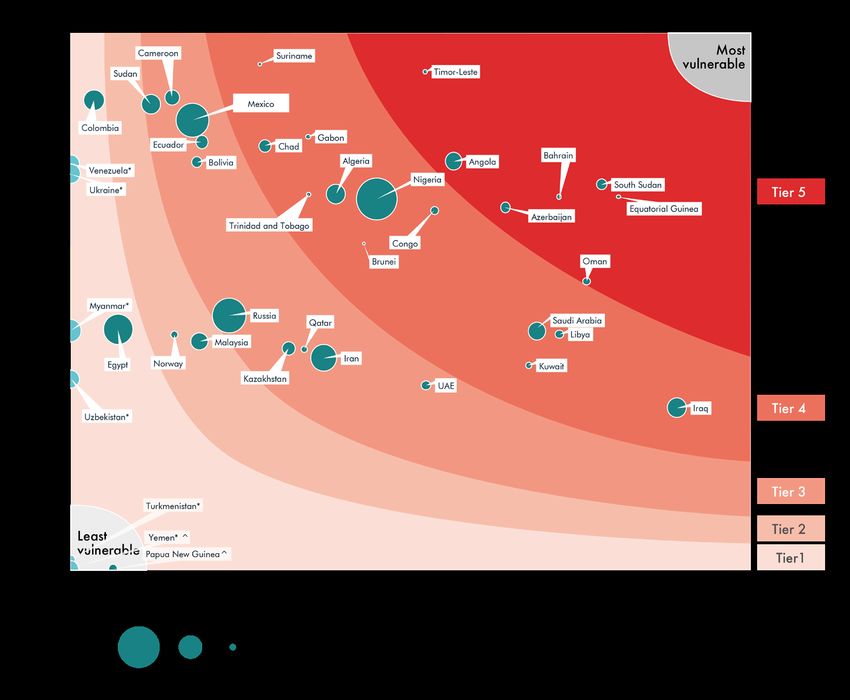
Beyond Petrostates

Petrostates’ fiscal budgets vary                            quantifying the potential shortfall under a
in vulnerability                                            low-carbon scenario vs revenue levels over
                                                            the past decade. Combining dependence
We focus on the 40 countries with the                       with % of average potential oil and gas
greatest fiscal dependence on oil and gas                   revenue shortfall under the low-carbon
revenues (“petrostates”); for this group, the               scenario allows us to group the petrostates
revenue gap under a low-carbon scenario                     by vulnerability tier (Figure 2) based on the
is $9 trillion (46%) vs industry expectations.              percentage shortfall in overall government
                                                            revenues.
Given these countries’ fiscal budgets
presently rely heavily on oil and gas                       We identify seven countries within our highest
revenues, our analysis primarily focuses on                 vulnerability tier (potential government

FIGURE 2.VULNERABILITY OF PETROSTATES TO LOW OIL AND GAS DEMAND AND
POPULATION SIZE

Source: Rystad Energy, IMF, IEA, SSB (Norway), CBL (Libya), CBI (Iran), CTI analysis
Notes: Vulnerability = potential total government revenue shortfall [multiplication of axes] over 2021-2040. Tiers
roughly equate to a shortfall of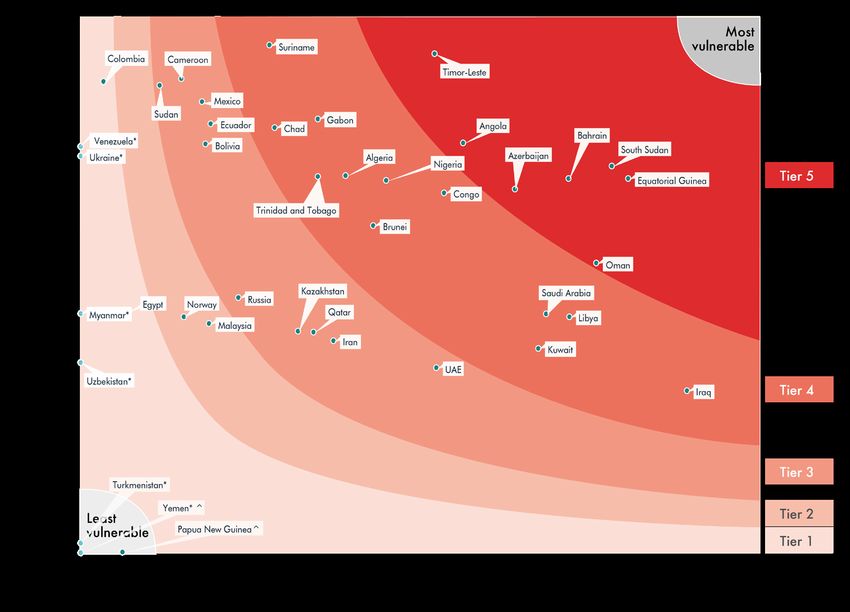
www.carbontracker.org

revenue shortfall of over 40%): Angola,           have investment-grade credit ratings, giving
Azerbaijan, Bahrain, Timor-Leste, Equatorial      the potential to raise significant capital
Guinea, Oman and South Sudan.                     through debt markets.

“Emerging petrostate”                             Others who lack these options will need
revenues fall far short of hopes                  to be even more proactive at reducing
Some countries looking to expand their            spending, raising new taxes and diversifying
nascent oil and gas industries (e.g. Guyana,      their economies – but less firepower to do so
Senegal) do still experience some production      suggests a greater need for external support.
growth compared with today. Of the six
countries reviewed in this document, four         Interest for the petrostates to
will see future revenues halve under a low-       transition successfully
carbon scenario relative to expectations,
whilst the other two are reliant on domestic      While the physical consequences of climate
gas demand. These countries should                change may affect individual countries
therefore be wary in long-term fiscal             differently, it remains in the collective
decision-making as the world transitions          interests of all nations to seek to minimise
away from fossil fuels.                           global temperature rise and mitigate some
                                                  of the potential results, some of which may
A significant population                          have effects cross-border.
is affected, with many
countries having already low                      Similarly, the entire international community
development levels                                has reasons to want the petrostates to
                                                  navigate the transition successfully on an
                                                  economic basis, whether due to equity, better
Over 400 million people live in the 19
                                                  climate outcomes, or preventing potential
countries in Tiers 4 and 5 (which could lead
                                                  instability.
to a potential shortfall over 20% of current
government revenues). Six of the petrostates,
and four of the emerging petrostates, are         Diversification solutions and
currently categorised as “low” in the United      support can take many forms,
Nations Human Development Index.                  both at home…

Indebtedness is historically                      As success with climate goals will inevitably
high; ability to respond varies                   mean the use of less fossil fuels, producer
by country                                        governments must recognise this issue
                                                  and act now to reduce reliance on income
                                                  streams that will dwindle over time. This will
Average petrostate central government debt
                                                  likely require more sustainable fiscal policy,
nearly doubled from 24% of GDP in 2010 to
                                                  tax reforms, development of other domestic
46% in 2018.
                                                  industries, or all of the above. Avoiding
                                                  addressing the issue until oil consumption is
Savings in the form of sovereign wealth
                                                  declining will be leaving it far too late.
funds (e.g. Brunei, Kuwait and the UAE) will
mitigate risks for a handful of countries in
                                                  Encouragingly, the low oil price environment
the short-term, but significant reform will
                                                  of the last five years has already incentivised
still be critical over the next decade to avoid
                                                  some to make tentative first moves on fiscal
exhaustion. These countries also tend to
                                                  diversification. Several of the Middle Eastern

                                                                                               9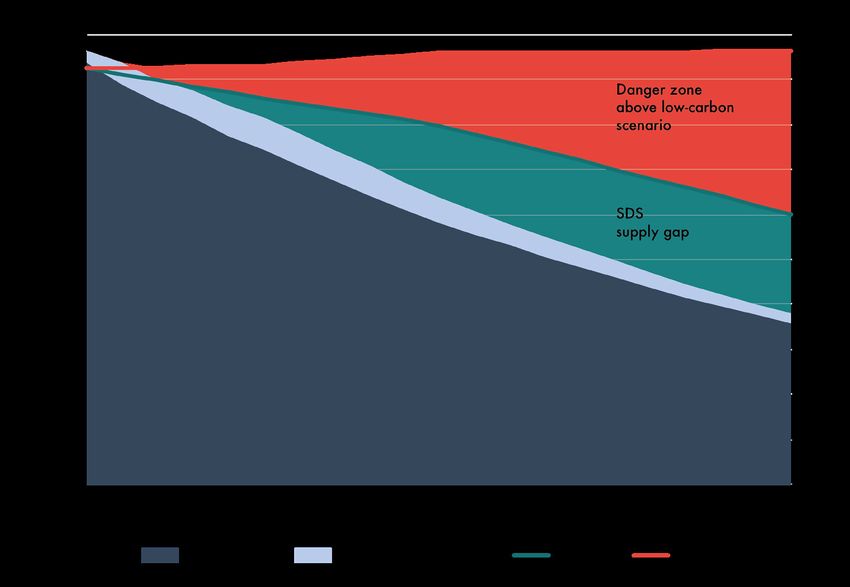
Beyond Petrostates

GCC2 states have introduced measures such              The petrostates would benefit
as value-added taxes and (with others like             from an orderly transition, but
Nigeria, Angola and Iran) reduced subsidies,           face the prisoner’s dilemma
particularly on consumer fuels, which both
reduces state spending and disincentivises
                                                       As above, price impacts dominate the
inefficient fossil fuel consumption.
                                                       financial implications of lower fossil fuel
                                                       demand. Accordingly, petrostates collectively
Petrostates are also actively supporting their
                                                       benefit from an orderly wind down of
non-oil sectors to build new tax, job and
                                                       production where global supply is lowered
foreign currency engines. Examples include
                                                       in tandem with demand, giving prices some
GCC government investments into industries
                                                       support and minimising revenue losses.
like renewable energy3 and tourism4 and a
$1.6bn deep-sea port in Nigeria5.
                                                       However, countries may be tempted act in
                                                       their own interests and seek to monetise
…. And abroad                                          their reserves rapidly, even though loss of
                                                       discipline across industry would destroy value
Helping petrostates accelerate these                   for all and represents a further downside risk
transitions is an area where the international         beyond the results in this report. International
community can offer support to the most                cooperation between oil producers will likely
vulnerable, especially those with already              be hard to maintain with demand falling
disadvantaged populations and a limited                continuously, and even the Paris Agreement
capacity to respond. This might be through,            has no mention of co-ordinated action on
for example, supporting the development                the supply side of fossil fuels.
of new technologies, providing capital to
accelerate their deployment and providing              States will therefore need to show restraint
support for regulatory and tax reform.                 in their fossil fuel investments, whether
                                                       through the direct sanction of NOC projects
                                                       or activities which encourage private
                                                       investment.

2         Gulf Cooperation Council: Saudi Arabia, the UAE, Kuwait, Qatar, Oman and Bahrain.
3         https://www.dewa.gov.ae/en/about-us/media-publications/latest-news/2019/03/mohammed-bin-rashid-
al-maktoum-solar-park
4         https://www.theredsea.sa/en
5         https://lekkiport.com/about-lekki-port-lftz-enterprise/the-port/

10
www.carbontracker.org
Preface: Equity and Policy in
Mitigating Impacts
The challenges facing foreign instability with attendant issues of
refugees, extremism and so on. Reduced
fossil fuel-reliant fossil fuel use will also lead to improved air
economies quality, particularly in densely populated
cities.
Climate change will make hard
lives harder Decarbonisation will bring its
own challenges, particularly for
The adverse physical implications of climate fossil fuel-producing nations
change are known to weigh most heavily
on the world’s poor and less developed However, such a fundamental shift as
communities, with poverty and disadvantage decarbonising the world economy will involve
increasing for those countries least able to trade-offs, and these will be felt differently in
bear it as the world warms6. Water stresses, different parts of the world. Accordingly, this
sea level rise, food insecurity, population has led to the principle of a “just transition”,
displacements – all are examples of the making sure that populations are helped
impacts that are likely to fall hardest on to manage the transition in a way that
poorer communities, such as agricultural is fair and equitable8. The populations
and coastal societies, Indigenous people, of economies that are heavily reliant on
children and the elderly, and urban dwellers fossil-fuel production are perhaps the most
in African cities. Furthermore, these are obvious example where the transition will
risks that are arise even under the 1.5°C also have some negatives, for example
level at the most ambitious end of the Paris lower government revenues and job losses.
Agreement goals, while the impacts become Decisive and forward-looking policies will
ever greater should warming continue to be required to prevent and mitigate these
increase through to 2°C or above7. impacts, both on the part of domestic and
overseas authorities.
This humanitarian dimension provides
one of the key imperatives for the global The desirability of economic diversification
community to act to prevent climate change away from fossil fuels in reducing poverty is
– whether that is for the altruistic purpose clear even in normal times given the volatility
of making life better for others, and/or a and boom-bust nature of the oil market,
more inward-looking rationale of preventing an issue that has been made even more
6 “Poverty and disadvantage are expected to increase in some populations as global warming increases;
limiting global warming to 1.5°C, compared with 2°C, could reduce the number of people both exposed to climate-
related risks and susceptible to poverty by up to several hundred million by 2050 (medium confidence)”
IPCC, Special Report on Global Warming of 1.5°C, Summary for Policy Makers. Available at https://www.ipcc.ch/sr15/
7 IPCC, Special Report on Global Warming of 1.5°C,Chapter 5. Available at https://www.ipcc.ch/sr15/
8 See for example Nick Robins and James Rydge, “Why a just transition is crucial for effective climate action”
Available at https://www.unpri.org/inevitable-policy-response/why-a-just-transition-is-crucial-for-effective-climate-
action/4785.article
11Beyond Petrostates
obvious repeatedly in recent years. The long- fewer financial resources, weaker institutions,
term nature of the energy transition adds a and a lower level of non-fossil fuel domestic
new and inexorable importance to making industry, this raises the importance of
this shift – officials won’t be able to hope international support in making the journey.
for mean reversion or a new boom being
around the corner.
Highlighting the need for
No “one-size fits all” solution accelerated policy action
However, the means of doing so is a These discussions aren’t new of course, but
complex and challenging topic, and the increasing pace and inevitability of the
different countries will have varying needs, energy transition means increased urgency.
options available to them, and impediments In the same way that decades of inaction
to making the required changes. on emissions have resulted in the need for
a sharper bend in the emissions trajectory,
Some wealthier Gulf states, conscious of so efforts to find solutions to cushion the
these issues looming large, have developed landing for vulnerable populations will have
plans to restructure fiscal regimes, diversify to be accelerated to make up for lost time.
their economies through foreign direct In this report, we examine the impact on
investment, and develop domestic industries. the government revenues of oil and gas-
Examples include Saudi Arabia’s Vision 2030 producing states in order to both lay bare
strategy, and Qatar’s National Vision 2030 the scale of the issue and to highlight the
and Economic Diversification and Private most vulnerable as a call to action for
Sector Development strategy9. Indeed, they policymakers and the wider international
may also have significant resources for community. We emphasise that our analysis
renewable energy deployment – although isn’t based on those countries making
it has faced a number of difficulties so far, unilateral sacrifices of production, but rather
Saudi Arabia has a goal of producing 50% represents the results of a market-based
of its electricity from renewables by 203010. framework where actions to reduce fossil
use in different countries result in lower
For many other countries, and in commodity prices globally.
particular those that already have more
disadvantaged populations, finding a low Given that the need for policy action has
carbon development pathway that increases been long recognised and debated, there
prosperity while fossil fuels are left untapped are a range of options already on the shelf.
– or become a reduced source of income – As analysts rather than policy experts we
will require a comprehensive suite of actions note some of these here to highlight pre-
to be put in place11. However, history shows existing work on the topic and that a range
that in practice making such changes is of potential solutions have been proposed,
difficult. As options will be fewer and the rather than to express preferences on the
road harder for some countries than others, most desirable or likely pathways – these are
perhaps starting from a position of having best in the hands of those better qualified
9 See for example Oxford Business Group, “Qatar doubles down on economic diversification”
Available at https://oxfordbusinessgroup.com/analysis/determined-diversify-country-has-doubled-down-its-drive-
broaden-its-economic-bases-and-increase
10 Vinod Sekhar, “Saudi Arabia Vision 2030: Solar energy can complement, not rival, oil and gas”, Arab
News July 2020. Available at https://www.arabnews.com/node/1708961
11 See for example Iseoluwa Akintunde, “Nigeria’s Recovery Means Rethinking Economic Diversification”,
Chatham House August 2020. Available at https://www.chathamhouse.org/2020/08/nigerias-recovery-means-
rethinking-economic-diversification
12www.carbontracker.org
than us. However, we hope that our analysis significantly more businesses and income
provides a useful data underpin and fresh earners on the tax roll) and levying new
injection of impetus into the development taxes. These constitute a large potential
of decarbonisation pathway that is just and source of revenue that petrostates have not
equitable for all. properly tapped, thanks to the cushioning
effect of resource revenues. For instance,
Domestic policy actions Mullins, Gupta & Liu suggest a range of
specific tax reform options that low-income
countries can implement, such as scrapping
The results of this study imply that many oil inefficient tax incentives, improving VAT
and gas producing nations will face future efficiency (or indeed, levying VAT in the first
government revenues much lower than they place) and boosting progressive taxation.13
might have expected based on history, and
their leaders will have a crucial role to play Tentative steps in this direction have been
in minimising the damage imposed on their taken in some of the GCC states over the
populations. past few years, with the imposition of VAT
ranging from 5-15% and various excise
The World Bank’s recent book on this topic, taxes. Developed countries will likely need to
authored by Peszko et al., offers a helpful provide more technical assistance to lower-
set of five elements to frame the discussion income, more vulnerable countries to enable
about what petrostate governments can them to embark on similar tax reforms.
do domestically to diversify and which we
reference and broadly use as a framework 2. Create incentives and medium-to-
here.12 Its study covers both upstream and long-term public expenditure frameworks
downstream, so we have adapted their to reinvest the fiscal take of fossil fuel
suggestions slightly to fit the scope of our revenues in a diverse range of assets
upstream-only report.
Creating robust institutional frameworks for
1. Increase the fiscal take of resource long-term investment is crucial. Countries
revenues and reduce public revenue risks that do not already have sovereign wealth
funds (SWFs) may want to create them,
Some governments, blessed with oil and drawing on best practices from peers.14
gas resources that are cheaper to extract, Many existing SWFs will also need to be
have the flexibility to adjust fiscal regimes repurposed to not just act as temporary fiscal
(taxes and fees) to capture more revenue buffers during commodity-price downcycles,
from wellhead cash flows. Doing so could but as domestic investment vehicles formally
effectively be seen as a wellhead carbon separated from ordinary budget operations.
tax; however, countries may conversely be This could include creating several separate
tempted to lower taxes to compete for supply funds serving different purposes. For
in a race to the bottom. instance, Oman operates multiple SWFs,
dividing up its savings into domestic long-
Petrostate policymakers will also need term investments and liquid, diversified
to focus on exploring new sources of tax assets intended for fiscal smoothing.15
revenue by formalising and expanding
the non-fossil fuel economy (i.e., getting
12 Peszko et al. 2020, Chapter 6
13 Mullins, Gupta & Liu 2020
14 Al-Hassan, Brake & Papaioannou 2018
15 Base prospectus from October 2020 bond issuance, available at https://www.rns-pdf.
londonstockexchange.com/rns/4566D_1-2020-10-28.pdf
13Beyond Petrostates
Freeing up more revenues for savings and will need to go beyond just fiscal reform –
investment will of course also require difficult petrostates will also need to actively nurture
spending cuts. All the petrostates have non-oil industries to create bigger tax bases
already been faced with this challenge since and reduce the need to maintain large
the oil price collapse in late 2014, and again public wage rolls. A foundational factor
in 2020 with the renewed price collapse for enabling such industries is institutional
brought about by Covid-19. Unfortunately, quality, such as low levels of corruption
petrostate fiscal policy tends to be procyclical and red tape.18 Petrostate governments
– when prices recover and revenues rise, therefore need to identify areas where the
spending does too, reversing some of the business environment may be a hindrance
cuts made during the downcycle. to investment and innovation, for instance
with reference to the World Bank’s Ease
Going forward, governments will need to of Doing Business indicators.19 In addition
take a much longer-term view on public to removing negative constraints on their
finance management. This could mean economies, governments will also want to
instituting binding medium-term spending consider investing more heavily in human
targets that are adhered to regardless of oil capital to foster greater innovation.20
prices, as well as rethinking big-ticket items
like subsidy schemes and public wage bills.16 As Peszko et al. suggest, it may also be the
These are doubtlessly politically difficult but, case that the state needs to take a more
encouragingly, several petrostates have cut active “entrepreneurial” role in supporting
subsidies in recent years, including the GCC the development of new sectors where a
countries, Iran, Nigeria and Angola. country may have a competitive advantage,
but where uncertainty discourages private
3. Create regulatory incentives investors from committing capital. Again,
to minimise irreversible capital-intensive SWFs with the specific mandate of investing
investments in further oil and gas domestically can help overcome these
infrastructure barriers, so long as governments are careful
not to crowd out potential private sector
Governments also need to reassess how they participants.
allocate their remaining oil and gas revenues
over the coming decades. Crucially, national 5. Manage the politics of the
oil companies should be steered away from transition and established vested interests
reinvesting their earnings into new high-cost
projects that may end up wasting public Of course, meeting the policy challenges
money, an issue explored in greater detail above is contingent on the successful
by Manley & Heller.17 Freed-up capital could navigation of countries’ current political
instead be directed into public investment economies, for example vested interests that
funds that support the non-oil economy. benefit from existing arrangements and will
resist attempts at structural reform. Clearly,
4. Address innovation policies and this problem is not unique to oil and gas
the role of the state exporters, but it is particularly complex given
the scope of the reforms needed.
Diversification away from oil and gas
16 Danforth, Medas & Salins 2016
17 Manley & Heller 2021, forthcoming
18 Gelb 2010
19 www.doingbusiness.org
20 Gelb 2010
14www.carbontracker.org
One important aspect of overcoming these Third, weaker petrostates could become less
barriers is to create buy-in for reforms from stable – with impacts beyond their borders
the wider population. Revenues not invested – either because of social unrest as a
in new fossil fuel projects, or redirected from response to fiscal consolidation, or because
inefficient subsidies and tax exemptions, under-funded security services fail to contain
should be clearly earmarked for uses that existing militant threats. Coupled with other
have a positive impact on peoples’ day-to- economic challenges, there may also be
day lives, especially the poor. Infrastructure increased migratory flows.
investments, greater spending on health
and education and targeted transfers to The role of international
low-income earners are all policies that cooperation
could help build political capital for more
contentious reforms. The international community can take
several different approaches to addressing
At the same time, in order to maintain these issues. Bilateral aid is one component
political support, governments must take – but likely only for the poorest countries,
care not to let the readjustment burden fall and only where it has the greatest impact, in
disproportionally on the poor, for instance line with accumulated experience from aid
by balancing regressive taxes (e.g. VAT) programmes over the past several decades.21
with progressive ones (e.g. income / capital ,22
Technical assistance – for instance,
gains). Issues of equity in the transition apply helping countries design and implement
within countries as well as between them. new tax systems – is of greater importance,
since petrostates need sustainable, long-
International actions term fixes. These efforts are already taking
place, particularly under the auspices of IMF
There are also strong reasons for overseas and World Bank programmes, but they need
economies to support domestic authorities to be accelerated.
in overcoming these challenges, echoing the
humanitarian reasons for mitigating climate Aside from targeted fixes, the scale of the
change above. challenge raises the question of whether a
bigger, multilateral effort is also needed.
First, many will feel a strong moral imperative. This may seem like a return to the hard-
Our results show that many of the countries to-negotiate issue of systematic transfers
set to suffer the most from revenue losses between developed and developing
are also the poorest. In some cases they also countries. However, where in the past these
have large and rapidly growing populations, debates focused on assigning responsibility
for example in Nigeria and Angola. for historical emissions, the narrative is now
slowly shifting towards sharing the gains of
Second, helping other economies shift away the energy transition. This possibility has
from a fossil fuel-basis may lead to lower been raised as part of emerging supply-
emissions and better climate outcomes to side initiatives like the Fossil Fuel Non-
the benefit of all, by easing the path of both Proliferation Treaty.23 Its proponents argue
domestic decarbonisation and international capital raised through policies like carbon
target-setting. taxes and fossil fuel subsidy cuts could be
pooled into a so-called Global Transition
Fund, which is then used to help fossil-fuel
21 Kenny 2021
22 McKee et al. 2020
23 https://fossilfueltreaty.org/
15Beyond Petrostates rich countries transition to low-carbon alternatives.24 Alternatively, the World Bank (Peszko et al.) suggests a more bilateral option in which petrostates agree to levy wellhead carbon taxes in exchange for importer countries avoiding border carbon taxes, with the revenues shared between both parties. Any of these policies are clearly challenging to design and implement, but offer options for the path forward. 24 Newell & Simms 2020 16
www.carbontracker.org

     Introduction

Success under climate goals will                           Whether or not individual countries are
mean less oil and gas use                                  concerned by the physical risks of climate
                                                           change, the fact remains that changes in
Global temperatures are driven by the                      commodity demand anywhere in the world
cumulative stock of greenhouse gases in                    impact global market dynamics. Lower
the atmosphere, meaning that for them to                   global demand and prices will lead to lower
stabilise – at any level, whether 1.5°C or                 oil and gas revenues for the governments
“well below 2°C” under the Paris Agreement,                of producing nations. The countries most
or higher – worldwide carbon emissions will                reliant on those revenues – the petrostates –
need to reach zero on a net basis. Whether                 could experience major negative economic
the catalyst is out-competition by renewables,             effects if they do not anticipate this and take
government policy, changing behaviours, or                 mitigating actions well in advance.
all three, the impact to oil and gas producers
is the same: reduced demand and lower                      In this report we explore the broad impacts
prices for their products.                                 on government revenues from upstream
                                                           oil and gas production in order to both lay
                                                           bare the scale of the issue and to highlight
The energy transition to a low-
                                                           the most vulnerable as a call to action for
carbon world will impact states                            policymakers and the wider international
as well as investors                                       community.

Over the last decade Carbon Tracker                        This means answering some key questions:
has produced a series of reports looking
at the financial impact of this dynamic,                   •     Which countries have the greatest
highlighting the risks to fossil fuel producing                  potential shortfall of oil and gas
companies for investor audiences.25 Over                         incomes/rents through the energy
this period, wider recognition of these issues                   transition?
has led to significant recent changes in                   •     How dependent are countries on these
corporate positioning, with new “climate”                        oil and gas incomes?
strategies announced, project portfolios                   •     Together, which countries are most
re-assessed in light of downwardly revised                       vulnerable to reduced oil and gas
long-term commodity price assumptions,                           demand?
and significant impairments.26                             •     What are the implications for these
                                                                 countries in terms of resilience and
However, the transition will also have                           their ability to adapt to significant
significant impacts for nation states – the                      revenue losses?
focus of this report.

25          See Carbon Tracker, “Fault Lines: How diverging oil and gas company strategies link to stranded asset
risk”, October 2020. Available at https://carbontracker.org/reports/fault-lines-stranded-asset/
26          Bp, Chevron, ConocoPhillips, Eni, Repsol Shell and Total; Carbon Tracker Analysis, as published here:
https://www.theguardian.com/business/2020/aug/14/seven-top-oil-firms-downgrade-assets-by-87bn-in-nine-months

                                                                                                              17
Beyond Petrostates
Carbon Tracker’s least-cost with our use of STEPS as an appropriate
proxy for countries’ present views of future
approach oil demand.32 Later in the report, we also
compare low-carbon revenue against
We approach this issue using the same least- revenue in the last five years (2015-2019,
cost framework as in our reports on company also referred to as “current revenues”
stranded asset risk – see the methodology through the report) to show the scale of
document that accompanies Breaking the the readjustment for fossil fuel-dependent
Habit27, updated in Fault Lines.28 countries from the levels they are currently
accustomed to. On average, current
To understand the impact that the energy revenues are approximately on par with
transition could have on both future project STEPS; see the next section for more detail.
viability and incomes for companies and
governments, we consider demand under a As existing production declines,
low-carbon world using scenarios from the demand is met first from the
International Energy Agency (IEA). lowest cost projects
Oil demand falls rapidly under These demand levels are compared to supply
a well below two degree data using Rystad Energy’s UCube. Our
scenarios model treats oil as a single global market,
along with four regional gas markets (North
The low-carbon demand scenario used in this America, Europe, Russia and Australia) and
report is the IEA’s Sustainable Development global LNG. Gas produced for consumption
Scenario (SDS, 50% likelihood of limiting outside of these markets is modelled as
warming to 1.65°C).29,30 As a proxy for going ahead irrespective of the scenario
industry expectations of future demand levels under consideration, and so production
when looking at global results, we take the volumes do not change; consequently, our
IEA’s Stated Policies Scenario (STEPS, 2.7°C assessment of the reduction in gas demand
warming by 2100).31 under a low-carbon scenario is likely to be
conservative.
Figure 3 shows a comparison of these
two scenarios for oil, with demand falling Figure 3 shows Rystad Energy base-case
increasingly rapidly to 2040 under the low- future production from existing fields
carbon scenario (and beyond), whereas (including those under development) for
demand continues to rise under STEPS. We liquids out to 2040 alongside the demand
note that OPEC forecasts a similar rise in pathways; the resultant supply gap under
oil demand from 2021 to 2040, consistent low-carbon demand levels (SDS) is less
than half of that under projections based
27 See Carbon Tracker, “Breaking the Habit: Methodology”, September 2019. Available at https://
carbontransfer.wpengine.com/wp-content/uploads/2019/09/Breaking-the-Habit-Methodology-Final-1.pdf
28 See Carbon Tracker, “Fault Lines: How diverging oil and gas company strategies link to stranded asset
risk”, October 2020. Available at https://carbontracker.org/reports/fault-lines-stranded-asset/
29 The IEA models the SDS emissions trajectory to 2050, and notes that if this trajectory is extrapolated
beyond this point it would result in net zero emissions in 2070. If emissions are assumed to stay at zero thereafter, the
IEA concludes this would result in a 66% chance of limiting warming in 2100 to 1.8°C, or a 50% chance of 1.65°C.
30 In our company analysis, we have also considered the impacts of the IEA’s B2DS scenario (1.6°C warming
outcome in 2100) and the P1 (1.5°C, very limited carbon capture and storage) and P2 (1.5°C, some carbon capture
and storage) scenarios from the Intergovernmental Panel on Climate Change (IPCC).
31 The Stated Policies Scenario was renamed from the New Policies Scenario in the 2019 World Energy
Outlook.
32 OPEC World Oil Outlook 2020
18www.carbontracker.org
FIGURE 3. GLOBAL OIL DEMAND (2020-2040) UNDER LOW-CARBON SCENARIO (SDS) AND
BUSINESS AS USUAL (STEPS), ALONGSIDE FUTURE SUPPLY FROM SANCTIONED ASSETS
Source: IEA, Rystad Energy, CTI analysis
Notes: Adapted from Figure 11 in “Fault Lines” (October 2020) to incorporate updated demand scenarios from the
2020 World Energy Outlook for SDS and STEPS.
on current policy announcements (STEPS). from the Intergovernmental Panel on Climate
Consequently, if new projects are sanctioned Change (IPCC), implies no space for any
based on expectations of business-as-usual new projects.33 The IEA’s recently released
demand, they may be outcompeted for Net Zero Emissions 2050 scenario similarly
limited demand under lower price conditions has oil demand falling at a rate where it
by lower cost projects, failing to deliver the would be satisfied by continued investment
hoped for returns as a result – becoming in existing fields alone.
“stranded”.
Aggregating the impacts at a
We use a cost curve approach to understand country level
the merit order of unsanctioned potential
project options, and which fit within a given Having identified those projects that fall
level of demand based on each asset’s within (or outside) a given scenario, they
breakeven costs. can then be aggregated to understand the
impact to different parties – at the country
We note that if a 1.5°C scenario is chosen, level in this analysis. See next section for
rather than SDS or STEPS, then this means more details of the different revenue streams
commensurately lower space for fossil fuel included by country.
development. For example, the P1 scenario
33 See Carbon Traker, “Breaking the Habit”, September 2019. Available at https://carbontracker.org/reports/
breaking-the-habit/
19Beyond Petrostates
Finally, and in contrast to our previous capex- This report therefore highlights some of
focused work, we additionally consider the these issues, which we expand further.
impact of changing prices – that is, the price
received for each unit of oil or gas – as well A note on Covid-19
as production volumes on the projected
government revenue streams (see the next
section for further detail). The Covid-19 pandemic has had a
significant impact on global energy markets,
and oil demand in particular, with sharp
Building on a market-focused
volatility in commodity prices. This has been
perspective accompanied by a reduction in project
sanction, with future projects likely also
This report builds on previous literature delayed or in some cases cancelled.
attempting to quantify “stranded revenues”
on a regional and country level.34,35 The We note here that the data used in our
least-cost approach enables us to distribute analysis was collected at different points
volumes on a country level based on a few in time during the crisis, and therefore
simple assumptions; the market effectively reflects differing states of knowledge of the
decides who produces what purely on the implications:
basis of relative economics without any
subjective allocation. • Supply data: Rystad Energy UCube
database as at March 2020.
Naturally, this is not the only way of
approaching the issue. For instance, the • Demand data: International Energy
production gap methodology developed by Agency (IEA) World Energy Outlook
the UN and others36 offers an alternative way published October 2020 (STEPS and
of quantifying excess fossil fuel production, SDS).
and its use of “planned” production levels
has strong parallels to our use of a business- The data therefore does not reflect all of
as-usual/industry expectations scenario. today’s knowledge. However, we continue
Our approach builds on this with a market- to consider the results valid, for reasons
based, bottom-up framework. including the following:
The least-cost methodology gives an • The intent of the analysis is to understand
outcome that is theoretically financially the macro picture over decades, during
optimal globally in terms of supplying the which time there will no doubt be plenty
world’s energy needs as cheaply as possible. of unforeseen events and cyclical market
Ultimately however, the value of the least- changes. This uncertainty is considered
cost methodology is not that it is fair – in our approach. Further, the extent of
rather, it shows where the chips will fall if the the longer-term impact of Covid-19
distribution of fossil fuel production in the remains an unknown and subject to
transition is left to the market, without further much debate.
policy intervention. Particular audiences may
not see these outcomes as equitable and
may see other effects as undesirable, such
as an unwanted concentration of supply.
34 Nelson et al. 2014
35 McGlade & Ekins 2015
36 SEI, IISD, ODI, E3G & UNEP 2020
20www.carbontracker.org
• Our focus is also on the relative impact an annual timescale. The marginal
to countries, which are more likely to costs derived from our analysis (and
hold in times of turmoil than absolute used illustratively in the place of prices
conclusions particularly when all in this analysis) are not forecasts. They
countries are impacted by the same are the theoretical prices needed for
factor. sufficient projects to be developed to
meet a given demand scenario. While
• While oil price moves have been prices may fall, to first order the relative
extreme, we do not seek to make oil cost-competitiveness of projects will
price predictions, and certainly not on remain similar.
21Beyond Petrostates
Global Implications of Lower Demand
To understand the impact that reduced In this section, we first consider the impact
demand will have on overall government that the energy transition will have on
revenues, we need to consider the full range NOCs, and the viability of the project
of payments to national governments from options in their portfolios. We then consider
upstream oil and gas activities. Governments the impact that a scenario of reduced oil and
earn revenues from their fossil fuel resources gas activity will have on overall oil and gas
in two main ways: 1) by investing directly government “revenue” (see box), combining
in their extraction through national oil both elements.
companies (NOCs) and 2) though granting
exploration and production leases and
then taxing the subsequent hydrocarbon
production.
Government Revenue Definition
We define government revenues as the sum of:
1. Publicly-owned share of national oil companies’ (NOC) free cash flow (from both
domestic and foreign investments). These can be from both operated assets, or from
equity stakes in projects operated by others (often through a joint-venture company).
2. Government take (the term used by Rystad Energy to describe all cash flows
destined exclusively to the authorities and landowners), through the principal range of
fiscal tools used37, including:
• Royalties
• Corporate income taxes
• Bonuses
• Withholding taxes
• Resource rent taxes
• Surface rental payments
Note that this differs from oil and gas exports fiscal regimes capture smaller shares of
as a share of GDP. Government revenues do overall rents. Equally, governments can
not necessarily cover the entire economic also capture revenues that accrue abroad
impact of the oil and gas industry, especially through national oil companies’ foreign
in countries where private companies play ventures, whereas exports are geographically
a more significant role upstream or where constrained.
37 NRGI 2016
22www.carbontracker.org
This analysis applies to upstream activities Implicit in this argument of course is that
only; falling oil use will also lead to falling the world will fail the Paris Agreement goals
revenues from other parts of the value chain (otherwise the additional assets would not
which are out of scope including midstream be economic), and it appears to carry an
(e.g. pipelines), downstream (e.g. refineries), element of fear of missing out or “FOMO”.
and retail, but these are likely to be relatively If private sector companies are concerned
small in comparison. about value rather than volume, and see a
prospect of the planet decarbonising, then
NOCs, as well as private sector perhaps they should be content to see others
companies, will be impacted take the risk of investing in the marginal
under lower demand outcomes projects that have a higher likelihood of
being stranded.
A common contention made by private sector Their on-average lower production costs
oil and gas companies is that undue focus mean that under our modelling it is true that
is given to their activities (and emissions), NOCs – and particularly those in the Middle
with NOCs allowed to be effectively let off East – will assume a more prominent role in
the hook with less scrutiny, and reduced global oil and gas supply over the next few
disclosure requirements. The concern is that decades, but they do not come to dominate
the NOCs are able to produce unabated as it. NOC share of production rises from an
the rest of the industry “decarbonises” by average of 55% in 2020 to 64% in 2040 in
reducing output. our analysis, but their production volumes
still fall by 28% (52 to 38 mmbbl/day in
FIGURE 4. LIQUIDS PRODUCTION (2020-2040) UNDER SDS BY PROJECT SANCTION STATUS
FOR BOTH NOCS AND NON-NOCS, SHOWING CHANGING SHARE OF TOTAL
Source: Rystad Energy, IEA, CTI analysis
23Beyond Petrostates FIGURE 5. OIL & GAS PRODUCTION VOLUMES UNDER A LOW-DEMAND SCENARIO (SDS) VS BUSINESS-AS-USUAL (STEPS), LARGEST 20 NATIONAL OIL COMPANIES BY 2019 PRODUCTION Source: Rystad Energy, IEA, CTI analysis Notes: Companies ranked from most-exposed to least-exposed. * 231%. absolute terms) over the next two decades with business-as-usual volume growth (see (Figure 4). “>STEPS” bars in Figure 5). While on average a greater proportion of For the minority of countries where the NOC NOC potential future capex falls within SDS is the dominant upstream player (e.g. KPC compared with private sector companies, in Kuwait) the loss of NOC income will likely stranded asset risk remains very real for have the biggest impact on government NOCs (Figure 5). Of the 20 NOCs shown revenues; for most, however, the loss of tax here, five would need to reduce production receipts as private sector companies reduce by at least 50% compared to a business- activities should be of bigger concern. as-usual scenario. Moreover, all but a few (Basra Oil Company, Saudi Aramco, Qatar Granted, NOCs may view a lower rate of Petroleum and Kuwait Petroleum Company) return as “adequate” compared to private have a significant quantum of project options sector companies and consequently may in their portfolios that are incompatible even 24
www.carbontracker.org

sanction assets that private companies                          1.     STEPS at $base – “Industry
would not, perhaps gaining further market                              Expectations” - Business-as-usual
share. Regardless of whether these assets                              production at Rystad Energy’s base
are technically viewed as “stranded”,                                  case long-term price assumption at
government earnings are still likely to fall                           the time of our data download ($60/
sharply.                                                               bbl)– our proxy for present-day industry
                                                                       expectations of the future.
Lower levels of demand impact
government receipts through                                     2. SDS at $base - Reduced demand
lower prices…                                                      under a low-carbon scenario, using
                                                                   Rystad Energy’s base case assumption
However, a fall in sanctioning activity and                        as in “industry expectations” above to
production volumes still only highlights part                      allow like-for-like comparison.
of the impact of a low-carbon world with
lower oil and gas demand. As we showed                          3. SDS at $40 – “Low Carbon” -
in Handbrake Turn,38 the consequent impact                         Reduced demand under a low-carbon
of lower demand on marginal breakeven                              scenario combined with an illustrative
prices can be very significant. Lower volumes                      future flat real long-term oil price39
will result in lower taxation, but reduced                         assumption of $40/bbl – a price which
volumes combined with lower prices will                            roughly corresponds to the marginal
lead to significantly lower tax take.                              breakeven price for the SDS in our
                                                                   analysis.
The effects of both reduced production
volumes and prices on future global
government revenues over the next two
decades are illustrated in Figure 6, which
shows revenues under three different
scenario and long-term price assumption
combinations:

38           Carbon Tracker analyst note, “Handbrake Turn”, January 2020. Available at: https://carbontracker.org/
reports/handbrake-turn/
39           Implicit within our use of lower oil prices under lower demand scenarios is that gas prices would fall
similarly. Together these two factors could lead to either over- or under-estimation of countries’ exposure to transition
risk, however we believe it is appropriate to include gas within this analysis for a number of reasons. First, if only oil
were considered, countries which have a higher-than-average proportion of revenues from gas could appear to be
more vulnerable to reduced demand under the energy transition; this would be particularly true for those countries
that have deliberately shifted to gas for the medium term as a “transition” fuel. Second, significant volumes of gas are
traded relative to the oil price, and so the price-correlation is valid. Finally, updating our analysis to model gas across
a greater number of regional markets would introduce significant additional complexity without necessarily greatly
improving the accuracy of overall conclusions.

                                                                                                                        25
Beyond Petrostates
FIGURE 6. FUTURE (2021-2040) GOVERNMENT REVENUE UNDER DIFFERENT DEMAND/PRICE
SCENARIOS COMPARED TO LAST FIVE YEARS AND LAST DECADE
Source: IEA, Rystad Energy, CTI analysis
Notes: * 2010-2019 and 2015-2019; extrapolated to 20-year values for comparability.
…with a potential revenue gap The SDS at $base price case is given not to
of $13 trillion to 2040 under a suggest that it is plausible that prices will
low-demand world remain unchanged at BAU levels under
lower demand conditions, but to allow us
Given that lower demand will lead to to separate the differing effects of price and
lower pricing, all else equal, we believe it volume. It can be clearly seen that of the
is appropriate to utilise lower future price $13tn, the price impact is far more important
assumptions as part of the scenario analysis. than the volume impact, making up 80% of
The comparison of combinations 1 and 3 in the difference.
Figure 6 shows the dual impact of both price
and volume effects: under a low-carbon The flat real long-term price of $40/bbl
world with subdued prices (SDS at $40) total used to calculate revenues under the low-
revenues are 51% less than expectations carbon scenario (SDS) is used illustratively.
under a business-as-usual scenario (STEPS Clearly, we do not expect the oil price under
at $base).40 In total, the gap amounts to 13 a low-carbon scenario to stay flat at $40
trillion dollars over the next two decades, come what may, but use this benchmark to
as the transition towards a low-carbon illustrate the impact of lower prices related
economy – critical to avert the worst impacts to lower demand.41 Using base case pricing
of climate change – gathers pace. would significantly underestimate the
potential shortfall in future cash flows under
a world of reduced demand.
40 See appendix to see the impact on total revenues split by government taxation and income from NOCs.
41 Theoretically, as we calculate $40 as the highest cost project required to fill supply under the SDS scenario
for an aggregate period of 2020-40, it would be the maximum price for that period required to supply the last barrel of
oil, rather than a flat price. Again, we use it here on a flat real basis for illustrative purposes.
26You can also read