Connecting the Last Miles: Accelerating Inclusive Broadband in Asia and the Pacific - Asia-Pacific Information Superhighway (AP-IS) Working Paper ...
←
→
Page content transcription
If your browser does not render page correctly, please read the page content below
Connecting the Last Miles:
Accelerating Inclusive Broadband
     in Asia and the Pacific

Asia-Pacific Information Superhighway (AP-IS) Working Paper Series

                                                                     1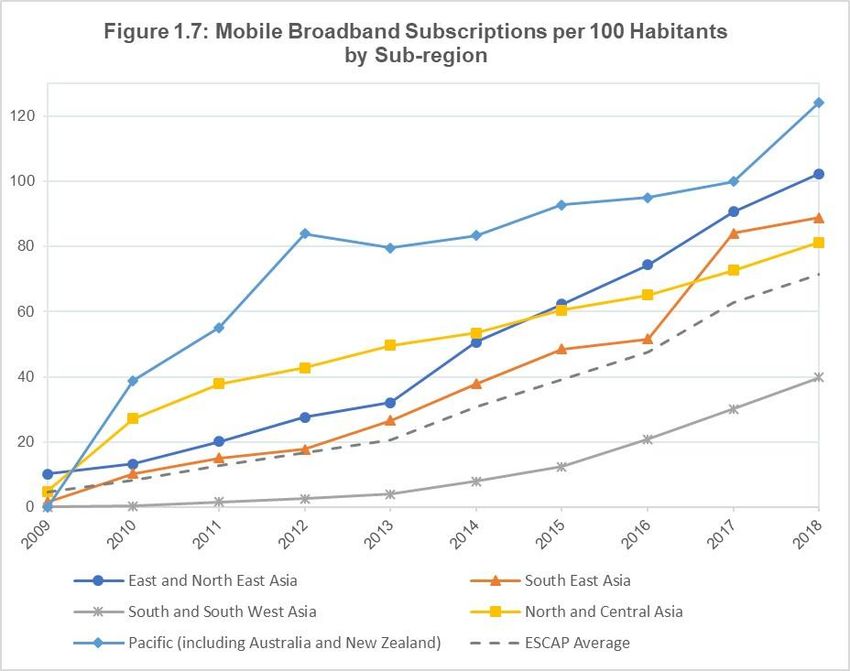
The Economic and Social Commission for Asia and the Pacific (ESCAP) serves as the United Nations’
regional hub promoting cooperation among countries to achieve inclusive and sustainable
development. The largest regional intergovernmental platform with 53 member States and 9
associate members, ESCAP has emerged as a strong regional think tank offering countries sound
analytical products that shed insight into the evolving economic, social and environmental dynamics
of the region. The Commission’s strategic focus is to deliver on the 2030 Agenda for Sustainable
Development, which it does by reinforcing and deepening regional cooperation and integration to
advance connectivity, financial cooperation and market integration. ESCAP’s research and analysis
coupled with its policy advisory services, capacity building and technical assistance to governments
aim to support countries’ sustainable and inclusive development ambitions.

             The shaded areas of the map indicate ESCAP members and associate members.

Disclaimer: The Asia-Pacific Information Superhighway (AP-IS) Working Papers provide policy-
relevant analysis on regional trends and challenges in support of the development of the AP-IS and
inclusive development. The findings should not be reported as representing the views of the United
Nations. The views expressed herein are those of the authors. This working paper has been issued
without formal editing, and the designations employed and material presented do not imply the
expression of any opinion whatsoever on the part of the Secretariat of the United Nations concerning
the legal status of any country, territory, city or area, or of its authorities, or concerning the
delimitation of its frontiers or boundaries. Mention of firm names and commercial products does not
imply the endorsement of the United Nations, and any failure to mention a particular enterprise,
commercial product or process is not a sign of disapproval.

Correspondence concerning this working paper should be addressed to the email: escap-ids@un.org.

Contact:
ICT and Development Section
Information and Communications Technology and Disaster Risk Reduction Division
United Nations Economic and Social Commission for Asia and the Pacific
United Nations Building
Rajadamnern Nok Avenue
Bangkok 10200, Thailand
Email: escap-ids@un.org

                                                                                                  2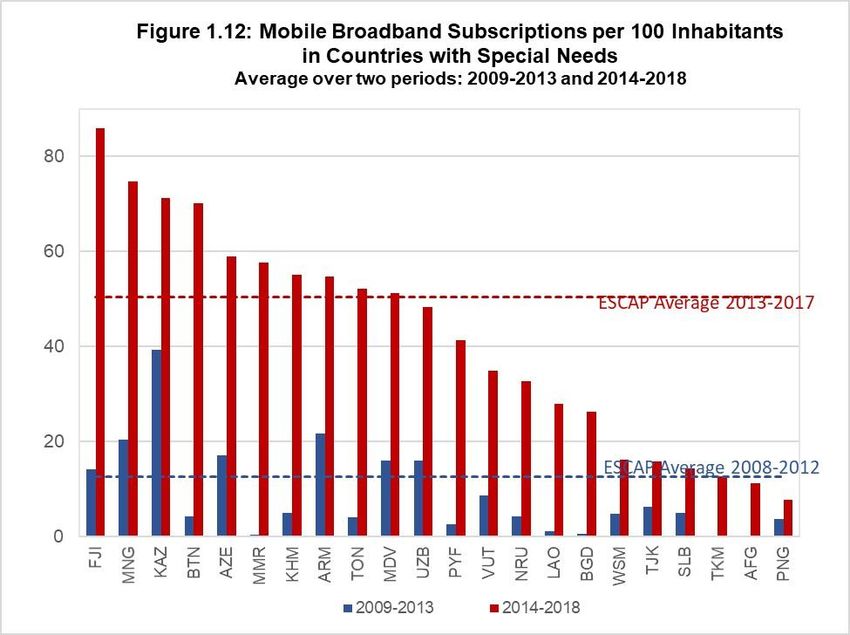
Acknowledgements

This working paper was prepared by Atsuko Okuda, Channarith Meng, and Peter Isaac
Bauman from the Information and Communications Technology and Development Section,
under the guidance of Tiziana Bonapace, Director, Information and Communications
Technology and Disaster Risk Reduction Division of the United Nations Economic and Social
Commission for Asia and the Pacific (ESCAP).

The working paper benefited from substantive inputs from Elena Dyakonova and Yongwang
Liu during their services at ESCAP. Tarnkamon Chantarawat and Sakollerd Limkriangkrai
provided administrative support and other necessary assistance for the issuance of this
paper.

April 2020

The cover:

Image source: iStock - 930116004

                                                                                        3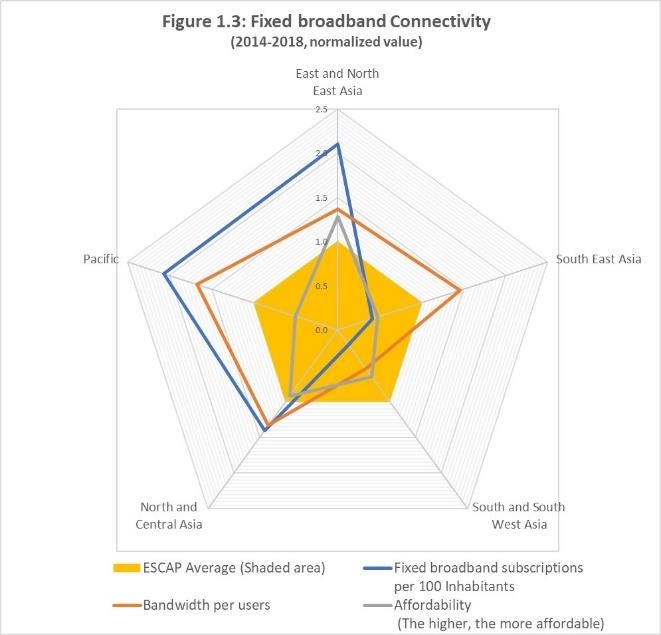
Executive Summary

Asia and the Pacific has been going through a fundamental transformation induced by digital
technology and connectivity. The region has been a driving force of such digital
transformation - be it artificial intelligence (AI), Internet of Things (IoT), Big Data, cloud
computing or blockchain. Mobile payment technologies have been accelerating financial
inclusion deep into remote and rural areas, while AI, IoT and Big Data analytics have been
revolutionizing healthcare, infrastructure and building maintenance, disaster risk mitigation
and preparedness efforts while increasing agricultural productivity. They are also used for
business analytics, new product development, industrial Internet, smart logistics among
others, which are deemed to shape future competitiveness of economies across the globe.

Digital technology and connectivity have been proven effective in addressing some of the
negative consequences of Corona Virus Disease 2019 (COVID-19) pandemics. The rapid
spread of COVID-19 has been causing cascading economic and social stress across the world.
The production of goods and services has decreased in some countries, while an increasing
number of economies are feared to go in recession, with rising unemployment rates. More
schools are closed, and hospitals overcrowded with dwindling medical supplies. In combating
the adverse effects of COVID-19 and enhancing societal and economic resilience, digital
technology and connectivity have emerged as an essential tool and alternative to the physical
equivalent.

Unsurprisingly, this resilience is observed mainly among the advanced economies where
enabling digital infrastructure and ecosystem already exist. It has accentuated the fact that
the multi-facetted digital gaps between advanced economies and developing countries are
widening even further. What does this mean for developing countries which have been
catching up with mobile and fixed broadband technologies, networks and access? What are
the accelerated pathways for their digital transformation, while advancing digital inclusion to
achieve the Sustainable Development Goals (SDG) in the region? The answer may lie in how
we expand connectivity to the unconnected and address the perennial issue of last mile
connectivity.

Asia and the Pacific demonstrated steady growth in expanding access to broadband networks
over the last decade. The growth, however, has been uneven across subregions and

                                                                                             4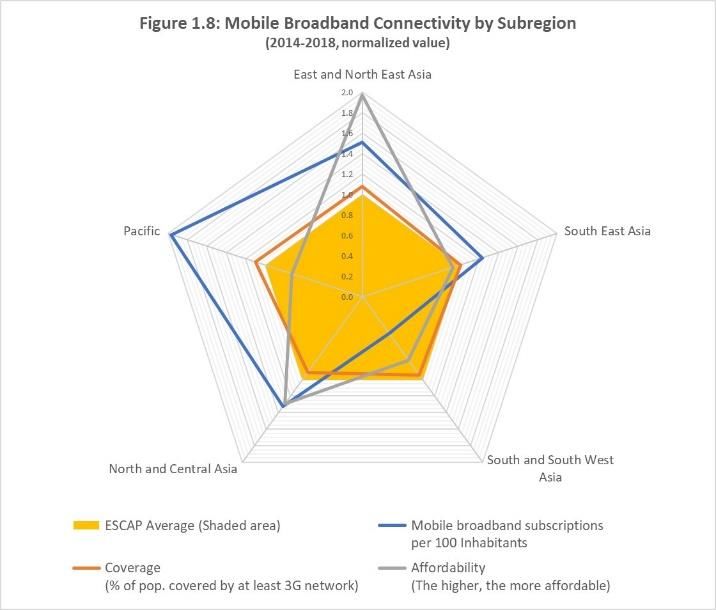
countries. While East and North East Asia is the front runner in terms of both fixed and mobile
broadband access, South and South West Asia lags far behind. According to studies of the
United Nations Economic and Social Commission for Asia and the Pacific (ESCAP), a wider
divergence between subregions and countries has been observed, particularly in terms of the
growth of fixed broadband access. Mobile broadband continues to have a strong uptake
across countries due to the rapid growth of mobile infrastructure, technologies and services,
but the distribution of growth is uneven, in which the South and South West Asia, in
particular, remains the least connected.

The broadband divide seems even more pronounced when categorizing countries by the level
of economic development. As broadband access in developed countries continues to fast
forward, the countries with special needs, including least developed countries (LDCs),
landlocked developing countries (LLDCs), and small island developing states (SIDS), remain
largely unconnected and, in some countries, do not show any meaningful progress. In some
countries, fixed broadband has become less affordable over the years, increasing the
likelihood that these countries may not be able to catch up with their advanced peers.
Although mobile broadband has become increasingly affordable for countries with special
needs in tandem with lower mobile broadband subscription rates, many countries still
experience insufficient international bandwidth.

As broadband subscriptions are still unaffordable for many, Wi-Fi has emerged as an effective
and low-cost technology with the potential to connect the remaining half of the region’s
population and help achieve the SDGs. Together with increasing availability of smart phones
across all age groups, Wi-Fi is increasingly considered as one of the preferred means to go
online, especially when large data consumption is needed. With poor 3G/LTE connectivity
and heavy concurrent data usage in developing countries, public Wi-Fi appears to be a natural
solution. Surveys have confirmed the popularity of Wi-Fi to access the Internet from home
for bandwidth-intensive applications such as video, live streaming and social media. It
reduces the cost of Internet access and saves capped data volume on users’ mobile plans,
which are big incentives for the poor to go online.

For these reasons, Asia and the Pacific has experienced an increase in the public Wi-Fi
networks, although this is also rather unevenly distributed in the region. Public Wi-Fi
provision has been enabled with various policies with focus on the promotion of digital
inclusion, digital economy, inter-city competition, tourism, e-government services and
democratic participation. In particular, governments recognized the potential of free public

                                                                                             5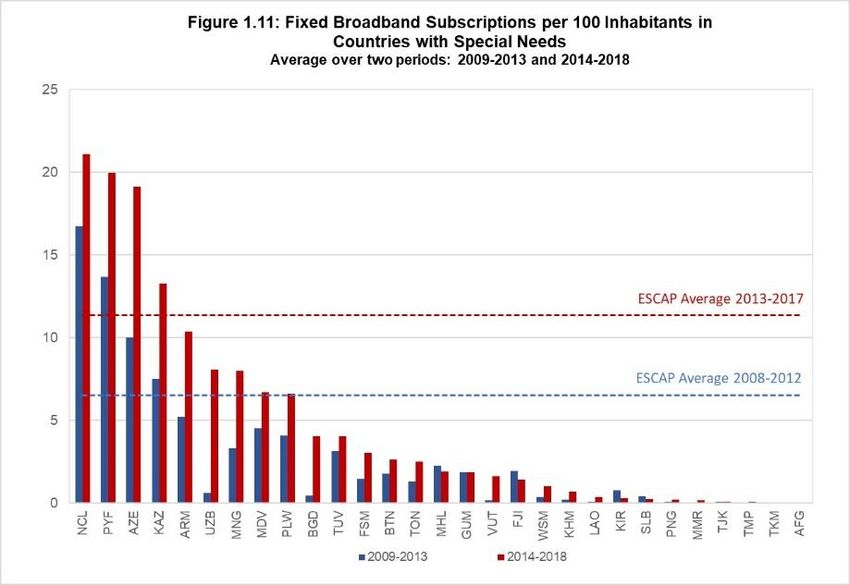
Wi-Fi which can be extended to un- and under-served communities, as well as rural and
remote areas to enhance this inclusiveness.

Drawing from case studies of public Wi-Fi, this report identified benefits and opportunities in
providing public Wi-Fi to enhance affordability and accessibility for the large segment of
currently excluded people. For users to enjoy the benefits of public Wi-Fi, support from
governments will be required in several respects. Specifically, governments would need to
invest in digital infrastructure, including fixed broadband networks. Furthermore, a
supportive policy framework and environment is needed for an expedited approval process
and simplified right-of-way rules, with clear guidelines which would help scale up investment
from the private sector. Finally, consumer protection, privacy and harassment prevention
should be put in place, as users are often unaware of all the associated risks of connectivity.

In improving digital inclusion of marginalized groups, social media helps integrate them into
society by reducing physical and geographical barriers. It also helps in overcoming isolation
and stigmas which may stand in the way of traditional socialising. In places where formal
education is difficult to access, or the quality is poor, educational channels on social media
sites like YouTube and podcasts are evidenced to narrow the gap. In the health sector where
there is a marked shortage of specialized medical personnel, social media sites have been
used to share health information and conduct health promotion. It was found effective to
communicate remotely with patients from underserved areas, and even to diagnose patients
and recommend treatment and post-surgery counselling inexpensively, while reducing the
travel burdens on patients. In preparedness and response to disasters, social media has been
used to address vulnerabilities and facilitate disaster responses by enabling communication
prior, during, and in the aftermath of a crisis. Social media has proven to contribute to
financial inclusion by tapping into the unserved or underserved banking or financial markets.
Finally, social media can be a key driver in the establishment and development of social
businesses and enables social entrepreneurs to build a larger – and even global – community.

                                                                                              6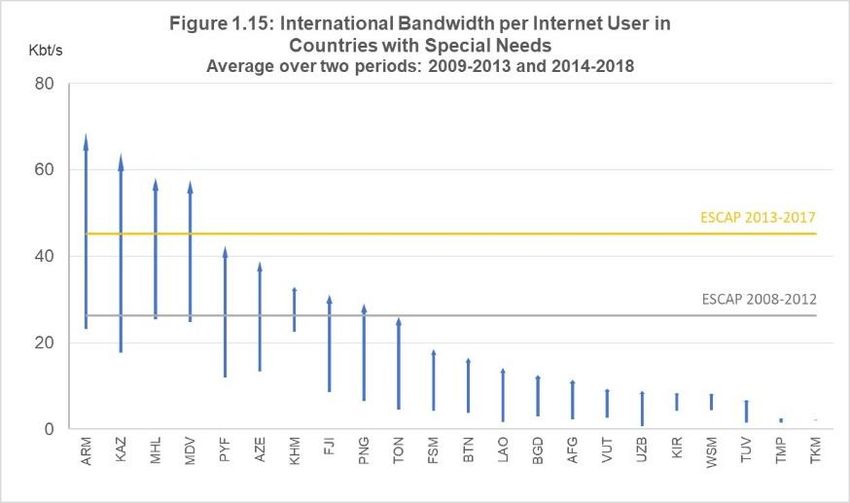
Table of Contents
Executive Summary ............................................................................................................................... 4
List of Figures ......................................................................................................................................... 8
List of tables ........................................................................................................................................... 8
Abbreviations ......................................................................................................................................... 9
Introduction ......................................................................................................................................... 10
Chapter 1: Broadband Connectivity in Asia and the Pacific .............................................................. 13
   1.1         Broadband Development Trends in Asia and the Pacific ................................................... 13
       1.1.1 Fixed Broadband Connectivity ........................................................................................... 13
       1.1.2. Mobile Broadband Connectivity ....................................................................................... 17
   1.2. Broadband Connectivity in Countries with Special Needs ..................................................... 20
       1.2.1. Broadband Subscriptions .................................................................................................. 20
       1.2.2. Broadband Affordability and Quality ............................................................................... 22
   1.3. Challenges of broadband development in countries with special needs .............................. 23
Chapter 2: Wi-Fi’s Role in Improving Internet Affordability in Developing Countries ..................... 26
   2.1. Role of Wi-Fi in the digital connectivity ecosystem ................................................................ 27
   2.2 Potential for Wi-Fi to improve affordability............................................................................. 32
   2.3. Wi-Fi and digital inclusion ........................................................................................................ 34
   2.4. Wi-Fi and government policies ................................................................................................ 36
Chapter 3: The Role of Social Media in Digital Inclusion and Socio-economic Development .......... 41
   3.1. Social Media and Digital Inclusion ........................................................................................... 42
   3.2. Social Media and Education ..................................................................................................... 44
   3.3. Social Media and Health .......................................................................................................... 46
   3.4. Social Media and Disaster Risk Reduction .............................................................................. 49
   3.5. Social Media and Financial Inclusion ....................................................................................... 50
   3.6. Social Media and Online Business ........................................................................................... 52
   3.7. Social Media and Digital Inclusion ........................................................................................... 53
       Inclusion Policies .......................................................................................................................... 53
       e-Learning Policies ....................................................................................................................... 54
       Healthcare Policies ....................................................................................................................... 54
       Disaster Risk Reduction Policies................................................................................................... 55
       Financial Inclusion Policies ........................................................................................................... 55
       Online Business Policies ............................................................................................................... 55
Conclusion ........................................................................................................................................... 56

                                                                                                                                                          7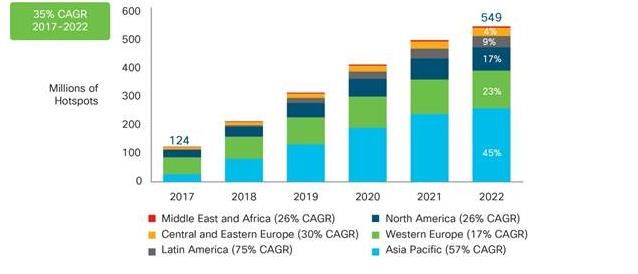
List of Figures
Figure 1.1    Fixed Broadband Subscriptions per 100 Inhabitants by Region              14
Figure 1.2    Fixed Broadband Subscriptions per 100 Inhabitants by Sub-region          14
Figure 1.3    Fixed Broadband Connectivity                                             15
Figure 1.4    Fixed Broadband Subscriptions per 100 Inhabitants by Level of Development
                                                                                       15
Figure 1.5    Fixed Broadband Connectivity by Level of Development                     16
Figure 1.6    Mobile Broadband Subscriptions per 100 Inhabitants                       17
Figure 1.7    Mobile Broadband Subscriptions per 100 Inhabitants by Sub-region         17
Figure 1.8    Mobile Broadband Connectivity by Sub-region                              18
Figure 1.9    Mobile Broadband Subscriptions per 100 Inhabitants by Level of Development
                                                                                       19
Figure 1.10   Mobile Broadband Connectivity by Level of Development                    19
Figure 1.11   Fixed Broadband Subscriptions per 100 Inhabitants in Countries with Special
Needs                                                                                  20
Figure 1.12   Mobile Broadband Subscriptions per 100 Inhabitants in Countries with Special
Needs                                                                                  21
Figure 1.13   Fixed Broadband Prices and Subscriptions per 100 Inhabitants             22
Figure 1.14   Mobile Broadband Prices and Subscriptions                                22
Figure 1.15   International Bandwidth per Internet User in Countries with Special Needs 23
Figure 2.1    The Forecast of Public Wi-Fi Hotspots Development, 2017-2022 Cisco VNI
Report                                                                                 27
Figure 2.2    Main Reasons for Using Public Wi-Fi Hotspots, Japan, November 2017       29
Figure 2.3:   The Impact of Online Session on Students’ Grades                         35
Figure 2.4:   The Internet and its Impact on Livelihoods                               36
Figure 3.1:   Users’ YouTube Activities                                                46

List of tables
Table 2.1:  Population Using Mobile Device to Access the Internet by Type of
Communication                                                                         31
Table 2.2:  Population Using Mobile Device to Access the Internet by Type of
Communication and geographical area                                                   31
Table 2.3:  Population Using Mobile Device to Access the Internet by Type of
Communication and gender                                                              31

                                                                                           8
Abbreviations
3G         Third Generation of Mobile Telecommunications Technology
A4AI       Alliance for Affordable Internet
ANACOM     Autoridade Nacional de Comunicações
BIS        Bank for International Settlement
COVID-19   Corona Virus Disease 2019
ESCAP      Economic and Social Commission for Asia and the Pacific
GDP        Gross Domestic Product
HIV        Human Immunodeficiency Virus
IoT        Internet of things
ISPs       Internet service providers
ITU        International Telecommunication Union
LDCs       Least Developed Countries
LLDCs      Landlocked Developing Countries
LTE        Long-Term Evolution
MIT        Massachusetts Institute of Technology
MOOC       Massive Open Online Course
OECD       Organisation for Economic Co-operation and Development
PFP        Physicians for Peace
PPP        Public Private Partnerships
SDGs       Sustainable Development Goals
SIDs       Small Island Developing States
SME        Small and Medium-sized Enterprises
TEWS       Twitter Early Tsunami Warning System
VPN        Virtual Private Network
WHO        World Health Organisation
ZRPs       Zero Rating Programs

                                                                      9
Introduction
Asia and the Pacific has been going through a fundamental transformation induced by digital
technology and connectivity. The region has been a driving force of such digital
transformation - be it artificial intelligence (AI), Internet of Things (IoT), Big Data, cloud
computing or blockchain. Mobile payment technologies have been accelerating financial
inclusion deep into remote and rural areas, while AI, IoT and Big Data analytics have been
revolutionizing our healthcare, infrastructure and building maintenance, disaster risk
mitigation and preparedness efforts, while increasing agricultural productivity. They are also
used for business analytics, new product development, industrial Internet, smart logistics
among others, which are deemed to shape future competitiveness of economies across the
globe.
Digital technology and connectivity have been proven effective in addressing some of the
negative consequences of COVID-19 pandemics. The rapid spread of COVID-19 has been
causing cascading economic and social stress across the world. The production of goods and
services has decreased in some countries, while an increasing number of economies are
feared to go in recession, with rising unemployment rates. More schools are closed, and
hospitals overcrowded with dwindling medical supplies. In combating the adverse effects of
COVID-19 and enhancing societal and economic resilience, digital technology and
connectivity have emerged as an essential tool and alternative to the physical equivalent1.
Unsurprisingly, this resilience2 is observed mainly among the advanced economies where
enabling digital infrastructure and ecosystem already exist. It has accentuated the fact that
the multi-facetted digital gaps between advanced economies and developing countries are
widening even further. What does this mean for developing countries which have been
catching up with mobile and fixed broadband technologies, networks and access? What are
the accelerated pathways for their digital transformation, while advancing digital inclusion to
achieve the Sustainable Development Goals (SDG) in the region? The answer may lie in how
we expand connectivity to the unconnected and address the perennial issue of last mile
connectivity.
1
Okuda, A. & Karazhanova, A. (2020) Digital Resilience against COVID-19, ESCAP blog at
https://www.unescap.org/blog/digital-resilience-against-covid-19
2
Under the Asia-Pacific Information Superhighway (AP-IS), such resilience, or e-resilience, has been promoted.
For more information, please refer to http://drrgateway.net/e-resilience/about.
10In Asia and the Pacific, as in other regions of the world, broadband Internet has been one of
the driving forces transforming the economy and society as well as accelerating the process
of regional integration. It is both a new engine of economic growth and a valuable source of
innovation. It is also an indispensable tool for social connectivity across the region and is
facilitating inclusiveness at all levels of society, bringing information, skills and services to the
poorest and most vulnerable groups of society. For this reason, broadband Internet is
considered one of the essential means to achieve the Sustainable Development Goals (SDGs).
At the same time, however, Asia and the Pacific is one of the most digitally divided regions in
the world, with half of the region’s population unable to access the Internet regularly; thus,
they are shut out from transformative digital opportunities in employment, education,
healthcare and financial services. Not only between countries, the digital divide persists
within countries and societal groups, including between urban/rural areas, high-income/ low-
income groups, men/women, the young/old and the educated/uneducated people. Women
and girls in Asia and the Pacific tend to have less access to broadband Internet and
knowledge-enhancing applications and services. Taking into account that artificial
intelligence and other emerging technology require access to robust broadband networks, it
is feared that such broadband divide may lead to cascading socioeconomic divides in the
future.
Recognizing these challenges and opportunities, connecting the remaining half of Asia and
the Pacific’s population is an urgent priority for the region’s socio-economic development
and will significantly accelerate the SDG achievement. With the increasing availability of
smart phones across all age groups, Wi-Fi and social media are expected to accelerate such
efforts. Wi-Fi and social media are two important means to bring more people online and
thus promote digital inclusion from various aspects.
Against this background, this study aims to identify challenges and opportunities in
connecting the digitally excluded people, while examining potential roles of Wi-Fi and social
media as pragmatic solutions. The study will also explore what constitutes an enabling policy
environment for digital inclusion.
11The study is organized into three chapters. Chapter 1 will discuss trends in broadband
connectivity in the Asia-Pacific region, identifying countries which are falling behind and
therefore require more attention. The chapter will also highlight the main challenges that
constrain these countries in broadband connectivity. Chapter 2 illustrates public Wi-Fi as an
effective and low-cost technology that has the potential to connect the remaining half of the
region’s population. The actual cases of government- and private sector-initiated public Wi-
Fi rollouts will be presented. Chapter 3 investigates social media’s ability to accelerate SDG
achievement on many fronts including social inclusion, education, health, disaster risk
reduction, social business and financial inclusion. Finally, the study will conclude with a
broader examination of policy implications based on the study’s findings with a focus on
accelerating SDG implementation and reducing the digital divide in Asia and the Pacific.
12Chapter 1: Broadband Connectivity in Asia and the Pacific
In an age of rapid technological advancement such as artificial intelligence, Internet of things
(IoT), and cloud computing – huge untapped opportunities can be realized by harnessing
digital applications to improve living standards, increase productivity, and deliver information
and services to remote and rural areas. Digital technology continues to spearhead a new wave
of transformation, bringing innovation and promising development in various socioeconomic
sectors, and making possible what was previously thought impossible. At the core of the
application of emerging technology are robust broadband networks and access which
unfortunately are not distributed evenly in Asia and the Pacific. The limited broadband access
in some countries translates into millions of people being left out, particularly those
marginalized. Such issues, if not addressed, could inhibit long-term development
opportunities and further widen the divide between and within countries.
This chapter will discuss the development of digital connectivity in terms of fixed and mobile
broadband in Asia and the Pacific. In particular, it will look into the progress of countries with
special needs where broadband connectivity is lagging behind other countries in the region.
Key challenges and constraints in broadband connectivity in these countries will then be
identified.
1.1 Broadband Development Trends in Asia and the Pacific
1.1.1 Fixed Broadband Connectivity
Asia and the Pacific has recently demonstrated steady growth in access to fixed broadband,
compared to the previous decade. However, compared to other regions, fixed broadband
subscriptions per 100 inhabitants are still far behind North America and Europe. The ESCAP
average is also marginally below the world’s average, though the figure is similar to Latin
America and the Caribbean’s, as in Figure 1.1.
13Looking at the
subregional
broadband divide in
region, Figure 1.2
demonstrates that
the expansion of
fixed broadband
over the past
decade has been
uneven.
Source: ESCAP calculations based on data from the ITU, World Telecommunication/ICT
Indicators database 2018 (December 2018 Edition). Available from www.itu.int/en/ITU-
D/Statistics/Pages/ publications/wtid.aspx (accessed 25 February 2019).
East and North-East Asia,
the Pacific, and North and
Central Asia have
performed relatively well in
terms of growth in fixed
broadband subscriptions
per 100 Inhabitants. The
other sub-regions, however,
including South-East Asia
and South and South-West
Asia, have registered slower
Source: ESCAP calculations based on data from the ITU, World progress. It should be noted
Telecommunication/ICT Indicators database 2018
that the Pacific subregion
had one of the highest subscription rates, due to the growth in number of subscriptions in
Australia and New Zealand. Similarly, in East and North-East Asia, rapid expansion was mainly
driven by China, Japan, and Republic of Korea. In North and Central Asia, noticeable progress
14was observed mainly from the Russian Federation, Azerbaijan, Kazakhstan, Georgia, and
more recently Uzbekistan.
Figure 1.3 provides a multidimensional picture
of fixed broadband connectivity in each
subregion, including not only subscription rate
but also broadband capacity and affordability.
The area in yellow represents ESCAP region’s
averages. East and North East Asia has
performed better than average in every
dimension of broadband connectivity. The
Pacific and North and Central Asia have
relatively good subscription rates and
broadband speeds but with less affordable
services. South East Asia has relatively good Source: ESCAP calculations based on data from the ITU, World
broadband speed, but the subscription rate and Telecommunication/ICT Indicators database 2018
affordability is relatively low. Lastly, the South and South West Asia subregion is the lowest
performer with all figures below the region’s averages.
When categorized by level of economic
development and geographic feature
of ESCAP countries, the growth is
found mostly driven by developed
countries (Figure 1.4). There was a
wider gap of fixed broadband
subscriptions per 100 inhabitants
between developed countries and
those with special needs. Specifically,
Small Island Developing States (SIDS)
have the lowest subscription rate and
over the last decade have recorded Source: ESCAP calculations based on data from the ITU, World
Telecommunication/ICT Indicators database 2018
15almost no improvements, whereas Least Developed Countries (LDCs) and Landlocked
Developing Countries (LLDCs) experienced positive but slow growth. Fixed broadband
expansion in these countries is also far below the region’s average.
Similarly, countries with
special needs fell far below the
region’s averages by looking at
broadband bandwidth and
affordability (Figure 1.5).
While SIDS have relatively
good bandwidth per user
compared to the other two
groups, they have low
subscription rates and
affordability levels. Issues for
Source: ESCAP calculations based on data from the ITU, World
Telecommunication/ICT Indicators database 2018 LDCs are not only in terms of
fixed broadband subscription rate but also affordability and bandwidth, as these values fall far
below the region’s averages.
161.1.2. Mobile Broadband Connectivity
Asia and the Pacific has performed much
better in terms of mobile versus fixed
broadband uptake, with mobile
broadband subscriptions per 100
inhabitants growing from less than 10
per cent in 2010 to more than 70 per cent
in 2018 (Figure 1.6). This development is
aligned with the rapid growth of mobile
infrastructure and services experienced
in many countries worldwide as a result Source: ESCAP calculations based on data from the ITU, World
Telecommunication/ICT Indicators database 2018
of the availability of affordable smart
phones, mobile network technology, digital convergence, deregulation and globalization.
Despite dynamic
growth in mobile
broadband
subscription rates, the
region still remains
below Latin America,
Europe and North
America.
Source: ESCAP calculations based on data from the ITU, World Telecommunication/ICT
Indicators database 2018
Figure 1.7 further shows the trend of mobile broadband subscriptions by subregion. It
indicates that the average mobile broadband subscriptions per 100 inhabitants is highest in
17the Pacific, reaching above
120 per cent subscription
rate. Followed is East and
North-East Asia and South-
East Asia, which were the
two outperformers in terms
of subscription growth in
2017. Rapid expansion also
occurred in many countries
in South East Asia and North
and Central Asia. Among all
the subregions, South and
Source: ESCAP calculations based on data from the ITU, World
South-West Asia has the Telecommunication/ICT Indicators database 2018
lowest average mobile-broadband subscriptions per 100 inhabitants, although there has
been significant progress since 2011. Overall, all the subregions except South and South-West
Asia seem to be catching up rapidly with one another in mobile broadband expansion.
In terms of mobile broadband coverage, Figure 1.8 suggests that North and Central Asia, and
South and South West Asia have relatively low network coverage compared to the region’s
average. On the other hand, mobile broadband services were relatively less affordable across
subregions, except in East and North East Asia and North and Central Asia, compared to the
ESCAP region’s averages.
Examining mobile broadband expansion by development level (Figure 1.9), we see continuing
divergence between developed countries and countries with special needs, especially SIDS.
These results are consistent with the fixed broadband networks figures from above.
18Despite stronger numbers compared to fixed broadband, the development of mobile
broadband connectivity in countries with special needs are still well below the region’s
average. SIDSs have the
slowest progress in
mobile broadband
development in the
region.
Source: ESCAP calculations based on data from the ITU, World
Telecommunication/ICT Indicators database 2018
Countries with special
needs also face the
problem of mobile
broadband affordability
(Figure 1.10). Similarly,
SIDSs have the lowest
affordability, followed by
LLDCs and LDCs. However,
the coverage of 3G data
networks are not
considerably less than that
Source: ESCAP calculations based on data from the ITU, World of the region’s average.
Telecommunication/ICT Indicators database 2018
19Overall, broadband development in Asia and the Pacific is diverse across its geographical
subregions. While the Pacific and East and North-East Asia have been performing quite well,
South and South-West still needs a great amount of effort and improvement in order to catch
up. Not only does the broadband divide occur across subregions, but it also seems to be more
pronounced when categorizing countries by level of economic development. Broadband
expansion in developed countries continues to accelerate, while in countries with special
needs it is relatively slow, with some countries showing almost no progress.
1.2. Broadband Connectivity in Countries with Special Needs
1.2.1. Broadband Subscriptions
Figure 1.11 shows fixed broadband subscriptions per 100 inhabitants of countries with special
needs. It clearly indicates a worrisome trend in many of those countries. A few countries
made a good progress, including New Caledonia, Azerbaijan,
Source: ESCAP calculations based on data from the ITU, World Telecommunication/ICT Indicators database 2018
20and Kazakhstan, whereas the rest grew below the region’s average over the last decade. Out
of these 29 countries, 14 have fixed broadband subscriptions per 100 inhabitants below two,
with the majority showing only slight improvement.
Conversely, we can observe that over the last decade mobile broadband subscriptions are
expanding promisingly in most countries with special needs (Figure 1.12). Many countries
expanded rapidly with subscription rates above regional averages including Fiji, Mongolia,
Source: ESCAP calculations based on data from the ITU, World Telecommunication/ICT Indicators database 2018
Kazakhstan, Bhutan, Azerbaijan, Myanmar, Cambodia, Armenia, Tonga and the Maldives. Still,
there are several countries with below average progress, despite a big jump from the very
small base.
211.2.2. Broadband Affordability and Quality
Figure 1.13 depicts the relationship between fixed broadband subscription rate and price as
a percentage of Gross National Income for countries with special needs. It also displays
progress made from 2012 to 2017. For many countries, fixed broadband has become less
affordable, as shown by the many upward-pointing arrows. The price of fixed broadband
tends to rise for countries with little improvement in subscription rates. For countries with
relatively good progress in broadband subscriptions, the price tends to be relatively stable or
rises only minimally. Countries with slower progress will continue to have less ability to catch
up with other countries, as prices rise even further.
In contrast, mobile broadband (Figure 1.14) has become more affordable in all countries with
special needs with prices for all countries pointing downward. We also observe that increased
affordability tends to move in tandem with increased mobile broadband subscription rates,
suggesting a link between the growth of broadband subscription and affordability.
Figure 1.13: Fixed Broadband Prices and Subscriptions per 100 Inhabitants: Figure 1.14: Mobile Broadband Prices and Subscriptions
Progress from 2012 to 2017 Progress from 2012 to 2017
20 AFG
15
Mobile-broadband Price as % of GNI
MMR
TMP
15
SLB
10
VUT
LAO KHM
10 KHM
TJK
WSM
NPL TMP
PNG 5 LAO FJI
NPL KGZ
KGZ
5 TON
TON
BGD
FJI UZB
BTN The Rest BGD ARM
MDV The RestBTN AZE
ARM MDV MNG
UZB MNG KAZ
KAZ AZE 0
0
0 20 40 60 80
0 5 10 15 20 Mobile-broadband Sub. per 100 inhabitants
Fixed-broadband Sub. per 100 inhabitants
Source: ESCAP calculations based on data from the ITU, World Source: ESCAP calculations based on data from the ITU, World
Telecommunication/ICT Indicators database 2019 Telecommunication/ICT Indicators database 2019
Access and affordability are also linked to the capacity of broadband connectivity, measured
by international broadband bandwidth per user. From Figure 1.15, we can notice rapid
increases in some
22countries such as Armenia,
Kazakhstan, the Marshall
Islands and the Maldives with
bandwidth per user above
the region’s average.
However, many other
countries experienced little
improvement in
Source: ESCAP calculations based on data from the ITU, World Telecommunication/ICT international bandwidth
Indicators database 2018
such as Turkmenistan, Timor-
Leste, Tuvalu, Samoa and Kiribati.
Overall, slow progress in broadband development is an increasing concern among many
countries with special needs. Greater attention and support are thus needed for these
countries to bridge the digital divide.
1.3. Challenges of broadband development in countries with special needs
The rapid expansion in mobile broadband access across the region does not mean that fixed
broadband will become less important for future development. Numerous studies including
ESCAP (2017), Jinsoo Bae, et al. (2014)3, ANACOM (2015)4, and Wan-Ying Lin, et al. (2013)5
support the view of complementarity between fixed and mobile broadband; in fact, these
studies highlight a number of mobile broadband’s shortcomings. These include data usage
caps (which often increase cost and limit usability); less reliability and higher latency
(especially for health, home office and business requirements); and relatively lower Internet
speeds. In addition, while mobile-broadband services are enjoyed on user devices such as
mobile phones and tablets, the data traffic relies on fixed-broadband networks. A study by
3 Bae, J., Choi, Y.J., & Hahn, J.H. , Fixed and mobile broadband: Are they substitutes or complements? (July 2014). Available
from http://ftp.repec. org/opt/ReDIF/RePEc/yon/wpaper/2014rwp-68.pdf.
4 ANACOM, Study on Substitutability between Fixed Broadband and Mobile Broadband: Final Report (October 2015).
Available from https://www.anacom.pt/streaming/subst_fixedmobilebroadband2015.pdf?c
ontentId=1385792&field=ATTACHED_FILE.
5 Lin, W., Zhang, X., Jung, J., & Kim, Y., “From the wired to wireless generation? Investigating teens’ Internet use through
the mobile phone”, Telecommunications Policy, vol. 37, no. 8 (2013), pp. 651-661
23CISCO estimated that Internet traffic via fixed-broadband connections accounted for 39 per
cent of the total in 2018, compared with 12 per cent for mobile and 49 per cent for Wi-Fi.6
Meanwhile, without robust fixed broadband networks and access, most people in countries
with special needs would not benefit fully from the rapid advancement of digital technology
and the opportunities they offer, which rely on high broadband capacity and reliability of
connection. In order to combat further disparity, it is worthwhile to investigate the main
factors which hold back broadband development in countries with special needs.
First, countries with special needs face specific challenges related to geography and
demography. Lack of access to the sea increases prices for international connectivity for
LLDCs, as international connectivity is highly dependent on neighboring countries which are
typically costly and limited by low-capacity cross-border fibre-optic links. The issues are
exacerbated, since some LLDCs have large, mountainous and sparsely populated land and
rural areas, resulting in higher capital investment and operation costs. For SIDS, limited
market as well as island size creates a problem with the rollout of terrestrial fibre optic cables.
LDCs overall trail developed countries in every respect including low levels of investment,
high degrees of aid dependence, low levels of consumption and income, and low skill
development among others.
Access and cost of electricity are considered major obstacles for countries with special needs,
particularly LDCs and SIDS, which adds to the cost of powering networks. Electricity costs thus
raise the cost of broadband and Internet access. Based on ESCAP’s Asia-Pacific Countries with
Special Needs Report 2017,7 nearly half of the population living in countries with special
needs in Asia and the Pacific, equivalent to approximately 140 million people, do not have
access to electricity. Most of them live in LDCs. Similarly, ESCAP’s study on Broadband
Connectivity in Pacific Island Countries8 also details how low access to electricity for SIDS due
to their archipelago characteristics and high dependency on non-renewal diesel fuel makes
6 Cisco, Cisco Visual Networking Index: Global Mobile Data Traffic Forecast Update, 2016–2021 (February 2017). Available
from https://www.cisco. com/c/en/us/solutions/collateral/service-provider/ visual-networking-index-vni/mobile-
whitepaper-c11-520862.html.
7 Available from https://www.unescap.org/sites/default/files/CSN%20Report%202017_1.pdf
8 Available from https://www.unescap.org/sites/default/files/PACIFIC_PAPER_Final_Publication_1_1.pdf
24the prices of electricity in these countries, in many cases, extraordinarily high. The study also
found that elevated electricity prices are positively and statistically associated with low
broadband connectivity in those countries.
In addition, many countries with special needs are highly exposed and prone to natural
disasters. Some countries are situated in the most seismically active area in the world, the
Ring of Fire, with a large proportion of their population and infrastructure concentrated
within areas of high and very high seismic hazards. Once a disaster hits, human and economic
losses are generally massive given that these countries have less capacity available for
prevention, preparation and response. According to ESCAP’s Asia-Pacific Disaster Report
2017,9 countries with special needs have the highest average economic damage per year
compared to other countries in the region when measuring losses as a percentage of Gross
Domestic Product (GDP). SIDS and LDCs (1.1 and 0.9 per cent of GDP, respectively) are
particularly vulnerable. These costs are also expected to increase in the long-term (to 3.9 and
2.5 per cent of GDP for SIDS and LDCs, respectively). Disasters also have a significant impact
on private sector profitability and willingness to invest in ICT infrastructure in these countries.
ESCAP (2016) determined that when an uninsured business loses 10 per cent of its capital, it
would need to make a profit of 11 per cent to return to its pre-disaster capital level. If the
loss happens to be 50 per cent, it would then require 100 per cent profit to return to the same
level.10
Countries with special needs seem to have mixed regulatory policies in place. According to
ITU’s ICT regulatory database11, out of 13 countries which have reported the establishment
of a regulatory authority for the telecommunications sector, only 9 indicated that the
regulatory authority had autonomous decision-making. Further, only 9 countries indicated
that full competition was allowed for local fixed line and mobile services. International
gateway competition was only allowed in 7 countries, while 7 indicated that a universal
service fund was operational.
9 Available from https://www.unescap.org/sites/default/files/1_Disaster%20Report%202017%20Low%20res.pdf.
10 ESCAP, Disasters without Borders: Regional Resilience for Sustainable Development (Bangkok, 2016). Available from
https://www.unescap.org/sites/default/files/Full%20Report%20%20%5BLow-Res%5D.pdf.
11 Available from https://www.itu.int/net4/itu-d/icteye/FocusAreas.aspx?paramWorkArea=TREG.
25Chapter 2: Wi-Fi’s Role in Improving Internet Affordability in
Developing Countries
The ITU noted that about 96 per cent of the world’s population is living in areas reached by
mobile-cellular network; 12 however, in Asia and the Pacific, half of the population is not using
the Internet for a variety of reasons. One of the reasons is that Internet service is still
unaffordable for some groups, especially people living in rural and remote areas.
Wi-Fi13 can be an effective and low-cost technology with the potential to connect the
remaining half of the region’s population. An Alliance for Affordable Internet (A4AI) report
showed that across 59 assessed countries, the average price for a 1GB mobile prepaid data
plan was 5.5% of average monthly income14 -- above the study’s affordability target.15 As a
result, millions of people are excluded from transformative digital opportunities in
employment, education, health and financial services as well as being more vulnerable in
times of disaster.16
Public access solutions such as Wi-Fi are critical to reach groups that cannot afford regular
Internet use. According to a Cisco forecast (Figure 2.1)17, the number of total public Wi-Fi
hotspots (including homespots) will grow four-fold from 124 million in 2017 to 549 million in
2022 globally. Asia and the Pacific is predicted to lead the way with 45% of these hotspots
worldwide by 2022.
12ITU, ITU measuring the information society report (December 2018). Available from https://www.itu.int/en/ITU-
D/Statistics/Pages/publications/misr2018.aspx
13
According to CISCO, Wi-Fi is a wireless networking technology that enables devices such as computers
(laptops and desktops), mobile devices (smart phones and wearables), and other equipment (printers and
video cameras) to interface with the Internet. It allows these devices and many more to exchange information
with one another, creating a network. Internet connectivity occurs through a wireless router. When a person
accesses Wi-Fi, he/she is connecting to a wireless router that allows his/her Wi-Fi-compatible devices to
interface with the Internet.
14 Alliance for Affordable Internet (A4AI), New data: What’s the price of 1GB of mobile broadband across LMICs? (September
2018). Available from https://a4ai.org/new-mobile-broadband-pricing-data-2018
15 Alliance for affordable Internet (A4AI), 1GB of data must be available for 2% or less of average monthly income (April
2018). Available from https://a4ai.org/what-is-affordable-internet-access-anyway/
16 ESCAP, State of ICT Connectivity in Asia and the Pacific (January 2018). Available from:
https://www.unescap.org/sites/default/files/StateofICT2017_16Jan2018.pdf
17 CISCO, Cisco Annual Internet Report (2018–2023) White Paper (March 2020). Available from
https://www.cisco.com/c/en/us/solutions/collateral/service-provider/visual-networking-index-vni/white-paper-c11-
738429.html
26Figure 2.1 The Forecast of Public Wi-Fi hotspots development, 2017-2022 Cisco VNI report
Note: Middle East and Africa represents 1 percent of global public Wi-Fi hotspots by 2022.
Source: Maravedis, Cisco VNI Mobile, 2018.
This chapter will examine the role of Wi-Fi in promoting affordable broadband Internet. It will
review the use of Wi-Fi from the perspective of its capacity to fill the gaps described in
Chapter 1, expand broadband connectivity and realize broadband for all. It also reflects on
the synergy of affordable broadband access through Wi-Fi as an accelerator for digital
inclusion and SDG achievement in developing countries.
2.1. Role of Wi-Fi in the digital connectivity ecosystem
In recent years, Asia and the Pacific has seen a rapid proliferation in smart devices,
particularly smart phones. An online survey on mobile Internet in Asia and the Pacific
conducted by the Internet Society in September 201518 suggested that smart phones
continued to be the mobile device of choice for Internet users in the region. Across all age
groups in the survey, at least 94% of the respondents reported ownership of a smart phones
with the figure rising to 96% among 15-24 year olds. Other mobile devices have an inverse
trend. Tablet and wearable device ownership were the lowest among younger respondents
18Internet Society, Mobile Internet Usage Trends in Asia-Pacific (February 2016). Available from
https://www.internetsociety.org/wp-content/uploads/2017/08/Mobile20Internet20Usage20Trends20in20Asia-Pacific.pdf
27(15-24 year olds) with an average of 29% and less than 4%, respectively. Particularly for
developing countries, many users are true “mobile first” users as opposed to developed
countries where users shifted from a desktop to mobile phones. Thus, most Internet users in
developing countries experienced the Internet for the first time on smart phones.
Smart devices enable people not only to communicate more effectively but also to enjoy a
digitally inclusive life, such as social media, online shopping and health care. These activities
lead to higher rates of mobile traffic, which is rapidly increasing, particularly by video and
streaming services. A survey done by Pew Research19 in Emerging and Developing Nations
(2015) found that the primary use of Internet was to connect with friends and family, using
social media (Facebook, WhatsApp and Instagram) and entertainment (YouTube, video
streaming and downloading). This was followed by browsing the Internet for news, health
information, and government services. In India, a study by the Omidyar Network20 also
highlighted that social media and entertainment are the two most popular use cases of the
Internet.
As consumption of digital content on smart devices has grown rapidly, the effect on
bandwidth requirements has been significant from both the end user’s perspective as well as
Internet service providers’ (ISPs) network design. Not only is it a challenge in developing
countries, but also users in developed countries are constrained by demand for heavy
concurrent data usage requirements. A survey based on 2,149 respondents from the United
States21 found that more than half of smart phones users (55%) have data caps on their
wireless plans. Of those respondents, most (52%) either avoid doing certain activities like
watching videos or wait until they are in range of Wi-Fi to log on. A 2017 survey explored the
main reasons why smart phones owners in Japan access public Wi-Fi hotspots. It suggested
that over 62% of respondents used public hotspots to save data volume on their smart
19 Pew Research Center, Key takeaways on technology use in emerging and developing nations (March 2015). Available
from https://www.pewresearch.org/fact-tank/2015/03/19/key-takeaways-technology-emerging-developing-nations/.
20 Kudva, R., Tandan, M., Misra, A., & Nautiyal, S. Innovating for the next Next Half Billion. Available from
https://www.omidyar.com/sites/default/files/file_archive/Next%20Half%20Billion/Innovating%20for%20Next%20Half%20
Billion.pdf.
21 Horrigan, J.B., Smart phones and Broadband: Tech users see them as complements and very few would give up their
home broadband subscription in favor of their smart phones (November 2014). Available from
https://www.publicknowledge.org/assets/uploads/blog/Smart phones_and_Broadband.pdf.
28phones. Among them, 40% accessed Wi-Fi hotspots because it is free of charge and easy to
use.22
Figure 2.2 Main reasons for using public Wi-Fi hotspots, Japan, November 2017
Main reasons for using public Wi-Fi hotspots according to
smart phones users in Japan, November 2017
Saving data volume on my smartphone 62.3%
It`s free and easy to use service 40.0%
data transfer speed is high 25.3%
Access points are provided by areas I often
12.8%
visit
Don`t know 11.4%
other 1.2%
0.0% 10.0% 20.0% 30.0% 40.0% 50.0% 60.0% 70.0%
Sources: Compiled by ESCAP based on Statista data, the survey conducted by McAfee and MMD Labo; 15 to
17 November 2017; 1,556 respondents (15-69 years old)
Although some mobile carriers provide a so-called unlimited data plan, there are often speed
limitations upon reaching a certain threshold which again highlights the need for and
convenience of connecting to Wi-Fi. A report from Open Signal,23 shows that data speed is
unevenly and sparsely distributed in countries like Indonesia, India, Nigeria, Pakistan, Sri
Lanka, and the Philippines. For instance, the download speed in India is 4.17 megabits per
second15 (Mbps) even on the recently developed long-term evolution (LTE) networks. The
rapid increase in Internet subscriptions due to affordable mobile data has in turn contributed
to congestion problems. The result is often busy networks, dropped calls, poor signals and no
service. Another survey by Internet Society across 37 Asia-Pacific economies also shows that,
when accessing the Internet on their mobile devices, the majority of respondents (72%)
prefer to use Wi-Fi over a data connection (28%). Respondents cited slow mobile data speeds
22 Statista, 2017. Available from https://www.statista.com/statistics/804096/japan-public-hotspot-usage-reasons/.
23Open Signal, Global State of Mobile Networks (February 2017). Available from
https://www.opensignal.com/reports/2017/02/global-state-of-the-mobile-network
29and high costs as the main reasons. Such Wi-Fi preference is more prevalent in the case of
lower income countries.24
Cisco’s visual networking index white paper25 noted the Wi-Fi offload was initially considered
becoming less relevant after the emergence of 4G networks because of the latter’s faster
speed and more abundant bandwidth. 4G networks, however, have attracted high-usage
devices such as advanced smart phones and tablets and are also subject to data caps. Similar
data caps will be in store for 5G. For these reasons, according to the same Cisco forecast, Wi-
Fi offload is going to increase from 4G to 5G. Wi-Fi thus appears to be a feasible way to reduce
the cost of internet access and traffic offload for consumers as well as service providers.
24 Internet Society, Mobile Internet Usage Trends in Asia-Pacific (February 2016). Available from
https://www.internetsociety.org/wp-content/uploads/2017/08/Mobile20Internet20Usage20Trends20in20Asia-Pacific.pdf
25 Available from https://www.cisco.com/c/en/us/solutions/collateral/service-provider/visual-networking-index-vni/white-
paper-c11-738429.html
30Case study: Internet access in the Russian Federation
According to the Russian Federation’s Federal State Statistics Service,26
Internet users prefer cellular networks to Wi-Fi when using smart phones;
however, both access to Internet via cellular network and wireless networks
among mobile or smart phones users have been growing over time. Similar
to other Internet access methods, Wi-Fi continues to show an upward trend
in usage although at a slower rate than mobile or smart phones uses. The
conclusion is similar if we look at data splits by type of area as in Table 2.2.
The discrepancy of the Internet access between rural and urban, however,
does not seem to be significant. Table 2.3 disaggregated the Internet usage
by gender and showed that in Russia women tend to have less access to Wi-
Fi than men.
Table 2.1: Population using mobile device to access the Internet by type
of communication
% of the total population using the
Internet 2015 2016 2017
Mobile phone or smart phones 53.7 61.1 69.9
via cellular network 42.1 50.6 61.1
via wireless networks (Wi-Fi, etc.) 26.1 29.8 36.9
Laptop / Netbook 13.7 13.8 14.4
via cellular network 6.3 7.0 7.2
via wireless networks (Wi-Fi, etc.) 9.2 9.0 10.0
Tablet PC 11.4 11.9 12.4
via cellular network 6.0 6.8 7.5
via wireless networks (Wi-Fi, etc.) 7.9 8.0 8.7
Other devices 1.0 1.0 1.5
Source: Statistical publication Federal State Statistics Service “Information Society in the
Russian Federation”
31Table 2.2: Population using mobile device to access the Internet by type of
communication and geographical area
% of the total population using the Urban area Rural area
Internet 2015 2016 2017 2015 2016 2017
Mobile phone or smart phones 54.2 62.0 70.7 51.9 57.5 66.9
via cellular network 41.6 50.9 61.5 43.9 49.7 59.7
via wireless networks (Wi-Fi, etc.) 28.8 32.5 39.9 15.7 19.5 25.8
Laptop / Netbook 13.9 13.8 14.3 13.1 13.9 14.8
via cellular network 5.8 6.7 6.8 8.3 8.3 8.7
via wireless networks (Wi-Fi, etc.) 10.0 9.5 10.4 5.9 7.1 8.4
Tablet PC 12.3 12.8 13.0 7.8 8.6 10.0
via cellular network 6.2 7.1 7.8 5.1 5.4 6.4
via wireless networks (Wi-Fi, etc.) 8.9 8.8 9.5 4.2 4.7 5.7
Other devices 1.0 1.0 1.5 1.2 1.0 1.6
Source: Statistical publication Federal State Statistics Service “Information Society in the Russian
Federation”
Table 2.3: Population using mobile device to access the Internet by type of communication
and gender
% of the total population using Men Women
the Internet 2015 2016 2017 2015 2016 2017
Mobile phone or smart phones 57.4 64.4 73.0 50.4 58.1 67.2
via cellular network 44.9 53.4 63.7 39.5 48.1 58.8
via wireless networks (Wi-Fi, etc.) 28.0 31.5 39.1 24.4 28.2 34.9
Laptop / Netbook 14.2 14.2 14.9 13.3 13.4 14.0
via cellular network 6.6 7.2 7.5 6.1 6.9 7.0
via wireless networks (Wi-Fi, etc.) 9.6 9.5 10.5 8.8 8.6 9.5
Tablet PC 11.9 12.6 13.0 11.0 11.3 11.8
via cellular network 6.2 7.2 7.8 5.8 6.4 7.2
via wireless networks (Wi-Fi, etc.) 8.2 8.5 9.3 7.6 7.5 8.1
Other devices 1.1 1.1 1.7 0.9 1.0 1.4
Source: Statistical publication Federal State Statistics Service “Information Society in the Russian
Federation”
2.2 Potential for Wi-Fi to improve affordability
As previously mentioned, Wi-Fi can be utilized to offload generally more expensive cellular
network traffic. This is in the best interest of cellular network providers because “Wi-Fi offers
26Statistical publication “Information Society in the Russian Federation” (2018). Available from
http://www.gks.ru/free_doc/doc_2018/info-ob2018.pdf
32You can also read