Digital trends in the Commonwealth of Independent States region 2021 - Information and communication technology trends and developments in the CIS ...
←
→
Page content transcription
If your browser does not render page correctly, please read the page content below

ITUPublications                      International Telecommunication Union
Commonwealth of Independent States

  Digital trends in the
  Commonwealth of Independent                             CIS
  States region 2021
  Information and communication technology trends
  and developments in the CIS region, 2017-2020

Digital trends in the
         Commonwealth of
        Independent States
                region 2021
Information and communication
         technology trends and
       developments in the CIS
             region, 2017-2020
Disclaimer

The designations employed and the presentation of the material in this publication do not imply
the expression of any opinion whatsoever on the part of ITU concerning the legal status of any
country, territory, city or area or of its authorities, or concerning the delimitation of its frontiers or
boundaries.

The mention of specific companies or of certain manufacturers’ products does not imply that they
are endorsed or recommended by ITU in preference to others of a similar nature that are not
mentioned. Errors and omissions excepted, the names of proprietary products are distinguished
by initial capital letters.

All reasonable precautions have been taken by ITU to verify the information contained in this
publication. However, the published material is being distributed without warranty of any kind,
either expressed or implied. The responsibility for the interpretation and use of the material lies
with the reader.

The opinions, findings and conclusions expressed in this publication do not necessarily reflect
the views of ITU or its membership.

ISBN

978-92-61-33521-2 (Electronic version)
978-92-61-33531-1 (EPUB version)
978-92-61-33541-0 (Mobi version)

                    Please consider the environment before printing this report.

                                                  © ITU 2021

Some rights reserved. This work is licensed to the public through a Creative Commons Attribution-Non-
Commercial-Share Alike 3.0 IGO license (CC BY-NC-SA 3.0 IGO).

Under the terms of this licence, you may copy, redistribute and adapt the work for non-commercial purposes,
provided the work is appropriately cited. In any use of this work, there should be no suggestion that ITU
endorse any specific organization, products or services. The unauthorized use of the ITU names or logos is
not permitted. If you adapt the work, then you must license your work under the same or equivalent Creative
Commons licence. If you create a translation of this work, you should add the following disclaimer along
with the suggested citation: “This translation was not created by the International Telecommunication Union
(ITU). ITU is not responsible for the content or accuracy of this translation. The original English edition shall
be the binding and authentic edition”. For more information, please visit https://creativecommons.org/
licenses/by-nc-sa/3.0/igo/
Abstract

This report provides an overview of trends and developments in information and communication
technology (ICT) infrastructure, access and use in the CIS region, which includes 9 Member
States and is home to a population of 240 million people. The report highlights changes in ICT
adoption since the last World Telecommunication Development Conference in 2017 (WTDC-17)
and during the COVID-19 pandemic, tracks the evolution of regulation, and reviews progress
and challenges in implementing the ITU regional initiatives for the CIS region. Its objective
is to serve as a reference for the ITU membership in reviewing progress and identifying ICT
development priorities in the CIS region.

                                              iii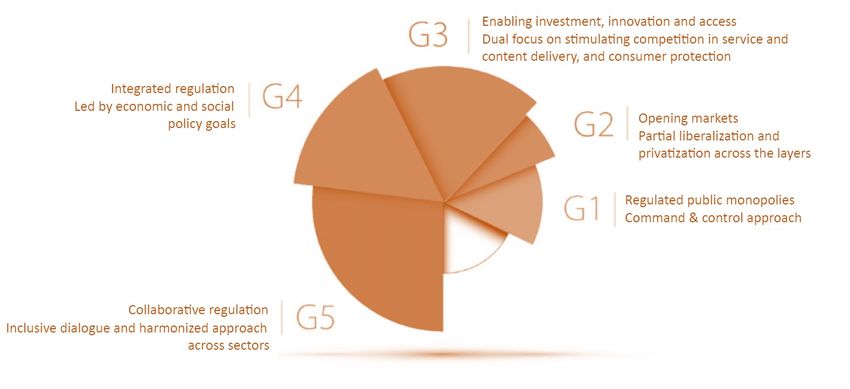
Table of Contents
Abstract��������������������������������������������������������������������������������������������������������������������������������������������iii

List of figures and boxes�����������������������������������������������������������������������������������������������������������������v

1.	Overview��������������������������������������������������������������������������������������������������������������������������������� 1

2.	     Digital trends in the CIS region ������������������������������������������������������������������������������������������� 4

        2.1       Mobile market developments����������������������������������������������������������������������������������� 6
        2.2       Satellite broadband developments ������������������������������������������������������������������������� 7
        2.3       Fixed-broadband market������������������������������������������������������������������������������������������� 8
        2.4       Internet access, use, skills, and gender������������������������������������������������������������������ 10
        2.5       ICT prices������������������������������������������������������������������������������������������������������������������� 15
        2.6       Telecommunication revenues and investment����������������������������������������������������� 17
        2.7       Developments regarding cybersecurity ��������������������������������������������������������������� 17
        2.8       ICT infrastructure developments and integrated technologies ������������������������� 21
        2.9       Digital services trends���������������������������������������������������������������������������������������������� 25

3.	     Regulatory trends in the CIS region���������������������������������������������������������������������������������� 27

        3.1       New collaborative regulatory paradigm ��������������������������������������������������������������� 27
        3.2       The G5 Benchmark for regulatory excellence������������������������������������������������������� 29
        3.3       Maturity of ICT regulatory frameworks in the CIS region������������������������������������ 31
        3.4 Economic contribution of broadband, digitization and ICT regulation
        in the CIS region������������������������������������������������������������������������������������������������������������������� 33

4       Opportunities and challenges of digital transformation ����������������������������������������������� 39

        4.1       Developments under the regional initiatives for the CIS region������������������������ 39
        4.2       Regional initiatives: Areas of progress������������������������������������������������������������������� 41
        4.3       Regional initiatives: Areas of challenge����������������������������������������������������������������� 42

5.	Conclusion���������������������������������������������������������������������������������������������������������������������������� 44

References������������������������������������������������������������������������������������������������������������������������������������� 46

                                                                          iv
List of figures and boxes
Figures
Figure 1: Global ICT indicators (per 100 inhabitants and per cent), 2019 and
2020, and CAGR, 2017-2019 and 2017-2020, where available������������������������������������������� 1
Figure 2: The accelerating impact of COVID-19 on digital transformation����������������������� 2
Figure 3: Key ICT statistics, ITU CIS region 2017-2020��������������������������������������������������������� 5
Figure 4: Mobile cellular subscriptions 2019, nine CIS countries ��������������������������������������� 6
Figure 5: Active mobile broadband subscriptions per 100 inhabitants, 2019, 9
CIS countries�������������������������������������������������������������������������������������������������������������������������������� 7
Figure 6: Satellite broadband subscriptions and CAGR 2017-2019, selected
CIS countries ������������������������������������������������������������������������������������������������������������������������������� 8
Figure 7: Fixed broadband subscriptions per 100 inhabitants 2019 and CAGR
2015-2019 in brackets, CIS region������������������������������������������������������������������������������������������� 8
Figure 8: Kbit/s per Internet user in 2019 and CAGR 2015-2019 for selected
CIS countries�������������������������������������������������������������������������������������������������������������������������������� 9
Figure 9: Household access, individuals using the Internet, total and by
gender, 2019, CIS region and world�������������������������������������������������������������������������������������� 10
Figure 10: Percentage of individuals using the Internet 2019, selected CIS
countries������������������������������������������������������������������������������������������������������������������������������������� 11
Figure 11: Proportion of households with Internet access 2019 and CAGR
2017-2019 in brackets, CIS countries������������������������������������������������������������������������������������� 12
Figure 12: Individuals using the Internet by gender, CIS region and selected
CIS countries, 2019������������������������������������������������������������������������������������������������������������������� 13
Figure 13: Penetration of basic, standard and advanced ICT skills as a
percentage of population for selected CIS countries (%), 2019���������������������������������������� 14
Figure 14: Mobile data prices as a percentage of GNI p.c. and monthly data
allowance, CIS region, 2019���������������������������������������������������������������������������������������������������� 15
Figure 15: Fixed broadband prices as a percentage of GNI p.c., speeds and
caps, CIS region, 2019�������������������������������������������������������������������������������������������������������������� 16
Figure 16: Total telecommunication investments in USD equivalent and as a
percentage of revenue, 2019, by CIS country (in brackets)������������������������������������������������ 17
Figure 17: National cybersecurity commitment, CIS region, ITU GCI 2018��������������������� 19
Figure 18: Landscape for AI, IoT and cloud technology in the CIS region��������������������� 21
Figure 19: E-government development in the CIS countries, EGDI 2020����������������������� 25
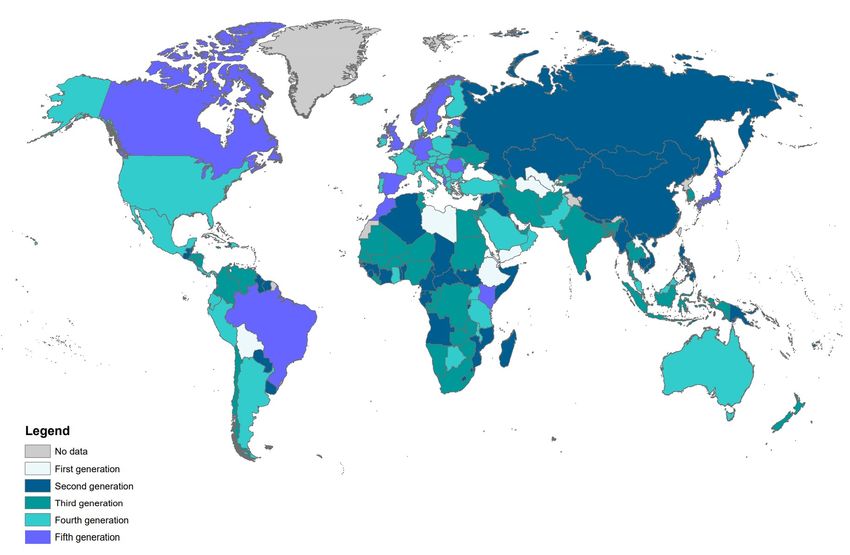
Figure 20: Evolution of the generations of ICT regulation, CIS region, 2007-2019������� 32
Figure 21: Economic impact of fixed and mobile broadband and digitization,
2019��������������������������������������������������������������������������������������������������������������������������������������������� 34
Figure 22: Regional initiatives - Areas of progress��������������������������������������������������������������� 41
v
Boxes

   Box 1: Data traffic trends���������������������������������������������������������������������������������������������������������� 10
   Box 2: ITU definition of different ICT skill levels������������������������������������������������������������������� 14
   Box 3: Measuring ICT prices at ITU����������������������������������������������������������������������������������������� 16
   Box 4: ITU Global Cybersecurity Index: CIS Region – A closer look���������������������������������� 20
   Box 5: 5G developments in the CIS region��������������������������������������������������������������������������� 22
   Box 6: COVID-19 impact on digital development in the CIS region��������������������������������� 23
   Box 7: Digital Kazakhstan: providing civil servants with digitalization training
   (taken from the 2020 UN E-Government Development Index (EGDI))����������������������������� 26
   Box 8: Collaborative regulation - A forward-looking concept�������������������������������������������� 28
   Box 9: ITU G5 Benchmark in a nutshell���������������������������������������������������������������������������������� 30
   Box 10: Digital Regulation Handbook and Platform������������������������������������������������������������ 33
   Box 11: The impact of policy, regulation and institutions on performance in
   the ICT sector����������������������������������������������������������������������������������������������������������������������������� 34
   Box 12: COVID-19 regulatory framework initiatives for CIS region����������������������������������� 36
   Box 13: CIS regional initiatives 2018-2021 – Definition, objectives and
   ongoing projects����������������������������������������������������������������������������������������������������������������������� 40

                                                                     vi
Digital trends in the Commonwealth of Independent States region 2021
1. Overview
While COVID-19 has dominated the headlines throughout 2020, consistent development and
deployment of ICT infrastructure and its concomitant services has meant a continued trend
towards digital transformation for societies, businesses and governments alike. Since WTDC‑17,
information and communication technologies (ICTs) have continued to spread. ITU data show
that in 2019 more than 50 per cent of individuals used the Internet (51.4 per cent globally by
the end of 2019), 75 per cent of the total world population had an active mobile broadband
subscription, and fixed broadband subscription had grown to just over 15 per cent. Today,
over 57 per cent of households have Internet access at home. Moreover, given the rise in data
demand owing to increasingly bandwidth-intensive services, international bandwidth has, on
average, grown at a compound annual growth rate (CAGR) of 36 per cent between 2017 and
2020, with a CAGR for international bandwidth per Internet user of 26 per cent between 2017
and 2019. Yet the digital divide persists. While almost all urban areas in the world are covered
by a mobile broadband network, many gaps remain in rural areas. The gender divide remains
a reality, it still being the case that fewer women than men benefit from Internet use (Figure 1).
Figure 1: Global ICT indicators (per 100 inhabitants and per cent), 2019 and
2020, and CAGR, 2017-2019 and 2017-2020, where available
15.2 75 51.4%* 48.3 % w/55.2 % m
(+5.7%) (+9.3%) (+3.5%)
Fixed broadband Mobile broadband Inidividuals using the Internet Women and men using the
subscrip�ons subscrip�ons Internet
96.7%*
(+0.2%) 72% 37% 57.4 %
(+3.7%)
Mobile network coverage Urban household Internet Rural household Internet Household Internetaccess
access access
93.1%* 84.7%* 717.9 tbit/s* 131.3 Kbit/s
(+1.9%) (+4%) (+35.7%) (+26.4%)
Percentage of popula�on Percentage of popula�on Total interna�onal Interna�onal bandwidth
within reach of a 3G signal within reach of a 4G signal bandwidth per Internet user
*2020 es�mate
Source: Based on ITU World Telecommunication/ICT Indicators (WTI) Database from 2017, 2019 and 2020, where
available.
As most countries across the world grapple with the effects of the COVID-19 pandemic, the
role of ICTs and services and the digital infrastructure on which they ride and grow have
become central to continued economic and societal activity and to lessening the impact of the
pandemic. The Economic Experts Roundtable organized by ITU in June 20201 concluded that
countries with top connectivity infrastructure could mitigate up to half of the negative economic
shock of the pandemic. Overall, the impact of the pandemic has been to accelerate digital
transformation, as businesses move towards distributed models of employment and digital
service and product delivery. Individuals forego travel and socializing and turn towards digital
1
The Economic Experts Roundtable was held on 26 June 2020 and produced the following GSR Discussion
Paper: https://www.itu.int/en/ITU-D/Conferences/GSR/2020/Documents/GSR-20_Impact-COVID-19-on
-digital-economy_Discussion-Paper_Final.pdf..
1
Digital trends in the Commonwealth of Independent States region 2021
entertainment and communication platforms and also, increasingly, to e-commerce. Schools
move to online learning and digital classrooms, and governments increasingly need data on
citizens, health and economic indicators to establish policies.
While research on the contribution of digitization to softening the impact of pandemics is
limited, emerging evidence of their accelerating effects across all areas of people’s lives and
economic sectors is compelling. For example, consumer and business surveys show that the
COVID-19 pandemic has pushed consumers and businesses alike to adopt digital services and
technologies, accelerating digital transformation in consumer behaviour and business activity
by several years (Figure 2).
Figure 2: The accelerating impact of COVID-19 on digital transformation
� Consumer surveys show that digital adop�on
among consumers has increased at an
accelerated pace, varying according to the
severity of restric�ons imposed in different
loca�ons.
Accelera�ng impact of COVID-19 on digital transforma�on
� Adop�on of digital technologies among
enterprises has accelerated by several years to
improve online consumer and supply-chain
interac�ons as well as internal opera�ons.
Source: ITU, based on insights from 2020 McKinsey consumer and enterprise surveys at https://www.mckinsey.com/
business-functions/mckinsey-digital/our-insights2
Generally, the pandemic has forced a greater demand for digital reliance across the board,
and this outcome is likely to be here to stay in the “new normal”, as the utility of more abundant
data and the ever-lower cost of using those data affect how entrepreneurs, policy-makers and
professionals make decisions. The pandemic, however, is just one driver of current trends.
Climate responsibility, continued economic development, demographic shifts and social well-
being are also key drivers in ensuring that no one is left behind.
In the light of these global trends, policy development focused on inclusion, access, security,
skills and sustainability in terms of emerging technologies and their benefits is poised to become
a defining characteristic of the 2020s. This is mirrored in the ITU regional initiatives for the
Commonwealth of Independent States (CIS) region and the associated thematic priorities,
which remain highly relevant going forward.3 The development of ICT skills and capacities is a
key priority for the region to accelerate digital transformation as a means of achieving better,
more inclusive outcomes, in particular for young people. Moreover, the development of relevant
content, applications and services and the fostering of an enabling environment, including
fit-for-purpose institutions, policies and accompanying mechanisms for implementation and
appropriate regulation, will all push consumers and businesses alike to adopt digital services
and digital technologies.
2
McKinsey Digital, Europe’s digital migration during COVID-19: Getting past the broad trends and averages
(2020), https://www.mckinsey.com/business-functions/mckinsey-digital/our-insights/europes-digital
-migration-during-covid-19-getting-past-the-broad-trends-and-averages;; and McKinsey & Company, How
COVID-19 has pushed companies over the technology tipping point—and transformed business forever
(2020), https://www.mckinsey.com/business-functions/strategy-and-corporate-finance/our-insights/how
-covid-19-has-pushed-companies-over-the-technology-tipping-point-and-transformed-business-forever..
3
https://www.itu.int/en/ITU-D/Regional-Presence/CIS/Pages/default.aspx
2Digital trends in the Commonwealth of Independent States region 2021
Artificial intelligence (AI), the Internet of Things (IoT), cloud computing, distributed ledger
technology, precision medicine, digital trade, autonomous mobility and many more evolving
technological arenas will shape the future of the world and the CIS region in it. There are many
examples in the region where such technologies are at work and can serve as an example
towards sustainable development and inclusive growth, addressing some of the region’s most
pressing challenges, in areas such as youth unemployment, natural resource management,
remote health, and the smart city.
Along with fit-for-purpose policy, ICT infrastructure is ultimately at the heart of this historical
transformation and the predominant enabler of the future competitiveness and prosperity
of the CIS region. Robust infrastructure on which emerging technologies ride can help meet
some of the region’s most pressing challenges. It is important not to lose sight of the fact that
improving ICT infrastructure is more than a goal for operators and consumers. It does much
more than support mobile and broadband connections: it serves as the backbone for global
and regional supply chain integration; makes possible the innovative use of critical health
information; creates opportunities for citizens to improve their options in the workforce; enables
students to acquire previously out-of-reach skillsets; and offers many more positive externalities
that are changing the course of history. Indeed, future history will look back at this early era of
technological development to see how policies and governance approaches reinforced the
resilience and responsiveness of societies, while assessing for risks, protecting consumers and
enabling positive outcomes for citizens.
3Digital trends in the Commonwealth of Independent States region 2021
2. Digital trends in the CIS region 4
The CIS region5 has a population of 240 million and consists of nine Member States, all of
which are classified by the UN as economies in transition. Eight of the nine CIS countries are
landlocked, and most fall into the upper-middle-income bracket,6 namely Armenia, Azerbaijan,
Belarus, Kazakhstan, the Russian Federation and Turkmenistan. Kyrgyzstan and Uzbekistan fall
into the lower-middle-income bracket and Tajikistan falls into the low-income group.7 Despite
some similarities, the CIS countries exhibit significant differences and face diverging challenges
in terms of population structure and dynamics, educational level, employment, and living
conditions.
Eight of the nine CIS countries are landlocked, which leaves them dependent on neighbouring
and coastal countries for access to undersea cables and international Internet bandwidth. In
addition, some CIS countries are very rural, which makes access to connectivity and rolling out
terrestrial communication infrastructure more difficult. Only two countries, namely the Russian
Federation and Belarus, have relatively high urban populations, in excess of 70 per cent. Based
on Eurostat data,8 the proportion of the population that lives in rural areas exceeds 60 per cent
in three countries: Tajikistan (more than 70 per cent), Kyrgyzstan and Uzbekistan; and it lies
above 50 per cent in Turkmenistan. (Kazakhstan and Azerbaijan have rates above 40 per cent.)
As regards age distribution, data from CISSTAT9 show that the share of young people (defined
as 15-29 years of age) ranges between 18 per cent and 29 per cent, depending on the country.
Consequently, digital development and ICT uptake across the CIS region differ with regard
to some of the key ICT indicators given these differences in geographic and demographic
variables. It should be noted that the percentage of young people is gradually decreasing
in most countries due to significant migration. This highlights the importance to the region
of retaining their young population, including by improving their quality of life and creating
new opportunities for this age group. Information and communication technologies can
be an important tool to develop such opportunities, in particular by creating attractive job
opportunities. This requires skilled youth and highlights the importance of education and
capacity and skills development, including in the area of ICTs.
Over the last four years, the CIS region has seen continued growth in most areas of ICT
infrastructure, access, and use. The region’s mobile cellular coverage, taken as the percentage
of the population that lives within reach of a mobile cellular signal, is estimated by ITU to be
98.6 per cent. Just under 90 per cent (88.7 per cent) of the population is now within reach of a
3G signal and 80.8 per cent is within reach of a long-term evolution (LTE) mobile broadband
4
Based mostly on 2019 data, with some preliminary data/estimates for 2020. Disaggregated data will be
reported when available and relevant (gender, age, rural/urban). CIS averages versus global will be reported
when relevant.
5
For the CIS region, this document follows the regional grouping used by ITU-D, see: https://www.itu.int/en/
ITU-D/Statistics/Pages/definitions/regions.aspx . Where data were only available for a subset of countries,
this is indicated.
6
As of 1 July 2019, low-income economies are defined by the World Bank as those with a gross national
income (GNI) per capita, calculated using the World Bank Atlas method, of USD 1 025 or less in 2018;
lower middle-income economies are those with a GNI per capita between USD 1 026 and USD 3 995;
upper middle-income economies are those where the figure falls between USD 3 996 and USD 12 375;
and high-income economies are those where it is USD 12 376 or more. (https://datatopics.worldbank.org/
world-development-indicators/stories/the-classification-of-countries-by-income.html))
7
UN 2020 “World Economic Situation and Prospects 2020”, Annex p.165-168
8
https://ec.europa.eu/eurostat/statistics-explained/index.php?title=File:Population_in_rural_areas
9
http//:www.cisstat.com/youth/rus/2018_youth_buklet_eng.pdf
4Digital trends in the Commonwealth of Independent States region 2021
signal. The percentage of individuals using the Internet has increased from 66.1 per cent in
2017 to 72.8 per cent at the end of 2019, with households that have Internet access at home
increasing from 73.4 per cent in 2017 to 76.4 per cent at the end of 2019. Both fixed and
mobile broadband markets have shown growth over the last three years, with active mobile
broadband subscriptions outpacing fixed broadband subscriptions. A relatively small gender
gap but a large rural/urban divide persist: In 2019, 71.7 per cent of women and 74 per cent of
men used the Internet. That year, only 49.6 per cent of rural households and 72.1 per cent of
urban households had access to the Internet (Figure 3). Among 15-to-24-year-olds, 84.5 per
cent used the Internet in 2019, which is higher than the regional average of Internet use of 72.8
per cent (Figure 3).10
The COVID-19 crisis, which unleashed multiple shocks in the CIS region, underscores the
importance of digital connectivity to society and has highlighted the impact of the persistent
digital divide for many people in the region who are still unable to connect to the Internet (see
Box 6).
Figure 3: Key ICT statistics, ITU CIS region 2017-2020
Mobile network coverage Internet access and use Digital divide
2017 2020*
66.1% 72.8%
2020* 98.6% Individuals using (2019) 74% 71.7%
the Internet (%)
Digital
88.7% 73 87.7 divide
Internet access using
mobile BB per 100 2019
inhabitants
80.8% 72.1%
17.8 19.5
Internet access
*Es�mate using fixed BB per
100 inhabitants
49.6%
Household Internet and computer access at home, Internet use by youth (15-24 years old), 2019
� 76.4 per cent of householdsin � 65.4 per cent of households in the CIS � 84.5 per cent of 15-24-year-
the CIS region had Internet access region had access to a computer at olds in the CIS region were
at home in 2019 home in 2019 using the Internet in 2019
GNI per capita and total telecommmunica�on investments
� The majority of the countries in the CIS region are upper-middle-income � The Russian Federa�on is the largest
economies. Only two coutnries, namely Kyrgyzstan and Uzbekistan are telecommunica�ons market in the region,
lower-middle income coutnries and Tajikistan is a low-income country.* given its popula�on size.
GNI � According to World Bank data, the average GNI p.c. (Atlas method) of � ITU data show that total telecommunica�on
p.c. countries in the region is about USD 5 149, including the Russian investments for the region amounted to
Federa�on with a GNI p.c of USD 11 260.** USD7.5 billion in 2019, with 85 per cent of
� 3 of the 9 countries in the CIS region had a GNI p.c. of less than USD 2 000, investments made in the Russian Federa�on.
namely Kyrgyzstan, Tajikistan and Uzbekistan.
*Income classifica�on is based on the UN’s country classifica�on by GNI per capita, see UN 2020 “World
Economic Situa�on and Prospects 2020”, Annex p.165-168 ;**For GNI p.c., countries are selected based on ITU
regions, where data are available. Data used are from the World Bank 2019. See:
h�ps://databank.worldbank.org/indicator/NY.GNP.PCAP.CD/1ff4a498/Popular-Indicators#
Source: ITU, WTI Database and World Bank data (for GNI data and country income classification)
10
Measuring digital development, Facts and Figures 2020, https://www.itu.int/en/ITU-D/Statistics/Pages/facts/
default.aspx
5Digital trends in the Commonwealth of Independent States region 2021
2.1 Mobile market developments
The CIS mobile market is very advanced, with mobile cellular subscriptions surpassing100
subscriptions per 100 inhabitants in all nine CIS countries. The region is led by the Russian
Federation and Turkmenistan, with more than 150 subscriptions per 100 inhabitants each.
For the CIS region as a whole, the 2020 average subscription rate is estimated by ITU at 148.2
per 100 inhabitants, which is well in excess of the world average of 105 subscriptions per 100
inhabitants (Figure 4).
Figure 4: Mobile cellular subscriptions 2019, nine CIS countries
180 164 163
160 139
140 134
123 122
120 112 107 105 101
100
80
60
40
20
0
s
*
ia
n
n
n
an
n
n
n
ru
ld
ija
ta
ta
ta
ta
en
io
st
or
la
hs
is
is
is
ba
at
m
yz
Be
W
ek
jik
en
ak
er
Ar
er
rg
zb
Ta
km
d
z
Az
Ky
Ka
Fe
U
r
Tu
an
si
s
Ru
Source: Based on ITU WTI Database, *2020 estimate
Average active mobile broadband subscriptions in the CIS region are fairly high and have
reached 88 per 100 inhabitants in 2019, 13 percentage points above the world average of
75. However, while four countries, namely Kyrgyzstan, the Russian Federation, Kazakhstan and
Belarus lead the region in mobile broadband subscriptions with rates of 90 and well above
90 per 100 inhabitants, four countries have subscription rates below the world and CIS region
averages, exhibiting great variation (Figure 5). While active mobile broadband subscriptions
are very low in Turkmenistan and Tajikistan, GSMA estimates that in the period 2019-2025 the
number of mobile Internet users will increase by 116 per cent in Turkmenistan and by 106 per
cent in Tajikistan. For the CIS region overall, GSMA predicted growth in mobile Internet users
of 24 per cent for the same period, with increases of 63 per cent in Uzbekistan, 54 per cent in
Kazakhstan, and 40 per cent in Armenia.
6Digital trends in the Commonwealth of Independent States region 2021
Figure 5: Active mobile broadband subscriptions per 100 inhabitants, 2019,
9 CIS countries
140
123
120
97
100 90 90 88 83
80 75
67 62
60
40
23
20 15
0
s
*
ia
on
an
n
n
n
an
n
n
ru
ld
ija
ta
ta
ta
en
tio
st
gi
st
or
la
is
is
is
ba
kh
m
ra
yz
re
Be
ek
W
jik
en
Ar
er
de
rg
za
S
zb
Ta
m
CI
Az
Ky
Ka
Fe
rk
U
Tu
an
si s
Ru
Source: Based on ITU WTI Database, *2020 estimate
2.2 Satellite broadband developments
Satellite broadband in the CIS region, as in other regions, may offer an effective means to close
the digital divide and address remaining connectivity gaps, in particular in remote or hard-to-
reach areas. ITU data for satellite broadband subscriptions11 are available for four of the nine
CIS countries, with the biggest markets in terms of number of subscriptions being those of the
Russian Federation and Kazakhstan. While broadband satellite subscriptions have increased
in the Russian Federation and in Azerbaijan over the period 2017-2019, subscriptions have
declined in Kyrgyzstan and Kazakhstan over the same period (Figure 6).
11
Satellite broadband subscriptions refers to the number of satellite Internet subscriptions with an advertised
download speed of at least 256 kbit/s. It refers to the retail subscription technology and not the backbone.
7Digital trends in the Commonwealth of Independent States region 2021
Figure 6: Satellite broadband subscriptions and CAGR 2017-2019, selected
CIS countries
Number of satellite broadband subscrip�ons and CAGR 2017-2019
Russian Federa�on +22% Kyrgyzstan -31%
Azerbaijan +15% Kazakhstan- 6%
Satellite broadband Satellite broadband
Subscrip�ons 2017 Subscrip�ons 2019
Kyrgyzstan 91 43
Satellite broadband
Azerbaijan 50 66
subscrip�ons in
selected CIS countries
Kazakhstan 2400 2100
Russian Federa�on 46067 68107
Source: ITU, based on ITU WTI Database
2.3 Fixed-broadband market
The fixed-broadband market in the CIS region is very mixed, with some penetration rates as
high as 34 per 100 inhabitants, well above the world average, and others as low as 0.1 per 100
inhabitants. ITU data show an average fixed broadband penetration level of 19.5 subscriptions
per 100 inhabitants for the CIS region as a whole in 2020, which is above the global average
of 15.2 subscriptions per 100 inhabitants. That average hides very low penetration levels in
Kyrgyzstan (4.2), Turkmenistan (0.1) and Tajikistan (0.1). Within the region, only Belarus, the
Russian Federation and Azerbaijan have achieved a level of fixed broadband subscriptions
higher than the global average, with Uzbekistan, Kazakhstan and Armenia only 1 to 2 percentage
points below the global average (Figure 7).
Figure 7: Fixed broadband subscriptions per 100 inhabitants 2019 and CAGR
2015-2019 in brackets, CIS region
Belarus Russian Azerbaijan Uzbekistan Kazakhstan Armenia Kyrgyzstan Turkmenistan Tajikistan
Federa�on
34 19.3 13.9 13.5 13 4.2 0.1 0.1
22.5
(+2.5%) (+5%) (-0.5%) (24.6%) (+0.8%) (+7.4%) (+4.3%) (26.9%) (-2.4%)
Source: ITU, based on ITU WTI Database
Given that eight out of nine CIS countries are landlocked, the availability of international
bandwidth continues to be an important area for policy and investment, especially considering
the rising amount of data-intensive applications and cloud-based services and the increasing
numbers of Internet users desiring better international connectivity. Total international
bandwidth in the CIS region has increased over the last three years from 11 Tbit/s in 2017 to
19 Tbit/s in 2020. At the individual user level, bandwidth in the CIS region amounted to 71.6
8Digital trends in the Commonwealth of Independent States region 2021
kbit/s in 2019, compared to 131.3 kbit/s globally. This shows that despite a higher than global
average Internet penetration, Internet speeds across the region are much lower than globally.
At the country level, bandwidth per Internet user increased in the majority of the countries
for which data were available for 2019. More than half of the countries shown in Figure 8 had
bandwidth growing at a CAGR of 10 per cent or more, including Armenia, the Russian Federation,
Turkmenistan, Azerbaijan and Belarus. A significant outlier is Uzbekistan, with a CAGR of 134 per
cent.12 Countries that exhibited low or no growth include Kyrgyzstan, Kazakhstan and Tajikistan,
with a CAGR of 5 per cent or less (Figure 8).
Figure 8: Kbit/s per Internet user in 2019 and CAGR 2015-2019 for selected
CIS countries
250 160
140
134%
200
120
100
Kbit/s per Internet user in 2019,
CAGR 2015-2019 (%)
150
selected CIS countries
80
60
100
40
35%
23% 20
50 18%
14%
10%
5%
1% 0
-4%
2 2
0 -20
s
ia
n
n
n
n
n
n
ru
n
ija
ta
ta
ta
ta
en
ta
io
la
hs
is
is
zs
ba
is
at
m
Be
ek
ik
en
ak
y
er
Ar
er
rg
j
zb
Ta
km
z
d
Az
Ky
Ka
Fe
U
r
Tu
an
si
s
Ru
Kbit/s per Internet user in 2019, selected CIS countries CAGR 2015-2019 (%)
Source: ITU, based on ITU WTI Database
12
The response from the country regarding the reason for the high increase 2019: “The spike in kbit/s per
Internet user can be explained, given that the national telecom operator Uzbektelecom implemented a
project to expand the capacity of the Uzbekistani international packet switching centre. With completion of
the project, the throughput of the international packet switching centre was increased to 1200 Gbit/s.”
9Digital trends in the Commonwealth of Independent States region 2021
Box 1: Data traffic trends
According to GSMA, data traffic is on the rise, with widening 4G coverage and rising
smartphone adoption driven by the increased engagement of consumers across the
CIS region with mobile services. In its report “The Mobile Economy Russia and CIS
2020”, GSMA finds that consumers are using their devices on a more regular basis to
access not only Internet-based messaging and social media (domestic platforms VK
and OK are often more popular than the USA-based Facebook and Twitter) but also
entertainment content (especially YouTube) and other digitally delivered services,
such as health care and education. This development is particularly striking in the
Russian Federation, where e-government services are increasingly accessed by
smartphone users on a monthly basis. Many governments in the region prioritize
digital government services within their digital agendas; an example is Uzbekistan’s
“Digital Uzbekistan 2030” strategy.
Source: GSMA, “The Mobile Economy Russia and CIS 2020”, p. 16
2.4 Internet access, use, skills, and gender
The CIS region is well above the world average in terms of Internet access at home, number of
individuals using the Internet, and women’s and men’s use of the Internet. As shown in Figure 9,
for the CIS region as a whole 76.4 per cent of households had Internet access and 72.8 per cent
of individuals were using the Internet in 2019. While women still trail men in Internet use across
the CIS region, the gender gap is one of the smallest globally. A more detailed examination of
the Internet gender gap is presented in Figure 12, showing that on an individual country level,
Internet use by women is much higher in a number of CIS countries compared to the global
average, and in some countries the gender gap is reversed, with more women than men using
the Internet.
Figure 9: Household access, individuals using the Internet, total and by gender,
2019, CIS region and world
2019
Internet acess at home Individuals using the Internet Women Men
CIS region 76.4% 72.8% 71.7% 74%
World 57.4% 51.4% 48.3% 55.2%
Source: Based on ITU WTI Database, *2020 estimate
10Digital trends in the Commonwealth of Independent States region 2021
The percentage of individuals using the Internet is fairly homogeneous across the CIS region,
led by Belarus, the Russian Federation, Kazakhstan and Azerbaijan with percentages above
80 per cent (Figure 10). GSMA estimates in “The Mobile Economy Russia and CIS 2020” that
smartphone adoption across the region is expected to reach 81 per cent by 2025, partly due
to the availability of lower cost handsets, which will have a knock-on effect on mobile data
consumption across the region.13
Figure 10: Percentage of individuals using the Internet 2019, selected CIS
countries
90
Percentage of individuals using the Internet
80 82.6 82.8
81.1 81.9
2019, selected CIS countries
70
60 66.5
50
40
30
20
10
0
Azerbaijan Russian Kazakhstan Belarus Armenia
Federation
Source: ITU, based on ITU WTI Database 2020. No data were available for Kyrgyzstan, Tajikistan, Turkmenistan and
Uzbekistan.
According to GSMA, although 4G has now become the leading mobile technology in the CIS
region, a sizable proportion of the CIS population was not connected to the mobile Internet
at the end of 2019. As ITU data show, while 98 per cent of individuals were covered by a
mobile network, 88.7 per cent were within reach of a 3G signal and 80.8 per cent within reach
of an LTE signal, only 72.8 per cent were using the Internet, mainly because of the high cost
of smartphones, relative to average income levels, and the lack of content and apps available
in local languages.14 In addition, the Alliance for Affordable Internet (A4AI) has identified
lack of quality of access, which it has termed “meaningful connectivity”,15 as one key reason
why people are not using the Internet. While GSMA’s Mobile Connectivity Index shows that
infrastructure has seen the biggest improvement in the CIS region, alongside modest increases
in all other categories over the period 2016-2019, more needs to be done to ensure that access
to meaningful connectivity can be achieved to close the usage gap.16
In terms of households with Internet access, the CIS region is well above the global level, with
an average penetration rate of 76.4 per cent, as compared to 57.4 per cent globally (see Figure
9). Taking a closer look at the individual countries, ITU data show that household Internet access
is fairly homogeneous across the region, with Kazakhstan leading the region with 90.3 per
13
“The Mobile Economy in the Russia and CIS 2020”, p. 3
14
GSMA, “The Digital Economy Russia and CIS 2020”, p.33
15
https://a4ai.org/meaningful-connectivity/
16
See pages 34 of GSMA’s “The Mobile Economy Russia and CIS 2020” report.
11Digital trends in the Commonwealth of Independent States region 2021
cent, followed by Uzbekistan with 80.4 per cent. Only two countries, namely Turkmenistan and
Tajikistan, are below both the regional and the global averages. Household Internet access has
grown in all countries, with the most significant increases being 110 per cent in Turkmenistan
and 83 per cent in Kyrgyzstan (Figure 11).
Figure 11: Proportion of households with Internet access 2019 and CAGR
2017-2019 in brackets, CIS countries
Kazakhstan Uzbekistan Belarus Azerbaijan Russian Kyrgyzstan Armenia Turkmenistan Tajikistan
90.3% 80.4% 78.6% 79.18% Federa�on 76.4% 49%
70% 27% Proportion of
(+3.2%) (+0.33%) (+8.14%) (+0.29%) 76.9% (+2.2%) (+110%)
(+82%) households with
(+0.42%)
Internet access
2019
Source: ITU, based on ITU WTI Database for 2017 and 2019.
In terms of the digital divide, a small gender gap was observed in the CIS region in 2020, with
a small improvement as compared to the previous year.17 While on average 71.7 per cent of
women and 74 per cent of men used the Internet in the CIS region in 2020, globally only 48.4
per cent of women and 58.5 per cent of men used the Internet that year, making the CIS region
one of two regions closest to gender parity with a 2019 gender parity score18 of 0.79 per cent.
Taking a closer look at selected countries for which data were available shows that in Armenia
and Belarus, more women were using the Internet than men. In Azerbaijan, the percentage
difference in Internet use between men and women was highest with 6.2 percentage points
difference, whereas in the Russian Federation and Kazakhstan the difference was less than 2
percentage points.
17
ITU Facts and Figures 2019 and ITU Facts and Figures 2020 show that the percentage difference between
men and women using the Internet was 2.6 per cent in 2019 and 2.3 per cent in 2020.
18
The gender parity score is calculated as the proportion of women who use the Internet divided by the
proportion of men. A value smaller than 1 indicates that men are more likely to use the Internet than women,
while a value greater than 1 indicates the opposite. Values between 0.98 and 1.02 reflect gender parity.
12Digital trends in the Commonwealth of Independent States region 2021
Figure 12: Individuals using the Internet by gender, CIS region and selected
CIS countries, 2019
Russian
Azerbaijan Kazakhstan Belarus Armenia
Federa�on
(m/w) (m/w) (m/w) (m/w)
(m/w)
84.2%/78% 82.8%/81% 82.5%/83% 65.8%/67.2%
83.4 %/82%
7
6.2
men’s and women’s Internet use*
Percentage difference between
6
5 2020 74% 71.7 %
4 2019 73.6% 71 %
3
1.8
2 1.4
1
0
-1 -0.5
-2 -1.4
Azerbaijan Russian Kazakhstan Belarus Armenia
Federation
Source: Based on ITU WTI Database 2020. No data were available for Kyrgyzstan, Tajikistan, Turkmenistan and
Uzbekistan. *Where the percentage difference is negative, more women than men use the Internet.
Only limited data were available for basic and standard ICT skill levels across the CIS region
(see Box 2 for definitions of skill levels), with almost no data available for advanced ICT skill
levels. Data available for selected countries show that the levels reached in basic, standard and
advanced ICT skills vary across the different skill categories as well as countries, with Azerbaijan
and Belarus leading in basic skills with levels above 40 per cent. Levels of standard skills are
highest in Kazakhstan at 22.8 per cent, followed by Belarus with 18.8 per cent and the Russian
Federation with 14 per cent. Uzbekistan has the lowest skill penetration for both basic (13.6 per
cent) and standard (6.8 per cent) skills. The most homogeneous ICT skill levels can be found in
Kazakhstan, with a basic skills level of 28.4 per cent and a standard skills level of 22.8 per cent.
The data suggest that there is still significant potential for skill development, in particular as
regards standard and advanced skills (Figure 13).
13Digital trends in the Commonwealth of Independent States region 2021
Figure 13: Penetration of basic, standard and advanced ICT skills as a
percentage of population for selected CIS countries (%), 2019
Azerbaijan: basic 42.2 – standard 12.9 – advanced N/A
Belarus: basic 40.1 – standard 18.8 – advanced 2
Russian Federa�on: basic 38.6 – standard 14 – advanced 1.3
Kazakhstan: basic 28.4 – standard 22.8 – advanced N/A Basic, standard and
advanced ICT skills for
selected CIS countries as
a percentage of
Uzbekistan: basic 13.6 – standard 6.8 – advanced N/A
population (%), 2019
Source: Based on ITU WTI Database, figures for Uzbekistan are from 2018.
Box 2: ITU definition of different ICT skill levels
For each economy, the value for basic skills is the average value of available recent data
for the following four computer-based activities: copying or moving a file or folder;
using copy and paste tools to duplicate or move information within a document;
sending e-mails with attached files; and transferring files between a computer and
other devices.
The value for standard skills is the average value of available recent data for the
following four computer-based activities: using basic arithmetic formula in a
spreadsheet; connecting and installing new devices; creating electronic presentations
with presentation software; and finding, downloading, installing and configuring
software.
The value for advanced skills is the value for writing a computer program using a
specialized programming language.
Source: ITU
14Digital trends in the Commonwealth of Independent States region 2021
2.5 ICT prices
ITU data show that telecommunication and ICT services are becoming more affordable and
that prices have generally followed a downward trend over the last four years around the world,
including for mobile voice, mobile data and fixed broadband baskets. At the regional level, the
CIS is among the regions with the most affordable prices, just behind Europe with the most
affordable prices. The ITU report “Measuring Digital Development: ICT Price Trends 2019”19
provides a detailed examination and discussion of ICT price trends.
The CIS region is a relatively homogeneous region, with all countries having a mobile data
basket costing less than five per cent of GNI per capita. Five CIS countries have achieved the
target set by the Broadband Commission for Sustainable Development: Kazakhstan, Belarus,
the Russian Federation, Armenia and Azerbaijan. The most affordable basket can be found in
Kazakhstan, whereas the least affordable baskets can be found in Turkmenistan and Tajikistan.
Figure 14: Mobile data prices as a percentage of GNI p.c. and monthly data
allowance, CIS region, 2019
8
7
6
As a % of GNI p.c.
5
4
2% UN Broadband
Commission
3 affordability target
2
1
0
an
n
s
n
ia
an
an
an
an
ru
�o
ija
en
st
st
ist
ist
st
la
ba
ra
ki
m
kh
yz
Be
en
jik
be
de
er
Ar
rg
za
Ta
m
Az
Uz
Fe
Ky
Ka
rk
n
Tu
ia
ss
Ru
Source: ITU Pricing data March 2020
As regards the affordability of fixed services, in most of the countries in the CIS region the fixed
broadband baskets are relatively affordable, and four countries have achieved the target set
by the Broadband Commission for Sustainable Development: the Russian Federation, Belarus,
Kazakhstan and Azerbaijan. Except in the Russian Federation, however, the advertised download
speeds are not very high. In three countries—Belarus, Uzbekistan and Tajikistan—data caps are
in place ranging from 5.8 GB to 30 GB per month.
19
https://www.itu.int/en/mediacentre/Pages/pr08-2020-Measuring-Digital-Development-ICT-Price-Trends
-2019.aspx
15Digital trends in the Commonwealth of Independent States region 2021
Figure 15: Fixed broadband prices as a percentage of GNI p.c., speeds and
caps, CIS region, 2019
9.0 Unlimited Fixed cap
30 GB
8.0 100 Mbit/s
18 Mbit/s
7.0
As a % of GNI p.c.
4 Mbit/s
6.0 1-2 Mbit/s
5.0 0.25 Mbit/s
2% UN Broadband
4.0 N/A
5.8 GB
Commission
affordability target
3.0
10 GB
2.0
1.0
0.0 ia
an
an
n
n
s
an
an
an
ru
�o
ija
en
st
st
ist
st
ist
la
ba
ra
m
kh
ki
yz
Be
en
jik
be
de
Ar
er
rg
za
Ta
m
Az
Ky
Uz
Fe
Ka
rk
n
Tu
ia
ss
Ru
Source: ITU ICT price data March 2020
Box 3 provides an overview of how ITU measures ICT prices.
Box 3: Measuring ICT prices at ITU
ITU and its partners and stakeholders devote considerable time and effort to
developing and refining price methodologies, in particular through the Expert Group
on Telecommunication/ICT Indicators (EGTI). ITU maintains a set of different price
baskets to reflect different usage patterns and behaviour. In 2017, ITU updated and
adjusted its price baskets to reflect current developments in the fixed and mobile
broadband markets. The price baskets cover three different technologies: mobile-
voice, mobile-data and fixed-broadband.
In addition, the 2017 revision introduced combined data-and-voice baskets, as a
first attempt to monitor the prices of bundled services, which is now a very common
commercial practice.
The mobile-data-and-voice baskets include voice, text messages and data for two
different consumption levels. The low-consumption mobile-data-and-voice basket
includes 70 voice minutes, 20 SMSs and 500 MB of broadband data while the high-
consumption basket includes 140 voice minutes, 70 SMSs and 1.5 GB of broadband
data.
Source: From ITU, “Measuring Digital Development, ICT Price Trends, 2019”
16Digital trends in the Commonwealth of Independent States region 2021
2.6 Telecommunication revenues and investment
ITU data, where available, show that total telecommunication investments in the CIS region
amounted to USD 7.5 billion in 2019. Most investments were made in the Russian Federation,
accounting for almost 85 per cent of total investments in 2019. For most countries, the levels
of investments as a percentage of revenue was between 15 per cent and 25 per cent (Figure
16). Despite the economic uncertainty brought about by the COVID-19 pandemic, GSMA
estimates that operators in the region will invest more than USD 25 billion in infrastructure roll-
outs between 2020 and 2025, 57 per cent of which will be 5G-specific.20
Figure 16: Total telecommunication investments in USD equivalent and as a
percentage of revenue, 2019, by CIS country (in brackets)
7000 30
6,424.30
Total telecommunication investments in USD million,
6000
24.7% 24.6% 24.7% 25
5000
Percentage of revenue, 2019
2019, by CIS country
20
19% 18.6% 19%
4000
15
3000
10
9.5%
2000
5
1000
321.8 276.1 212.8 191.4
61.1 59.2
0 0
Russian Azerbaijan Belarus Kazakhstan Uzbekistan Armenia Kyrgyzstan
Federation
Total telecommunication investments in USD million, 2019, by CIS country
Total telecommunication investments in USD million equivalent as a percentage of revenue, 2019, by CIS country
Source: Based on ITU WTI Database
2.7 Developments regarding cybersecurity
Cybersecurity is key to ensuring a trusted and sustainable digital transformation. This is
particularly evident during situations of crisis, such as the COVID-19 pandemic, where
many of an organization’s activities and much of its communication move online and where
cyberdefences might be lowered due to a shift of focus to the health crisis. Based on an Interpol
assessment of the global landscape on COVID-19 cyberthreats, there were significant increases
across all areas of cybercrime, including online scams and phishing, data-harvesting malware
and disruptive malware/ransomware, as well as the exploitation of vulnerabilities of systems,
networks and applications used by businesses, governments and schools to support staff who
are now working remotely.21
20
GSMA, The Mobile Economy Russia and CIS 2020, p. 18-19
21
https://www.interpol.int/en/content/download/15217/file/Global%20landscape%20on%20COVID-19
%20cyberthreat.pdf
17Digital trends in the Commonwealth of Independent States region 2021
McAfee estimated that in 2020, cybercrime led to a monetary loss of USD 1 trillion. Therefore, fit-
for-purpose cybercrime legislation, strategies and frameworks, as well as computer emergency
response teams, capabilities, awareness and capacities are key to advancing sustainable
economic and socio-economic development.
Since 2015, ITU has published the Global Cybersecurity Index (GCI) to measure the commitment
of each ITU Member State across the five pillars of cybersecurity (see Box 4 for a description
of these pillars). The GCI is an ITU initiative involving experts from different backgrounds and
organizations.
The CIS region is on its way to ensuring that the use of ICTs is safe and secure, with most
countries for which data were available having either started to initiate or having already
developed complex commitments in cybersecurity as shown in Figure 17. In this regard, GCI
2018 shows that all of the CIS countries have cybercrime legislation and cybersecurity regulations
in place (see Box 4). Moreover, two countries, namely the Russian Federation and Kazakhstan,
demonstrate high commitment in all five pillars of the index, while four countries, namely
Armenia, Azerbaijan, Belarus and Uzbekistan, have developed complex commitments and
engage in cybersecurity programmes and initiatives. Kyrgyzstan, Tajikistan and Turkmenistan
have started to initiate commitments in cybersecurity. The Russian Federation, Kazakhstan
and Uzbekistan have obtained the top three scores in the CIS region across all five GCI pillars
(Figure 17).22
Taking a closer look, the Russian Federation scores the highest in almost all the pillars except
in the cooperation pillar, where Uzbekistan has the best score. Kazakhstan scores well, with
a close second place in all pillars but cooperation. The Russian Federation ranks first with
a good score in the legal pillar. The country has reinforced compliance and regulations for
fraud prevention and management with the use of electronic payment systems. The entire
financial system has been enhanced to ensure confidence in using online electronic payments.
Kazakhstan ranks second, with a good score in the legal pillar. It has unified the requirements in
the field of information and communication technologies and information security. Uzbekistan
ranks third, with a good score in the cooperation pillar. The country has signed a memorandum
of understanding (MoU) with different agencies in neighbouring countries. It has also developed
a strong public-private partnership, including with foreign companies.
22
https://www.itu.int/en/ITU-D/Cybersecurity/Pages/global-cybersecurity-index.aspx, see GCI Report 2018
p.27
18Digital trends in the Commonwealth of Independent States region 2021
Figure 17: National cybersecurity commitment, CIS region, ITU GCI 2018
Russian Federation Kazakhstan
Countries that demonstrate high commitment
Uzbekistan Belarus Azerbaijan Armenia
Countries that have developed complex
commitments and engage in cybersecurity
programmes and initiatives
Kyrgyzstan Tajikistan Turkmenistan
Countries that have started to initiate
commitments in cybersecurity
19You can also read