FOREWORD July 20, 2021 - National Conference on Citizenship
←
→
Page content transcription
If your browser does not render page correctly, please read the page content below
July 20, 2021
FOREWORD
A civic ecosystem has been burgeoning for decades in the South, and it now offers an opportunity to turn the
tragedy of this pandemic into an opportunity to build prosperity and progress for all. Data and civic engagement will
be critical. In 2019, Stacey Abrams founded the Southern Economic Advancement Project (SEAP) to lift up policies
that address particular vulnerabilities in the South such as underfunded public health infrastructure, thin protections
for workers, and weak supports for the unemployed, families, and children. That same year, Abrams founded Fair
Count to achieve a fair and accurate count in the 2020 Census while strengthening pathways to continued civic
participation. Together, SEAP and Fair Count commissioned the National Conference on Citizenship to document the
state of the South during the pandemic.

Healthcare. A record number of people are enrolling in ACA health insurance plans, which offer deeper
subsidies and an expanded window for enrollment. However, even more Southerners could be insured if the
remaining 7 Southern states adopted Medicaid expansion. Without Medicaid expansion, rural communities are
disproportionately impacted. Rural hospitals are left to treat too many uninsured patients, receive insufficient
reimbursement for the care they provide, and face closure, contributing to a downward spiral for rural
communities during the greatest public health crisis of our times.

Employment. The South continues to have 1.4 million fewer jobs than in February 2020, prior to the start of
pandemic closures. Louisiana has roughly half the number of small businesses it had before the pandemic, and
the South as a whole has about ⅓ its previous number of small businesses. Shortages in childcare and elder
care are hindering the ability of women to return to work. Without wages that sufficiently cover childcare and
afterschool care expenses, many parents cannot afford to return to work, and employers will be hard-pressed
to attract workers.

Internet Access. The Covid pandemic has shown that lack of access to computers and internet significantly
hinder educational support, job seeking, skill building, and small business development and success. As
children return to school, workplaces become more digitized, and communities continue to deal with
pandemic-related challenges, investments in broadband access at state and local levels will be essential.

Pandemic to Prosperity: South                        July 20, 2021                                                 1

Housing, food, and other basic needs. Though jobs are growing, unemployment remains high at 5.9%, and
state unemployment benefits do not cover basic expenses in 11 Southern states. Nonetheless, 7 of these states
voted to prematurely cut expanded federal benefits while unemployed and low-income families struggle to pay
for housing, food, and healthcare. The Child Tax Credit is expected to reduce child hardships by providing
monthly payments to the vast majority of American families July–December 2021. Advocates can help by
getting the word out about this important benefit and making the case for public investments in housing,
mental health, and education.

Pandemic and crisis readiness. Despite having some of the lowest vaccination rates, combined with rising
Covid infections and the presence of the more contagious Delta variant, several Southern states are slowing
the frequency of Covid reporting. Without consistent and accurate data on cases, hospitalizations, deaths, and
vaccinations, states will be ill-prepared in the event of future shocks and stressors. To mitigate impending
challenges, every Southern state should make a long-term investment in a Chief Data Officer and a team
dedicated to keeping critical data flowing.

ARP implementation. State and local governments are receiving unprecedented federal funding through the
American Recovery Plan that can help address many of these economic, health, and social challenges. The
ability of these funds to make a real impact will depend on effective and equitable community engagement. To
encourage a values-driven framework, SEAP’s SouthStrong initiative developed an ARP Toolkit for local
governments to develop strategic and sustainable recovery initiatives that benefit all community members.

Redistricting. Every legislative seat in the U.S. must be drawn using 2020 Census data, which was delayed by
Covid and is now due by August 16. State deadlines vary in the amount of time they have to redraw maps
before their own deadlines, with Southern states ranging from 4–11 months to redraw Congressional maps.
With compressed (but sufficient) timelines, lawmakers may be tempted to skip transparency and public input.
Communities should be ready for robust engagement both prior to the delivery of redistricting data and as
soon as the data are made available. Fair Count is a member of the CHARGE redistricting hub, which provides
resources and trainings to help bolster community engagement during the redistricting process.

Voting restrictions. Voters turned out in record numbers for the 2020 election, which experts described as
“the most secure in American history.”1 However, several Southern states (AL, GA, FL, KY, and AR) have
responded to this election with the passage of new restrictive voting laws. In fact, all 12 Southern states have
passed or introduced legislation to raise barriers to voting in 2021. Between April and June of this year,
Southerners participated in dozens of demonstrations against these new restrictive laws and advocated for
reduced barriers to voting.

The South is a vital region, and this pandemic is worsening our existing challenges and deepening our
inequities. Now, it is our time to stand together and move from pandemic to prosperity.

 Dr. Jeanine Abrams McLean                            Dr. Sarah Beth Gehl
 Vice President, Fair Count                           Research Director, The Southern Economic Advancement Project

Pandemic to Prosperity: South                      July 20, 2021                                                     2
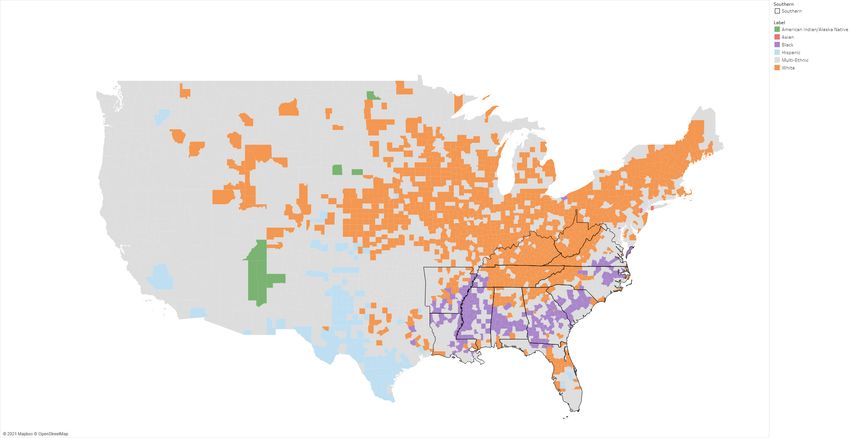
Table of Contents
Population by race/ethnicity

PANDEMIC
   New daily Covid cases in the past week
   Covid-associated hospitalization rates by race/ethnicity
   Total jobs by month, U.S.
   Change in jobs by state
   Quits rate by industry
   Small business closures
   Damages in property loss due to weather and climate disasters

PROSPERITY: GOVERNMENT
   Frequency of reporting new Covid cases by vaccination rates
   Paycheck Protection Program approved loans
   Time for redistricting
   Voter turnout
   Civil unrest

PROSPERITY: INSTITUTIONS
   News deserts
   Internet access by county
   Drop in school attendance
   Child care disruptions
   Health insurance coverage by county
   Health insurance coverage by race/ethnicity
   Affordable Care Act enrollments, 2021

PROSPERITY: PEOPLE
   Employment rate by race/ethnicity
   Employment rate by gender
   Counties where state unemployment insurance fails to cover basic costs
   Food insecurity by state
   Likelihood of eviction or foreclosure by state
   Delayed health care
   Personal income per capita
   Monthly poverty rate by age group

REFERENCES

ACKNOWLEDGEMENTS

Pandemic to Prosperity: South                    July 20, 2021              3

Southern states include 225 of the 229 U.S. counties where the
Black population is uniquely greater than the national average.
Disproportionate representation of racial/ethnic group by county
Population by race/ethnicity, 2019

Source: Census Bureau Note: Color indicates the race/ethnicity that is higher than the national average in each county.
Multi-Ethnic indicates the county has more than one race/ethnicity greater than the national average.

The Black Belt stretches from Virginia to Louisiana and has a unique demographic make-up—vestiges of a
history of cotton and tobacco plantations and the millions enslaved there. The Appalachian region from
northern Alabama to West Virginia has been long dominated by extractive industries such as coal mining.
As a whole, these 12 states have struggled from a history of underinvestment in transportation,
infrastructure, education, and job training, and still have among the highest poverty rates in the United
States today.

In this report, the South is defined as the 12 states of Alabama, Arkansas, Florida, Georgia, Kentucky,
Louisiana, Mississippi, North Carolina, South Carolina, Tennessee, Virginia, and West Virginia.

Pandemic to Prosperity: South                            July 20, 2021                                                    4

Pandemic
                       Lives and Livelihoods
                       To recover from any disaster, an assessment of damages is a
                       necessary first step. In the case of Covid, the damage is not related to
                       a single event. Instead, pandemic-related damages will continue to
                       unfold as a portion of our population remains unvaccinated and
                       more transmissible variants are on the rise. As such, tracking
                       Covid-related damage requires monitoring more than one metric
                       over multiple months. Additionally, shocks and stressors such as
                       extreme weather, fire, crime, racial injustices, and civil unrest
                       continue to compound the impact of pandemic.

                       This section tracks a select number of highly-vetted indicators to
                       examine the extent of Covid-related damage to lives and livelihoods
                       in each Southern state. It examines how people’s lives are faring, and
                       how this impact differs across different sections of society. It also
                       looks at damage to livelihoods state by state across the South.

                       Much of the current discussion about the pandemic is limited to
                       indicators focusing on the health and economic impacts. In later
                       sections of this report, these indicators serve as a backdrop for a
                       unique analysis of the complex interactions between the pandemic
                       and the South’s civic health.

                       Indicators in this section
                       ● New daily Covid cases in the past week by county

                       ● Covid hospitalization rates by race/ethnicity, U.S.

                       ● Change in jobs, by state and U.S., and monthly

                       ● Quits rate by industry, U.S.

                       ● Small business closures, by state and U.S.

                       ● Damages in property loss from weather and climate events, by state and over time

Pandemic to Prosperity: South                        July 20, 2021                                     5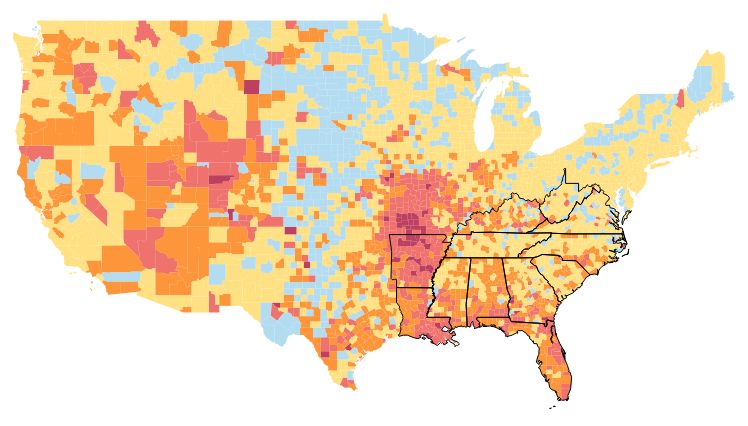
With low vaccination rates across the South, some communities, especially in
Arkansas, Florida, Louisiana, and Mississippi, are experiencing another peak
in the pandemic.
Average daily new Covid cases per 100,000 population in past week, by county
Analysis of state and local health agencies and hospitals data as of July 14, 2021

Source: The New York Times and Census Bureau PEP

The national Covid case rate is now about one-tenth that of the high-point in early 2021. While early
hotspots in the Northeast are now low, pockets of high rates pepper the South, which has some of the
nation’s lowest rates of vaccination. Half of the 10 states with the highest case rates are currently in the
South (AR, FL, LA, AL, and MS).

Baxter County, Arkansas (population 42,000) borders the current Covid epicenter in the state of Missouri
and has the third highest rates of daily average Covid cases in the nation. Baxter is typical of current
counties with high rates. The more transmissible Delta variant has been identified in Baxter, but the extent
to which it is contributing to the surge is unknown because the local health department is not testing for
variants at scale. The percent of Covid tests that come back positive is 15%—3 times the level
recommended by the World Health Organization and an indicator that not enough tests are being
performed. Local health officials attribute high case rates to the new Delta variant and low vaccination
rates, coupled with a return to normal with social events, workplaces, and summer camps.1

Those areas with a weekly average of greater than 7 new cases per day per 100,000 population are at a
level at which health systems can soon be overcome, and also where more immunized individuals will
now experience “breakthrough” Covid infection.2

Complicating the public health response to Covid is what the U.S. Surgeon General describes as the
“urgent threat” posed by health misinformation. In May, a Kaiser Family Foundation survey found that ⅔
of unvaccinated adults believed in Covid myths such as the vaccination causing infertility or changing one’s
DNA.3 Civic infrastructure such as healthcare clinics, local news, schools, and community groups have an
essential role in sharing accurate information on Covid and building resilience to misinformation.4

Pandemic to Prosperity: South                      July 20, 2021                                           6

As of May 2021, American Indian/Alaska Native, Black, and Hispanic
individuals are 1.5 to 3.7 times more likely than white individuals to be
hospitalized due to Covid.
Covid-associated hospitalization rates per 100,000 population, U.S.
By race and ethnicity, Mar 7, 2020 - May 22, 2021

Source: CDC

As shocking as nationwide case rates have been—nearly 34 million people have tested positive for Covid
and more than 600,000 have died—hospitalizations reveal concerning disparities between racial groups.1
Case rates nationwide have been declining since the winter peaks, and available data on hospitalizations
shows that American Indian, Black, and Hispanic/Latino individuals are now around 1.5 to 3.7 times more
likely to have severe Covid impacts than white people. This is down from the disparity during the first
wave of the pandemic when American Indian patients were being hospitalized at 6 to 10 times the rate of
white patients.

This graph reflects the truism that crises exacerbate disparities––the gap between racial outcomes
increases during the peak pandemic waves, and then the lines coalesce when overall rates are lower.

State and local governments prioritizing projects for the American Rescue Plan can use these funds to
begin to eliminate structural disparities that ultimately determine health outcomes—such as access to
good jobs, quality education, safe/walkable neighborhoods, healthy foods, and quality medical care.
Researchers recently analyzed outcomes for patients hospitalized with Covid and found that Black patients
had an 11% higher mortality rate than white patients. The researchers concluded that these outcomes are
“associated with the hospitals at which Black patients disproportionately received care.”2

Addressing underlying disparities now will help ensure that communities of color are not once again
disproportionately impacted by future health crises, whether they be more aggressive strains of Covid or
emerging climate threats such as extreme heat.

Pandemic to Prosperity: South                  July 20, 2021                                          7

While the U.S. gained 850,000 jobs in June, nationwide there are 6.8 million
fewer jobs than in Feb 2020. The South lost 1,381,300 jobs since Feb 2020.
Total jobs by month, U.S.
Jan 2000-June 2021

Source: Bureau of Labor Statistics Note: Seasonally adjusted. Data for May 2021 and Jun 2021 are preliminary.

Change in jobs by state
June 2021 compared to February 2020

Source: Bureau of Labor Statistics Note: Seasonally adjusted. Data for June 2021 are preliminary.

The nation as a whole gained 850,000 jobs in June—but still has 6.8 million fewer jobs than in February
2020. Women have lost 27% more jobs than men since the pandemic began. Across the South, 1.4 million
jobs have disappeared since February 2020. Florida, the largest state in the South, lost the most jobs at
374,000. Five Southern states (Florida, West Virginia, Kentucky, Virginia, and Louisiana) have lost 4% or
more of jobs, with Louisiana down 7.8% compared to its February 2020 jobs level. In June the national
unemployment rate remained high at 5.9%, despite the fact that jobs have grown month-by-month since
January as more Americans get vaccinated.

Pandemic to Prosperity: South                            July 20, 2021                                          8

Workers quit their jobs at record levels in April, and high turnover continued
in May. Since January 2021, nearly 18 million workers have quit their jobs.
Quits rate by industry
Dec 2000 - May 2021

Source: Bureau of Labor Statistics Notes: The quits rate is the number of quits during the entire month as a percent of total
employment. Quits include employees who left voluntarily with the exception of retirements or transfers to other locations.
Data is seasonally adjusted. May 2021 data is preliminary.

This year, over 3 million employees quit their jobs each month January through May—and nearly 4 million
quit in April. The rate at which workers quit their jobs in April (2.8%) was the highest level on record since
measurements began in 2000. The quits rate has been highest in the leisure and hospitality industry,
where wages are low and churn has historically been high. But high levels of quits in every sector,
combined with layoffs and delayed rehiring in 2020, have also stymied service delivery in airports,
healthcare, and childcare centers.1,2,3

At the beginning of the pandemic, many companies laid off workers, while some companies with greater
cash reserves and greater investments in their workers held onto them.4 At the same time, the changing
working conditions during the pandemic caused workers to rethink their options, with some upskilling to
transition to higher paying occupations. Across industries, 1 in 4 full-time workers indicated in early March
that they plan to look for a new job as the pandemic eases.5 Moreover, workers are retiring early in larger
numbers.6,7 As a result, many employers have had to exert substantial effort to find new workers as
demand for goods and services begins to rebound. Generally speaking, workers are demanding higher
wages and better working conditions including flexibility and remote work.8,9,10 Shortages in childcare are
creating a domino effect, hindering parents’ ability to return to work.11

Worker shortages are particularly severe in some industries where substantial training is required
including healthcare, finance, and professional business services.12 As workplaces become more and more
digitized, demand will increasingly shift from high-contact, low-wage service jobs, to jobs requiring more
specialized training. Investment in training and education will be needed for occupations requiring skills
for the new economy.

Pandemic to Prosperity: South                             July 20, 2021                                                     9

Despite the lifting of government restrictions, more small businesses closed
than reopened from May to late June, and fewer small businesses were open
in late June than at the depth of the spring shutdown in April 2020.
Percent change in number of small businesses open, as of June 21, 2021
7-day moving average, indexed to Jan 4-31, 2020, for Southern states and nation

Source: Opportunity Insights. Note: Seasonally adjusted. “Open” is defined as having financial transaction activity. Small
businesses are defined by SBA thresholds for annual revenues, which vary by 6-digit NAICS codes.

From early April through June, states began lifting business restrictions such that by July 1st all states
except Hawaii were fully reopened.1 But changes in consumers’ buying behaviors have had a dramatic
impact on small businesses, regardless of government restrictions being lifted. And many of these
behaviors are not anticipated to return to pre-pandemic levels. Increases in remote work have reduced
demand at downtown restaurants. Demand for business travel has fallen and will likely not fully rebound.2
Small businesses in leisure and hospitality have been particularly hard hit, with 59% fewer of these
businesses nationwide open as of June 21, 2021. Louisiana has roughly half the number of small
businesses it had before the pandemic, and the South as a whole had about ⅓ its previous number of
small businesses.

Among small businesses that have closed are childcare centers that operate on very thin margins. For
example, in Georgia, 55% of licensed childcare providers closed within two months of when Covid struck.3
In June, 1 in 10 adults couldn't find childcare, preventing more than 1 million adults from looking for a
job.4

Pandemic to Prosperity: South                             July 20, 2021                                                      10
Disasters, that are growing in size and impact, are accelerating inequity—with
recovery aid going disproportionately to applicants with greater capacity.
U.S. billion-dollar weather and climate disasters, 2020
Cost per million residents

U.S. billion-dollar weather and climate disasters
Cost by disaster-type, nationwide

Source: NOAA National Centers for Environmental Information (NCEI) U.S. Billion-Dollar Weather and Climate Disasters (2021).
Note: These billion-dollar events account for >80% of the damage from all recorded U.S. weather and climate events.

Climate disasters have compounded the nation’s misery since the pandemic struck. In 2020, six hurricanes
causing at least a billion dollars in damage hit the South. Importantly, disasters do more than damage
property. They often take lives, and hurricanes typically cause the greatest number of deaths of all disaster
types.1 In February of this year, a historic cold wave impacted many Southern states. Although media
attention focused on burst water pipes and power outages in Texas, many Southern cities were affected.
Residents of Jackson, MS suffered through several weeks without water.2 The scale of disasters have been
increasing exponentially, and local governments are rarely well-equipped to respond to human needs for
housing, transportation, and mental health services that last for months as communities struggle to
rebuild.3 Disasters have been shown to increase inequity in part because low-income jobs and housing are
more affected, and government assistance is distributed to those with the greatest capacity to apply.4 At
the same time, federal disaster bail-outs disincentivize financial markets from investing in resilient
infrastructure and housing.5 Strategic investments in climate resilience will be needed to keep state
economies moving forward.

Pandemic to Prosperity: South                           July 20, 2021                                                   11
Prosperity
                       The previous section examined how the pandemic has affected the
                       lives and livelihoods of people across the South. The next section
                       moves on from the “damage assessment” to track measures that will
                       be important as we move to recovery from the Covid crisis.

                       This Prosperity section examines measures of high-functioning
                       governments and civic institutions that are essential for community
                       well-being and prosperity. Importantly, this section ends with metrics
                       that assess how people are doing during the pandemic across
                       geography, race, and gender.

                       Government
                       Governments—local, state, and federal—are being asked to do a lot
                       during the Covid crisis. We start with metrics that assess state
                       readiness for new outbreaks, Covid-related funding to small
                       businesses, voter representation, and protests happening state by
                       state. For each indicator, we provide a brief, evidence-based set of
                       findings and implications to help readers quickly grasp a top-level
                       overview of how each state is doing.

                       Indicators in this section
                       ● Frequency of reporting new Covid cases by vaccination rates

                       ● Paycheck Protection Program approved lending, 2021

                       ● Time for redistricting by state

                       ● Voter turnout, 1976-2020

                       ● Civil unrest instances per 1,000 residents

Pandemic to Prosperity: South                       July 20, 2021                               12
Southern states except VA have less than half of their population vaccinated and all Southern states have decreased the frequency at which they alert the public of new cases. State frequency of reporting new Covid cases by vaccination rates As of July 19, 2021 Sources: John Hopkins Coronavirus Resource Center: Vaccines and John Hopkins Center for Systems Science and Engineering (CSSE) GitHub *GA is also no longer reporting on official holidays. 21 states including DC have more than 50% of their populations fully vaccinated.1 However, in the South, all but Virginia fall below 50% vaccinated, with Alabama, Mississippi, Arkansas, and Louisiana setting the national floor at just over 33%. Not surprisingly, this is translating into new Covid cases, with AR, FL, LA, and AL ranking among the 10 states with highest case rates as of July 15, 2021.2 Meanwhile, news reports increasingly talk about the toll the pandemic is taking on unvaccinated young people, and the rapid spread of the Delta variant in communities with low vaccination rates.3 With this backdrop, it is concerning that some states are slowing the frequency at which they report data on Covid cases, hospitalizations, deaths, and vaccinations. 10 Southern states are now reporting Covid data only 5 days a week, with 9 of them having vaccination rates well below 50%, in addition to Georgia not reporting on holidays. As of July 15, Alabama is now reporting only 3 days a week and Florida just once a week. States in the lower left quadrant of the graph above have less frequent data with less vaccinated populations. As these states move toward less frequent reporting, they increase the risk of not detecting surges and hospital systems being caught unprepared. States in the upper right quadrant are at lowest risk. Beth Blauer of the Johns Hopkins Coronavirus Center, notes that “the rollback of reporting frequency indicates that many states do not see this past year of investment in data infrastructure and public data reporting as a permanent fixture.”4 With a deadly race between viral variants and vaccinations, timely data-tracking and transparency by local governments will be crucial to support mid-course corrections in public health responses as conditions continue to rapidly change. Pandemic to Prosperity: South July 20, 2021 13
Louisiana, Georgia, and Florida all received greater than average forgivable
PPP loans per capita compared to the U.S. as a whole during 2021.
Paycheck Protection Program (PPP) approved lending
Net dollars per capita January 1, 2021 thru May 31, 2021

Source: Small Business Administration

The December stimulus bill included $285 billion in new forgivable Payroll Protection Program funding.
Second time loans were made available only to businesses with fewer than 300 employees, and maximum
loan amounts were limited to $2 million.1 In late February, for two weeks, the SBA offered PPP loans only
to businesses and nonprofits with fewer than 20 employees. Other rule changes were made to increase
equitable distribution of the funds. For example, student loan debt delinquency was eliminated as a
disqualifier for receiving PPP funding.2,3 When the program ended on May 31st, Southern states as a
whole had received lower than average amounts of PPP funding per capita ($755 compared to $839
across the U.S.). However, Louisiana, Georgia, and Florida all received greater than average PPP loans at
$1066, $1032, and $876 respectively.

The $29 billion Restaurant Revitalization Fund deadline was May 24, 2021 but the $16.25 billion Shuttered
Venue Operators grant programs had a bumpy start and only began distributing funds in June.4,5 At least
$2 billion is reserved for venues with fewer than 50 employees.4 Local lenders will be critical in providing
the information and technical assistance needed to ensure qualified micro-businesses access this
important lifeline.

After disasters, there is often a difficult balance between distributing relief quickly and preventing fraud.
The first rounds of PPP funding in 2020 were distributed extremely quickly in an effort to provide timely
relief to small businesses. The U.S. Department of Justice is playing an important role pursuing a large
number of possibly fraudulent claimants from the first two rounds of PPP loans.6

Pandemic to Prosperity: South                     July 20, 2021                                           14
Despite delays in delivery of census data, Southern states have sufficient time
to engage the public in fair and transparent redrawing of voting districts.
Months between first release of redistricting data and state deadlines
For state legislative and congressional districts in 12 Southern states

Source: Brennan Center and Common Cause, compiled from individual state law and electoral calendars.
* Alabama is one of 8 states nationwide with statutory or state constitutional deadlines for redistricting before the Aug. 16
delivery date for redistricting data, which will be impossible to meet.

Maps delineating every legislative and congressional district in the U.S. are redrawn once a decade using
decennial census data. The pandemic and politicization delayed the release of this decade’s redistricting
data, which will now be delivered to states by August 16. While necessary to ensure adequate time for
processing the data, the delay creates challenges for many states, who must meet their own internal
deadlines. States have turned to a number of remedies such as court extensions and calling for special
legislative sessions. States vary in the amount of time they have to redraw maps, with Southern states
ranging from 4-11 months to redraw congressional maps. Under normal circumstances, states would have
almost 4 more months for the process, though few used all that time in the past redistricting cycle.1

As states seek to work within these compressed timelines, it’s important that lawmakers aren’t tempted
to skip transparency and public input. To do so would be particularly troublesome given that about half of
Americans believe that congressional districts are not fairly drawn.2 Though public input is largely not
required by law in the Southern states, 11 of 12 Southern states solicited public input in the last
redistricting cycle through public hearings, accepting citizen-drawn maps, or allowing public comment.3,4

The districts drawn this year will shape lives and communities for the next decade. Communities should
be ready for robust engagement both prior to the delivery of redistricting data—through activities such as
learning and educating others about the redistricting process in their state, organizing, and testifying at
public hearings—and as soon as redistricting data are made available, through activities such as
community mapping. Timing adjustments should not be a reason to dispense with public participation;
Southern states have sufficient time to engage the public for fair and transparent redrawing of voting
districts.

Pandemic to Prosperity: South                             July 20, 2021                                                     15
Despite the pandemic, voters turned out in record numbers for the 2020
election. Progress on expanding voting access should be continued.
Voter turnout in presidential elections, U.S.
1976-2020

Source: Current Population Survey (Voting and Registration Tables 1976-2020)

Despite concerns that the pandemic might depress voting rates, voter turnout was at a record high in the
2020 presidential election. Among youth voters (aged 18-24) turnout was the highest it has been since the
26th Amendment lowered the age to vote to 18 in 1971, with more than half of youth voters casting their
ballot in 2020.

In anticipation of the 2020 election, many states temporarily increased the availability of mail-in voting
because of the pandemic, but in the South, GA, FL, LA, MS, and TN made no such changes.1 Even where
there were no improved accommodations, voter turnout increased in every state in the nation. National
voter participation jumped to about 67% while cases of fraudulent voting were virtually nonexistent.2
Voter participation in the South neared 65%.3

However, since the 2020 election there has been a series of restrictive voting laws introduced across the
country. In the first 6 months of 2021, 17 states enacted 28 new laws that restrict access to the vote.4 All
12 Southern states have passed or introduced legislation to raise barriers to voting.5

Among the one-third of voters who did not participate in the 2020 election, the Current Population Survey
found that 8% did not vote because of structural barriers such as polling place hours, long lines,
registration problems, or not being near polls on voting day.6 Rather than building on the progress made
in 2020 by focusing on ways to reduce barriers to voting, state efforts aimed at further restricting voting
access could have a significant impact on voter engagement in future elections.

Pandemic to Prosperity: South                           July 20, 2021                                    16
The number of demonstrations across the South have ranged from 53 in West
Virginia to 443 in Florida—99% of them peaceful.
Civil unrest instances per 1,000 residents
January 1, 2021 - June 25, 2021

Source: Armed Conflict Location & Event Data (ACLED)

Over 1,700 protests have taken place across the South since January 1, 2021—occurring across every
state. While violent protests commanded the most media attention, 99% of all protests across the South
since January 1, 2021 were peaceful.

From April through June, nearly 300 demonstrations advocated for criminal justice reforms and in support
of Black Lives Matter, and nearly 100 protests were in support of worker rights—most for miners, janitors,
fast food workers, increasing the minimum wage and better working conditions as a whole. Southerners
are increasingly concerned about gun violence and participated in nearly 100 demonstrations against gun
violence. Southerners also participated in 53 protests against new restrictive election laws and anti-rioting
laws, as well as 52 protests in support of LGBTQ rights, and 39 demonstrations for environmental justice.
About 40 demonstrations took place demanding greater investments in community needs such as
affordable housing and mental health services, and against evictions and cuts to higher education.

Roughly equal numbers of protests (14 each) took place in support of and against the teaching of what has
been called Critical Race Theory (but more accurately is the history and current impact of white
supremacy in America).1 As the Israeli-Palestinian conflict erupted in May, 55 demonstrations in support of
Palestinians and 13 demonstrations in support of Israel took place. Notably, about 35 protests took place
against mask-mandates—many of them against mask mandates in schools—suggesting challenges ahead
in providing safe, in-person K-12 public school education. At the same time, 14 recruitment and training
events took place among militia organizations such as the American Contingency Group. Only 1 protest
against perceived election fraud took place in the South after January.

Pandemic to Prosperity: South                          July 20, 2021                                    17
Prosperity
                       Institutions
                       Beyond governments, American society has always depended on a
                       wide array of civic institutions to provide critical information to
                       constituents, hold governments accountable, and offer support to
                       families and workers to be healthy, educated, and productive. This
                       section examines civic institutions—and whether they are fair,
                       effective, and healthy.

                       This issue of Pandemic to Prosperity: South examines the ability of
                       Southerners to access information they need to make informed
                       decisions during a pandemic. We examine local news and internet
                       access to assess communities’ ability to receive critical information
                       and remain connected in a world that is dramatically more digital
                       than just a few months ago. We also examine K-12 attendance, child
                       care disruptions, health insurance availability, and the recent jump in
                       Affordable Care Act enrollments.

                       Indicators in this section
                       ● News deserts

                       ● Lack of internet access by county

                       ● Drop in school attendance

                       ● Child care disruptions

                       ● Lack of health insurance by county and by race/ethnicity

                       ● Affordable Care Act enrollments, 2021

Pandemic to Prosperity: South                        July 20, 2021                               18
Southern counties are more likely to be news deserts than the national
average. Fully 2/3 of Southern counties are news deserts, meaning a critical
vehicle for delivering trusted information on the recovery is absent.
Counties with no or only one newspaper (“news deserts”)
News deserts as of 2020
Source: UNC Hussman School of Journalism and Media, inspired by Brookings research
With $350 billion on its way to local governments through the American Rescue Plan (ARP), local
newspapers are an important platform for both transparency on how governments plan to spend the
funding, and also for sharing ideas on what spending priorities should be. However, more than half of
counties nationwide are what experts describe as “local news deserts” that have either no newspaper or
only one (often a weekly or a thinly staffed daily).1 And 2 out of every 3 Southern counties are news
deserts, meaning a critical vehicle for trusted information during the recovery is absent.
Across the South, remaining local news outlets are raising awareness about ARP spending and
opportunities for public input.
● The Wilmington Star News reported on how Brunswick County, NC and cities/towns within are
tentatively planning to spend their ARP funds on items ranging from replacing aging infrastructure
to renourishing the sand on vanishing beaches vital for the tourism industry.2
● A roundtable of nonprofit, faith, and business leaders used the local news to share their
recommendation for the City of Mobile, AL to delay the distribution of ARP funds by 4 weeks in
order to “to work with the community to help address their priorities and ensure that monies are
best distributed for the greatest impact.”3
● A Mississippi State Representative used an op-ed in the Clarion Ledger to make the case that cities
should use ARP to “undo the systemic issues and racist policies that have stripped wealth and
furthered disinvestment in majority Black—mostly rural—communities throughout the state.”4
● West Virginia Public Radio featured ideas on how lawmakers should “use this time to gather
information from West Virginians about what they’ve experienced with food insecurity during the
pandemic” to design policies that will result in tangible outcomes.5
● And, the Herald Leader covered the Lexington, KY Vice Mayor’s call for “projects that are
transformative and sustainable,” plus a survey to rank spending priorities, as well as a round of
neighborhood meetings and town halls throughout the summer.6
Pandemic to Prosperity: South July 20, 2021 1946% of Southern counties have poor internet access, whereas only 16% of counties outside the South have poor access. Lack of internet access by county, 2015-19 Counties where 25% or more of households report no internet access Source: U.S. Dept of Commerce NTIA/ Census Bureau’s American Community Survey Though current data on internet access is lacking, prior to the pandemic, the majority of rural residents in the U.S. felt access to high speed internet was a significant problem.1 According to a 2018 Census Bureau study, counties in the Mississippi River basin had among the lowest rates of broadband subscriptions. Among counties with 10,000 people or more, Telfair County, GA, Holmes County, MS, Kemper County, MS, Leflore County, MS, and Monroe County, AL all had among the lowest subscription rates.2 46% of Southern counties have poor internet access, whereas only 16% of counties outside the South have poor access. In 2019, 1 in 5 households lack a computer or internet in Mississippi, Louisiana, and Arkansas.3 The Covid pandemic made clear that the internet has become an essential utility for every American. Having access to a computer and broadband is essential to support education and homework, job seeking and skill building, as well as small business development and success. Families that lacked internet access found their children struggling to keep up with school, and working adults weren’t able to complete new online responsibilities without internet access. Internet access is also essential in the farming industry and will be key to community and families’ resilience in the face of future shocks.4,5,6,7,8 As investments in the U.S. Interstate Highway System laid the foundation for the American economy from 1960 onward, additional investments in broadband will be needed to lay a solid foundation for America’s economy for the 21st century. Pandemic to Prosperity: South July 20, 2021 20
Attendance data for remote schooling raises the need to re-engage the most
vulnerable students, but widespread missing/low quality data on vulnerable
populations portend a much larger crisis ahead.
Non-attendance rate for 8th grade remote students by sub-population, May 2021
Southern states and U.S.

Source: Dept of Education Institute of Education Sciences. *KY, MS, SC, and TN submitted insufficient data. WV declined to
participate. AL, LA, and NC did not meet data standards for certain subgroups.

Lack of access to the internet and computers, students caring for siblings or taking jobs, and decreased
support services all contributed to a drop in school attendance among K-12 students during the pandemic.
For 8th graders enrolled in remote public schooling, May 2021 indicators from the federal Institute of
Education Sciences’ new Monthly School Survey Dashboard reveal concerning disparities in attendance for
students who are economically disadvantaged, English learners, or living with disabilities. Students in at
least one of these groups in Alabama, Arkansas, Georgia, and North Carolina have non-attendance rates
5+ percentage points higher than the total population of 8th graders in their states. Some disparities are
far greater, such as Arkansas’ and North Carolina’s children with disabilities (with absence rates more than
double those of their total 8th grade population). Disparities in attendance in Virginia and Florida appear
to be low, but likely for different reasons. Virginia has standardized, mandatory attendance reporting and
has prioritized 62% of English learners and 71% of students with disabilities for in-person learning (the
highest prioritization rates in the nation). Florida is the only state in the South with no statewide
attendance policies or data reporting standards, and it prioritized only 24% of English learners and 30% of
students with disabilities for in-person learning.1

Anecdotally, more granular data from school districts suggest that the problem is likely bigger than the
state-level pilot survey data shown here.2 Even more troubling are the data that are unreported. No states
in the U.S. reported sufficient attendance data on students experiencing homelessness, and 8 southern
states are missing data for one or more vulnerable student populations. Additionally, attendance data
misses all of the students who are not enrolled in school at all during the pandemic. With $122 billion to
support schools and students in the American Rescue Plan, it may seem prudent to only fund building
improvements and other one-time expenses.3 However, the massive scale of students who will need
re-engagement calls out the value of prioritizing funds for intensive tutoring, summer programs, finding
and supporting missing students, and increasing mental health services.4

Pandemic to Prosperity: South                            July 20, 2021                                                       21
1 in 10 adults continue to experience childcare disruptions, forcing them to
make difficult choices.
Percent of adults experiencing a childcare disruption in the last four weeks and how they responded
United States, June 21, 2021

Source: Census Bureau’s Household Pulse Survey. Note: Universe is population 18+ years in households with children.

The nation began to re-open this spring, with many states removing mask mandates, occupancy limits,
and restrictions on businesses. On May 13, the CDC officially declared that people who were fully
vaccinated did not need to wear masks or social distance, even indoors. While many people are now going
back to work in person, childcare disruptions have not improved—leaving families in a lurch. 1 in 10 adults
still experienced a childcare disruption in the 4 weeks ending June 21, 2021.

The impact on both careers and workplaces is not trivial. More than 1.5 million parents cut their work
hours to care for children, and 1.2 million parents took unpaid leave to care for children. Nearly 1 million
left a job, half a million lost a job, and 1 million didn’t look for a job because of childcare disruptions—all
of which mean reduced income that can cause a family to skip a rent payment, delay seeking needed
health care, and struggle to put food on the table.

Comprehensive data on childcare closures or reduced capacity due to staffing shortages is hard to come
by because the sector is so much more decentralized than K-12 education. What data do exist are
concerning.

In North Carolina, for example, 1 in 4 centers are closed, with unquantified others operating at reduced
capacity. The State Attorney General recently wrote that “If providers don’t get the funding they need to
stay open, we’ll lose critical small businesses and place even more financial burdens on families already
struggling during the pandemic.”1 In mid-state Tennessee, childcare center directors are organizing to
figure out how to hire qualified staff when the average wages are $12 an hour.2 In Louisiana, where the
pandemic caused an estimated $245 million in losses for the childcare sector, policymakers and childcare
leaders are actively discussing how to best use incoming American Rescue Plan dollars to shore up a
fundamentally unstable sector, where parents can’t afford tuition, educators can’t afford to live on the low
salaries, and centers can’t break even.3 Fundamentally, the challenge is how to leverage these one-time
investments into long-term investment in early childhood education.4

Pandemic to Prosperity: South                           July 20, 2021                                                 22
Prior to the pandemic, 16% of working-age Southerners lacked health
insurance compared to 11% in the rest of the U.S.
Lack of health insurance coverage by county, 2015-19
Population age 19-64

Source: Census Bureau’s American Community Survey

Across the South, 16% of working-age adults lacked health insurance in 2015-19 compared to only 11% of
working-age adults in the rest of the United States. Seven Southern states have not adopted Medicaid
expansion (Mississippi, Alabama, Georgia, Florida, South Carolina, North Carolina, and Tennessee),
contributing to this South/non-South disparity.1

The implications of not expanding Medicaid are particularly hard on rural communities. Without Medicaid
expansion, hospitals end up treating too many uninsured patients, don’t receive sufficient reimbursement
for the care they provide, and as a result, oftentimes must close for financial reasons. Data from 2011 to
2017 reveals that the rural hospitals most likely to close down were in the South.2 Looking at Southern
counties with particularly high rates of uninsurance (15% of all working-age adults lacking health
insurance), 69% of these counties were completely or mostly rural. Only 31% of these counties were
mostly or completely urban.

An assessment of hospitals in Tennessee found that more than 1 in 4 rural counties had no hospital and 1
in 5 had no emergency room, forcing residents to rely on “ambulances as emergency rooms.”3 During
Covid, without a hospital, many rural residents were unable to get tested and then delayed getting care.
One study found that in rural counties where a hospital closed in 2020, Covid death rates were 39% higher
than in their state overall.4 Moreover, when rural hospitals close, a key job center is lost, making it hard to
attract new residents, which makes it hard to attract businesses—contributing to a downward spiral for
rural communities.4

Pandemic to Prosperity: South                       July 20, 2021                                         23
Disparities in health insurance coverage across racial and ethnic groups before
the pandemic contributed to disparities in Covid outcomes by race/ethnicity.
Lack of health insurance coverage by race/ethnicity
Population age 18-64

Source: Census Bureau’s American Community Survey. Note: Data for 2017-2019 is 19-64 year olds.

Health insurance can be expensive, and many employers do not offer health insurance, much less fully
cover the cost of health care premiums. Not surprisingly, low-income adults were the least likely to have
health insurance coverage in 2019. This was even more true in the South where 28% of working age adults
earning less than 200% of the federal poverty level lacked health insurance in 2019.1

Since 2010, rates of the uninsured have dramatically dropped with the implementation of the Affordable
Care Act (ACA). Nonetheless, before the pandemic, white and Asian populations had the lowest rates of
uninsured adults, while Hispanic/Latino and American Indian/Alaska Native populations had the highest
rates of uninsured adults.

Just before the onset of the pandemic, 1 in 4 Hispanic/Latino and American Indian/Alaska Native adults
were without health insurance. With the compounding impact of job loss, lack of access to healthy foods,
and exposure to pollution, the racial and ethnic groups with the highest exposure to Covid were even
more vulnerable because of lack of health insurance.2

While children under 19 and adults over 64 are often eligible for public forms of health insurance (CHIP,
Medicare) that lead to higher rates of coverage, adults age 19-64 may lack coverage if they cannot get it
through an employer.3 With scientists predicting more frequent pandemics in the future, access to health
insurance will be critical to ensure adults can withstand health crises and continue to provide for their
families.4

Pandemic to Prosperity: South                          July 20, 2021                                 24
Enrollment in Affordable Care Act health insurance plans spiked in 2021.
New Affordable Care Act health plan selections (net of cancellations or terminations)
Feb 15 - May 31, 2021 compared to same period in 2020

Source: The Centers for Medicare & Medicaid Services
Note: All 12 Southern states currently rely on the federal HealthCare.gov. KY and VA are developing their own Marketplaces.

In 2021, the Biden Administration re-opened the Affordable Care Act (ACA) Marketplace for 6 months
(from February 15, 2021 to August 15, 2021) to all Americans regardless of life circumstance.1

Typically, enrollment in ACA health insurance plans is restricted to about 6 weeks. In 2020 many states
created additional open enrollment opportunities in response to the pandemic. The federal government,
however, did not—and all 12 Southern states rely on the federal ACA Marketplace rather than managing
their own.3 Thus, access to ACA health insurance was greatly constrained in Southern states in 2020.
Re-opening enrollment helped to address pent up demand among Southerners, with enrollment numbers
for this time period ranging from 2,509 (WV) to 339,396 (FL) to date. Nationwide, total enrollments are on
track to reach a record high.2

In previous years, only individuals experiencing qualifying life events (such as losing health coverage,
having a baby, etc.) could enroll in an ACA health plan outside of the open enrollment period. Thus,
widening eligibility criteria in 2021 contributed to increased enrollments. But increasing the length of the
enrollment window also made accessing health insurance more feasible for time-burdened families many
of whom have additional child supervision and family care responsibilities during the pandemic.4

With the reopening of the Federal Marketplace, the number of enrollments in ACA health plans in 2021
has greatly surpassed enrollments during the same time period in 2020. The American Rescue Plan also
provides increased subsidies for ACA insurance, which will make ACA health insurance more affordable for
more Americans.5 Lastly, the American Rescue Plan invests $50 million in marketing and community
engagement (up from $10 million under the previous administration) to reach the uninsured with updated
information about subsidies and options.3,6

Pandemic to Prosperity: South                            July 20, 2021                                                   25
Prosperity
                     People
                       At the end of the day, governments and institutions are responsible
                       for ensuring the well being of the communities they serve. This
                       section examines outcomes for people since the onset of the Covid
                       crisis.

                       This section examines key economic metrics from the U.S. Bureau of
                       Labor Statistics, as well as a timely survey from the U.S. Census
                       Bureau (the Household Pulse Survey) that assesses the human
                       impact of the Covid crisis across America. It includes an analysis of
                       unemployment benefits relative to basic costs in each county, and
                       the effects of stimulus payment and safety nets on personal income
                       and monthly poverty rates. For each indicator, we provide a brief
                       explanation of findings to weave together an overview of how
                       Americans are faring since the pandemic struck.

                       Indicators in this section
                       ● Employment rate by race/ethnicity, U.S.

                       ● Employment rate by gender, U.S.

                       ● Counties where state unemployment insurance fails to cover basic costs

                       ● Food insecurity by state

                       ● Likelihood of eviction or foreclosure by state

                       ● Delayed health care

                       ● Personal income per capita

                       ● Estimated monthly poverty rate by age

Pandemic to Prosperity: South                       July 20, 2021                                 26
The nationwide June employment rate of 58% was below the lowest point during the Great Recession. White, Black, Hispanic, and Asian employment rates were down 3 to 4 percentage points compared to February 2020. Employment rate by race/ethnicity, U.S. Jan 2008-June 2021 Source: Bureau of Labor Statistics. Note: The employment rate is officially known as the “employment-population ratio.” Here it is calculated for the population 16 years and older. Data is seasonally adjusted. Although the nation gained 850,000 jobs in June 2021, the employment rate nationwide remained at only 58.0%—below the lowest point during the Great Recession and well below February 2020 when 61.1% of all people ages 16+ had employment. In June 2021, only 56% of Black people 16+ nationwide were employed. White and Asian people 16+ had employment rates of 58% and 60%, respectively. Hispanic employment rates remained highest at 61% with many occupying essential positions in agriculture, food processing, and janitorial services.1,2,3 While many employers report difficulty finding workers, jobs have still not rebounded to pre-pandemic levels. Instead workers are quitting at record levels, to some extent driven by the desire to keep working remotely.4 Overall, potential hirees are demanding higher wages and better working conditions—including livable wages and work schedules, flexibility and remote work.5,6,7 Once the shake up in the labor market settles down, many Americans will still lack employment. Unless and until jobs fully rebound and eventually exceed pre-pandemic levels, many workers may return to free-lance and gig work that offer fewer benefits—leaving them vulnerable to future shocks. Indeed, each recession since the 2000 dot-com bust has hammered away at employment rates, leaving many Americans without stable employment—particularly African Americans.8 Pandemic to Prosperity: South July 20, 2021 27
While employment rates for both men and women remain below the lowest
point during the Great Recession, women’s employment has been particularly
hard hit during the Covid recession.
Employment rate by gender, U.S.
Jan 2008-June 2021

Source: Bureau of Labor Statistics. Note: The employment rate is officially known as the “employment-population ratio.” Here it
is calculated for the population 20 years and older. Data is seasonally adjusted.

Nationally in June 2021, the employment rate for men inched up to 65.6%, while the employment rate for
women stayed put at 54.3%. Childcare and elder care remain significant impediments to women’s ability
to return to work.

Across the South, roughly 1.3 million slots at licensed childcare providers were estimated to have been
lost during the pandemic.1 In June, nearly 1 million parents reported leaving a job due to lack of childcare,
and over 1 million reported being unable to look for a job due to disruption in childcare.

Moreover, demand for home health aides hit a high point in 2020 as families aimed to keep elderly and
disabled family members out of nursing homes where the virus circulated widely.2 But many women had
to provide elder care themselves, making a return to work more difficult. Lack of childcare and home
health care will be a roadblock to many women’s ability to return to work and will continue to contribute
to employers’ challenges finding workers. The demand for home health care is projected to continue to
grow by 34% by 2029 as the Baby Boom generation ages.3

Pandemic to Prosperity: South                            July 20, 2021                                                   28
For Southern workers who receive only state unemployment benefits, cost of
living is unaffordable across all counties except in Kentucky. But by early July,
8 Southern states had cut supplemental federal unemployment benefits.
Counties where state unemployment insurance fails to cover basic costs
Includes costs for a two-bedroom home, food, and transportation

Source: USAFacts, HUD, Department of Labor

In every Southern state except Kentucky, state unemployment benefits are insufficient to cover basic
household expenses. In June, the national unemployment rate remained high at 5.9% (despite the fact
that jobs have grown since January). An additional $300/week in federal unemployment benefits,
available since December 2020, has undoubtedly been a lifeline for those who can’t find a job. But even
these additional federal benefits have not been enough. In March, 1 in 3 households that received
unemployment benefits, including the additional federal benefits, continued to have difficulty paying for
basic expenses including rent and food.1 Moreover, unemployment benefits have not reached all eligible
individuals—likely because states did not have the technological and administrative capacity to process a
huge increase in claims.2,3

Even with the additional $300 federal benefit, weekly unemployment benefits are low. In Louisiana, for
example, the maximum unemployment benefit is $247/wk.4 Including the federal supplement,
unemployed workers in Louisiana received a max of $547/wk (equivalent to $28,444/year or
$13.68/hour). Employers who do not provide wages above $13.68/hour will be hard pressed to attract
workers who must pay their babysitters $16.75/hour.5 In other words, without affordable childcare and
afterschool care, many parents can’t afford to return to work. Yet by July 3rd, 8 Southern states (AL, AR,
FL, GA, MS, SC, TN, WV) had eliminated the $300 federal benefit, Louisiana is slated to end the $300
benefit by August 3rd—well before the official end date of these benefits on September 6, and before
many schools reopen.6

Pandemic to Prosperity: South                    July 20, 2021                                          29
You can also read