Cops and No Counselors - How the Lack of School Mental Health Staff Is Harming Students
←
→
Page content transcription
If your browser does not render page correctly, please read the page content below
Cops and
No Counselors
How the Lack of School Mental Health Staff
Is Harming Students

                                Cops and No Counselors   1
Cops and
No Counselors
How the Lack of School Mental Health Staff
Is Harming Students
Acknowledgements
Special thanks to the Center for Civil Rights Remedies at the UCLA Civil Rights Project
for their collaboration with the data and publication of Part I in this report series. We
thank the National Association of School Psychologists, the American School Counselors
Association, and the School Social Work Association of America for their feedback and
continued advocacy. Thank you to our ACLU affiliates in Nebraska (Scout Richters, Rose
Godinez) and Ohio (Melekte Melaku) for providing on-the-ground information about what
is happening in the states. Lastly, major thanks to Avery Horne, Matthew Leuvano, and
David McGill, our ACLU of Southern California interns.

Authors:                                      Communications:
Amir Whitaker                                 Gerry Johnson and Ana Blinder
ACLU of Southern California
                                              Data Analytics:
Sylvia Torres-Guillén                         Sophie Beiers
ACLU of California
                                              Editors:
Michelle Morton                               Emily Greytak, Sarah Hinger, Susan Mizner,
ACLU of Florida                               and Jessica Cobb

Harold Jordan
ACLU of Pennsylvania

Stefanie Coyle
New York Civil Liberties Union

Angela Mann
University of North Florida
Florida Association of School Psychologists (FASP), Board Member

Wei-Ling Sun
PhD Candidate University of Texas, Austin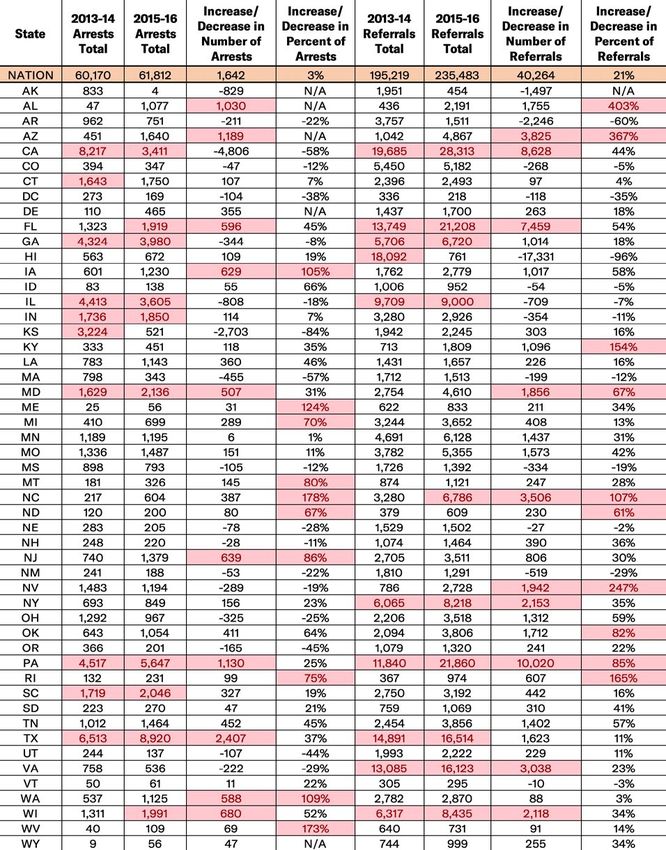
Contents
   Executive Summary.. . . . . . . . . . . . . . . . . . . . . . . . . . . . . . . . . . . . . . . . . . . . . . . . . . . . . . . . . . . . . . . . . . . . . . . . . . . . . . . . . . . . . . . . . . . . . . . . . . . . . . . . 4

   Introduction. . . . . . . . . . . . . . . . . . . . . . . . . . . . . . . . . . . . . . . . . . . . . . . . . . . . . . . . . . . . . . . . . . . . . . . . . . . . . . . . . . . . . . . . . . . . . . . . . . . . . . . . . . . . . . . . . . . . . 6

   Mental Health and Law Enforcement Staffing in Public Schools. . . . . . . . . . . . . . . . . . . . . . . . . . . . . . 10

                        Mental Health Providers in Public Schools. . . . . . . . . . . . . . . . . . . . . . . . . . . . . . . . . . . . . . . . . . . . . . . . . . . . . 10

                        Police in Public Schools. . . . . . . . . . . . . . . . . . . . . . . . . . . . . . . . . . . . . . . . . . . . . . . . . . . . . . . . . . . . . . . . . . . . . . . . . . . . . . . . . . . . . 15

                        State Spotlight: Nebraska. . . . . . . . . . . . . . . . . . . . . . . . . . . . . . . . . . . . . . . . . . . . . . . . . . . . . . . . . . . . . . . . . . . . . . . . . . . . . . . . 20

   School Arrests, Offenses, and Law Enforcement Referrals. . . . . . . . . . . . . . . . . . . . . . . . . . . . . . . . . . . . . . 23

                        Arrests and Referrals to Law Enforcement. . . . . . . . . . . . . . . . . . . . . . . . . . . . . . . . . . . . . . . . . . . . . . . . . . . . 23

                        Racial and Disability Status Disparities. . . . . . . . . . . . . . . . . . . . . . . . . . . . . . . . . . . . . . . . . . . . . . . . . . . . . . . . . 24

                        State Spotlight: Florida. . . . . . . . . . . . . . . . . . . . . . . . . . . . . . . . . . . . . . . . . . . . . . . . . . . . . . . . . . . . . . . . . . . . . . . . . . . . . . . . . . . . 26

                        Reported “Serious Offenses” and School Shootings.. . . . . . . . . . . . . . . . . . . . . . . . . . . . . . . . . . . . . . 37

   Conclusion. . . . . . . . . . . . . . . . . . . . . . . . . . . . . . . . . . . . . . . . . . . . . . . . . . . . . . . . . . . . . . . . . . . . . . . . . . . . . . . . . . . . . . . . . . . . . . . . . . . . . . . . . . . . . . . . . . . . . 39

                        Recommendations. . . . . . . . . . . . . . . . . . . . . . . . . . . . . . . . . . . . . . . . . . . . . . . . . . . . . . . . . . . . . . . . . . . . . . . . . . . . . . . . . . . . . . . . . . . . 40

   Appendices. . . . . . . . . . . . . . . . . . . . . . . . . . . . . . . . . . . . . . . . . . . . . . . . . . . . . . . . . . . . . . . . . . . . . . . . . . . . . . . . . . . . . . . . . . . . . . . . . . . . . . . . . . . . . . . . . . . . 46

                        Appendix A: Methodology, Data Cleaning, Definition,
                        and Limitations. . . . . . . . . . . . . . . . . . . . . . . . . . . . . . . . . . . . . . . . . . . . . . . . . . . . . . . . . . . . . . . . . . . . . . . . . . . . . . . . . . . . . . . . . . . . . . . . . 46

                        Appendix B: Districts and States Failing to Report
                        and Comply. . . . . . . . . . . . . . . . . . . . . . . . . . . . . . . . . . . . . . . . . . . . . . . . . . . . . . . . . . . . . . . . . . . . . . . . . . . . . . . . . . . . . . . . . . . . . . . . . . . . . . . . 48

                        Appendix C: Additional Staffing and School Arrests by
                        Race and Disability Tables. . . . . . . . . . . . . . . . . . . . . . . . . . . . . . . . . . . . . . . . . . . . . . . . . . . . . . . . . . . . . . . . . . . . . . . . . . . . . . . 52

                        Appendix D: Common Student Behaviors Leading to
                        School Arrest. . . . . . . . . . . . . . . . . . . . . . . . . . . . . . . . . . . . . . . . . . . . . . . . . . . . . . . . . . . . . . . . . . . . . . . . . . . . . . . . . . . . . . . . . . . . . . . . . . . . . 56

   Endnotes. . . . . . . . . . . . . . . . . . . . . . . . . . . . . . . . . . . . . . . . . . . . . . . . . . . . . . . . . . . . . . . . . . . . . . . . . . . . . . . . . . . . . . . . . . . . . . . . . . . . . . . . . . . . . . . . . . . . . . . . . 57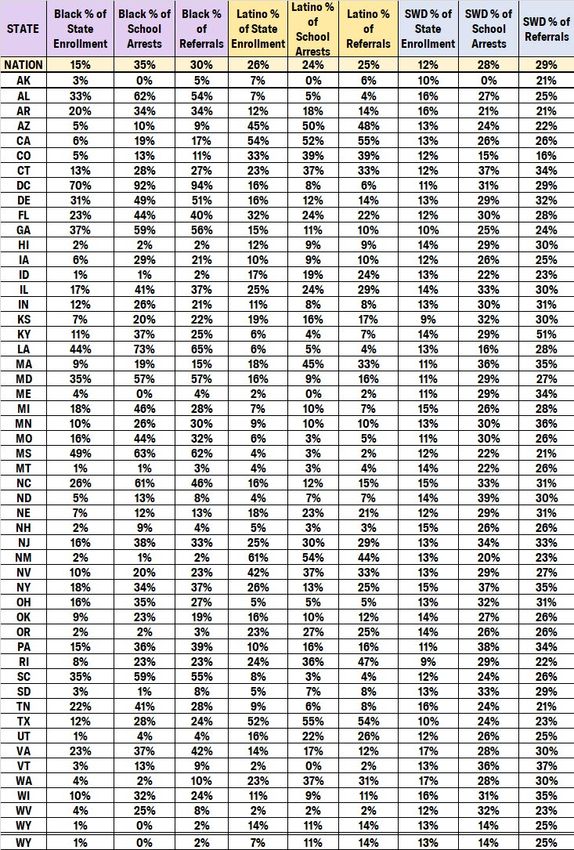
Executive Summary
The U.S. Department of Education recently required every public school to report the number of social
workers, nurses, and psychologists employed for the first time in history. Data about school counselors
had been required previously, but this report provides the first state-level student-to-staff ratio comparison
for these other school-based mental health personnel, along with school counselors. It reviews state-level
student-to-school-based mental health personnel ratios as well as data concerning law enforcement in schools.
The report also reviews school arrests and referrals to law enforcement data, with particular attention to
disparities by race and disability status. A key finding of the report is that schools are under-resourced and
students are overcriminalized.

Today’s school children are experiencing record levels of depression and anxiety, alongside multiple forms of
trauma. According to the Centers for Disease Control and Prevention, the suicide rate among children ages
10 to 17 increased by 70 percent between 2006 and 2016.1 Approximately 72 percent of children in the United
States will have experienced at least one major stressful event—such as witnessing violence, experiencing
abuse, or experiencing the loss of a loved one—before the age of 18.2

School counselors, nurses, social workers, and psychologists are frequently the first to see children who
are sick, stressed, traumatized, may act out, or may hurt themselves or others. This is especially true in
low-income districts where other resources are scarce. Students are 21 times more likely to visit school-
based health centers for treatment than anywhere else.3 Schools that employ more school-based mental
health providers see improved attendance rates, lower rates of suspension and other disciplinary incidents,
expulsion, improved academic achievement and career preparation, and improved graduation rates.4 Data
shows that school staff who provide health and mental health services to our children not only improve the
health outcomes for those students, but also improve school safety.5 However, there is no evidence that police
in schools improve school safety—indeed, in many cases they are causing harm.6 When in schools, police
do what they are trained to do—detain, handcuff, and arrest. This leads to greater student alienation and a
poorer school climate.

Given this information, we would expect school boards, school principals, and government leaders to be
working to remove law enforcement from our schools and using every available resource to build up school-
based health professionals. But that has not been the trend. Instead, funding for police in schools has been
on the rise, while our public schools face a critical shortage of counselors, nurses, psychologists, and social
workers. As this report reveals, millions of students are in schools with law enforcement but no support staff:

       •     1.7 million students are in schools with police but no counselors.
       •     3 million students are in schools with police but no nurses.
       •     6 million students are in schools with police but no school psychologists.
       •     10 million students are in schools with police but no social workers.
       •     14 million students are in schools with police but no counselor, nurse, psychologist, or social
             worker.

Our report reveals that schools fortunate enough to have mental health professionals are still grossly
understaffed. Professional standards recommend at least one counselor and one social worker for every
250 students, and at least one nurse and one psychologist for every 750 students and every 700 students

4          American Civil Liberties Union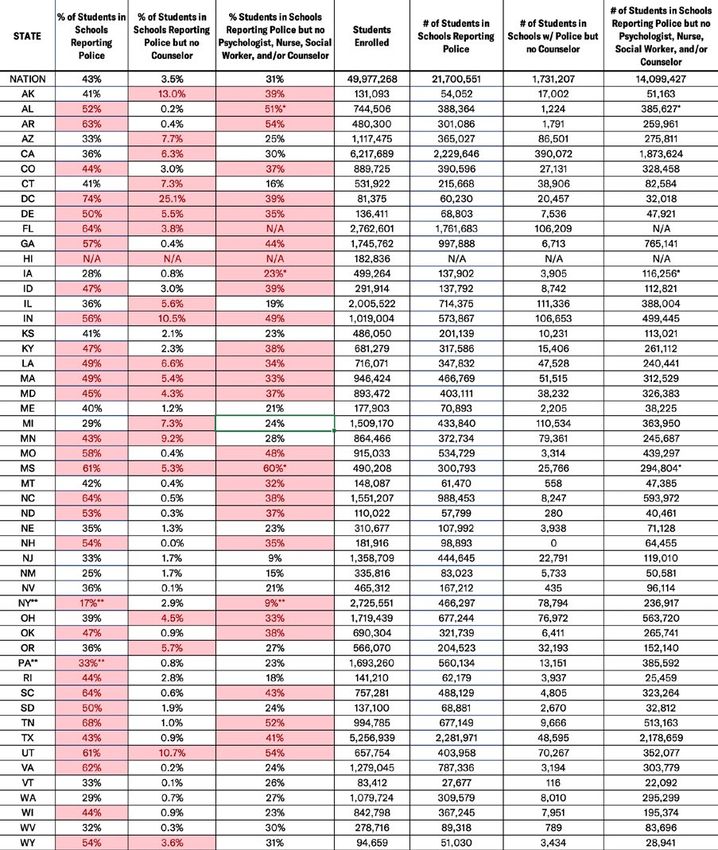
respectively. These staffing recommendations reflect a minimum requirement. Nonetheless, 90 percent
of students in public schools fail to meet this standard when supporting students. Even in schools with a
significant lack of health support staff, law enforcement presence is flourishing. Many states reported 2-3
times as many police officers in schools than social workers. Additionally, five states reported more police
officers in schools than nurses.
The consequences for these funding decisions fall on the most vulnerable students. Teachers are often
not equipped to deal with the special needs posed by children with disabilities. Furthermore, historically
marginalized students, such as students of color, may attend schools with fewer resources and supports.
When there are no other behavioral resources at hand, some teachers request help from law enforcement.
This results in an increased criminalization of our youth: we found that schools with police reported 3.5 times
as many arrests as schools without police. As a result, students with disabilities and students of color are
most frequently criminalized. Consider these findings:
• Students with disabilities were arrested at a rate 2.9 times that of students without disabilities. In
some states, they were 10 times as likely to be arrested than their counterparts.
• Black students were arrested at a rate 3 times that of white students. In some states, they were 8
times as likely to be arrested.
• Pacific Island/Native Hawaiian and Native American students were arrested at a rate 2 times that
of white students.
• Latinx students were arrested at a rate 1.3 times that of white students.
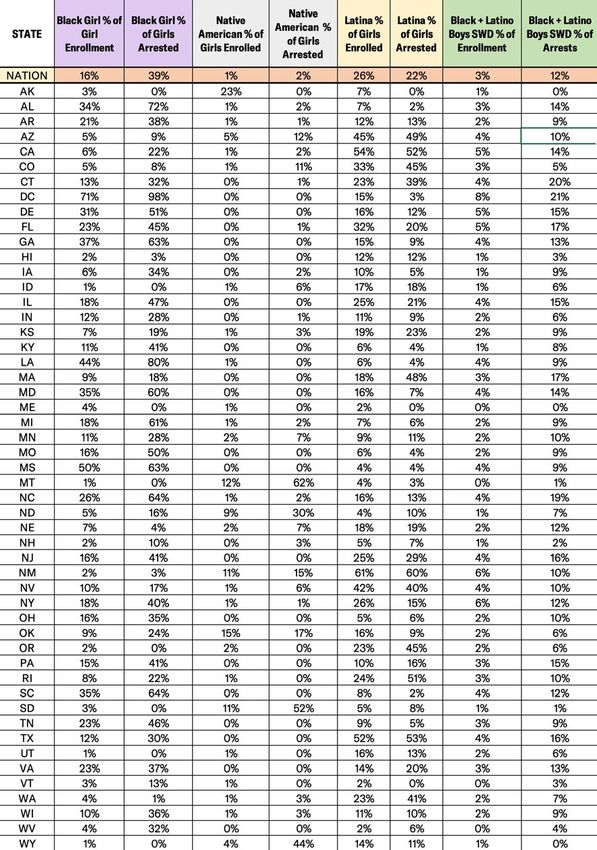
• Black girls made up 16 percent of the female student population but were 39 percent of girls
arrested in school. Black girls were arrested at a rate 4 times that of white girls. In North Carolina,
Iowa, and Michigan, Black girls were more than 8 times as likely to be arrested than white girls.
• Native American girls had a school arrest rate 3.5 times that of white girls. Native American girls
were 12 percent of girls in Montana but were 62 percent of female arrests in that state.
• Black and Latino boys with disabilities were 3 percent of students but were 12 percent of school
arrests.
This report presents detailed results, state by state. It outlines which states have the least support staff and
greatest police presence. In addition, it puts this data in context by reviewing the history of how we got here.
Lastly, it presents key recommendations to reverse course, including:
• Federal, state, and local dollars must prioritize counselors, psychologists, social workers, and
nurses instead of police.
• The Department of Education should not just continue to collect the data on school support staff
and student interactions with police, it should also take steps to ensure the data is more complete
and accurate.
Cops and No Counselors 5
Introduction
The nation’s children are facing a crisis. They walk into schools and classrooms burdened by a barrage
of social, emotional, and psychological issues. Today’s school children are experiencing record levels of
depression and anxiety alongside multiple forms of trauma.7

Mental Health and Schools. According to the Centers for Disease Control, the suicide rate among children
ages 10 to 17 increased by 70 percent between 2006 and 2016.8 The recent wave of school shootings reminds
us that unaddressed needs of children can result in tragic crisis. It is estimated that nearly 35 million
children in the U.S. have experienced at least one event that could lead to childhood trauma.9About 72
percent of children in the U.S. will have experienced at least one traumatic event such as witnessing violence,
experiencing abuse, or experiencing the loss of a loved one before the age of 18.10 The majority of mental
health needs first emerge during adolescence and are most effectively treated during this period.11 The data
suggests 1 in 5 youth will develop mental health difficulties eventually warranting a diagnosis, and 1 in 10
youth will be impacted by their mental health needs enough to require additional supports from schools.12
These mental health concerns can have serious impacts on students as they progress through school, and it
contributes to nearly half of the youth eventually dropping out.13

Up to 80 percent of youth in need of mental health services do not receive services in their communities
because existing mental health services are inadequate.14 Of those who do receive assistance, 70 percent
to 80 percent of youth receive their mental health services in their schools.15 Students are 21 times more
likely to visit school-based health centers for mental health than community mental health centers.16 This
is especially true in low-income districts where other resources are scarce. Therefore, school-based mental
health providers (SBMH providers)—such as school counselors, nurses, social workers, and psychologists—
are frequently the first to see children who are sick, stressed, traumatized, act out, or hurt themselves or
others. These SBMH providers are trained to address students’ needs. Research has shown that school-
based mental health providers improve school climate17 and other positive outcomes for students.18 Data
shows that school staff who provide health and mental health services to our children not only improve the
health outcomes for those students,19 but also improve school safety.20 Furthermore, schools that employ
more SBMH providers see improved attendance rates, lower rates of suspension and other disciplinary
incidents,21 lower rates of expulsion,22 improved academic achievement and career preparation,23 and
improved graduation rates.24

Police and Schools. On the other hand, no data indicates that police in schools improve either the students’
mental health, educational outcomes, or their safety—indeed, in many cases they are causing harm.25 When
in schools, police do what they are trained to do—detain, handcuff, and arrest. This leads to greater student
alienation and a poorer school climate. It also leads to greater and greater criminalization of our youth.
There is no conclusive evidence to support that school policing measures actually make schools—or students—
safer.26 For example, a recent evaluation of the impact of North Carolina’s state grant program for school
resource officers (SROs) concluded that middle schools that used state grants to hire and train SROs did not
report reductions in serious incidents like assaults, homicide, bomb threats, possession and use of alcohol and
drugs, or the possession of weapons.27 In fact, there is some evidence suggesting that these measures actually
harm youth. Research has indicated that having school-based police contributes to less inclusive school
climates, and this makes students less safe.28 A 2018 study reviewing the impact of federal grants for school
police on 2.5 million students in Texas found a 6 percent increase middle school discipline rates, a 2.5 percent

6        American Civil Liberties Union
decrease in high school graduation rates, and a 4 percent decrease in college enrollment rates. Another 2018
study found more police in New York City neighborhoods hurt the test scores of Black male students.

The impacts of increased police presence in schools have been sweeping: a dramatic increase in contact with
law enforcement, an expansion in the types of roles police play in schools, an increase in student referrals to
police, an increase in student arrests, and accountability problems stemming from student-police contact.
The presence of permanent school police shifts the focus from learning and supporting students to over-
disciplining and criminalizing them. Students are removed from classes, subjected to physical restraint,
interrogation, and other risks to their rights to education, due process,29 and equal treatment. Data from the
National Center for Education Statistics indicates that compared to police in schools with predominantly
white students, police in schools with predominantly students of color are significantly more likely to have
duties focused on maintaining school discipline while being less likely to coordinate with emergency teams
and police in the presence of an actual threat.30

Law enforcement officers are often not prepared or qualified to work with children. Roughly 25 percent of
school police surveyed by Education Week stated that they had no experience with youth before working in
schools.31 Police are trained to focus on law and order, not student social and emotional well-being. This lack
of training and education undermines effective behavior management.32 The tools of law enforcement, unlike
the tools of SBMH providers, include pepper spray, handcuffs, tasers, and guns, and are ill-suited to the
classroom. A 2018 report by the Advancement Project documented and mapped over 60 instances of police
brutality in schools over the past eight years.33

Even when students report having a positive view of their school police, the officers are not perceived as
contributing to keeping the school drug-free or improving school safety.34 Law enforcement creates more
hostile environments, and when students perceive their schools to be hostile, they are less likely to be engaged
in school and, in turn, demonstrate reduced achievement.35 The presence of sworn law enforcement is also
associated with increases in student arrests for low-level incidents.36 Schools employing school police see
increases in student offenses and school-based arrests by as much as 400 percent.37 In a recent survey of 400
SROs, one out of three officers reported that their school does not specify the types of disciplinary issues
that they can intervene in.38 This lack of accountability and clarity results in an inappropriate use of force for
minor misbehaviors and harm to students.

The use of police in schools has its roots in the fear and animus of desegregation. Students of color are more likely
to go to a school with a law enforcement officer, more likely to be referred to law enforcement, and more likely
to be arrested at school. Research also demonstrates that students who attend schools with high percentages
of Black students and students from low-income families are more likely to attend schools with tough security
measures like metal detectors, random “contraband” sweeps, security guards, and security cameras, even when
controlling for the level of serious misconduct in schools or violence in school neighborhoods. Students with
disabilities are disproportionately arrested and physically harmed by school police as well.39

Although it was recently rescinded by the Trump administration, the Departments of Education and Justice
issued guidance in 2014’s “Dear Colleague Letter on the Nondiscriminatory Administration of School
Discipline,” highlighting the fact that schools can be held responsible for school policing that furthers racial
discrimination against students:

        Schools cannot divest themselves of responsibility for the nondiscriminatory administration of school
        safety measures and student discipline by relying on school resource officers, school district police officers,
                                                                                        Cops and No Counselors            7
contract or private security companies, security guards or other contractors, or law enforcement personnel.
        To the contrary, the Departments may hold schools accountable for discriminatory actions taken by such
        parties.40

Despite the well-documented harm of school police and lack of evidence that policing measures make schools
safer, the use of school police and similar measures has drastically increased over the past decades. In 1975,
only one percent of schools were patrolled by police officers.41

Since then, that number has ballooned to encompass nearly half of all public schools (48 percent), according
to the National Center for Education Statistics (NCES).42 Historically, the growth in police being assigned to
schools has been driven more by national media attention about school violence and the availability of grant
funding (federal and state) than by an actual uptick in violent incidents in specific schools43 or any evidence of
the effectiveness of this approach.

Following the 1999 Columbine High School shooting, President Clinton called for the first round of Community
Oriented Policing Services (COPS) grants as a response that would allow for school/police partnerships
focused on “school crime, drug use, and discipline problems.”44 COPS is a unit of the U.S. Department of
Justice.45 After the Sandy Hook tragedy in 2012, President Obama allocated another $45 million46 into COPS to
fund additional school police.47 Federal grants were supplemented by state grants and local monies to sustain
SRO programs. The millions of dollars that have gone into school policing from COPS from 1995-2016 can be
viewed in a time-lapse map in ACLU’s 2017 report.48 The report also explores the impact of school police on
school discipline, student privacy rights, abuse of force, and more.

        “We must arm school counselors across the country with the appropriate
        counselor to student ratio (1 to 250). School counselors, social workers and
        school psychologists [are] all on the mental health frontlines.”
            — Dr. Laura Hodges, Nationally Certified School Counselor, in a statement to the
               Federal Commission on School Safety49

The number of security guards has exploded as well. According to the National Center for Education Statistics
(NCES), the percentage of students who reported security guards or assigned police officers after the
Columbine tragedy increased from 54 percent to 70 percent from 1999 to 2015.50 During the same time period,
the number of school counselors reported to the NCES only increased by 5 percent, after adjusting for the
growth in student enrollment growth.51

In 2018, due to high-profile school shootings, there was another substantial uptick in the number of schools with
police officers. Within six months of the Parkland school shooting, more than $1 billion was added to school
security budgets by state legislatures, with funding for School Resource Officers (SROs)52 being one of the largest
items.53 Other school hardening measures are also on the rise. Increasingly, students are subjected to open-ended
risk assessments and are involuntarily held for mental health evaluations. Information they post on social media
is routinely collected and shared among state agencies. Kindergarten teachers are coming up with memorable
rhymes to drill security protocols into their students’ minds. The youngest students are cowering in closets and
bathrooms, while law enforcement officers pretend to be intruders, banging on doors, and shooting blank bullets
in an effort to train students and teachers on what to do if there is an active assailant at their school.54

8        American Civil Liberties Union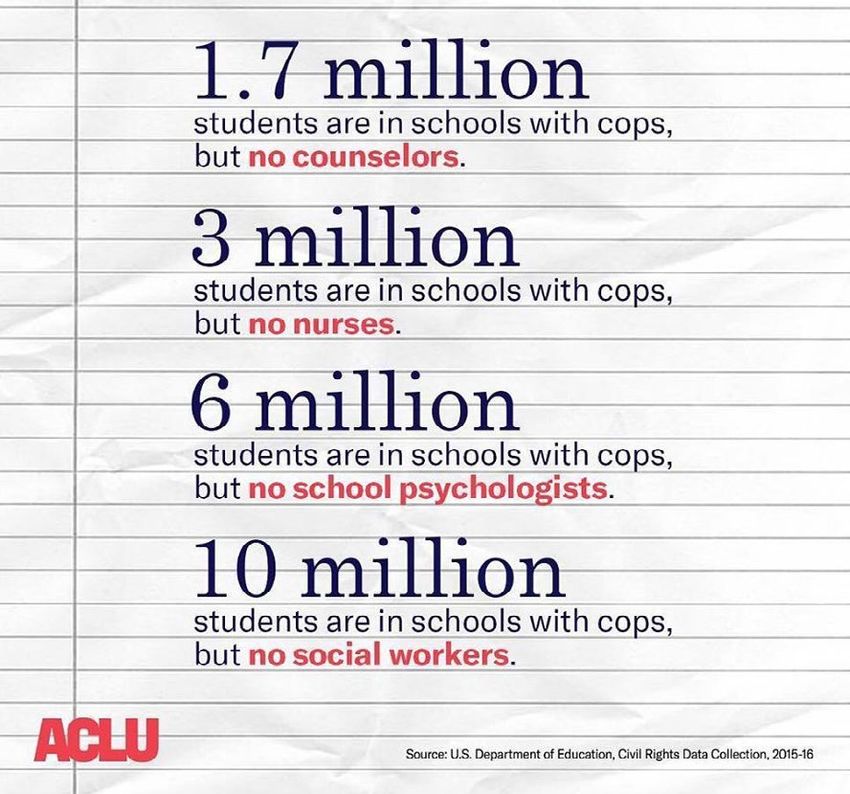
Report Overview. This report uses data from the 2015-16 academic year collected through the U.S.
Department of Education’s Civil Rights Data Collection (CRDC) to better understand access to school-based
mental health (SBMH) services in relation to police in schools. The CRDC recently required every public
school to report the number of social workers, nurses, and psychologists employed for the first time in
history (reporting on school counselors had been previously reported).55 This report provides the first state-
level student-to-staff ratio analysis of SBMH personnel, as well as state-level reporting of law enforcement
personnel. Furthermore, to examine the potential impact of school policing, the report analyzes school arrests
and law enforcement referrals by state and by race and disability status. To better understand the harm, this
report provides the first intersectional analysis of this data by race and gender.

A key finding of this report is that millions of students are being underserved and lack access to critical
supports. These glaring deficits in mental health staff for students are inexcusable, especially in comparison
to the number of reported law enforcement in schools. Students with unmet behavioral and mental health
needs, combined with law enforcement with limited training and ill-defined roles has resulted in disastrous
consequences. The analysis related to school policing measures also demonstrate glaring racial and disability-
status disparities in school arrests and referrals to law enforcement. Specifically, the findings indicate that,
indeed, this surge in police officers contributes to a biased application of discipline and over-criminalization of
students of color and students with disabilities.

The report highlights that, now more than ever, school boards and administrators need guidance to navigate
their responsibility to ensure each of their students are safe from discriminatory discipline, especially when
they engage law enforcement. The report concludes with recommendations for improving student safety,
well-being, opportunity to learn, and school climate, and ensuring that these measures work to prevent
discrimination and eliminate the disproportionate impact of school policing on students of color and students
with disabilities.

                                                                                    Cops and No Counselors        9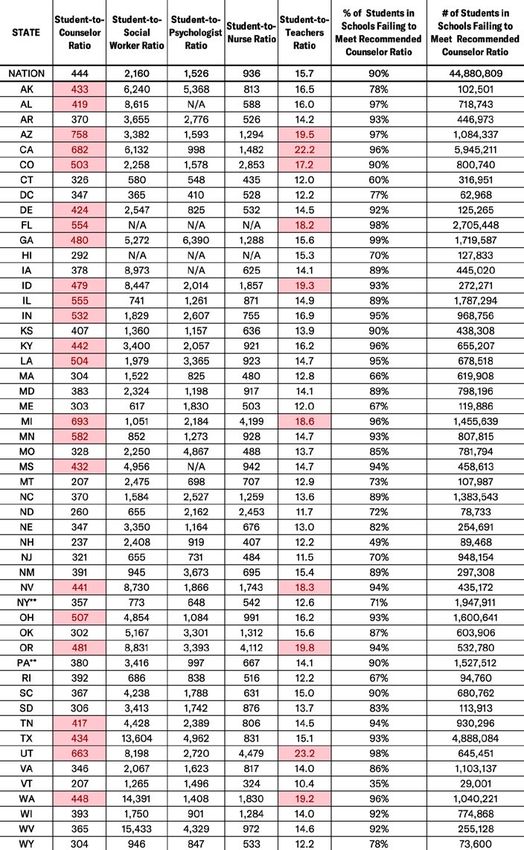
Mental Health and Law Enforcement Staffing in
Public Schools

Mental Health Providers in Public Schools
School counselors, social workers, nurses, and psychologists each play a critical role in supporting youth and
addressing barriers to school success. The specific roles of each of these school-based mental health providers
(SBMH providers) are detailed in Table 1, both by the official federal designated definition56 and by the more
descriptive definition from the relevant provider associations.

TABLE 1

Definitions for School-Based Mental Health (SBMH) Providers

                               FEDERAL DATA
                                                                   PROFESSIONAL DEFINTION58
                               DEFINITION57

 SCHOOL                         Professional staff member          Providers who are typically the first SBMH
 COUNSELOR                      assigned specific duties           providers to interact with students when
                                and school time for                they are struggling. School counselors
                                activities like counseling         not only have specialized knowledge in
                                with students and                  supporting students as they navigate the
                                parents, consulting with           curriculum, but they also have training in
                                other staff, evaluating            establishing safe learning environments,
                                student abilities, and             monitoring and responding to behavior
                                implementing guidance              to improve school climates, and creating
                                programs.                          relationships between students, teachers,
                                                                   and parents that promote greater
                                                                   interpersonal connections.

 SOCIAL                        Certified, licensed, or otherwise   Provider that helps families and school staff
 WORKER                        qualified professional who          navigate community systems to better support
                               provides social services and        the students’ needs. They assist with the various
                               assistance to improve the           barriers such as poverty, inadequate healthcare,
                               social and psychological            community violence, homelessness, domestic
                               functioning of children and         violence, and other issues that impact students
                               their families and to maximize      and their performance in school. School social
                               the family well-being and the       workers also facilitate innovative prevention and
                               academic functioning of the         intervention programs in areas like substance
                               children.                           abuse, bullying, anger management, and more.

10        American Civil Liberties Union
PSYCHOLOGIST Licensed professional who Providers who are trained in both psychology
evaluates and analyzes and education with specialized knowledge in
students’ behavior by advocacy for children and specialized knowledge
measuring and interpreting meant to address learning, motivation, behavior,
their intellectual, emotional, mental health, social development, and
and social development, and childhood disabilities. They are also critical
diagnosing their educational to ensure evidence-based assessments and
and personal problems. interventions for students. A report by the
National Association of School Psychologists
(NASP) found that qualified school psychologists
can help address issues such as “poverty,
mental, and behavioral health issues, bullying,
homelessness, increasing cultural and linguistic
diversity.”59
NURSE Qualified health care Provider who provides critical support to both
professional who addresses physical and mental health. They help with
the health needs of students. behavioral screening and referrals to health care
The provider meets the state providers in the community. They also support
standards and requirements for treatment compliance where appropriate.
a nurse.
Note: Definitions are paraphrased from identified sources
Given the importance of these providers, experts and professional organizations provide recommended
student-to-SBHM provider ratios. The American School Counselor Association recommends a ratio of 250
students per counselor.60 The National Association of School Psychologists (NASP) recommends a ratio of
500-700 students per school psychologist, depending on the comprehensiveness of services being provided.61
School Social Work Association of America (SSWAA) recommends that social work services should also be
provided at a ratio of 250 students to one social worker.62 Several states, along with the American Nurses
Association, recommend a ratio of one school nurse to 750 students in healthy student populations.63
This report presents the analyses of the 2015-16 federal Civil Rights Data Collection (CRDC) data to generate
student-to- SBMH provider ratios for the 93,641 public schools in the U.S. overall and by state.64 Despite
evidence that the presence of SBMH personnel improves school climate and reduces violence, most schools
have significantly less staff than recommended by experts and professional organizations. The following
maps (Maps A-D) display the student-to-provider ratios for each type of provider (counselor, psychologists,
social workers, and nurses) nationally and by state. The states meeting the recommended ratios are in blue.
States failing to meet the ratios are in red.
School Counselors
The American School Counselor Association recommends a ratio of 250 students per counselor.65 Over 90
percent of students attend schools with higher ratios. The national student-to-counselor ratio was 444:1.
This suggests counselors are seriously overworked with student caseloads 78 percent greater than what is
recommended by experts.
This crisis extends beyond unmet minimums. The U.S. Department of Education’s 2016 First Look found
Cops and No Counselors 1121 percent of high schools nationwide did not have access to any school counselor.66 Our analysis of the most
recent data reveals more than 24,000 schools (25 percent) reported having no counselor on staff (see Table A1
in Appendix).67 Roughly 8.7 million students attend these schools. Although charter schools represent just 7
percent of public schools nationwide, they made up 15 percent of schools that reported no counselor.
As shown in Map A, the severity of the shortage of counselors varied largely by state. Montana and Vermont
had the lowest student-to-counselor ratio and provided one counselor for every 207 students. Arizona (758-to-
1), Michigan (693-to-1), and California (682-to-1) had the three highest counselor caseloads in the country. In
California alone, 5.9 million of the state’s 6.2 million students (96 percent) were in schools where counselor
caseloads did not meet the 250:1 recommendation. The six New England states (Maine, Vermont, New
Hampshire, Massachusetts, Rhode Island, and Connecticut) had the highest percentage of students attending
schools that met the recommended counselor ratio.
MAP A
Student-to-Counselor Ratios
VT 207 NH 237
WA
448 ME
MT ND 303
OR 207 260
ID MN
481 SD 582 WI NY
479 357 MA 304
WY 306 393 MI
304 IA 693 PA RI 392
HI NE
292 NV 378 OH 380 CT 326
441 UT 347 IL IN
663 CO 555 532 507 WV VA NJ 321
503 KS MO KY 365 346
407 328 442 DE 424
NC
AK AZ OK TN 417 370 MD 383
433 758 NM AR SC
302 370 DC 347
391 AL GA 367
MS
TX 432 419 480
LA
434 504
FL
554
Recommended: 250:1
National Avg: 444:1
Lowest: 207:1 (VT)
MEETING
Highest: 758:1 (AZ) RECOMMENDATION
NOT MEETING Data Source: U.S. Department of Education,
2015–2016 Civil Rights Data Collection (CRDC)
School Social Workers
According to the School Social Work Association of America, social work services should also be provided
at a ratio of 250 students to one social worker.68 Federal CRDC data reveals a ratio of 2,106 students to one
social worker, creating a caseload for social workers nearly eight times greater than what is recommended by
the experts. Map B shows the average student-to-social workers ratio by state. Less than 3 percent of schools
nationwide, only about 3,000 schools, met the professional recommendation. More than 67,000 schools
reported zero social workers serving their students.69
12 American Civil Liberties UnionMAP B
Student-to-Social Worker Ratios
VT 1,265 NH 2,408
WA
14,391 ME
MT ND 617
OR 2,475 655
ID MN
8,831 SD 852 WI NY
8,447 773 MA 1,522
WY 3,413 1,750 MI
946 1,051 PA RI 686
HI NE IA
NV 8,973 OH 3,416 CT 580
8,730 UT 3,350 IL IN
CA 8,198 CO 741 1,829 4,854 WV VA NJ 655
6,132 2,258 KS MO KY 15,4332,067
1,360 2,250 3,400 DE 2,547
NC
AK AZ OK TN 4,428 1,584 MD 2,324
6,240 3,382 NM AR SC
5,167 3,655 4,238 DC 365
945 GA
MS AL
TX 4,956 8,615 5,272
LA
13,604 1,979
FL
Recommended: 250:1
National Avg: 2,106:1
Lowest: 365:1 (DC)
MEETING DATA NOT
Highest: 8,973:1 (IA) RECOMMENDATION
NOT MEETING AVAILABLE
Data Source: U.S. Department of Education,
2015–2016 Civil Rights Data Collection (CRDC)
School Psychologists
The National Association of School Psychologists (NASP) recommends a ratio of 500-700 students per
school psychologist, depending on the comprehensiveness of services being provided.70 Yet, the federal data
shows a national average ratio of 1,526 students to one psychologist. This ratio failed to meet the minimum
recommended ratio of students to psychologist and is over 200 percent to 300 percent greater than what
is recommended by the experts. More than 19 million students, 43 percent of public school students,
were enrolled in a school that failed to have a school psychologist. Map C shows the average student-to-
psychologist ratio by state.
This lack of school psychologists is extremely troubling given that school psychologists are usually the
staff most qualified to assess a student’s safety risk to themselves and others. A NASP survey of school
psychologists in 24 states found an estimated student-to-school psychologists ratio of 1,408 to one. This
deficit translates to 63,000 additional school psychologists needed to provide students with the full range of
psychological services and supports students need.
Cops and No Counselors 13MAP C
Student-to-Psychologist Ratios
VT 1,496 NH 919
WA
1,408 ME
MT ND 1,830
OR 698 2,162
ID MN
3,393 SD 1,273 WI NY
479 648 MA 825
WY 1,742 901 MI
847 2,184 PA RI 838
HI NE IA
NV IL IN OH 997 CT 548
1,866 UT 1,164
CA 2,720 CO 1,261 2,607 1,084 WV VA NJ 731
998 1,578 KS MO KY 4,3291,623
1,157 4,867 2,057 DE 825
NC
AK AZ OK TN 2,389 2,527 MD 1,198
5,368 1,593 NM AR SC
3,301 2,776 DC 410
3,673 GA 1,788
MS AL 6,390
TX LA
4,962 3,365
FL
Recommended: 700:1
National Avg: 1,526:1
Lowest: 410:1 (DC)
MEETING DATA NOT
Highest: 6,389:1 (GA) RECOMMENDATION
NOT MEETING AVAILABLE
Data Source: U.S. Department of Education,
2015–2016 Civil Rights Data Collection (CRDC)
School Nurses
Several states, along with the American Nurses Association, recommend a ratio of one school nurse to
750 students in healthy student populations.71 According to the federal data, the national average is 936
students to one nurse. More than 70 percent of the nation’s students attended schools that did not meet the
recommended ratio. Over 33 percent of schools did not report a nurse on staff—this impacted 14.5 million
students. Map D shows the average student-to-nurse ratio by state.
MAP D
Student-to-Nurse Ratios
VT 324 NH 407
WA
1,830 ME
MT ND 503
OR 707 2,453
ID MN
4,112 SD 928 WI NY
1,857 542 MA 480
WY 876 1,284 MI
533 4,199 PA RI 516
HI NE IA
NV 625 OH 667 CT 435
1,743 UT 676 IL IN 991
CA 4,479 CO 871 755 WV VA NJ 484
1,482 2,853 KS MO KY 972 817
636 488 921 DE 532
NC
AK AZ OK TN 806 1,259 MD 917
813 1,294 NM AR SC
1,312 526 DC 528
695
MS AL GA 631
TX 942 588 1,288
LA
831 923
FL
Recommended: 750:1
National Avg: 936:1
Lowest: 324:1 (VT)
MEETING DATA NOT
Highest: 4,479:1 (UT) RECOMMENDATION
NOT MEETING
AVAILABLE
Data Source: U.S. Department of Education,
2015–2016 Civil Rights Data Collection (CRDC)
14 American Civil Liberties UnionIn every category of SBMH providers, there are substantial deficits in support staff that are critical
to student success and health. Social workers in schools are largely absent altogether. Counselors are
overworked with over 1,000 students at some schools. The ratio of students to school psychologists to
students is two to three times the recommended number. These glaring deficits in support staff for students
are inexcusable, especially in comparison to the number of reported law enforcement in schools.
Police in Public Schools
To better understand the prevalence of police in schools, particularly in relation to the level of mental health
staff, this report presents the latest available CRDC data for sworn law enforcement at the federal and state
level. Due to the U.S. Department of Education’s “data anomaly” with the latest CRDC, both 2015-16 and
2013-14 data regarding sworn law enforcement are included (see Table 2).72 There are several types of
sworn law enforcement stationed in schools, the most prominent being school district police officers and
“school resource officers” (or “SRO”). The term SRO is sometimes used to refer to anyone who works in a
school, wears a law enforcement-like uniform, and is responsible for a school’s security.73 SROs differ from
school safety officers, who are non-sworn civilians, typically with no arrest authority, that are employed by
the local school.
Cops and No Counselors 15TABLE 2
Federal Definitions For School Law Enforcement And Security Staff
SWORN LAW Personnel with arrest authority, including school resource officers (SROs) employed by any
ENFORCEMENT entity. Duties include security, patrol, education, training, recording/reporting discipline,
OFFICER and more.
Individual who guards, patrols, and/or monitors the school premises to prevent theft,
SECURITY violence, and/or infraction of rules. A security guard may provide protection to individuals,
GUARD and may operate x-ray and metal detector equipment. A security guard is not a sworn law
enforcement officer.
Table 3 presents the raw numbers of law enforcement and security staff present in our nation’s public
schools—overall and by state. For comparison, the table also provides numbers of school-based mental health
(SBMH) providers and teachers. As indicated, there were more sworn law enforcement officers (27,236)
reported in our nation’s schools than social workers (23,138). More than 4,800 schools actually reported more
school police and security than overall SBMH providers. Many states reported two-to-three times as many
police officers in schools than social workers. California, Illinois, and several other states reported more
security guards than nurses.
Analysis of the CRDC school police data also shows the greatest number of students reporting police in
schools were in D.C. and Tennessee, where 74 percent and 68 percent of schools reported law enforcement.74
South Carolina, North Carolina, and Florida were third with 64 percent of schools reporting law enforcement.
New York had the lowest with 17 percent of schools reporting any law enforcement in-part because of clear
underreporting and failure of New York City Public Schools to report the number of law enforcement in
schools. Other states also have deflated numbers because of underreporting. In California, many large
districts failed to report the accurate number of school police. Los Angeles Unified School District, for
example, reported less than 220 school police to the federal government in 2015-16 although an ACLU of
Southern California report found at least 378 school police present.
16 American Civil Liberties UnionTABLE 3
Raw Numbers of Support Staff, Police, and Security Guards by State
Data Source: U.S. Department of Education, 2015-2016 Civil Rights Data Collection (CRDC)
Cops and No Counselors 17Based off the 2013-2014 CRDC data, the U.S. Department of Education (DOE) raised concerns about the 1.6 million students that were in schools with law enforcement and no counselors.75 The most recent CRDC data analyzed here (from 2015-2016) indicate this gap still remains, and may even be widening. As Table 4 reveals, in 2015-2016, over 1.7 million students were found to be in schools with sworn law enforcement officers and no counselors. For illustrative purposes, Map E (see p. 22) provides a county-level comparison of the percentage of schools where there are school police and no counselors. There are many counties where more than 25 percent of schools have school police and no counselors 18 American Civil Liberties Union
TABLE 4

School Police Compared to Psychologists, Nurses,
Social Workers, and Counselors by State

*Indicates data that appear to be underreported or inaccurate.
PINK SHADING = Higher than the average for all states.
Data Source: U.S. Department of Education, 2015-2016 Civil Rights Data Collection (CRDC)

                                                                                           Cops and No Counselors   19
STATE SPOTLIGHT
Nebraska
Rose Godinez and Scout Richters, ACLU of Nebraska
In December 2018, the ACLU of Nebraska published a report titled “From the Classroom to the
Courtroom: A Review of Nebraska’s School Police Programs.” Below is a summary of that report:
In recent years, school safety concerns have led more and more schools to implement or expand
programs that establish a permanent police presence in our schools. This national trend is mirrored
in the Nebraska state experience. While perhaps well-intentioned, this trend risks significant
negative consequences for the civil rights and civil liberties of all students but particularly youth
of color, youth with disabilities, immigrant youth, and youth who identify as lesbian, gay, bisexual,
transgender, and queer (LGBTQ). School police programs have a significant disproportionate impact
on diverse communities.
An increased police presence in schools leads to more system involvement via juvenile or criminal
court. The same misconduct that would previously land a student in the principal’s office may today
land them in front of a judge and come with lifelong collateral consequences negatively impacting
their educational opportunities, job prospects, housing, voting rights, and ability to receive public
benefits.
The ACLU does not support a permanent police presence in schools. However, we recognize the
growing trend of establishing or expanding school police programs in Nebraska and undertook
an extensive research project to gain a more complete understanding of the policies and practices
guiding these programs among the public-school districts and law enforcement agencies. In the
summer and fall of 2018, the ACLU utilized two extensive rounds of open records requests, conducted
extensive legal and policy research, conducted a story banking project, and published a report in
December 2018 to learn more about how these programs currently operate and whether they are
meeting established best practices to safeguard the civil rights and civil liberties of our students.
School Police Officers
in Nebraska
The map on the right reflects the
number of school police officers by
county, as reported by school districts
within those counties in response to our
June 2018 open records requests. The
color scale reflects the racial diversity
within Nebraska counties using the most
recent U.S. Census data for the state.
As depicted in the map, racially diverse
counties tend to have more school police
than counties that are predominantly
white. In fact, counties that are 94
percent or more white account for only
4 of 76 (5 percent) of school police
officers in the state.
20 American Civil Liberties UnionBelow are a few key findings from the report:
• There is no standard state-based data collection to track the reasons students are referred
to law enforcement disaggregated by demographic information of the student like race,
gender, LGBTQ status, English Language Learner (ELL) status, and disability status.
Only a small number of school districts and only some law enforcement agencies track this
information.
• For school districts and law enforcement agencies that do track reasons for referrals,
the vast majority fail to provide critical details to contextualize the incident and do not
document the referral outcome.
• From the limited data that could be gathered on reasons students are referred to school
police, the reasons most often cited were: 1.) assault, 2.) drug-related offenses, and
3.) disturbance. Additionally, high school students made up nearly half of all the referrals
from K-12 schools that documented referral reasons.
• There are no standard provisions that must be part of a Memorandum of Understanding
(MOU) or similar agreement between a school district and a law enforcement agency
governing school police programs. Many MOUs governing Nebraska school police programs
lack critical provisions to safeguard students’ rights.
• There is no standard, minimum, or specific training requirements for school police in
Nebraska public schools, even though the majority of law enforcement agencies that
contract with school districts have their school police participate in some youth-centered
specialized training.
To learn more about school safety in Nebraska and what the ACLU is doing to protect student
rights, visit https://www.aclunebraska.org/en/issues/youth-and-schools.
Cops and No Counselors 21MAP E
County-Level Map of Percentage of Students in Schools Reporting Police
and No Counselors
Data Source: U.S. Department of Education, 2015–2016 Civil Rights Data Collection (CRDC)
Access interactive map at www.aclu.org/schooldiscipline along with state
and county-level staffing ratios.
Given the 2015-2016 CRDC data also reported on number of psychologist, nurse, and/or social worker, in
addition to counselors, Table 4 also highlights the percent and number of students in schools with police but
no psychologist, nurse, and/or social worker. Overall, nearly a third of our nation’s students attended schools
that reported having a law enforcement officer onsite while lacking any SBMH provider (i.e., counselor,
nurse, psychologist, or social worker).76 That adds up to tens of thousands of schools that are not equipped to
meet the social, emotional, or behavioral needs of students. There were 14 million students enrolled in these
schools (not counting students in Florida and Hawaii schools, as these two states that clearly failed to report
accurate staffing data—see Appendix B).
In Arkansas, Utah, and Tennessee, more than half of schools reported police but no counselor, psychologist,
nurse, and/or social worker. New Hampshire was the only state that had counselors in every school that had
police, while over 25 percent of students enrolled in the District of Columbia were in schools reporting police
and no counselors. Some state bore a disproportionate brunt of this mental-health-to-police disparity in their
schools. For example, California enrolled 23 percent, or 390,000, of the nation’s students in schools with
police but no counselors.
22 American Civil Liberties UnionSchool Arrests, Offenses, and Law Enforcement
Referrals
Arrests and Referrals to Law Enforcement
According to this federal CRDC data, there were over 230,000 referrals to law enforcement77 and 61,000
school arrests78 in the 2015-2016 school year. The actual number is likely significantly higher due to the clear
underreporting in some districts and states, which is discussed in detail in Appendix B, resulting in some
states possibly having school arrest rates over three times higher than reported in this analysis of federal
data. For example, the Florida Department of Juvenile Justice reported 7,341 school-related arrests in 2015-
16, while the state reported only 1,919 school-related arrests to the U.S. Department of Education’s CRDC.79
Unfortunately, the federal government does not require schools to report the reasons students are
arrested. However, previous research and state-reported data indicate that many school arrests arise from
criminalizing common adolescent behaviors. For example, students have been charged for “disorderly
conduct” for cursing, for “drug possession” for carrying a maple leaf, and for “disrupting school” by fake
burping. A list of over 25 common adolescent behaviors that students have been arrested for can be found in
our 2017 report and detailed in Appendix C.
State data from Florida also provides a useful case study for these purposes, as it is one of the only states
that collects detailed youth arrest data. Over 60 percent of school arrests were for misdemeanors. Disorderly
conduct was the second most charge for school arrest, and misdemeanor assault/battery (school fights) were
the most common offense. Furthermore, data demonstrates a marked racial disparity when such types of
misbehavior are the rationale for arrest. Disorderly conduct was the most common reason Black and Latina
female students were arrested in Florida public schools. Black girls made up 22 percent of Florida’s total
female student population, but 74 percent of the female students arrested for disorderly conduct. In contrast,
white male students were most often arrested for drug-related offenses.
The harm and underreporting of referrals to law enforcement should not be taken lightly. Although the
Department of Education defines “referrals to law enforcement” to include school-related arrests, several
schools and districts reported hundreds of arrests, yet zero referrals to law enforcement. These referrals
or the issuance of citations and tickets for minor infractions still result in records that could be discovered
by potential employers, colleges, and immigration authorities. For example, in Pennsylvania, low-level
offenses such as harassment, disorderly conduct, and possession of alcohol may result in a juvenile receiving
a summary citation. In this scenario, the student is not arrested but receives a ticket from a police officer
compelling an appearance before a judge in adult court to respond to charges. While these citations may seem
like a minor traffic ticket, they can carry long-term consequences for young people.80
Our analysis of the federal CRDC data found that schools reporting police had an arrest rate of 2 per 10,000
students. This was 3.5 times the rate at schools where police were not present (6 per 10,000). In some states,
the disparity in arrests between schools with and without police was even higher. For example, in Delaware,
students attending schools with police were arrested at a rate of 72 arrests per 10,000, eight times the arrest
rate for students attending schools without police (9 per 10,000). Although these data are cross-sectional
and no causal analyses can be conducted, other reports have also found an increase in school police to be
Cops and No Counselors 23associated with school arrest. Schools that prioritize police over school-based mental health professionals
create environments where typical adolescent behavior is criminalized. Having law enforcement on campus is
a key contributor to this school-to-prison pipeline. The likelihood of a student dropping out of school increases
significantly every time they touch the criminal justice system.81
Racial and Disability Status Disparities
The federal data highlights the disproportionate harm that school police have on students of color
(specifically, Black, Native American, Hawaiian/Pacific Islander and Latinx students) and students with
disabilities. As Chart 1 depicts, students with disabilities were arrested at a rate of 29 per 10,000 students,
nearly three times higher than their non-disabled peers. Black students had an arrest rate of 28 per 10,000,
which was three times that of white students. Native American and Pacific Island/Native Hawaiian students
both had arrest rates of 22 per 10,000, more than twice the arrest rate of white students. Nationally, Latinx
students were arrested at a rate 1.3 times that of white students (11 per 10,000 compared to 9 per 10,000).
CHART 1
School Arrests and Referrals to Law Enforcement per 10,000 Students by
Race Chart 1.PER
School Arrests and Referrals to Law Enforcement per
GIRLS and 65 Disability
REFERRALS ARRESTS
TO LAW PER 10,000
10,000STUDENTS
BLACK 20
NATIVE AMERICAN GIRLS
64 17 10,000 Students by Race and Disability
HAWAIIAN/PAC. ISLANDER
30 GIRLS
14
120
LATINAS (GIRLS) 28 7
WHITE GIRLS 21 5
ASIAN GIRLS 9 1 REFERRALS TO LAW PER
100 10,000 STUDENTS
REFERRALS ARRESTS
TO LAW PER
PER10,000
10,000STUDENTS
NATIVE AMERICAN235
BOYS W/ DISABILITY
53 ARRESTS PER 10,000
BLACK
80 BOYS W/ DISABILITIES
221 64
LATINO BOYS W/ DISABILITY
115 29
STUDENT BLACK NATIVE HAWAIIA LATINO WHITE ASIAN STUDENT
60 S W/ AMERIC N/ PAC. S W/O
DISABILI AN ISLANDE DISABILI
TIES R TIES
40
REFERRALS TO LAW
113 PER 10,000
93 STUDENTS
88 50 45 35 16 38
29 28
ARRESTS PER 10,00029 28 22 22 11 9 3 10
22 22
20
11 9 10
3
0
STUDENTS W/ BLACK NATIVE HAWAIIAN/ LATINO WHITE ASIAN STUDENTS
DISABILITIES AMERICAN PAC. W/O
ISLANDER DISABILITIES
Data Source: U.S. Department of Education, 2015-2016 Civil Rights Data Collection (CRDC)
Table 5 provides state-level rates for school arrests for students overall and for students of color and students
with disabilities, nationally and by state. As the data demonstrates, several states had school arrest rates
multiple times higher than the national average. Overall, students were arrested at a rate of 12 per 10,000
nationwide, but several states had rates higher than 50 or 100 per 10,000 when it came to students with
disabilities and Black students. The extent of Latinx/white disparities also varied by state. For example,
Latinx students were 3.5 times as likely to be arrested than white students in Rhode Island and more than
twice as likely to be arrested in Pennsylvania and Connecticut.
24 American Civil Liberties UnionAnalyses of risk ratios for students of color and with disabilities by state reveal some states had disparities
that even exceed the national average (see Table A4 in Appendix C). For example, in Maryland, students with
disabilities had arrest rates that were 10 times as high as their non-disabled peers. Hawaii’s students with
disabilities had arrest rates 9 times that of their non-disabled peers. Iowa had an arrest rate 7 times that of
their non-disabled peers, while Georgia and Connecticut had arrest rates more than 6 times that of their non-
disabled peers.
Overall, students with disabilities were nearly 3 times more likely to be arrested than students without
disabilities, and the risk multiplied at schools with police. While schools without police had an average arrest
rate for students with disabilities of 17 per 10,000 students, schools with police had an average arrest rate
for these students more than three times as high, at 51 per 10,000 students. Furthermore, students with
disabilities were 12 percent of students but were 28 percent of students arrested at school in the 2015-16
school year (see Table A5 in Appendix C). The table also highlights the arrests and referrals composition
index82 for students by race across all 50 states and D.C. Native American students, for example, are only 1
percent of students and 2 percent of arrests nationally, but in states like South Dakota, they are 1 percent of
students and 46 percent of student arrests.
For many students, the consequence of a traditional school arrest varies little from a referral to law
enforcement. Both can have lifetime consequences for students, and both contribute to the historic
inequalities faced by students of color and students with disabilities. Examination of rates of school referrals
of law enforcement finds similar disparities based on race and disability states (see Table 6). As the data
demonstrates, several states had school referral rates multiple times higher than the national average.
Cops and No Counselors 25STATE SPOTLIGHT
Florida
By Michelle Morton, ACLU of Florida
Along with significant discrepancies in reporting staffing, Florida is failing to accurately report
student arrest data. The CRDC and the Florida Department of Juvenile Justice (FLDJJ) are
measuring the same metric—school-related arrests—but are reaching very different numbers.141
Both reports claim to include arrests of students for offenses happening on school grounds, on
school transportation, and during off-campus school events. The FLDJJ does not include other
offenses, such as violations of probation or court related charges, and theoretically may not
include every referral by a school official (if the offense happened at an off-campus, non-school
function).
Yet, Florida reported just 26 percent of the total number of students arrested in 2015-16 to the
CRDC—only 1,919 students compared to the 7,341 students reported to be arrested for school-
related offenses by the FLDJJ.
This discrepancy must be addressed to ensure Florida is accurately represented on the national
level, especially given recent policy changes requiring armed staff or law enforcement in every
school. Such a police presence in school is unprecedented and must be monitored closely for its
impact on young lives
26 American Civil Liberties UnionYou can also read