Exchange Rate Prediction using Support Vector Machines
←
→
Page content transcription
If your browser does not render page correctly, please read the page content below
Exchange Rate Prediction using Support
Vector Machines

A comparison with Artificial Neural Networks

Thesis submitted in partial fulfillment of the requirements for the degree of

MASTER OF SCIENCE IN MANAGEMENT OF TECHNOLOGY

AUTHOR
Mohamad Alamili
1286676

JANUARY, 2011

DELFT UNIVERSITY OF TECHNOLOGY
Faculty of Technology, Policy and Management
Section of Information and Communication Technology

GRADUATION COMMITTEE
Chairman         Prof. dr. Y.H. Tan
1st Supervisor   Dr. ir. J. van den Berg
Daily Supervisor M. Davarynejad
2nd Supervisor   J. Vrancken
Acknowledgments

There are many people without whom this master’s thesis would not have been possible. It is, in fact,
difficult to fully acknowledge their support towards me and towards this work. Nonetheless, I would
like to take the opportunity to express my gratitude towards them.

First and foremost, I would like to express my deepest gratitude to my first supervisor Dr.ir. Jan van den
Berg, for his continuous support and guidance in writing this thesis, and for his patience, motivation,
enthusiasm, and immense knowledge that has helped me tremendously. I have been amazingly
fortunate to have a supervisor who gave me the freedom to explore on my own, and at the same time
the guidance to overcome many difficult situations as they presented. Not only did I enjoy our
discussions on related topics that helped me improve my knowledge in the area, but also the numerous
personal talks that we had at almost each time that we met.

I would like to extend my gratitude to the rest of my thesis committee: Prof. dr. Y.H. Tan, Mohsen
Davarynejad, and Jos Vrancken. Without their support, this thesis could not have been possible. Special
gratitude goes to Mohsen, who provided me with insightful comments and constructive criticisms at
different stages of my thesis. I am also grateful to him for holding me to a high research standard and
enforcing strict validations for each research result, for encouraging the use of correct grammar and
consistent notation in my writings, and for carefully reading and commenting on countless revisions of
this thesis. I would like to thank Jos for sharing his knowledge and expertise in mathematics, and
explaining me the basics where I did not understood them correctly. His sharp revisions on my writing
has also been greatly appreciated.

Furthermore, I warmly appreciate the generosity, support, patience, and understanding from my
girlfriend Sabine de Ridder. Without her countless times of helping my writing, this thesis would not
have been possible. In all, for taking care of me. I would also like to thank all my friends for their support
and companionship, and all my fellow students, those who directly and indirectly supported me in
completing my thesis and my study, and who made my studies in Delft and Singapore an enjoyable and
unforgettable experience.

Most importantly, none of this would have been possible without the love and patience of my family.
My immediate family to whom this thesis is dedicated to, including my mother Ahlam Alfattal, my
father Adnan Alamili, my sisters Aseel Alamili and Zaman Alamili, and my brother in law and true
friend, Amar Alambagi. They all have been a constant source of love, concern, support and strength. I
would like to express a special heart-felt gratitude to my mother, for her continuous support
throughout my entire studies, and for believing in my capabilities, at times more than I believed in
myself. Most importantly, for making me who I am.

Mohamad Alamili,
Den Haag 2011

                                                                                                            2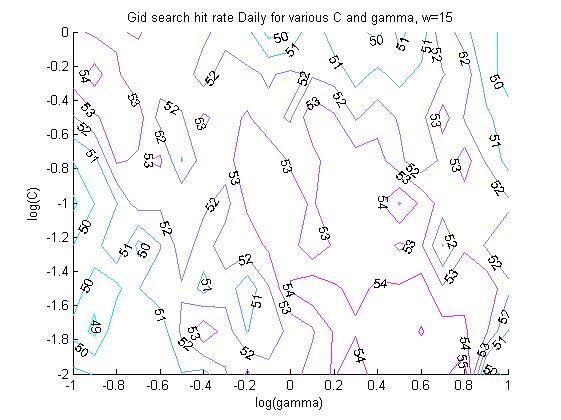
Table of Contents
Executive Summary ................................................................................................................ 5

1     Introduction .................................................................................................................... 6
    1.1 Research Problem......................................................................................................... 7
    1.2 Research Objective ....................................................................................................... 9
    1.3 Research Approach ...................................................................................................... 11

2     Conceptualization of financial forecasting .........................................................................14
    2.1 Financial markets ........................................................................................................14
    2.2 Is it possible to forecast financial markets? .................................................................... 15
    2.3 Traditional forecasting techniques for the currency market ............................................. 17
      2.3.1    Fundamental analysis .........................................................................................................17
      2.3.2     Technical analysis ...............................................................................................................17
    2.4 Conclusions ................................................................................................................ 19

3     Computational Intelligence Techniques used .....................................................................20
    3.1 Artificial Neural Network..............................................................................................20
      3.1.1    The Multilayer Perceptron Neural Network ....................................................................... 20
      3.1.2    Application of Artificial Neural Networks in financial forecasting....................................... 23
    3.2 Support Vector Machines .............................................................................................24
      3.2.1    The Theory of Support Vector Machines: Classification ..................................................... 24
      3.2.2     The Theory of Support Vector Machines: Regression ........................................................ 31
      3.2.3    Application of Support Vector Machines ............................................................................ 33
    3.3 Conclusions ................................................................................................................. 33

4     Design of the Prediction Models .......................................................................................36
    4.1 Input Selection ............................................................................................................36
      4.1.1    Sampling ........................................................................................................................... 37
      4.1.2     Transforming .................................................................................................................... 39
      4.1.3    Normalizing ....................................................................................................................... 40
      4.1.4     Dividing ............................................................................................................................. 42
      4.1.5    Windowing ........................................................................................................................ 42

                                                                                                                                                       3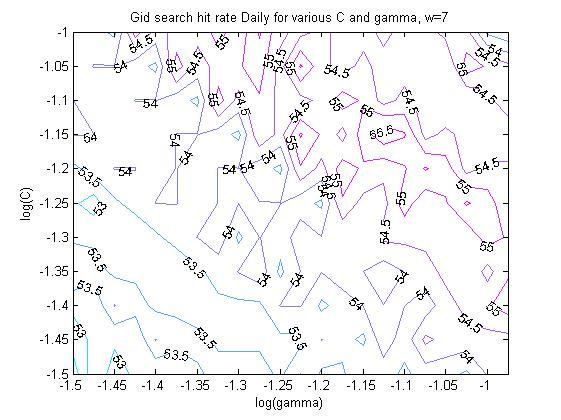
4.2 Output Selection .........................................................................................................43
      4.2.1        Performance measures .................................................................................................. 43
    4.3 The bias-variance dilemma ...........................................................................................45
    4.4 The SVM model selection .............................................................................................47
      4.4.1        The SVM architecture .................................................................................................... 47
      4.4.2        The SVM kernel.............................................................................................................. 53
    4.5 ANN Model Selection ...................................................................................................56
      4.5.1        Neurodynamics of the network ..................................................................................... 56
      4.5.2        Architecture of the network ........................................................................................... 57
    4.6 Conclusions .................................................................................................................59

5     Experimentation ............................................................................................................ 62
    5.1 Experimental setup .................................................................................................... 62
    5.2 SVM experiments ........................................................................................................63
    5.3 ANN experiment .........................................................................................................67
    5.4 Detailed analysis of the experimental results ................................................................ 69

6     Reflection....................................................................................................................... 72

7     Conclusions ....................................................................................................................74
    7.1 Answers to the Research Questions ..............................................................................74
    7.2 Limitations ................................................................................................................. 77
    7.3 Future Research ......................................................................................................... 78

References ........................................................................................................................... 80

                                                                                                                                                4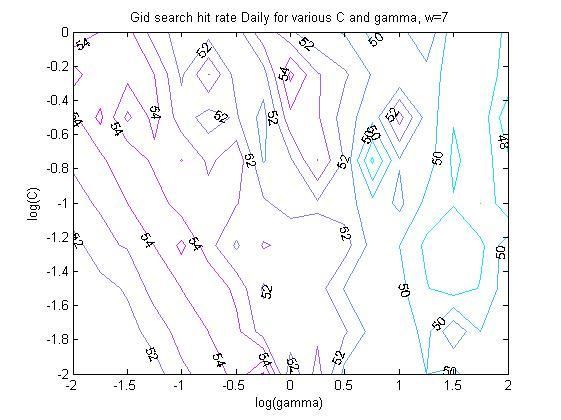
Executive Summary

Financial forecasting in general, and exchange rate prediction in particular, is an issue of much interest
to both academic and economic communities. Being able to accurately forecast exchange rate
movements provides considerable benefits to both firms and investors. This research aims to propose
a decision support aid to these firms and investors, enabling them to better anticipate on possible
future exchange rate movements, based on one of the most promising prediction models recently
developed within computational intelligence, the Support Vector Machine.

The economics of supply and demand largely determine the exchange rate fluctuations. Calculating the
supply and demand curves to determine the exchange rate has shown to be unfeasible. Therefore, one
needs to rely on various forecasting methods. The traditional linear forecasting methods suffer from
their linear nature, since empirical evidence has demonstrated the existence of nonlinearities in
exchange rates. In addition, the usefulness of the parametric, and nonparametric, nonlinear models,
has shown to be restricted. For these reasons, the use of computational intelligence in predicting the
Euro Dollar exchange rate (EUR/USD) is investigated, in which these previously mentioned limitations
may be overcome. The methods used are the Artificial Neural Network (ANN) and the Support Vector
Machine (SVM).

The ANN, more specifically the Multilayer Perceptron, is composed of several layers containing nodes
that are interconnected, allowing the neurons to signal each other as information is processed. The
basic idea of the SVM is finding a maximum margin classifier that separates a training set between
positive and negative classes, based on a discriminant function that maximizes the geometric margin.
The model selection for the prediction models was chosen to be based on the bias-variance dilemma,
which denotes the trade-off between the amount of variation within different estimators on different
values of a specific data set (variation) and the difference between the estimator’s expected value and
the true value of the parameter being estimated (bias). Experiments on the Mackey-Glass dataset and
on the EUR/USD dataset have yielded some appropriate parameter ranges for the ANN and SVM.

On theoretical grounds, it has been shown that SVMs have a few interesting properties which may
support the notion that SVMs generally perform better than ANNs. However, on empirical grounds,
based on experimentation results in this research, no solid conclusion could be drawn regarding which
model performed the best on the EUR/USD data set. Nevertheless, in light of providing firms and
investors the necessary knowledge to act accordingly on possible future exchange rate movements, the
SVM prediction model may still be used as a decision-support aid for this particular purpose. While the
predictions on their own as provided by the SVM are not necessarily accurate, they may provide some
added value in combination with other models. In addition, users of the model may learn to interpret
the predictions in such a way, that they still signal some sort of relevant information.

                                                                                                        5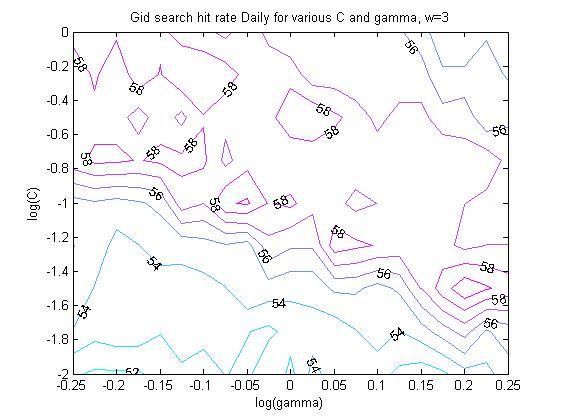
1       Introduction

With an estimated $4.0 trillion (Bank of International Settlements, 2010) average daily turnover, the
global foreign currency exchange market is undoubtedly considered the largest and most liquid of all
financial markets. The exchange market is a complex, nonlinear, and a dynamic system of which its
time series, represented by the exchange rates, are inherently noisy, non-stationary, non-linear, and of
an unstructured nature. (Hall, 1994; Taylor, 1992; Yaser et al., 1996). These characteristics, combined
with the immense trading volume and the many correlated influencing factors of economic, political,
and psychological nature, has made exchange rate prediction one of the most difficult and demanding
applications of financial forecasting (Beran, 1999; Fernandez-Rodriguez, 1999).

For large multinational firms, which regard currency transfers as an important aspect within their
business, as well as for firms of all sizes that import and export products and services, being able to
accurately forecast exchange rate movements provides a considerable enhancement in the firm’s
overall performance and profitability (Rugman and Collinson, 2006). In addition to firms, both
individual and institutional investors benefit from an exchange rate prediction as well (Dunis, 2008).
The firms and investors will on one hand be able to effectively hedge themselves against potential
market risks, while on the other hand have the means to create new profit making opportunities. The
aim of this research is aiding firms and investors with the necessary knowledge to better anticipate on
possible future exchange rate movements. The motivation for this research is to apply one of the most
promising prediction models recently developed, being the Support Vector Machine (Vapnik, 1995), to
assess whether it can achieve a high performance in exchange rate prediction.

This thesis consists of seven chapters and is organized as follows. This first chapter describes the
research problem, formulates the research objective and questions, and explains the research approach.
Chapter 2 dives into the philosophy of financial forecasting and provides a basic understanding of the
traditional forecasting methods. Chapter 3 explores the application of Computational Intelligence in
financial forecasting, particularly that of Support Vector Machines and Artificial Neural Networks.
Chapter 4 describes the design of the Support Vector Machine and the Artificial Neural Network for the
purpose of exchange rate prediction. Chapter 5 outlines the experiment methodology and discusses the
empirical results. Chapter 6 reflects on these results with respect to the original research objective and
questions. Finally, chapter 7 presents the conclusions, limitations, and future research.

                                                                                                        6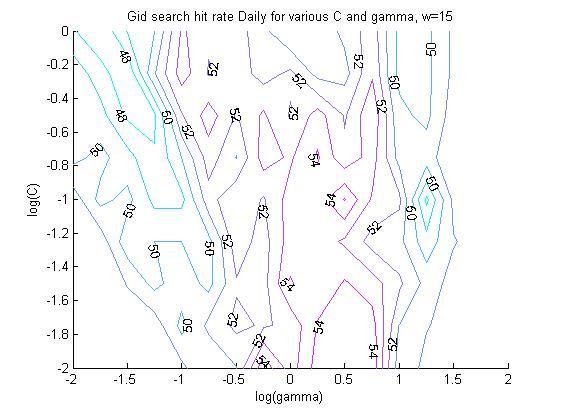
1.1 Research Problem
Financial forecasting in general, and exchange rate prediction in particular, is an issue of much interest
to both academic and economic communities (Lento et al.,2007). Within the academic community,
forecasting by prediction models is an important and widely studied topic employing various statistical
methods and data mining techniques. These methods include, but are not limited to, Regression
Analysis, Discriminate Analysis, Logistic Models, Factor Analysis, Decision Trees, Artificially Neural
Networks (ANN), Fuzzy Logic, Genetic Algorithms, and Support Vector Machines (SVM) (Kecman,
2001). These so-called ‘computational intelligence’ models within the realm of soft computing, have
often shown to be quite successful in financial forecasting which includes forecasting interest rates,
stock indices, currencies, creditworthiness, or bankruptcy prediction (Zhang et al., 1997). They are
however not limited to financial forecasting, but have been applied by many research institutions to
solve many diverse types of real world problems in pattern classification, time series forecasting,
medical diagnostics, robotics, industrial process control, optimization, and signal processing (Kecman,
2001).

Within the economic community, the interest in exchange rate prediction originates from the benefits
of being able to better anticipate future movements, be it for financial gain or protecting against
certain risks (Liu et al.,2007). For instance, large multinational firms consider currency transfers as an
important aspect within their business and may benefit greatly from an accurate forecasting (Rugman
and Collinson, 2006). However, this interest in the exchange market is not limited to large multinational
firms. In fact, exchange rate prediction is relevant to all sorts of firms, disregarding its size, geographic
dispersion, or core business. The reason is that whether or not a firm is directly involved in international
business through imports, exports, and direct foreign investment, its purchases of imported products or
services may require payment in a foreign currency. As a consequence, the prices of imported or
exported products and services may vary with the exchange rate, introducing a certain exchange risk.
This exchange risk is defined as the possibility that a firm will be unable to adjust its prices and costs to
exactly offset exchange rate changes (Rugman and Collinson, 2006). Even if a domestic firm does not
import or export products and services, it might still face this risk, since suppliers, customers, and
competitors that are doing international business will adjust to the exchange rate changes, which will in
turn affect the domestic firm as well. Apart from importing and exporting goods, a firm may choose to
invest in a foreign business or security, and face both different interest rates and different risks from
those at the home country. For instance, borrowing funds abroad may appear interesting if it is less
expensive and under better terms than borrowing domestically, yet it still introduces an exchange risk.

There are certain measures that allow a firm to minimize its exchange risk. These measures range from
trying to avoid foreign currency transactions to currency diversification and all methods of ‘hedging’
against exchange rate changes (Rugman and Collinson, 2006). Independent of the firm's strategy to
minimize the exchange risk, being able to accurately predict exchange rate movements may reduce the
exchange risk significantly (Dunis and Williams, 2002). Literature provides many methods to predict the
financial markets in general and the exchange rate market in particular, which is conducted by either
technical analysis or fundamental analysis (Bilson, 1992; LeBaron, 1993; Levich & Thomas, 1993; Taylor

                                                                                                           7
1994). Technical analysis bases the prediction only on historical prices, whereas fundamental analysis
bases it on macro- and microeconomic factors. Traditional methods within technical analysis, such as
common market structure trading rules and the ARIMA method, have been empirically tested in an
attempt to determine their effectiveness on different financial securities such as currencies, with
varying success (Brock, Lakonishok, and LeBaron, 1992; Chang and Osler, 1994; Lo and MacKinley,
1999).

Computational intelligence techniques for exchange rate prediction has gained a lot of popularity the
last 15 years, especially with ANNs, that has been widely used for this purpose and in many other
different fields of business, science, and industry (Bellgard and Goldschmidt, 1999; El Shazly and El
Shazly, 1997; Yao et al., 1997; Widow et al., 1994). The common element of computational intelligence
techniques is generalization through nonlinear approximation and interpolation in usually high-
dimensional spaces (Kecman, 2001). It is the power of their generalization ability, producing outputs
from unseen inputs through captured patterns in previously learned inputs, what makes these
techniques excellent classifiers and regression models (Kecman, 2001). This partly explains their
increased popularity in this field and distinguishes them from the previously mentioned traditional
methods.

Recently, a new technique within the field of computational intelligence, that of Support Vector
Machines (SVM), has been applied to financial markets. In the current literature, these have often
shown to be more effective than ANNs (Kim, 2003; Thissen et al., 2003; Liu and Wang, 2008). The SVM,
which has been introduced by Vapnik and coworkers in 1992, is a noticeable and prominent classifier
and perfectly able to solve nonlinear regression estimation problems. However, it has been shown that
the prediction performance of SVMs are very sensitive to the value of its parameters, being the value of
soft-margin constant and various kernel parameters (Kim, 2002). The very few researchers that
examined the feasibility of SVMs applied to exchange rate prediction, have chosen these parameters
for being the most effective on the used data set (Liu and Wang 2008; Tay et al., 2000; Thissen et al.,
2003).

In this research, the focus is on employing an SVM for the purpose of exchange rate prediction, meant
as a decision-support aid to firms and investors. The contribution of this research is to identify the best
performing SVM in terms of model structure and parameters on a given exchange rate, being the
EUR/USD exchange rate. The performance of the SVM will be compared to that of an ANN on the used
exchange rate data set.

                                                                                                         8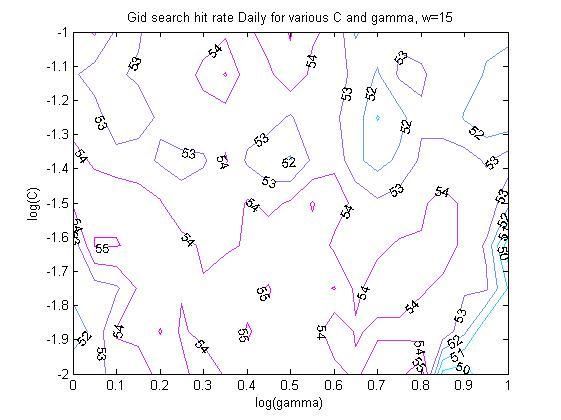
1.2 Research Objective
The main research objective is formulated as follows:

This research aims to propose a prediction model that is able to accurately predict exchange rate
movements, thereby acting as a decision-support aid for firms and investors, providing them the necessary
knowledge to better anticipate possible future exchange rate movements.

This objective is very broad in the sense that there are many definitions of predicting, many kinds of
prediction models, and many variations of the exchange rate market. This research focuses on a narrow
range of solutions to fulfill this objective, which will be given subsequently.

Regarding predicting, it should be stressed at this earliest moment that the focus of this research is
developing a prediction model that is useful for firms and investors, yet not necessarily a profitable
trading model. In a relatively slow-moving market, accurate prediction models may well equate to a
profitable trading model (Bodt et al., 2001). However, within a high-frequency data environment, such
as the exchange rate market, having an accurate prediction model does not necessarily lead to
achieving profitable trading results (Cao and Tay, 2000). To benefit financially from an accurate
prediction, one needs to take a trading strategy into account with all the associated transaction costs,
which is a much more complicated task (Chordia and Shivakumar, 2000). In this sense, the aim of this
research is to develop a decision-support aid by which the achievable profitability is inferred from the
extent of prediction errors, rather than measured directly. For instance, a prediction model in this
research is regarded to be useful for firms and investors when the prediction errors are relatively small,
without actually having measured the gain in profits due to the predictions. The firms and investors are
then able to act accordingly on these predictions by buying or selling a specific currency based on the
predicted probability that this specific currency will rise, fall, or remain unchanged. For instance, if a
French firm is seeking to import goods from the United States, which requires a currency exchange
from euros to dollars, it may decide to do so when the euro dollar exchange rate is predicted to rise, for
which the French firm will receive more dollars per euro and thereby reducing the import costs.

Another point regarding predicting, is whether it is conducted by either technical analysis or
fundamental analysis, as mentioned before. Technical analysis bases its prediction only on historical
data such as past prices or volumes, whereas fundamental analysis bases its prediction on macro- and
microeconomic factors that might determine the underlying causes of price movements, such as the
interest rate and the employment rate (Bilson, 1992; LeBaron, 1993; Levich & Thomas, 1993; Taylor
1994). This research will solely focus on technical analysis, and not on fundamental analysis. The
motivation behind this choice is that technical analysis is the most commonly used method of
forecasting by investment analysts in general and foreign exchange dealers in particular (Taylor and
Allen, 1992; Carter and Auken, 1990). Technical analysis is also more often applied than fundamental
analysis when one is mostly interested in the short-term movements of currencies (Robert, 1999).
Within technical analysis, only past exchange rates will be investigated, since volume is not available in
the exchange rate market.

                                                                                                        9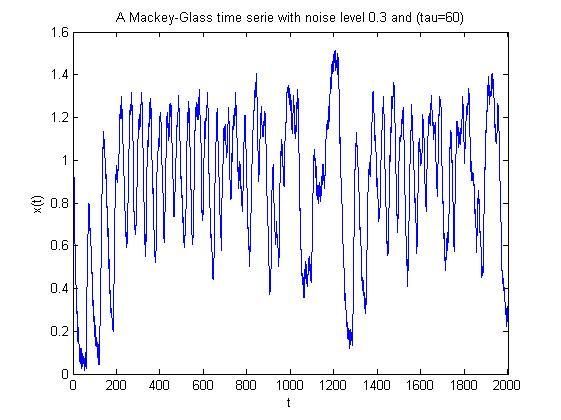
Concerning the exchange rate market, the Euro Dollar exchange rate (EUR/USD) will be the currency
pair subjected to forecasting. This is a matter of choice, partly justified by being the most traded
currency pair in the world, and partly by the very specific interest this currency pair has raised in the
literature of financial forecasting by means of computational intelligence (Dunis et al., 2008).

As described earlier, there are many prediction models currently available. Within the scope of this
research, only models based on computational intelligence will be investigated, namely the SVM and
the ANN. A comparison will be made between the SVM and the ANN, while the focus will be more on
the SVM. The reason why only computational intelligence techniques are used in this research is
because of the earlier mentioned characteristics that they possess which distinguished them from the
other previously mentioned traditional methods and increased their popularity in financial forecasting
over the last decade. These characteristics revolve around generalization through nonlinear
approximation and interpolation in usually high-dimensional spaces. (Kecman, 2001). The power of
their generalization ability, producing outputs from unseen inputs through captured patterns in
previously learned inputs, makes them excellent classifiers and regression models (Kecman, 2001).
Based on the aforementioned, the main research question is formulated as follows:

"What is the practical feasibility in terms of prediction accuracy of a Support Vector Machine compared to
an Artificial Neural Network for the purpose of exchange rate prediction?"

As can be noted, the comparison criteria between the SVM and the ANN is solely based on prediction
accuracy. Other possible comparison criteria are computational complexity and speed. However, in this
research, these comparison criteria are not taken into account. The reason for this choice is that for the
purpose of the decision-support aid as proposed in this research, prediction accuracy is the most crucial
element which will always be the deciding factor, even if it means slower speed or higher
computational complexity. In addition, earlier research has shown that the speed between the SVM and
the ANN in operational mode is neglectable for the decision-support aid as proposed in this research,
since the speed difference is merely seconds to minutes rather than hours (LeCun et al.,1995).
Furthermore, previous research concerning financial forecasting usually does not take speed into
account, since accuracy is again far more relevant than speed in these situations (Huang et al., 2004).

In order to answer the main research question, experiments need to be conducted for both an SVM and
an ANN to predict the EUR/USD exchange rate movements, by which both results can be compared to
each other and a conclusion can be drawn. In order to arrive at these experiments and the conclusion,
the main question will be approached by answering the following subquestions:

    1.   What are the options for exchange rate prediction?
    2.   What is the input selection for the SVM and the ANN, and how is this input preprocessed?
    3.   What is the output selection for the SVM and the ANN, and how is this output interpreted?
    4.   How to approach the model selection for both the SVM and the ANN?
    5.   Which model performed best in predicting the EUR/USD exchange rate movements?

                                                                                                       10
The subquestions will lead to the answer of the main research question in a chronological order. Firstly,
the possibilities of exchange rate prediction are examined. This will not only provide information
regarding the exchange rate market and its predictability, but it will also provide insights into the
second subquestion, i.e. data preprocessing suitable for financial markets. The output selection as in
third sub question will be based on the main research question, by measuring the feasibility of a specific
model assessed through the prediction accuracy. The fourth subquestion describes how different
models are constructed by different influencing parameters, based on the model complexity and
expressed in the bias-variance dilemma, as will be explained later in Chapter 4. The final subquestion is
obtained by doing experiments on a range of suitable models and drawing a conclusion on these
experimental results.
1.3 Research Approach
This research is approached through a conceptualization stage, an analysis stage, a design stage,
experimentations, and the forthcoming reflection and conclusions. The conceptualization and analysis
stages are entirely based upon a literature review, while the design stage is partly based upon a
literature review and partly on conducted experiments. These three stages will lay the foundation for
the experimentations that provides empirical results to be reflected and from which conclusions are
drawn regarding the best performing model in predicting the exchange rate market. The figure below
illustrates this research approach:
Conceptualization
Analysis
Design
Experimentations
Reflection
Conclusions
Figure 1 - Research approach in six steps
The literature review for the first three stages is conducted by consulting several databases from the
university, to gain access to different journal providers such as JSTOR, ScienceDirect, Emerald Insight,
Springerlink, etc. The academic search engine Google Scholar has also been employed for this purpose.
11In addition, both references from colleagues as well as references in the articles found have been
reviewed.
The search keywords used include: financial markets, financial forecasting, currency market, foreign
exchange, forecasting techniques, computational intelligence, support vector machines, neural networks,
multilayer perceptrons, genetic algorithms, hybrid models of computational intelligence, regression models
The aim of the conceptualization stage is to understand the fundamental subjects related to financial
forecasting through a literature study. Firstly, a brief description of financial markets in general and the
exchange market in particular is provided. Secondly, it is examined to what extent financial forecasting
is considered possible according to different academics in this field. Thirdly, different traditional
methods for forecasting the financial markets are given, which may provide valuable insight in how the
more advanced computational intelligence techniques can be applied to exchange rate prediction.
The analysis stage follows up on the philosophy of financial forecasting in the conceptualization stage,
by presenting some of the most popular financial forecasting techniques, both within and without the
field of computational intelligence. While doing so, the focus will be mostly on the currency market and
mostly on technical analysis techniques, to be more in line with the focus of this research. It is
noteworthy to mention that it is out of the scope of this research to provide an extensive overview of all
the computational intelligence techniques in financial forecasting. Therefore, this stage is limited to the
exploration of ANNs and SVMs. Nevertheless, the underlying theory behind SVMs and ANNs is
described, in which the bare basics are briefly introduced, necessary to effectively apply these models in
financial forecasting. In addition, the application of these models in financial forecasting by earlier
research is examined.
Following the analysis stage is the design stage, which, in addition to further literature review and
certain experiments, incorporates the knowledge acquired from the previous stages to outline the
design for the SVM and the ANN. The design stage starts with the input selection, in which the
processing steps to prepare the raw data to a suitable input for the models are investigated. This
processing will be broken down into five steps (Huang et al., 2004):
1. Sampling
2. Transforming
3. Normalizing
4. Dividing
5. Windowing
For each step, it is investigated what the possible choices are, based on a literature review, and what
specific processing will be chosen for in this research. A visual representation on the EUR/USD data set
is presented after certain processing steps, to illustrate that particular processing step.
12Following is the output selection, that determines the output of the models and how this output is
interpreted. Different choices regarding the output selection of the models is investigated and a
specific output appropriate to the focus of this research is selected. In addition, different performance
measures will be examined. The performance measures should be comparable between the ANN and
the SVM, in order to draw a conclusion which of the two performs better.
Subsequently, the model selection for the ANN and the SVM is examined. The aim is to identify a
suitable range for the parameters that yields a balanced model in terms of model complexity. The
model complexity will be expressed in the bias-variance dilemma.
The results in the design stage will provide an appropriate range for certain parameters that serve as a
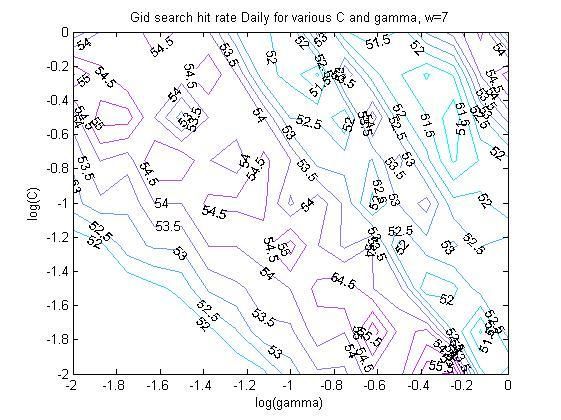
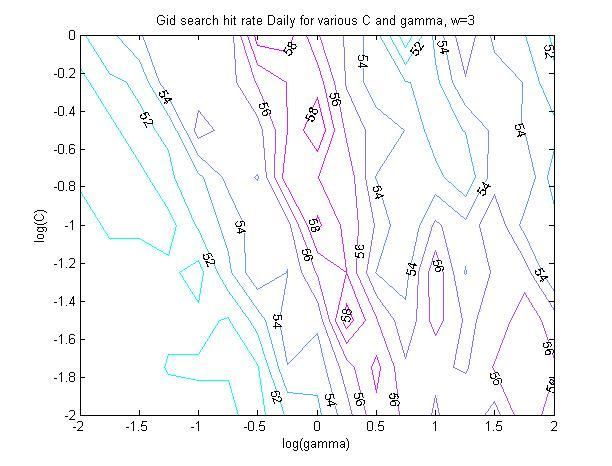
starting point for the experimentations. As a result of the experimentations, the best SVM and the best
ANN is identified through a grid search on the parameter range, based on a certain performance
measure. These results are then reflected upon, by which after A conclusion is drawn regarding how the
SVM has performed in comparison to the ANN. Subsequently, the limitations of this research and
possible future research is given.
132 Conceptualization of financial forecasting
This chapter presents the fundamental understanding of subjects related to financial forecasting
through a literature study. In the first section, a brief description of financial markets in general and the
exchange market in particular is provided. The second section examines different views regarding
whether financial forecasting is possible or not. Afterwards, different traditional methods for
forecasting the financial markets are given, which may provide valuable insight into how the more
advanced computational intelligence techniques can be applied to exchange rate prediction.
2.1 Financial markets
A necessary precondition for financial forecasting is an understanding of financial markets and the data
that is derived from these markets. This section starts with explaining what is meant by a financial
market in the broader term, and by a currency market in the specific term.
A financial market is a mechanism that allows people to buy and sell financial securities and
commodities, to facilitate the raising of capital in capital markets, the transferring of risk in derivatives
markets, or the international trading in currency markets (Pilbeam, 2010). These securities and
commodities come in many different kinds. For instance, the classical share is a popular security that
represents a piece of ownership of a firm and which is exchanged on the stock market. Other popular
securities are bonds, currencies, futures, options and warrants.
All of these financial securities are traded every day on specific financial markets with specific rules
governing their quotation (Bodt et al., 2001). However, quotation is not the only financial data that can
be retrieved from a financial market. The trading volume or the amount of dividends of a specific share
can provide valuable information regarding that share’s value. Moreover, not all financial data are
retrieved from the financial markets, data can also be retrieved from financial statements, forecasts
from a financial analysts, etc. It is out of the scope of this research to cover all these kinds of financial
securities with all the different financial data. The focus of this research concentrates on the currency
market, more specifically the EUR/USD currency market.
The global foreign currency market is undoubtedly considered the largest and most liquid of all financial
markets, with an estimated average daily turnover of $4.0 trillion (Bank of International Settlements,
2010). Currencies are traded in the form of currency pairs through a transaction between one country's
currency and another's. These transactions are not limited to the exchange of currencies printed by a
foreign country's central bank, but also includes checks, wire transfers, telephone transfers, and even
contracts to sell or buy currency in the future (Rugman and Collinson, 2006). These different
transactions are facilitated through four different markets, which include the spot market, the futures
market, the options market, and the derivatives market (Levinson, 2006). All these different markets
function separately but are yet closely interlinked.
14The spot market facilitates an immediate delivery for the currencies to be traded, while the future and
option markets allow participants to lock in an exchange rate at a certain future date by buying or
selling a futures contract or on option. The most trading in the currency market now occurs in the
derivatives market, which accounts for the forward contracts, foreign-exchange swaps, foreign rate
agreements and barrier options (Levinson, 2006). These currency markets are highly distributed
geographically and have no single physical location. Most trading occurs in the interbank markets
among financial institutions across the world. The participants in the currency market are composed of
exporters and importers, investors, speculators and governments. The most widely traded currency is
the US dollar, while the most popular currency pair is the EUR/USD (Bank of International Settlements,
2010).
The price of a specific currency is referred to as the exchange rate, which also accounts for the spread
established by the participants in the market. The economics of supply and demand largely determine
the exchange rate fluctuations (Rugman and Collinson, 2006). Ideally, one would determine the
exchange rate by calculating supply and demand curves for each exchange market participant and
anticipate government constraints on the exchange market. However, this information is lacking due to
the immense size of the exchange market, by which calculating the supply and demand curve for each
participant is simply unfeasible. This is the reason why there is no certainty in determining the
exchange rate and therefore one needs to rely on various forecasting models, being either fundamental
or technical forecasting methods, which will be explained in the next section.
For more information regarding the currency market, readers are referred to The guide to financial
markets by Mark Levinson (2006). However, for the sole purpose of this research, no further in-depth
information concerning the currency market is required.
2.2 Is it possible to forecast financial markets?
There are many typical applications of forecasting in the financial world, e.g. simulation of market
behavior, portfolio selection/diversification, economic forecasting, identification of economic
explanatory variables, risk rating of mortgages, fixed income investments, index construction, etc.
(Trippi et al., 1992). The main question remains however, to what extent financial markets are
susceptible to forecasting? Literature shows that opposing views exist between academic communities
on whether financial markets are susceptible to forecasting, which are described below.
Fama (1965) presents empirical tests of the random walk hypothesis, that was first proposed by
Bachelier in 1900. The random walk hypothesis states that past stock prices are of no real value in
forecasting future prices because past, current, and future prices merely reflect market responses to
information that comes into the market at random (Bachelier, 1900). Fama’s conclusion (1965) based
on empirical tests is: “the main conclusion will be that the data seem to present consistent and strong
support for the random walk hypothesis. This implies, of course, that chart reading, though perhaps an
interesting pastime, is of no real value to the stock market investor.” However, the statistical tests that
15Fama performed and that support the notion that financial markets follow a random walk were based
on the discovery that there was no linear dependency in the financial market (Tenti, 1996).
Nevertheless, the lack of a linear dependency did not rule out nonlinear dependencies, which would
contradict the random walk hypothesis. Some researchers argue that nonlinearities do exist in the
currency market (Brock et al., 1991; De Grauwe et al., 1993; Fang et al., 1994; Taylor, 1986).
Fama’s conclusion (1965) is supported by the main theoretical argument of the efficient market
hypothesis. This hypothesis states that a particular market is said to be efficient, if all the participants
and actors related to that market receive all possible information at any time and at the same time
(Malkiel, 1987). As a consequence, the price in such a market will only move at the arrival of new
information, which is by definition impossible to forecast on historical data only. Nevertheless, despite
this reason why financial forecasting is criticized by many economists, most notably by Malkiel (1995),
financial forecasting has still received an increasing amount of academic attention. It has been shown
by some researchers that financial forecasting does hold a predictive ability and profitability by both
technical analysis and fundamental analysis (Sweeney, 1988; Brock., Lakonishok, LeBaron, 1992;
Bessembinder and Chan, 1995; Huang, 1995; Raj and Thurston, 1996). While this shows that evidence
has been found of predictive ability by financial forecasting, it does, however, not always provide
profitability when appropriate adjustments are made for risk and transaction costs (Corrado and Lee,
1992; Hudson et al., 1996; Brown et al., 1995; Bessembinder and Chan, 1998; Allen et al., 1999).
In addition, it is questionable whether the financial markets can be portrayed as an ideal representation
of an efficient market. That financial markets are not so efficient is supported by Campbell, the Lo and
MacKinley (1997) in which they state: “Recent econometric advances and empirical evidence seem to
suggest that financial asset returns are predictable to some degree”. One of those econometric
advances has been conducted by Brock, Lakonishok and Le Baron in 1992. They used a bootstrap
methodology to test the most popular technical trading rules on the Dow Jones market index for the
period 1897 to 1986. They concluded that their results provide strong support for market predictability.
Sullivan, Timmerman and White (1999) showed new results on that same data set, extended with 10
years of data. Their bootstrap methodology avoided at least to some extent the data snooping bias by
which they were able to confirm that the results of Brock, Lakonishok and Le Baron are still valid. The
concept of the data snooping bias appears as soon as a specific data set is used more than once for
purposes of forecasting model selection (Lo and MacKinley, 1990). More recently, Lo, Mamaysky and
Wang (2000) showed that a new approach based on nonparametric kernel regression was able to
provide incremental market information and may therefore have some practical value.
Based on all the empirical evidence mentioned above, it is at least evident that there is some sort of
interest in trying to forecast the financial markets, and at most safe to consider that it might indeed be
possible. Lastly, it is noteworthy to mention that a clear distinction must be made between successfully
being able to forecast the market and the possibility to gain financially from this forecast. The
difference is in order to gain financially from a forecast, one needs to take a trading strategy into
account with all the associated transaction costs, which is a much more complicated task (Chordia and
Shivakumar , 2000).
162.3 Traditional forecasting techniques for the currency market
This section follows up on the philosophy of financial forecasting in the previous two sections by
presenting some of the most popular financial forecasting techniques (without the use of
computational intelligence) for which some show certain successes. Examining these techniques may
provide valuable insight in how the more advanced computational intelligence techniques may be
applied to exchange rate prediction. Many of these so-called traditional forecasting techniques are found
in literature for financial forecasting in general and for forecasting the currency market in particular
(Bilson, 1992; LeBaron, 1993, Levich & Thomas, 1993; Taylor 1994). There exists an important
distinction within these techniques, which entails forecasting by means of fundamental analysis versus
technical analysis (Bodt et al.,2001). Both of these techniques are described in this section, while the
focus is more on technical analysis to be more in line with the focus of his research.
2.3.1 Fundamental analysis
Fundamental analysis is concerned with analyzing the macroeconomic and/or the microeconomic
factors that influence the price of a specific security in order to predict its future movement (Lam,
2004). An example is examining a firm's business strategy or its competitive environment to forecast
whether its share value will rise or decline. In the case of the currency market, one would mostly
examine macroeconomic factors. For instance, the interest rate, the inflation rate, the rate of economic
growth, employment, consumer spending, and other economic variables can have a significant impact
on the currency market (EddelButtel and McCurdy, 1998).
The enormous literature measuring the effects of macro news on the currency market within the field
of fundamental analysis includes Hakkio and Pearce (1985), Ito and Roley (1987), Ederington and Lee
(1995), DeGennaro and Shrieves (1997), Almeida et al. (1998), Andersen and Bollerslev (1998), Melvin
and Yin (2000), Faust et al. (2003), Love and Payne (2003), Love (2004), Chaboud et al. (2004) and Ben
Omrane et al. (2005). However, there exists controversy in the academic literature concerning financial
forecasting in terms of fundamental analysis. A series of papers by Meese and Rogoff (1983) have
shown that forecasting the currency market based on a random walk model perform better than basing
the forecast on microeconomic models. A number of researchers have reinvestigated the papers
proposed by Meese and Rogoff and have generally found it to be robust (Flood and Rose,1995; Cheung
et al., 2005). Nevertheless, some researchers found that they are able to find a strong relationship
between certain macro surprises and exchange rate returns, given that a narrow time window is used
(Anderson et al., 2003).
2.3.2 Technical analysis
Technical analysis involves the prediction of future price movement of a specific financial security based
on only historical data (Achelis, 1995). This data usually consists only of past prices. However, it can also
include other information about the market, most notably volume. Volume refers to the amount of the
trades that has been made in that specific financial market over a specified time period (Cambell et al.,
1997). Technical analysis can either be of qualitative nature or quantitative nature (Achelis, 1995). When
it is of qualitative nature, it aims to recognize certain patterns in the data by visually inspecting the
17price. When it is of quantitative nature, it aims to base the prediction on analyzing mathematic
representations of the price, e.g. a moving average. Forecasting by means of technical analysis is
commonly used in forecasting the currency market, where the traders that use technical analysis are
mostly interested in the short-term movement of currencies (Taylor and Allen, 1992).
Many technical analysis techniques have been empirically tested in an attempt to determine their
effectiveness. The effectiveness is often explained by the so-called self-fulfilling property that financial
markets may hold, which refers to the phenomena that if a large group is made to believe the market is
going to rise, then that group will most likely act as if the market is truly going to rise, eventually
leading to an actually rise (Sewell, 2007). During the 1990s, the studies on technical analysis techniques
increased, along with the methods used to test them. A selection of the most influential studies that
have provided support for technical analysis techniques include (in no particular order): Jegadeesh and
Titman (1993), Blume, Easley, and O’Hara (1994), Chan, Jegadeesh, and Lakonishok (1996), Lo and
MacKinlay (1997), Grundy and Martin (2001), and Rouwenhorst (1998). Stronger evidence can be found
in Neftci (1991), Brock, Lakonishok, and LeBaron (1992), Chang and Osler (1994), Osler and Chang
(1995), Allen and Karjalainen (1999), Lo and MacKinlay (1999), Lo, Mamaysky and Wang (2000), Gençay
(1999), and Neely and Weller (1999).
One of the first technical analysis techniques are the common market structure trading rules, of which its
indicators monitor price trends and cycles (Pereira, 1999). These indicators include the filter rule, the
moving average crossover rule, Bollinger bands, trading range breakout (TRB), and many more
(Pereira, 1999). Some of these indicators were used in one of the most influential and referenced
studies ever conducted on technical analysis, the studies by Brock, Lakonishok, and LeBaron in 1992. As
mentioned before, Levich and Thomas conducted a related study with the same indicators in 1993 in
which they provided further evidence of the profitability of technical analysis techniques. These
indicators are shortly described below. Readers are referred to Murphy (1999) for a more extensive and
detailed review.
The filter rule is defined by a single parameter, which is the filter size (Ball, 1978). The most basic filter
rules are simply based on the assumption that if a market price rises or declines by a certain percentage
defined by the filter size, then the price is most likely to continue on that direction. The moving average
crossover rule compares to moving averages, mostly a short-run moving average with a long-run
moving average (Appel, 1999). This indicator proposes that if the short run moving average is above the
long run moving average, the price is likely to decline and vice versa. The moment that both averages
cross, is the moment of trend reversal. This is the most basic form of the moving average cross over
rule, while there exists many variations. Bollinger bands are two standard deviations plots above and
below a specific moving average (Murphy, 1999). When the markets exceed one of the trading bands,
the market is considered to be overextended. It is assumed that the market will then often pull back to
the moving average line (Murphy, 2000). The trading range breakout rule is also referred to as resistance
and support levels (Lento and Gradojevic, 2007). The assumption of this indicator is that when the
market breaks out above a resistance level, the market is most likely to continue to rise, while as when a
market breaks through and below a support level, the market is most likely to continue to decline. The
18resistance level is defined as the local maximum, and the support level is defined as the local minimum
(Brock, Lakonishok, and LeBaron in 1992). The reasoning behind this indicator is that at the resistance
level, intuition would suggest that many investors are willing to sell, while at the support level many
investors are willing to buy. The selling or buying pressure will create resistance or support respectively,
against the price breaking through the level. These common market structure trading rules, together
with other traditional approaches to time series prediction, such as the ARIMA method or the Box-
Jenkins (Box and Jenkins, 1976; Pankratz, 1983), assumed that the data from the financial market is of a
linear nature. However, it is certainly questionable whether this data is indeed linear, as explained
before. As a matter of fact, empirical evidence has demonstrated the existence of nonlinearities in
exchange rates (Fang et al.,1994). In addition, systems in the real world are often nonlinear. (Granger
and Terasvirta, 1993).
In order to cope with the nonlinearity the exchange rates, certain techniques that are nonlinear of
nature have been developed and applied to exchange rate prediction. These include but are not limited
to the bilinear model by Granger and Anderson (1978), the threshold autoregressive model (TAR) by
Tong and Lim (1980), the autoregressive random variance (ARV) model (So et al., 1999), autoregressive
conditional heteroscedasticity (ARCH) model (Engle, 1982; Hsieh, 1989), general autoregressive
conditional heteroskedasticity (GARCH) model (Bollerslev, 1990) , chaotic dynamic (Peel et al., 1995),
and self-exciting threshold autoregressive (Chappel et al., 1996). Readers are referred to Gooijer and
Kumar (1992) for more information regarding these nonlinear models. The problem with these models
however, is that they are parametric nonlinear models, in that they need to be pre-specified, therefore
restricting the usefulness of these models since not all the possible nonlinear patterns will be captured
(Huang et al., 2004). In other words, one particular nonlinear specification will not be general enough to
capture all the nonlinearities in the data. Furthermore, the few nonparametric nonlinear models that
have been investigated and applied to exchange rate prediction, seem unable to improve upon a single
random walk model (Fama,1965) in out of sample predictions of exchange rates (Diebold and Nason,
1990; Meese and Rose, 1991; Mizrach, 1992).
2.4 Conclusions
The economics of supply and demand largely determine exchange rate fluctuations (Rugman and
Collinson, 2006). Calculating the supply and demand curves to determine the exchange rate has shown
to be unfeasible. Therefore, one needs to rely on various forecasting models, being either based on
fundamental or technical analysis. Empirical evidence from the application of these forecasting models
on various financial markets, as well as empirical evidence in favor and against the efficient market
hypothesis, has shown that it is at least evident that there is some sort of interest in trying to forecast
the financial markets, and at most safe to consider that it might indeed be possible. The traditional
linear forecasting methods as presented in this chapter suffer from their linear nature, since empirical
evidence has demonstrated the existence of nonlinearities in exchange rates. In addition, the
usefulness of the parametric and nonparametric nonlinear models has shown to be restricted. For these
reasons, the use of computational intelligence in predicting the exchange rate is investigated, in which
these previously mentioned limitations may be overcome.
193 Computational Intelligence Techniques used
Computational intelligence techniques for the purpose of financial forecasting has gained a lot of
popularity the last 15 years, especially with ANNs (Huang et al., 2004; Bellgard and Goldschmidt, 1999;
El Shazly and El Shazly, 1997; Yao al, 1997). This chapter explores two specific computational
intelligence techniques applicable to exchange rate prediction, namely the Artificial Neural Network
and the Support Vector Machine. For both techniques, the theory is briefly described, and the
application to financial forecasting is examined.
3.1 Artificial Neural Network
Artificial Neural Networks (ANN) have been applied in many different fields of business, science, and
industry, to classify and recognize patterns (Widow et al., 1994). They have also been widely used for
financial forecasting (Sharda, 1994). Inspired by the human brain, they are able to learn and generalize
from previous events to recognize future unseen events (Kecman, 2001).
There are many different ANN models currently available. The Multilayer Perceptron (MLP), the
Hopfield networks, and the Kohonen’s self-organizing networks are probably the most popular and
influential models (Zhang, Patuwo, Hu, 1998). In this section, and in the rest of this research, the focus
from the ANN domain is on the MLP (Rumelhart et al., 1986). One reason for this choice is that the
MLP is perhaps the most popular network architecture used in general, and in financial forecasting in
particular (Huang et al., 2004; Kaastra and Boyd, 1996). Another reason is the MLP’s simple
architecture, yet a powerful problem-solving ability (Tay et al., 2000), as well as its relative ease in
implementation (Huang et al., 2004). First, the theory of the MLP is briefly discussed, based on the
book Learning and Soft Computing (Kecman, 2001). Second, the application of ANNs in financial
forecasting is investigated.
3.1.1 The Multilayer Perceptron Neural Network
An MLP is composed of several layers containing nodes. The lowest layer is the input layer where
external data is received. Generally, neural processing will not occur in the input layer. Therefore, the
input layer is not treated as a layer of neural processing units, but merely input units (Kecman,2001).
The highest layer is the output layer where the problem solution is obtained. In the case of predicting
the currency market, the inputs will be the past observations of the exchange rate and the output will
be the future value of the exchange rate. Between the input and output layer, there can be one or more
intermediate layers that are called the hidden layers. See the figure below for a graphical
representation of an MLP.
20You can also read