Valuation of Tesla, Inc - Copenhagen ...
←
→
Page content transcription
If your browser does not render page correctly, please read the page content below
Valuation of Tesla, Inc.
Is the share price ($418) as of 31st December 2019 based on
fundamentals?

A discounted cash flow (DCF) valuation approach accompanied by
a real options valuation (ROV)

Copenhagen Business School, July 2020
Master Thesis

Supervisor: Michael Ahm

Number of pages: 74
Number of characters: 135,243

Date of submission: 15.07.2020

Fatih Kemal Yılmaz (96861)
Cand. merc. International Business
1

Executive Summary

The purpose of this paper is to assess whether the price of one Tesla share as of 31st December 2019,
$418, is based on fundamentals. To address this research question, an overview of the industry
specific outlook and trends will be provided. This will be followed up by an in-depth analysis,
touching upon external as well as internal factors that might affect Tesla’s business case and to
identify sources for value creation. A financial statement analysis will round up the analysis and set
the basis –together with the insights from the strategic analysis– for the projection of future cash
flows. This will be done according to management guideline as well as historical performance.

After determining the weighted average cost of capital (WACC) that is based on various assumptions,
using a discounted cash flow (DCF) model the equity value as of 31st December 2019 will be assessed.
The DCF model will be augmented by determining the option value for Tesla’s robotaxis project, an
autonomous car sharing initiative. Fir this initiative to be realized, Tesla first has to achieve full self-
driving capability (level 5 autonomy) and gain the approval of the regulators.

Tesla is a well-established player in the electric vehicle segment and is ahead of its competitors when
it comes to the battery range as well as battery costs per kWh, autonomous driving and overall product
performance. However, the well-established players are gradually entering the electric vehicle market
and could catch up with Tesla as they have more resources and scale and scope advantages. By
moving from just being a high-premium car manufacturer (Roadster 2008, Model S & X), Tesla
launched two more affordable models, Model 3 & Y (2017 & 2020). However, Tesla is expected to
have high CAPEX in the next the fiscal years, ≈$3.5bn per year. This is necessary to build the
production plants for the upcoming models Semi, Roadster and Cybertruck. Hence, Tesla starts to
cover the major forms of terrestrial transport, as mentioned in the second part of Tesla’s master plan
in 2016.

Estimating the WACC to be 6.87% and applying the DCF model, the computed share price for Tesla
as of 31st December is $1638 leading to a total market capitalization of $296.4bn. Considering the
option value ($42bn) for the robotaxis project a share price of $1,870 or a market cap of $338.5bn is
achieved. While the share price is almost four-times the closing price of 31st December 2019, Tesla’s
currently traded share price provides further validity for this estimation.
2

Table of Contents

Table of Contents ................................................................................................................................. 2
List of Figures ...................................................................................................................................... 4
List of Tables ....................................................................................................................................... 5
List of Abbreviations ........................................................................................................................... 6
1. Introduction to the Paper ............................................................................................................ 8
 1.1 Introduction & Motivation ......................................................................................................... 8
 1.2 Research Question...................................................................................................................... 8
 1.3 Data Collection .......................................................................................................................... 8
 1.4 Delimitation ............................................................................................................................... 8
 1.5 Structure of the Paper ................................................................................................................. 9
2. Introduction to Tesla and the Automotive Industry.................................................................. 10
 2.1 Tesla ......................................................................................................................................... 10
 2.2 Operating Business Segments .................................................................................................. 10
 2.2.1 Automotive Segment ........................................................................................................ 10
 2.3 Geographical Segments............................................................................................................ 14
 2.4 Share Price Development ......................................................................................................... 15
 2.5 The Automotive Industry ......................................................................................................... 16
 2.5.1 The Electric Vehicle Market ............................................................................................. 17
 2.5.2 Global Automotive Outlook and Trends ........................................................................... 18
3. Strategic Analysis ..................................................................................................................... 20
 3.1 External Analysis – PESTEL ................................................................................................... 20
 3.1.1 Political & Legal Factors .................................................................................................. 20
 3.1.2 Economic Factors .............................................................................................................. 23
 3.1.3 Social and Environmental Factors .................................................................................... 25
 3.1.4 Technological Factors ....................................................................................................... 25
 3.1.5 Conclusion of the External Analysis ................................................................................. 27
 3.2 Industry Analysis – Porter’s Five Forces ................................................................................. 28
 3.2.1 Threat of New Entrants ..................................................................................................... 28
 3.2.2 Threat of Substitute Products ............................................................................................ 30
 3.2.3 Bargaining Power of Suppliers ......................................................................................... 30
 3.2.4 Bargaining Power of Customers ....................................................................................... 31
 3.2.5 The Intensity of Existing Competitive Rivalry ................................................................. 32
 3.2.6 Future Success Criteria for the Automotive Industry ....................................................... 33
 3.3 Internal Analysis – Value Chain Analysis & VRIN ................................................................ 34
 3.3.1 Production Capabilities ..................................................................................................... 34
 3.3.2 Product Capabilities .......................................................................................................... 36
 3.3.3 Charging Infrastructure ..................................................................................................... 38
 3.3.4 Distribution Network ........................................................................................................ 39

3

 3.3.5 CEO & Brand: Defining the Future Business Model ....................................................... 39
 3.3.6 Customer Understanding – Changed Perception of the Car ............................................. 40
 3.3.7 VRIN ................................................................................................................................. 41
4. Financial Statement Analysis ................................................................................................... 42
 4.1 Income Statement Analysis ...................................................................................................... 42
 4.2 Financial Ratios – Determining the ROE ................................................................................ 43
 4.3 Conclusion of the Financial Statement Analysis ..................................................................... 45
5. SWOT Analysis ........................................................................................................................ 47
6. Forecasting................................................................................................................................ 48
 6.1 Forecast Period ......................................................................................................................... 48
 6.2 Terminal Growth Rate ............................................................................................................. 48
 6.3 Forecast – Income Statement ................................................................................................... 49
 6.3.1 Forecasting Automotive Sales Revenues .......................................................................... 49
 6.3.2 Forecasting other Income Statement Items - Revenues .................................................... 54
7. Weighted Average Cost of Capital (WACC) ........................................................................... 57
 7.1 Target Capital Structure ........................................................................................................... 57
 7.2 Cost of Equity (re) .................................................................................................................... 58
 7.3 Cost of Debt (rd) ....................................................................................................................... 61
 7.4 Overview of WACC components ............................................................................................ 61
8. Valuation – Discounted Cash Flow Model (DCF) ................................................................... 63
 8.1 DCF – Theoretical background ................................................................................................ 63
 8.2 Tesla – DCF valuation ............................................................................................................. 64
9. Sensitivity Analysis .................................................................................................................. 66
10. Real Options Valuation (ROV) ................................................................................................ 68
 10.1 Theoretical Background ......................................................................................................... 68
 10.2 Tesla – Project Valuation using ROV .................................................................................... 69
 10.2.1 Identifying the Option ..................................................................................................... 69
 10.2.2 Length of the Option ....................................................................................................... 69
 10.2.3 Uncertainty ...................................................................................................................... 70
 10.2.4 Robotaxi Project – Option Value .................................................................................... 70
11. Conclusive Summary................................................................................................................ 74
Bibliography....................................................................................................................................... 75
Appendix ............................................................................................................................................ 81
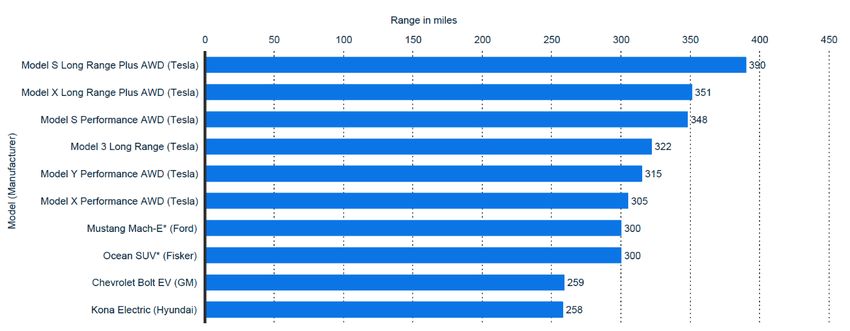
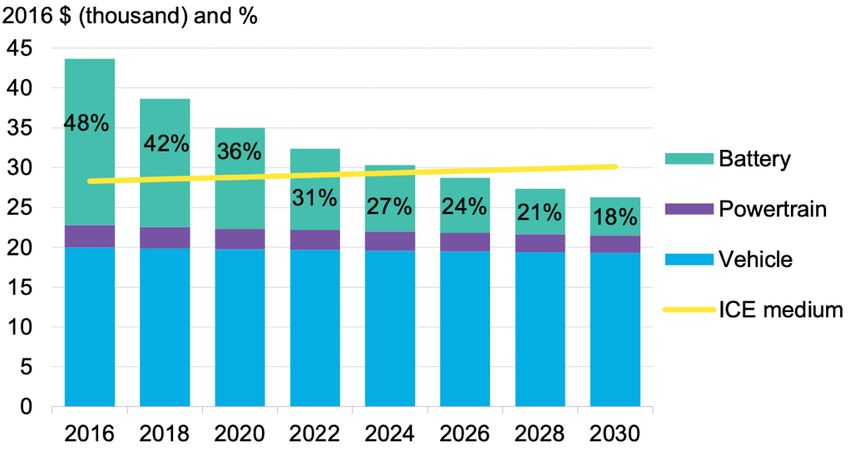
4

List of Figures

Figure 1: Structure of paper ............................................................................................................................... 9
Figure 2: Tesla’s distribution of revenue across main geographical markets.................................................. 15
Figure 3: Tesla’s price per share in USD ........................................................................................................ 15
Figure 4: Global passenger car sales 2006-2019 (CAGR of 2.27%) ............................................................... 16
Figure 5: KPMG Global Automotive Executive Survey 2019 ........................................................................ 19
Figure 6: World vehicle sales growth in % vs. World GDP growth in % for 2016-2019 ............................... 23
Figure 7: GPD development forecast for China, Europe and the U.S: ............................................................ 24
Figure 8: Expected share of battery prices from 2016 to 2030........................................................................ 26
Figure 9: Porter’s Five Forces ......................................................................................................................... 28
Figure 10: Value Chain Analysis of Tesla....................................................................................................... 34
Figure 11: Tesla Battery Costs vs. Industry Average Battery Cost ($ per kWh) ............................................ 36
Figure 12: Ranking of different EVs with respect to range in miles ............................................................... 37
Figure 13: Income statement – historical performance ................................................................................... 42
Figure 14: Operating efficiency....................................................................................................................... 43
Figure 15: Asset use efficiency ....................................................................................................................... 44
Figure 16: Short-term liquidity risk ................................................................................................................. 44
Figure 17: Long-term liquidity risk ................................................................................................................. 44
Figure 18: Return on equity ............................................................................................................................. 45
Figure 19: Forecast of production capacity for 2020-2026 ............................................................................. 49
Figure 20: Forecast of total deliveries for 2020-2026 ..................................................................................... 51
Figure 21: Forecast of total revenue for 2020-2026 ........................................................................................ 53
Figure 22: Pro forma income statement for 2020-2026................................................................................... 55
Figure 23: Pro forma balance sheet for 2020-2026 ......................................................................................... 56
Figure 24: U.S. government treasury bonds from 2010 to 2019 in % ............................................................. 59
Figure 25: WACC............................................................................................................................................ 62
Figure 26: DFC valuation as of 31.12.2019 .................................................................................................... 64
Figure 27: WACC & Terminal Growth Rate .................................................................................................. 66
Figure 28: Risk-free Rate & Target Capital Structure .................................................................................... 67
Figure 29: Assumptions for robotaxi DCF ...................................................................................................... 71
Figure 30: PV of set-up and development costs required to exercise the option (in USDm) .......................... 71
Figure 31: PV of net cash flows from taking the project now (in USDm) ...................................................... 72
Figure 32: DCF output for robotaxi project (in USDm) .................................................................................. 73
5

List of Tables

Table 1: Tesla’s international vehicle production capacities ........................................................................... 14
Table 2: Government financial incentives for electric vehicles in Tesla’s main markets ............................... 22
Table 3: Government non-financial incentives for electric vehicles in Tesla’s main markets ........................ 22
Table 4: Forecast of Tesla’s international annual production capacities ......................................................... 35
Table 5: Summary of VRIN analysis .............................................................................................................. 41
Table 6: SWOT Analysis of Tesla ................................................................................................................... 47
Table 7: Average Beta for Tesla ...................................................................................................................... 60
6

List of Abbreviations

AV autonomous vehicle
BEVs battery electric vehicles
BMW Bayerische Motoren Werke
bn billion
CAGR compound annual growth rate
CAPEX capital expenditure
CAPM capital asset pricing model
CEO Chief Executive Officer
D+E debt and equity
DCF Discounted Cash Flow
ECO ecology
EFTA European Free Trade Association
EQ Electric Intelligence
et al. et alia
EU European Union
EV enterprise value
EVs electronic vehicles
FCF forecasted free cash flow
FECVs fuel cell electric vehicles
FSD full self-driving
GDP gross domestic product
GM General Motors
h hour(s)
HD high-definition
HEVs hybrid electric vehicles
ICE internal combustion engine
Inc. Incorporated
IPO Initial Public Offering
km kilometer
km/h kilometer per hour
kW Kilowatt
kWh Kilowatt-hour(s)
m million
mi miles
mph miles per hour
mrp market risk premium
NASDAQ National Association of Securities Dealers Automated Quotations
NIBL Net-Interest Bearing Liabilities
OPEC Organization of the Petroleum Exporting Countries
PESTEL Political (P), Economic (E), Social (S), Technological (T), Environmental (E),
 and Legal (L)
PHEVs plug-in hybrid vehicles
PV present value
R&D Research and development
RMB Renminbi (Chinese currency)
7

ROV Real options valuation
SEC Securities and Exchange Commission
SUV Sport Utility Vehicle
T-bills Treasury-bills
T-bonds Treasury bonds
T-notes Treasury notes
TSLA Tesla Motors Incorporated (NASDAQ: TSLA)
U.S. United States
U.S. DoE U.S. Department of Energy
USD U.S. Dollar
VAT value-added tax
VRIN Valuable, Rare, Inimitable and Non-Substituable
VW Volkswagen
w/o without
WACC Weighted Average Cost of Capital
Chapter 1: Introduction to the Paper 8 1. Introduction to the Paper 1.1 Introduction & Motivation The automotive industry is highly cyclical and exposed to economic booms and busts. Further, due to the high barriers to entry and exit, the automotive industry has been characterized as an oligopolistic competitive environment. Thus, of 2,000 U.S. car companies at the start of the 20th century three endured (Financial Times, 07/2017). Additionally, after a century of internal combustion engine (ICE) drivetrain technologies polluting the environment, an institutional swift towards EVs can be observed. This makes it even more interesting to analyze and value Tesla as it is, on the one hand, a very young company, and on the other hand, selling solely electric vehicles (EVs). With having a successful and visionary entrepreneur as its CEO, Elon Musk, Tesla keeps disrupting the market with its technologies. Many analysts therefore believe that Tesla is not valued for the here-and-now but rather for its high disruptive potential and future growth rate (Financial Times, 02/2020). To analyze whether this is truly the case provides further relevance for this paper. 1.2 Research Question The aim of this paper is to provide an in-depth analysis of Tesla to assess whether its high share price and market capitalization can be justified. Hence, the research question is defined as follows: “Is Tesla’s share price as of 31st December 2019 based on fundamentals?” 1.3 Data Collection While addressing the research question, this paper will solely make use of publicly available information in the form of Tesla’s published SEC reports, consulting & market research report as well as reliable financial information resources such as Reuters, Bloomberg, Nasdaq, Yahoo Finace. 1.4 Delimitation Even though Tesla is a globally operating company, due to the scope of the paper following delimitations are made: Tesla is a vertically integrated company and operates within two segments: 1.) automotive, and 2.) energy generation & storage. Since, the automotive sales revenue made up ≈85% of the total revenues in the last two fiscal years, the main focus will be given to this segment.
Chapter 1: Introduction to the Paper 9 The macro analysis –PESTEL– analysis will focus on Tesla’s main markets that are also considered to be the most relevant for the automotive industry, namely: U.S., China and Western Europe. To compare Tesla’s performance in the automotive industry, BMW, VW and Daimler are taken as benchmarks. 1.5 Structure of the Paper In order to provide a thorough answer for the research question, the case company will be presented Figure 1: Structure of paper first. An introduction to the automotive industry and electric vehicle segment will Chapter 1: Introduction to the Paper follow, rounded up by an overview of the Chapter 2: Introduction to Tesla and the megatrends in the automotive industry. Automotive Industry Hereinafter, the strategic analysis Chapter 3: Strategic Analysis contains a macro-environmental analysis, External Analysis – PESTEL an industry analysis, and in internal Industry Analysis – Porter’s Five Forces Internal Analysis – Value Chain Analysis & VRIN analysis across key value chain capabilities to seize the market Chapter 4: Financial Statement Analysis opportunities and identify real options Income Statement Analysis Financial Ratios – Determining the ROE that relate to Tesla’s business case. The Conclusion of the Financial Statement Analysis financial statement analysis will Chapter 5: SWOT Analysis supplement the strategic analysis and provide major insights for projections Chapter 6: Forecasting regarding future cash flows. After doing so and determining the WACC, a DCF Chapter 7: WACC valuation approach will be performed. Chapter 8: DCF This will be augmented by valuing the most relevant real option applying to Chapter 9: Sensitivity Analysis Tesla that was identified in the strategic analysis. Chapter 10: ROV Chapter 11: Conclusive Summary
Chapter 2: Introduction to Tesla and the Automotive Industry 10

2. Introduction to Tesla and the Automotive Industry

The aim of this chapter is to introduce the reader to the case company Tesla and to the automotive
industry, as Tesla is operating mainly in this industry. This will help to better understand Tesla’s
standout characteristics in the industry as well as to get an overview of the industry-specific outlook
and trends.

2.1 Tesla

In 2003, Tesla Inc. (formerly Tesla Motors, Inc.) was founded in San Carlo, California, with the
mission “to accelerate the advent and sustainable transport by bringing compelling mass-market
electric cars to market as soon as possible” (Tesla, 11/2018). Hence, Tesla designs, develops and
manufactures high-performance fully electric vehicles and energy generation storage systems. In
addition, Tesla sells its products directly to their customers unlike other car manufacturers that sell
through franchised dealerships (Tesla, Annual Report 2019). In 2008, Elon Musk, who has been a
member of the board of directors since 2004, became the CEO of the innovative company (CNBC,
01/2020). On 29th of June, Tesla had its IPO at a share price of $17 and is currently traded on the
NASDAQ exchange under the ticker TSLA (Investor FAQs, Tesla 2020). Having started developing
and selling premium electronic vehicles such as the Tesla Roadster 2008 and later Model S and Model
X, Tesla positioned itself as a niche car manufacturer. Now, with the Model 3 and Model Y launches,
it aims to successfully switchover to being a volume car manufacturer. This was intended and has
been a part of Tesla’s master plan, which will be elaborated later on. Further, Tesla is considered a
serious competitor by the CEO of Volkswagen (VW) as Tesla cars are considered software cars on
unique hardware, hence are up-to-date to compete in the age of the software car (Harvard Business
Review, 02/2020).

2.2 Operating Business Segments

As already touched upon, Tesla operates as two reportable segments: 1.) automotive, and 2.) energy
generation & storage (Tesla Annual Report, 2019). These two segments will be outlined in the
following.

2.2.1 Automotive Segment

Tesla’s revenues are almost completely generated through this segment, as the automotive revenues
accounted for 93.7% of the revenues in 2019 (Tesla, Annual Report 2019). Before illustrating upon
Chapter 2: Introduction to Tesla and the Automotive Industry 11

the previous, current and upcoming models, presenting relevant parts of Tesla’s master plan for this
segment will help us to understand the business strategy Tesla is following.

Master Plan

The first part of Tesla’s master plan, published in 2006, consists of three steps for bringing electric
vehicles to the mass market, reflecting Tesla’s mission: 1.) create a low volume expensive sports car,
2.) use that money to develop a medium volume car at a lower price, and 3.) use that money to create
an affordable, high volume car (Tesla, 08/2006).

The second part of Tesla’s master plan, published in 2016, consists of four steps. However, only three
are relevant for this segment: 1.) expand to cover the major forms of terrestrial transport, 2.)
implement self-driving technology (autonomy) and 3.) enable car sharing (Tesla, 07/2016).

Previous Model

In alignment with the first step of Tesla’s initial master plan, high-price/low volume car, Tesla
introduced the Tesla Roadster in 2008. It was the first fully electric car to use lithium-ion battery cells
and to travel from 200 to 250 miles (mi) per charge. Before Tesla terminated production in 2012,
nearly 2,500 units were sold at a starting price of $109,000 (Tesla Annual Report, 2014).

Current Models

1. Model S and Model X

Launching Model S (2012) and Model X (2015) helped accomplishing the second step of Tesla’s
initial expansion plan, producing mid-price/mid-volume car.

Model S is a five-adult premium sedan with a starting price of $69,490 including potential incentives
with up to 402 mi range on a single charge and an acceleration of 2.3 seconds from 0 to 60 mph. In
2013, it became the first electric vehicle to win the most prestigious award in the automotive industry,
the MotorTrend “Car of the Year” award. Additionally, MotorTrend named Tesla’s Model S sedan
the best of the cars that have won the publication’s “Car of the Year” award in the last 70 years
(MotorTrend, 07/2019).

Model X is a five to seven-seat interior sport utility vehicle (SUV). It has a starting price of $74,690
with potential incentives and a range of 351 mi per single charge. The Model X Performance has an
acceleration of 2.6 seconds from 0 to 60 mph.
Chapter 2: Introduction to Tesla and the Automotive Industry 12

Both, Model S as well as Model X, have the option to include an autopilot, full self-driving capability,
for $7,000. Since their launches (2012 and 2015) through 31st of March 2020, nearly 460,000 units
of both models were sold in total (in 2019, Tesla began combining sales figures for the Model S and
Model X) (Tesla Annual Report, 2012 – Quarter 1 2020).

2. Model 3 and Model Y

Model 3 (2017) and Model Y (2020, 2021 in Europe) made Tesla realize its last step of the initial
master plan, producing a low-price/high-volume electric vehicle.

The Model 3 sedan has three versions with $31,690 being the starting price, with incentives, for the
cheapest one that has an acceleration of 5.3 seconds from 0 to 60 mph and a 250 mi range per charge.
In contrast, the most expensive Model 3 version has a purchase price of $48,690 including incentives,
an acceleration of 3.2 seconds from 0 to 60 mph and a 299 mi range per single charge. In addition,
the Model 3 was the best-selling plug-in electric vehicle model worldwide with 300,000 units being
sold in 2019 (Statista, Tesla 2020).

The Model Y SUV offers a five to seven seat-interior at a starting purchase price of $56,690 with
incentives. This model can have a maximum range of 316 mi per charge and an acceleration of 3.5
seconds from 0 to 60 mph. Currently, this model is available only in the U.S. market and is expected
to launch the Asian (Chinese) and European market in 2021 (Tesla homepage, 2020).

Both, Model 3 as well as Model Y, have the option to include an autopilot, full self-driving capability,
for $7,000. Since their launches (2017 and 2020) through 31st of March 2020, nearly 460,000 units
of both models were sold in total (in 2019, Tesla began combining sales figures for the Model 3 and
Model Y) (Tesla Annual Report, 2012 – Quarter 1 2020).

Upcoming Models

1. Tesla Roadster

The Roadster is going to be a follow-up model of the 2008 version, announced in 2017 and is expected
to be on the market in 2022 (electrek, 05/2020). This model is expected to be sold for a starting price
of $200,000 – the first 1,000 to be produced, the Founder’s Series, will be sold for $250,000 – with
a range of 620 mi per charge and is claimed to be the quickest car in the world, as it has an acceleration
of 1.9 seconds from 0 to 60 mph (Tesla homepage, 2020).
Chapter 2: Introduction to Tesla and the Automotive Industry 13

2. Semi and Cybertruck

Unveiling Tesla Semi (heavy-duty truck) (2017) and the Tesla Cybertruck (light commercial
vehicle/large pickup) (2019) made realize Tesla one of the steps of its second master plan, expanding
to cover the major forms of terrestrial transport. While Tesla Semi is expected to be on the market in
late 2020, Tesla Cybertruck will make it in late 2021 or early 2022. Both models will have the option
to include an autopilot. The Semi comes in two versions and has price of $150,000 or $180,000 and
a range of 300 mi or 500 mi, whereas the Cybertruck starts at $39,990 and has a range of 250, 300 or
500 mi per charge. Lastly, interest in both models are extremely strong; while the Semi noted 2,000
preorders in mid-2019 (Teslerati, 10/2019), the Cybertruck reached a preorder number of 650,000
according to a report from Wedbush (electrek, 06/2020).

Car Sharing

As part of Tesla’s second master plan, Elon Musk announced to launch a ride-sharing app, the Tesla
Network, with its inhouse driver insurance. The first step will be to release Tesla Network with human
drivers before doing it as a full self-driving system as regulatory issues have to be cleared with regards
to autonomous driving (electrek, 02/2020). The app is expected to have a similar business model to
Uber and Tesla will keep between 25%-30% of the revenue from those rides. This initiative is
expected to be on the market in late 2020 or early 2021 (TechCrunch, 04/2019).

International Vehicle Production Capacities

Tesla has three factories available to produce its vehicles; Fremont (California, U.S.), Shanghai
(China) and Berlin-Brandenburg (Germany). Below, Table 1 provides an overview of Tesla’s
international vehicle production capabilities.

According to a Shanghai government filing, the factory in Shanghai is expected to produce 150,000
Model 3 sedans and later hike output, by including the Model Y, to 250, 000 a year once fully
completed (Reuters, 03/2020). On the other hand, the Berlin factory is projected to have a production
capacity of 500,000 annually once fully completed (Tesla, 2020). Further, while the Shanghai factory
is expected to start delivering Model Y in Q1 2021, the Model Y is expected to roll off the line at the
Berlin factory in late 2021 or early 2022 (electrek, 05/2020).
Chapter 2: Introduction to Tesla and the Automotive Industry 14

Table 1: Tesla’s international vehicle production capacities

 Location Model Current installed annual capacity Status
 Model S / Model X 90,000 Production
 Fremont 400,000
 Model 3 / Model Y Production
 (will extend to 500,000 in 2020)
 Model 3 200,000 Production
 Shanghai
 Model Y – Construction
 Model 3 – In development
 Berlin
 Model Y – Construction
 Tesla Semi – In development
 United States Roadster 2020 – In development
 Cybertruck – In development
Sources: compiled by author / Tesla Q1 2020 Update, Quarterly Financials
2.2.2 Energy Generation & Storage Segment

Tesla’s energy generation & storage segment supplies power to homes, businesses and utilities by
selling solar panels, solar roofing and lithium-ion battery storage packs called the Powerwall (for
residential use), Powerpack (for business use) and Megapack (for utility applications) (Tesla, 2020).
In 2019, Tesla deployed 1.65 GWh of energy storage, which is more than Tesla deployed in all the
previous years combined. Further, both solar and storage deployments are expected to grow by at
least 50% in 2020 (Tesla, Q4 and FY 2019 Update). While Musk is assuming that Tesla Energy could
become as big as it’s automotive business in the future (CNBC, 12/2019), the energy generation &
storage revenues constituted only 6.3% of 2019 revenues (Tesla, Annual Report 2019).

2.3 Geographical Segments

In order to set the basis for the upcoming strategic analysis, it is crucial to identify Tesla’s main
geographical markets for the PESTEL analysis. Thus, Figure 2 below will illustrate the distribution
of revenue across each segment. Historically, the United States have been Tesla’s largest segment
accounting for 70% and 51% of the 2018 and 2019 revenues, respectively. China is the second largest
single segment, constituting 12% of the 2019 revenues. While the U.S. and China might be the top
revenue generating segments, Tesla achieved the highest revenue market share in the Netherlands
(11.1%) and Norway (9,8%), far more than in the United States (2.2%).
Chapter 2: Introduction to Tesla and the Automotive Industry 15

 Figure 2: Tesla’s distribution of revenue across main geographical markets

Sources: compiled by author / Tesla annual report 2020
The Netherlands (6% in 2019) and Norway (5% in 2019) are the two biggest contributing European
markets to Tesla’s total revenues. Additionally, the “Other” segment is mostly composed by other
West European countries as well, such as Sweden, Switzerland, Portugal, Ireland, Belgium, United
Kingdom and Germany (Tesla Report 2020, Statista). Hence, the most relevant markets for Tesla’s
business can be identified as the United States (North America), Western Europe and China.

2.4 Share Price Development

Having its initial price offering (IPO) in 2010 at a share price of $17, valuing the company at about
$1.7bn, Tesla became the first publicly traded fully electric vehicle manufacturer. Tesla shares closed
the FY 2019 with shared price of $418 (a 2358% increase since IPO), leading to a market
capitalization of $75.7bn.

 Figure 3: Tesla’s price per share in USD

Sources: compiled by author / Charts, compiled by author
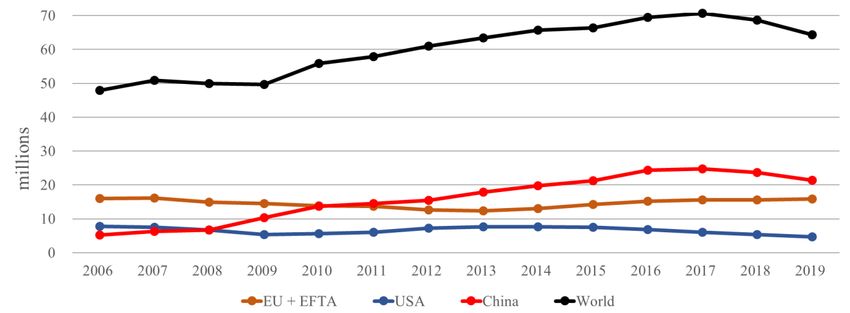
Chapter 2: Introduction to Tesla and the Automotive Industry 16

This represents a greater market capitalization than that of the well-established player BMW
($53.6bn) and almost as much as VW ($98.3bn). This makes Tesla the third most valuable automaker
behind Toyota with a market capitalization of $195.35bn (ycharts, 12/2019). Having in mind that
Tesla delivered only 367,656 vehicles (Tesla, 2020) worldwide in 2019 while BMW and VW
delivered 2.5m vehicles and 11m vehicles (Statista) respectively, it is obvious that Tesla is valued for
its potential to disrupt the industry (Financial Times, 02/2020).

2.5 The Automotive Industry

Due to the high barriers to entry and exit, the automotive industry has been characterized as an
oligopolistic competitive environment. Thus, of 2,000 U.S. car companies at the start of the 20th
century three endured (Financial Times, 07/2017). Further, approximately 53% of the market is
controlled by the ten largest companies while 14 brands global players control more than 60
automotive brands around the world (Business Insider, 02/2018).

 Figure 4: Global passenger car sales 2006-2019 (CAGR of 2.27%)

Sources: compiled by author / OICA
The number of passenger cars sold worldwide, as shown in Figure 4, has been increasing for eight
consecutive years from 49.7m in 2009 to a peaking number of 70.7m in 2017, representing an increase
of 42.3% and a compound annual growth rate (CAGR) of 4.5%. However, the last two years indicate
a negative trend in passenger car sales in all regions, showing a faster a market shrinking at a faster
rate since the financial crisis in 2007/08 (Financial Times, 12/2019). Thus, the sector accounted for
25% of the gross domestic product (GDP) slowdown in 2018 and roughly 30% of the year’s drop in
global trade (Financial Times, 11/2019). This trend might last longer also due to the recent Covid-19
pandemic, as IHS Markit forecasts car sales (all vehicles) to drop by 18% to 73.3m. The car sales in
the United States (U.S.), Europe and China are expected to decline by 26%, 17% and 14%
Chapter 2: Introduction to Tesla and the Automotive Industry 17

respectively in 2020 (IHS Markit, 04/2020). Further, volume growth differs across global markets,
as shown in Figure 4: while the U.S. and the EU + European Free Trade Association (EFTA)
experienced a decline during the financial crisis in 2007/08, the passenger car sales skyrocketed in
China, indicating a total increase of 312.3% and a CAGR of 11.6% from 2006 to 2009. Since 2011,
China has been the largest single market with regards to passenger car sales followed by the EU +
EFTA and the U.S. Lastly, over the illustrated time period, the EU + EFTA shows no significant
change, thus implying a CAGR of less than -1%. The U.S. experienced a decline of 39.3% and a
CAGR of -3.8%, hence did not reach its pre-crisis sales volume.

2.5.1 The Electric Vehicle Market

For more than 100 years, the traditional internal combustion engine (ICE) powered by gasoline or
diesel was favored, disregarding alternative powertrain technologies as inefficient and undesired by
consumers (Financial Times, 07/2017). However, due to ever-increasing pressure on car
manufacturers, such as regulatory standards, to reduce vehicle emission, the market for alternative
fuel vehicles moved past the infant state. This might also be due to the government incentives
encouraging customers to buy electronic vehicles (EVs). Despite being a comparatively recent
market, some of the companies that commercialize electric cars have successfully formed their
business models to achieve profitability (IEA, 2019). Thus, the EVs industry has been rapidly
growing with the global stock of electric passenger cars passing 5 million in 2018, indicating an
increase of 63% from the previous year. Approximately 45% of electric cars on the road were in
China in 2018. In comparison, Europe accounted for 24% of the global fleet, while the United States
(U.S.) accounted for 22% (IEA, 2019). According to IEA 2019, global EVs sales reach 23 million
and the stock exceeds 130 million vehicles (excluding two/ three-wheelers) in the New Policies
Scenario (a scenario that includes both the policies and measures that governments around the world
have already put in place) in 2030. In the EV30@30 Scenario (a case scenario reflecting a policy case
characterized by a wider adoption of EVs), EVs sales and stock even nearly double by 2030 where
sales reach 43m and the stock accounts to more than 250 million. According to Strategy& (2019), by
2030 40% of new car registrations in Europe will be for electric vehicles. In the United States (U.S.)
and China the figure is expected to be 35% and 46% respectively.

The Electric Vehicle Segments

The EVs market consists of three segments, namely; the battery electric vehicles (BEVs), the hybrid
electric vehicle (HEVs) and the plug-in hybrid vehicle (PHEVs) (KPMG, 2020). In the following,
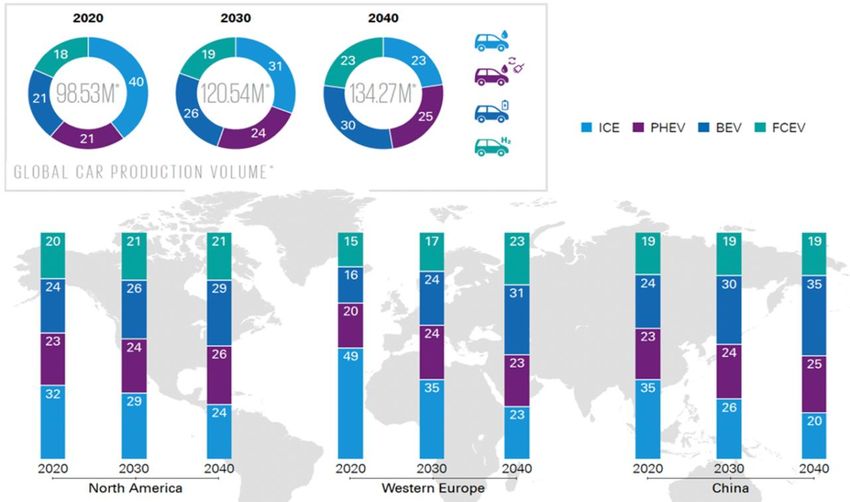
Chapter 2: Introduction to Tesla and the Automotive Industry 18

these three segments will be presented: BEVs: powered solely by battery packs that have to be
recharged from an external power source (e.g. all Tesla models), HEVs: powered by both a battery
pack and an ICE, and as the battery is charged with generative breaking it can only be refueled with
petroleum (e.g. Toyota Prius), PHEVs: powered by both a battery pack and an ICE, thus can be
refueled both with petroleum as well as external power source (e.g. BMW i8).

2.5.2 Global Automotive Outlook and Trends

According to the KPMG Global Automotive Executive Survey 2019 (KPMG GAES 2019), where
2,028 consumers where asked which powertrain technology they would consider purchasing in the
next five years, hybrids were the clear winner around the globe. This indicates that most consumers
have major concerns regarding the market viability of completely new disruptive technologies, such
as BVEs and fuel cell electric vehicles (FECVs; hydrogen car that effectively has its own efficient
power plant on board, the fuel cell and thus produces the electricity itself), which is further
strengthened by the fact that ICEs remain second best choice for consumers (Appendix 1). However,
when 981 senior executives from world’s leading automotive companies were asked about their
opinion on the global production volume share between ICE, PHEVs, BEVs and FECVs in 2020,
2030 and 2040, no certain powertrain technology dominates. Rather, global executives believe in a
fairly even split, meaning that multiple powertrain technologies will co-exist alongside each other
(Figure 5). It is forecasted that the global car production volume will rise from 98.53 million (m) in
2020 to 134.27m in 2040. Simultaneously, shares for BEVs (21% to 30%), PHEVs (21% to 25%)
and FCEV (18% to 23%) will show a significant increase, whereas ICE’s share will plummet from
40% to 23%. Lastly, alternative powertrain technologies are expected to dominate in 2040 in all three
critical markets for the automotive industry, namely; North America, Western Europe and China. In
particular, BEVs are expected to have the lead within the electric vehicle market by 2040. Thus, it is
no big surprise that giant car companies like Volkswagen, BMW and Daimler have pledged that 25%
of their fleets will be electric by 2025. These are some of Tesla’s competitors that do not need to
make money on their electric cars right away (Financial Times, 10/2019).
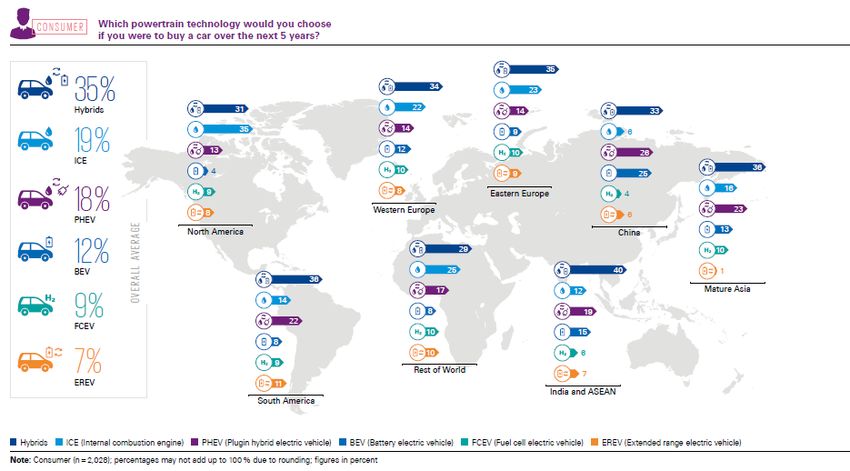
Chapter 2: Introduction to Tesla and the Automotive Industry 19

 Figure 5: KPMG Global Automotive Executive Survey 2019

 Source: KPMG Global Automotive Executive Survey 2019, p. 21
Further trends in the automotive industry are the following: Connectivity/in-car technologies (e.g.
custom digital dashboard, heads-up display devices projecting navigation info onto the windshield):
by 2030, sales of 5G enabled vehicles are expected to reach 16m in the European Union (EU), U.S.
and China (Strategy&, 2019). Automated: level 4 vehicles (fully automated driving, but still requiring
the presence of a driver) are expected to be operating in restricted areas at less than 50km/h by 2021
and by 2029 Level 5 vehicles (full automation, no driver). According to KMPG (2020), 19% and 46%
out of the 1154 executives expect fully self-driving cars to be operational in their market in 2025 and
2030, respectively. However, when only U.S. executives’ opinions are taken into consideration, 30%
and 40% expect fully self-driving to be operational in the U.S. by 2030 and 2040, respectively. In
addition, 77% of the executives believe that autonomous and non-autonomous vehicles will result in
severe safety issues if mixed on the road. On the other hand, executives from government authorities
have the most pessimistic view among stakeholders, with votes of only 30% for 2030 (remarkable
drop from 53% in 2019), 28% for 2040, and 20% for 2050 on the arrival for level 5 autonomy
(KPMG, 2020). Car/Ride Sharing: according to KPMG (2018), 43% of consumers believe that 50%
of the car owners they know today no longer want to own a personal vehicle by 2025, rather prefer
car sharing initiatives. Yet, the number of cars on the road will double from 2017 to 2 billion by 2040
– more will be electric, shared and autonomous – according to the Organization of the Petroleum
Exporting Countries (OPEC) (Financial Times, 07/2017).
Chapter 3: Strategic Analysis 20

3. Strategic Analysis

The purpose of this chapter is to conduct an external, an industry and an internal analysis. This will
help to better evaluate the macro-environmental factors affecting the automotive industry, the degree
of competitiveness in that industry and lastly, to assess Tesla’s resources and capabilities.

3.1 External Analysis – PESTEL

The PESTEL model is a tool for auditing the macro-environmental factor that have an impact on a
corporation’s business success. It provides a useful way to analyze the overall external environment
from different angles by focusing on six external environmental factors: Political (P), Economic (E),
Social (S), Technological (T), Environmental (E), and Legal (L). In addition, the PESTEL framework
is helpful for management as they determine the strategy of a business (Burt et. Al., 2006).

Historically, the automotive industry has been highly regulated, extremely vulnerable to economic
cycles, and greatly affected by social and normative schemes (KPMG, 2019). The PESTEL
framework will help to analyze and evaluate these characteristics. According to KPMG (2019), the
most crucial markets for the automotive industry in the coming years are U.S., China and Western
Europe. This is, as earlier identified, in alignment with the most important markets for Tesla. Thus,
the primary focus of the PESTEL analysis will be on these markets.

3.1.1 Political & Legal Factors

Throughout the last years, international conventions have increased the mandate for the Western
world to reduce global CO2 emissions and carbon footprint. This contributed to various government
incentives and regulations to lower CO2 emissions with the intention to promote the purchase of
electric vehicles. However, local governments are at different stages encouraging green technology
and preventing the purchase of the environmentally harmful ICE powertrain technology. According
to Lieven (2015), there are three ways a government can promote the adaptation of electric vehicles;
1.) monetary benefits, 2.) traffic regulations, and 3.) investments in the charging infrastructure.
Hence, the numerous government policies and programs address both the automotive industry’s
demand and supply side to either incentivize or to regulate and discipline the actual behavior. This
key identification by Lieven is also in alignment with the findings of IEA (2020), as fiscal incentives
at the vehicle purchase and complementary measures (e.g. road toll rebates, low-emission zones, etc.)
are pivotal to attract consumers and businesses to choose the electric option. In addition, as stated by
Chapter 3: Strategic Analysis 21

KPMG (2020), 81% of the leading executives in the automotive industry agree that the future
powertrain technology will be driven by regulation, particularly subsidy strategies and tax breaks will
be essential instruments. These incentivizing instruments make the KPMG Automotive Institute
believe that the automotive sector will experience a global relaunch in Q3 2020. In order to
successfully promote the sale of electric vehicles, governments are following variations of the
classifications identified by Lieven.

Monetary Benefits & Traffic Regulations

Monetary benefits can be both, supplier as well as customer-oriented. An example of an incentive
program on the supply side would be the U.S. Department of Energy (U.S. DoE) making $25bn
available for grants and loans promoting fuel efficiency or technical advances within electric vehicles.

Lieven (2015) considers this a highly efficient way of promoting electric vehicles, as it reduces entry
barriers for new actors in the industry and improves market competitiveness. This incentive program
is worth mentioning since Tesla itself made use of this program by getting approval for a $465m loan
in 2010. This loan was primarily used for an assembly plant for Model S and another facility to
manufacture electric powertrains (Tesla, 04/2010). A more recent example for the supply side
incentive program would be the case of Germany. Part of the Germany’s most recent economic
stimulus program stipulates to support vehicle manufacturer by €1bn in 2021 and 2022 respectively
for the purpose of investing in alternative powertrain technologies.

On the other hand, local governments introduce customer-oriented incentive programs, such as
exempting EVs from purchase and road taxes, too. Complementary measures such as reduced ferry
or (no) parking fees are an important part of this program. Further, non-financial incentives like
authorizing electric vehicles to access bus or carpool lane are an effective short-term initiative
(Lieven, 2015). Banning polluting vehicles from some urban areas for instance is an additional traffic
regulation that is widely used in Germany (Independent, 02/2018). Concrete monetary benefits (Table
2) and traffic regulations (Table 3) applying to Tesla’s main markets can be found in the following
tables below.

The implementation of incentive programs in the form of monetary benefits and traffic regulations is
of significant importance when it comes to boost the sales of electric vehicles, which can be illustrated
by the Danish case. In 2016, the subsidies for electric vehicles phased out in Denmark and this
resulted in a decline of 60% in EVs sales (Levring, 06/2017).
Chapter 3: Strategic Analysis 22 Table 2: Government financial incentives for electric vehicles in Tesla’s main markets Financial incentives Max. $7,500 Federal tax credit; only available for the first 200,000 vehicles sold from each manufacturer (Since 01/2020 Tesla cars no longer eligible for this incentive) U.S: Various purchase rebates for EVs and other incentives dependent on the state, e.g. reduced registration fees, exemption from state emission testing EVs are exempt from 10% sales tax through the end of 2022 China Subsidies up to RMB25,000 ($3,500) will apply to passenger cars costing less than RMB300,000 ($42,480) Netherlands Until 2025: Subsidy of €4,000 for EVs with list price between €12,000-€45,000 & min. range of 120 km; €2,000 for used EVs EVs are exempt from purchase & ownership tax, company car tax of 4% Investments in clean technologies are partially deductible from corporate and income tax No annual road tax Max. 50% of the total amount on ferry fares Norway Parking fee with an upper limit of a maximum 50% of the full price Company car tax reduction reduced to 40% No purchase/ import taxes Exemption from 25% VAT on purchase Sources: compiled by author / CleanTechnic / electrive / wallbox / Tesla / FutureCar / AutoNews / China briefing Table 3: Government non-financial incentives for electric vehicles in Tesla’s main markets Non-Financial incentives Carpool lane access U.S. Free municipal parking China Free municipal parking (dependent on the city/region) Upon request, the city will install a charging station on your street; city will bear Netherlands the installations cost but you still have to pay for charging From 2030, only emissions-free vehicles will be allowed to be newly registered Norway Access to bus lanes Sources: compiled by author / CleanTechnic / electrive / wallbox / Tesla / FutureCar / AutoNews / China Briefing Charging Infrastructure According to Lieven (2015), the lack of range and the deficient charging infrastructure are the two key reasons for a relatively low penetration rate of EVs. However, today there have been big advancements regarding the ranges of EVs – will be touched upon in later stage of the thesis – as well as massive deployments of charging stations in the key automotive markets. For instance, China had
Chapter 3: Strategic Analysis 23

516,000 public charging stations at the end of 2019, a remarkable development coming from less than
58,000 stations in 2015 (Statista, 01/2020). While governments’ investments and programs with
regards to the charging infrastructure are increasing by time, a well-established charging
infrastructure is also dependent on the cooperation of car manufacturers (IEA, 2020). Due to this
reason, Tesla launched its own so-called Tesla Supercharger. Today, Tesla has 1,971 Supercharger
stations with 17, 467 Superchargers globally – Asia, North America and Europe & Middle East
(Tesla, 2020).

3.1.2 Economic Factors

Being highly exposed to the economic environment and the boom and bust cycles of the economy,
the automotive industry can be stamped as a cyclical one. Further, Figure 6 illustrates this relationship
very well since the world vehicle sales seem to follow the world GDP growth pattern.

 Figure 6: World vehicle sales growth in % vs. World GDP growth in % for 2016-2019

Sources: compiled by author / OECD and OICA 2006-2019
Historically, the automotive industry has always been hit by a recession in the economy, e.g. 2008-
2009, since consumers respond by postponing their decision to buy a new car (KPMG, 2019). The
consequences of the financial crisis in 2008-2009 demonstrates this pattern very well, as the following
U.S. recession crashed the local automotive industry due to a major downturn in the purchasing power
of consumers. The government bailout of the two established U.S. car manufacturers, General Motors
and Ford, in 2009 was one of the repercussions of that financial crisis (Forbes, 01/2016). It remains
Chapter 3: Strategic Analysis 24

to be seen how serious the expected Covid-19 economic recession will affect the U.S. automotive
industry. On the other hand, China was not hit as much as the U.S. and became the leading market
for automakers in 2009, a position it has continued to defend until today (KPMG, 2019).

Despite the recent economic slow-down due to the Covid-19, the outlook for the global GDP is
optimistic; OECD (2020) forecasts the real GDP long-term to be relatively stable at 2.3%-2.8%. In
the Figure 7 below, the GDP development forecasts until 2025 are shown. It can be seen that China
shows the highest GDP growth rates of 4%-5.5% while the U.S. and Europe tend to have a more
constant growth rate of ≈2% and ≈1%, respectively. China does not only seem to remain a strong
economy but is also expected to leapfrog the market with its electric vehicles, making the Asian
country the future e-mobility market (OECD, 2020 & KPMG, 2019).

 Figure 7: GPD development forecast for China, Europe and the U.S:

 Source: compiled by author / OECD
Commodity Prices

As elaborated above, the world GDP is a strong and reliable indicator for the future performance of
the automotive industry. At the same time, the profitability of car manufacturers is further the prices
of various commodities such as oil, lithium, steel, aluminum and nickel (KPMG, 2019). The prices
of aluminum and steel, which Tesla uses to build the bodywork of its cars, do not represent a major
risk as the prices of both metals have been relatively stable over the last few years and are expected
to stay at that level. Yet, the commodities used for components in the batteries, lithium and nickel,
may pose a significant exposure for electric vehicle manufacturers, such as Tesla. However, while
lithium prices have been falling since 01/2018 and expected to stay at the same level for the next two
You can also read