A new look at the environmental conditions favorable to secondary ice production - ACP
←
→
Page content transcription
If your browser does not render page correctly, please read the page content below
Atmos. Chem. Phys., 20, 1391–1429, 2020
https://doi.org/10.5194/acp-20-1391-2020
© Author(s) 2020. This work is distributed under
the Creative Commons Attribution 4.0 License.

A new look at the environmental conditions favorable
to secondary ice production
Alexei Korolev1 , Ivan Heckman1 , Mengistu Wolde2 , Andrew S. Ackerman3 , Ann M. Fridlind3 , Luis A. Ladino1,4 ,
R. Paul Lawson5 , Jason Milbrandt1 , and Earle Williams6
1 Environment   and Climate Change Canada, Toronto, ON, Canada
2 National  Research Council, Ottawa, ON, Canada
3 NASA Goddard Institute for Space Studies, New York, NY, USA
4 Centro de Ciencias de la Atmósfera, Universidad Nacional Autonoma de Mexico, Mexico City, Mexico
5 Stratton Park Engineering Company, Boulder, CO, USA
6 Massachusetts Institute of Technology, Boston, MA, USA

Correspondence: Alexei Korolev (alexei.korolev@canada.ca)

Received: 28 June 2019 – Discussion started: 26 July 2019
Revised: 8 December 2019 – Accepted: 7 January 2020 – Published: 5 February 2020

Abstract. This study attempts a new identification of mech-       ters generated during SIP was estimated as 10 µm or less.
anisms of secondary ice production (SIP) based on the ob-         A principal conclusion of this work is that only the freezing-
servation of small faceted ice crystals (hexagonal plates or      drop-shattering mechanism could be clearly supported by the
columns) with typical sizes smaller than 100 µm. Due to their     airborne in situ observations.
young age, such small ice crystals can be used as tracers
for identifying the conditions for SIP. Observations reported
here were conducted in oceanic tropical mesoscale convec-
tive systems (MCSs) and midlatitude frontal clouds in the         1   Introduction
temperature range from 0 to −15 ◦ C and heavily seeded by
aged ice particles. It was found that in both MCSs and frontal    Secondary ice production (SIP) has long been acknowledged
clouds, SIP was observed right above the melting layer and        as a fundamental cloud microphysical process (e.g., Cantrell
extended to higher altitudes with colder temperatures. The        and Heymsfield, 2005; Field et al., 2017). Along with the
roles of six possible mechanisms to generate the SIP parti-       other leading processes in cold clouds, such as primary ice
cles are assessed using additional observations. In most ob-      formation via activation of ice nucleating particles (INPs),
served SIP cases, small secondary ice particles spatially cor-    particle vapor growth, aggregation, riming, and sedimenta-
related with liquid-phase, vertical updrafts and aged rimed       tion, SIP is likely to commonly play a critical role in the
ice particles. However, in many cases, neither graupel nor        formation of size distributions and habits of ice particles
liquid drops were observed in the SIP regions, and therefore,     (e.g., Ackerman et al., 2015; Ladino et al., 2017). Through
the conditions for an active Hallett–Mossop process were not      the modulation of ice particle concentration, SIP can thereby
met. In many cases, large concentrations of small pristine ice    impact precipitation formation, rate of glaciation of mixed-
particles were observed right above the melting layer, start-     phase clouds, the longevity of ice clouds, cloud electrifi-
ing at temperatures as warm as −0.5 ◦ C. It is proposed that      cation, and radiative properties of clouds. On the global
the initiation of SIP above the melting layer is stimulated by    scale, SIP may significantly impact the hydrological cycle
the recirculation of large liquid drops through the melting       and climate in general. However, the commonality and pre-
layer with convective turbulent updrafts. After re-entering a     cise mechanisms of SIP have remained persistently poorly
supercooled environment above the melting layer, they im-         established. Understanding of mechanisms of SIP is of great
pact with aged ice, freeze, and shatter. The size of the splin-   importance for developing a parameterization of the ice ini-
                                                                  tiation processes in weather prediction and climate models.

Published by Copernicus Publications on behalf of the European Geosciences Union.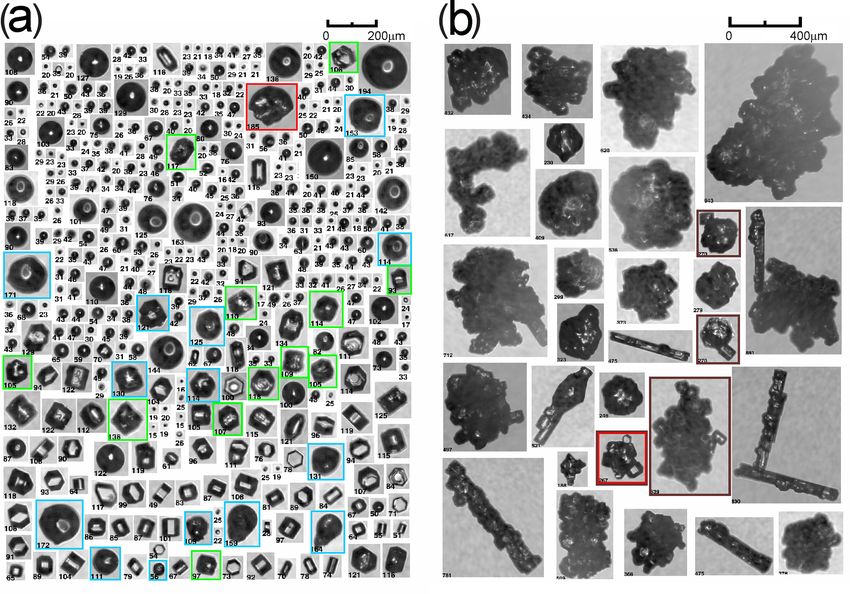
1392                                                               A. Korolev et al.: A new look at secondary ice production

   The significance of SIP was recognized only after the be-       the Hallett–Mossop (HM) mechanism. Several studies have
ginning of regular airborne studies of cloud microstructure        aimed at understanding the physical mechanism responsi-
in different geographical regions (e.g., Koenig, 1963, 1965;       ble for the splinter production (e.g., Choularton et al., 1978,
Hobbs, 1969; Mossop, 1970, 1985; Mossop et al., 1972; Ono,         1980; Emersic and Connolly, 2017). However, despite these
1972; Hallett et al., 1978; Hobbs and Rangno, 1985, 1990;          efforts, the physical mechanism underlying this phenomenon
Beard, 1992; and many others). A systematically observed           is still under debate.
difference of up to 5 orders of magnitude between concen-             The collision of ice particles may result in their me-
trations of INPs and measured ice concentration urged provi-       chanical fragmentation and the production of secondary ice.
sion of an explanation of the physical processes underlying        This hypothesis was stimulated by observations of ice parti-
this discrepancy. One of the explanations suggested an en-         cle fragments collected during airborne studies (e.g., Hobbs
hancement of the concentration of ice particles via a mech-        and Farber, 1972; Takahashi, 1993) and ground-based ones
anism unrelated to the primary ice formation. Several pos-         (Jiusto and Weickmann, 1973). Collisional fragmentation of
sible mechanisms were proposed to explain such so-called           ice particles was explored in the laboratory by Vardiman
secondary production of ice crystals.                              (1978) and Takahashi et al. (1995). However, the obtained
   Historically, the first proposed mechanism to explain SIP       results do not allow an unambiguous conclusion about ice–
focused on droplet fragmentation during freezing (e.g., Lang-      ice collisional fragmentation and its contribution to SIP.
ham and Mason, 1958; Mason and Maybank, 1960; Kachurin                When an ice crystal collides with a supercooled drop, it
and Bekryaev, 1960). During the freezing of a cloud droplet,       will experience thermal shock due to the release of latent heat
isolated pockets of liquid water may become trapped inside         of the freezing drop. This will cause a differential expansion
an ice shell. The expansion of water during subsequent freez-      of the ice crystal and may result in its fragmentation. This
ing results in an increase of pressure inside the ice shell. If    phenomenon was observed during laboratory studies by Dye
the pressure exceeds a critical point, then the ice shell may      and Hobbs (1968) and Hobbs and Farber (1972). Due to the
break into fragments to relieve the internal pressure. Newly       current lack of laboratory studies, the efficiency of ice parti-
formed ice fragments may serve as INPs and result in an en-        cle fragmentation due to thermal shock and its effect on SIP
hancement of ice concentration.                                    remains inconclusive.
   Subsequent laboratory studies demonstrated that fragmen-           Ice particle fragmentation and formation of secondary ice
tation of freezing drops depends on many factors such as           may occur during sublimation in subsaturated areas near
droplet temperature before freezing, environmental temper-         cloud edges or underneath the cloud base. The phenomenon
ature, droplet size, concentration of CO2 and other gases          of fragmentation during sublimation was studied by Oral-
dissolved in water, the crystalline nature of the ice shell        tay and Hallett (1989), Dong et al. (1994), and Bacon et
(i.e., monocrystalline or polycrystalline), drop rotation dur-     al. (1998). However, it remains unclear whether small frag-
ing freezing, and the type of INPs employed for droplet            ments formed in the subsaturated environment can re-enter
freezing and the manner of droplet suspension in the lab-          supersaturated cloud and act as SIP particles. This appears
oratory (Muchnik and Rudko, 1961; Evans and Hutchin-               to be a significant limitation on the efficacy of sublimation
son, 1963; Stott and Hutchinson, 1965; Dye and Hobbs,              breakup as a SIP mechanism.
1966, 1968; Johnson and Hallett, 1968; Brownscombe and                Gagin (1972) proposed a mechanism for SIP due to the
Thorndike, 1968; Hobbs and Alkezweeny, 1968; Takahashi             activation of INPs in high-transient-supersaturation areas
and Yamashita, 1969, 1970; Pitter and Pruppacher, 1973;            around freezing drops. After nucleation, the freezing drop
Takahashi, 1975, 1976; Wildeman et al., 2017; Lauber et            temperature rises to 0 ◦ C. If the surrounding air is colder than
al., 2018). A review of the laboratory studies of droplet freez-   0 ◦ C, the surface of the freezing drop acts as a source of water
ing showed a large diversity of reported results, and condi-       vapor to a colder environment. The resulting water vapor dif-
tions required for droplet shattering during freezing remain       fuses radially outward. Depending on the air humidity, it may
not well understood.                                               create at some distance from the droplet a region with super-
   Splintering during ice particle riming is another mech-         saturated air. Rosinski et al. (1975) and Gagin and Nozyce
anism that can potentially explain apparent SIP (Macklin,          (1984) studied nucleation of INPs around suspended freezing
1960; Latham and Mason, 1961). Hallett and Mossop (1974)           drops with 1–2 mm diameter. However, simply due to limited
and Mossop and Hallett (1974) observed splinter formation          laboratory studies, the effect of INP activation around freez-
during riming in a cloud chamber with liquid water content of      ing drops on SIP remains insufficiently quantified.
∼ 1 g m−3 and droplet concentration 500 cm−3 . They found             The hypothesis that ice concentration measurements are
that splinter production is active in the air temperature range    subject to artifacts induced by airborne instruments has been
from −3 to −8 ◦ C, and its rate has a pronounced maximum           discussed over a long period of time. Larger ice particles may
at an air temperature of −5 ◦ C and drop impact velocity of        bounce off a forward probe’s tips or inlet and shatter into
2.5 m s−1 . At these conditions, one splinter was produced         smaller fragments. After rebounding, the shattered fragments
per 250 droplets of diameter D > 24 µm. The phenomenon             may travel into the sample area and cause multiple artificial
of splinter production during riming is usually referred to as     counts of small ice (e.g., Gardiner and Hallett, 1985; Gayet et

Atmos. Chem. Phys., 20, 1391–1429, 2020                                             www.atmos-chem-phys.net/20/1391/2020/
A. Korolev et al.: A new look at secondary ice production                                                                  1393

al., 1996; Heymsfield, 2007; McFarquhar et al., 2007; Jensen        to thermal shock, or sublimation were not even considered.
et al., 2009; Field et al., 2003). The following introduction of    In this regard, the question that arises is as follows: could
antishattering K tips (A. V. Korolev et al., 2013) along with       these observations reflect an actual occurrence of different
the interarrival time algorithm (Field et al., 2006) allowed for    types of SIP?
a significant mitigation of the effect of shattering and an im-        The present study is focused on revisiting the role of
provement in the ice particle measurements. As was shown            different SIP mechanisms and identifying conditions favor-
by Korolev et al. (2011), A. Korolev et al. (2013), and Law-        able for SIP. Cloud regions with ongoing ice multiplica-
son (2011), a measured concentration of ice particles smaller       tion were identified with the help of a new technique based
than 200 µm can be enhanced due to the shattering effect by         on the identification of small faceted ice crystals smaller
up to 2 orders of magnitude.                                        than 60–100 µm measured by a cloud particle imager (CPI).
   The latter finding brings up a question that some early air-     The newly developed technique was applied to the data set
borne studies that pointed out the discrepancy between con-         collected in mature tropical mesoscale convective systems
centrations of ice particles and INPs might be contaminated         (MCSs) and in midlatitude frontal clouds. The roles of six
by shattering artifacts, which resulted in an enhancement of        possible mechanisms to generate the SIP particles are as-
the measured concentration of small ice. However, numerous          sessed using additional observations: fragmentation of freez-
recent in situ measurements, which applied the antishattering       ing drops, splintering during the HM process, ice–ice col-
techniques, are in general consistent with the early SIP obser-     lisional breakup, ice fragmentation during thermal shock,
vations, and they also showed that in many clouds, ice parti-       fragmentation during ice sublimation, and INP nucleation in
cle concentrations are still much higher than the INP concen-       transient supersaturation. The variety of environmental con-
tration (e.g., Crosier et al., 2011, 2014; Crawford et al., 2012;   ditions associated with SIP will be considered based on six
Stith et al., 2014; R. P. Lawson et al., 2015; P. Lawson et         specific cases that sampled tropical MCSs (four cases) and
al., 2017; Lloyd et al., 2015; Lasher-Trapp et al., 2016; Kep-      midlatitude frontal clouds (two cases).
pas et al., 2017; Ladino et al., 2017; and others).
   Another source of artifacts in measurements of high con-
centration of ice by optical array probes (OAPs) is related to      2   Data sets
fragmentation of particle images when particles pass through
the sample volume close to the edge of the depth of field           Measurements were conducted from the National Research
(DoF) (Korolev, 2007a). A few 1- to 2-pixel images resulting        Council (NRC) Convair 580 research aircraft during two field
from fragmentation of large out-of-focus images have an en-         campaigns: High Ice Water Content (HIWC) and the Buffalo
hanced artificial contribution to particle concentration due to     Area Icing and Radar Study 2/Weather Radar Validation Ex-
their very small sample volumes. This problem is recognized         periment (BAIRS2/WERVEX).
by many research groups. One solution to this is the exclu-            The HIWC flight operations were conducted out of
sion of the first two or three size bins compromised by the         Cayenne (French Guiana) in May 2015. A total of 14 Con-
ambiguity of the DoF definition and contamination by image          vair 580 research flights were conducted in the frame of
fragments. Due to the extent that particles from the first two      the HIWC campaign with the average flight endurance of
or three size bins (< 30–80 µm depending on the OAP type)           approximately 4 h. Most of the flights were performed in
may significantly contribute to the total ice concentration, a      oceanic MCSs in altitudes ranging from 6500 to 7200 m and
limitation is imposed on the measurements of total concen-          temperatures from 0 to −15 ◦ C. The observations of MCSs
tration of ice particles in SIP cloud regions.                      were performed during their mature stages, when the area
   Most observations of an enhanced concentration of ice            of clouds with longwave brightness temperatures colder than
particles have been attributed to the HM process. The list          −50 ◦ C from GOES-13 approached or surpassed its maxi-
of these studies extends over 30 publications, so we name           mum. At that stage, most of the volume of the MCS above the
only a few of them here (e.g., Ono, 1971, 1972; Harris-Hobbs        freezing level was nearly glaciated, with embedded mixed-
and Cooper, 1987; Bower et al., 1996; and others). In these         phase regions mainly associated with vertical updrafts (Ko-
studies, the conclusions about the HM process were obtained         rolev et al., 2018). However, the studied MCS during the ob-
based on the observed association with graupel and columnar         servations remained dynamically active, with updrafts peak-
ice crystals. Fewer studies attributed observations of high ice     ing at 15–20 m s−1 .
concentration to drop shattering (e.g., Koenig 1963, 1965;             The BAIRS2/WERVEX flight operations were conducted
Braham, 1964; Rangno, 2008; Lawson et al., 2017). Ice–ice           over southern Ontario and upstate New York from January to
collisional fragmentation was identified as a source of SIP         March 2017. A total of five research flights were conducted
in natural clouds by Hobbs and Farber (1972), Takahashi             in precipitating frontal cloud systems. In the framework of
(1993), and Schwarzenboeck et al. (2009). As can be seen,           this study, the analysis will be focused on two flights per-
the identification of SIP gravitates towards the HM process,        formed on 7 February and 24 March 2017 in the range of
whereas mechanisms such as activation of INPs in transient          altitudes from 1500 to 3000 m and temperature ranges from
supersaturation around freezing drops, ice fragmentation due        +5 to −10 ◦ C.

www.atmos-chem-phys.net/20/1391/2020/                                               Atmos. Chem. Phys., 20, 1391–1429, 2020
1394                                                              A. Korolev et al.: A new look at secondary ice production

   The NRC Convair 580 was equipped with state-of-the-
art cloud microphysical and thermodynamic instrumenta-
tion. Size distributions of aerosol particles were measured by
a DMT Ultra-High Sensitivity Aerosol Spectrometer (UH-
SAS) (Cai et al., 2008). Measurements of ice particle number
concentration and ice water content (IWC) were extracted
from composite particle size distributions measured by opti-
cal array 2-D imaging probes (OAPs), a PMS 2DC (Knollen-
berg, 1981), a SPEC two-dimensional stereo (2DS; Lawson
et al., 2006), and a DMT precipitation imaging probe (PIP;
Baumgardner et al., 2001). Cloud droplet size distributions
were measured by a PMS forward scattering spectrometer
probe (FSSP; Knollenberg, 1981) and a DMT cloud droplet
probe (CDP; Lance et al., 2010). Cloud particle images were
measured with the SPEC CPI (Lawson et al., 2001). Bulk
liquid water content (LWC) and total water content (TWC)
were measured with a SkyPhysTech Nevzorov probe (Ko-
rolev et al., 1998) and a SEA isokinetic probe (IKP) (Davi-
son et al., 2011). A Rosemount icing detector was used for
detection of liquid water at T < −5 ◦ C (Mazin et al., 2001).
The extinction coefficient was measured with the ECCC
cloud extinction probe (Korolev et al., 2014). Vertical ve-       Figure 1. Conceptual diagram of the transport of secondary ice pro-
locity was measured by Rosemount 858 (Williams and Mar-           duction particles in a cloud after its formation.
cotte, 2000) and Aventech AIMMS20 (Beswick et al., 2008).
The Convair 580 was also equipped with NRC airborne W-
band and X-band radars (NAWX) with Doppler capability             correlation with the environment of their origin due to hori-
(Wolde and Pazmany, 2005). The UHSAS and IKP were em-             zontal and/or vertical advection and turbulent diffusion. This
ployed only during the HIWC project and were not used dur-        process is schematically shown in Fig. 1.
ing BAIRS2/WERVEX.                                                  This concept was used to develop a method for the identifi-
   In order to mitigate the effect of shattering artifacts on     cation of SIP regions. This method is based on the following
ice particle measurements (Korolev et al., 2011), all cloud       approximations:
particle probes were equipped with anti-shattering K tips
(A. Korolev et al., 2013). The remaining shattering artifacts       1. Small faceted ice crystals (hexagonal plates or columns)
were filtered out during data post-processing with the help of         originate from secondary ice production.
the modified interarrival time algorithm (Korolev and Field,
                                                                    2. During some time τcorr , the newly formed ice crys-
2015).
                                                                       tals remain associated with the environment where they
   The collected cloud microphysical data were processed
                                                                       originated.
with the help of the ECCC D2G software. This software al-
lowed composite visualization and analysis of cloud micro-           If these approximations are valid, then small pristine ice
physical, thermodynamic, radar, and aircraft data probes.         crystals can be used as tracers of the environmental condi-
                                                                  tions favorable to SIP. The following subsections aim to as-
                                                                  sess τcorr and the typical size of small faceted ice crystals.
3     Methodology
                                                                  3.2   Ice crystal habits
3.1    Basic assumptions
                                                                  In order for an ice crystal to grow as a hexagonal prism, its
If initiation of secondary ice occurs in a supersaturated en-     growth begins as a monocrystalline ice particle.
vironment, then the newly formed ice particles start grow-           As discussed in the introduction, most potential SIP mech-
ing through water vapor diffusion, and some fraction of sec-      anisms are related to the fragmentation of existing ice par-
ondary ice particles may turn into faceted ice crystals. If the   ticles. Since water drops frozen at Ta > −15 ◦ C tend to be
growth time is shorter than certain typical time τcorr , then     monocrystalline (e.g., Pitter and Pruppacher, 1973; Hallett,
these faceted ice crystals may still be associated with the       1964), their fragments will also be monocrystalline. In ad-
environment of their origin. At a timescale of t > τcorr , the    dition, if a large ice particle is polycrystalline, the probabil-
size and shape of ice crystals may undergo significant meta-      ity of its small fragment to be monocrystalline remains high.
morphosis, and secondary ice particles may lose their spatial     Therefore, the condition of monocrystallinity is expected to

Atmos. Chem. Phys., 20, 1391–1429, 2020                                             www.atmos-chem-phys.net/20/1391/2020/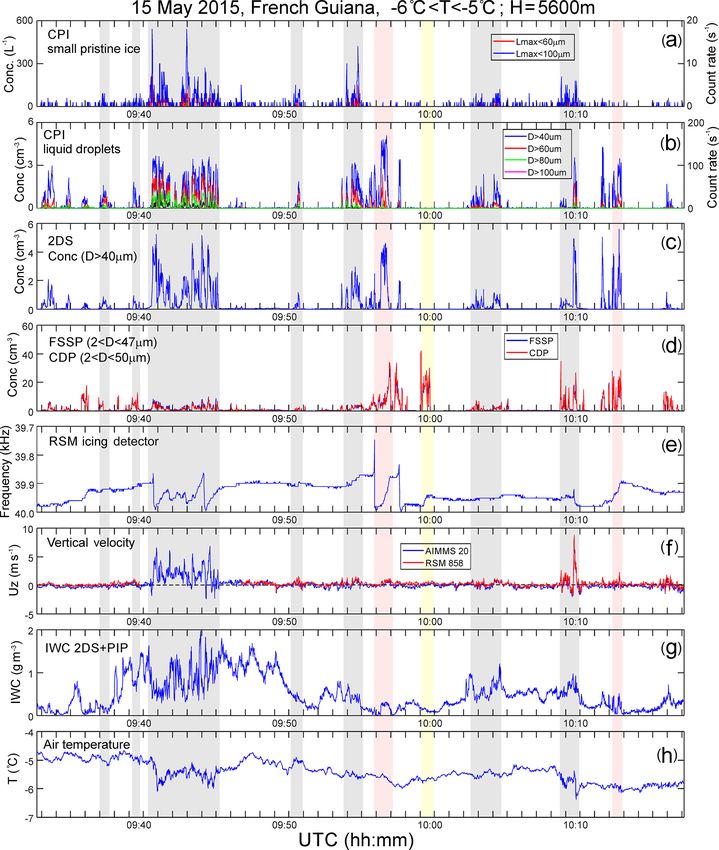
A. Korolev et al.: A new look at secondary ice production                                                                            1395

be satisfied for most small ice fragments with Lmax < 40–                Turbulent mixing results in a spatial transport of the SIP
50 µm. Formation of ice fragments with typical sizes down              particles and a decrease in their concentration. Turbulent
to 20 µm is supported by video material of the breakup of              mixing may result in biases in the assessment of the spatial
freezing drops from Wildeman et al. (2017) and Lauber et               scales of the SIP regions and the concentration of the SIP
al. (2018).                                                            particles. Therefore, τcorr should relate to the turbulent mix-
                                                                       ing time as
3.3   Assessment of spatial correlation time
                                                                       τcorr < τt .                                                    (5)
Condition (2) in Sect. 3.1 requires assessment of a typical
time (τcorr ) such that for time t < τcorr , the changes of cloud         The typical time of turbulent mixing of a cloud parcel with
environment parameters (e.g., air temperature, Ta ; humidity,          a spatial scale L can be estimated as (e.g., Landau and Lif-
RH; ice particle concentration, Ni ; droplet concentration, Nd ;       shitz, 1987)
LWC; IWC) are insignificant, and the SIP-generated ice par-                      1    2
ticles remain within this environment.                                 τt = ε − 3 L 3 ,                                                (6)
   In order to assess τcorr , the main typical timescales of
                                                                       where ε is the turbulent energy dissipation rate.
cloud dynamics and kinetics, such as the time of phase relax-
                                                                          Vertical transport of a cloud parcel affects Ta and RH. As-
ation τp , glaciation time τgl , turbulent diffusion time τt , ver-
                                                                       suming an adiabatic temperature change 1T , the typical time
tical advection time τv , and particle residence time τr , have
                                                                       of vertical transport can be written as
to be estimated.
   The timescale τp characterizes the response of the cloud                   1T
environment to changes of in-cloud humidity (e.g., due to              τv =         ,                                                  (7)
                                                                              uz γw
entrainment, vertical motion, interaction between liquid and
ice phases). So, in order for RH to relax to its steady-state          where uz is the vertical velocity, and γw is the moist adiabatic
value, it is required that                                             lapse rate. So, in order to limit the amplitude of Ta and RH,
                                                                       τcorr and τv should relate as
τp < τcorr .                                                    (1)
   For mixed-phase clouds, after neglecting the effect of the          τcorr < τv .                                                    (8)
vertical velocity, τp can be written as (Korolev and Mazin,              Residence time of an ice particle is determined by the fall
2003)                                                                  velocity uice and cloud parcel size L and is equal to
 1      1        1
    =       +       ,                                     (2)                    L
τp    τp ice τp liq                                                    τres =        .                                                 (9)
                                                                                uice
                 ai (T , P )
where τp ice =      Ni r i    is the time of phase relaxation in the
                         al (T , P )                                       In order for the ice particle to remain in the cloud volume,
ice clouds, τp liq = Nl rl is the time of phase relaxation in          it is required that
liquid clouds, Ni , Nl , ri , rl are the concentrations and aver-
age radii of ice particles and liquid droplets, and ai , al are        τcorr < τres .                                                 (10)
coefficients dependent on pressure P and temperature Ta .
   The glaciation timescale characterizes the transit time of             Summarizing Eqs. (1), (3), (5), (8), and (10) yields the
the mixed-phase cloud into an all-ice cloud due the Wegener–           condition for τcorr :
Bergeron–Findeisen (WBF) process (Wegener, 1911; Berg-
                                                                       τp < τcorr < min τgl , τt , τv , τres .                (11)
eron, 1935). This process results in complete evaporation of
liquid droplets (Nd (t > τgl ) = 0) and changes of steady-state            Typical values of τp , τgl , τt , τv , τres will be assessed for
relative humidity (RH(t > τgl ) → RHs ice ).                           the following conditions: Ta = −5 ◦ C, P = 700 mbar, Ni =
   Therefore, it is required that                                      200 L−1 , Nd = 100 cm−3 , rd = 8 µm, ri = 100 µm, L = 200–
τcorr < τgl .                                                   (3)    300 m, ε = 102 m2 s−3 , uz = 1–4 m s−1 , temperature change
                                                                       limit |1T | < 2 ◦ C, vertical fall velocity of a solid column
   The glaciation timescale can be estimated as (Korolev and           with Lmax = 100 µm, and uice = 0.1 m s−1 .
Mazin, 2003)                                                               Substituting Ta , P , L, ε, Nd , Ni , r d , r i , 1T , uice in
                            2         2 !                          Eqs. (2), (4), (6), (7), (9) yields τp ≈ 5 s, τgl ≈ 320 s, τt ≈
      b(T , P )    Wl0 + Wi0 3       Wi0 3
τgl =                            −            ,           (4)          160 s, τv ≈ 80 s, τres ≈ 2000 s. It should be noted that τp , τgl ,
         Si           Ni              Ni
                                                                       τt , τv are sensitive to the above parameters and may be dif-
where Si is the supersaturation over ice at saturation over wa-        ferent from the obtained estimates. However, the above as-
ter; Wl0 , Wi0 are the initial liquid and ice water content, re-       sessment provides the magnitude of the typical times for SIP
spectively; Ni is the concentration of ice particles; b(Ta , P )       cloud regions. Based on the above estimates, it would be rea-
P and Ta .                                                             sonable to assume that τcorr should not exceed 60–120 s.

www.atmos-chem-phys.net/20/1391/2020/                                                     Atmos. Chem. Phys., 20, 1391–1429, 2020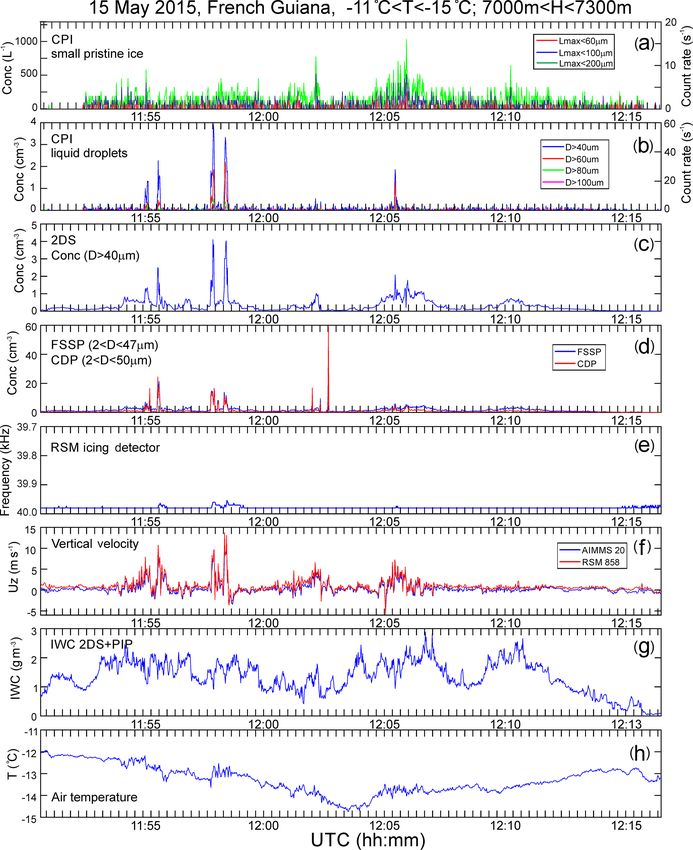
1396                                                                    A. Korolev et al.: A new look at secondary ice production

                                                                        lutional neural network (Krizhevsky et al., 2017) fine-tuned
                                                                        for the identification of small hexagonal faceted ice crystals.
                                                                        The habit of faceted ice particles was limited to hexagonal
                                                                        prism-type crystals: columns, short columns, and plates. Ex-
                                                                        amples of CPI images that were used in the final tuning are
                                                                        presented in Fig. 3a.
                                                                           Validation, based on hand-labeled images held out from
                                                                        training (950 from each of the three categories), showed
                                                                        that only 4 % were misclassified. Although the occurrence
                                                                        of small faceted ice crystals was rare, since they also tended
                                                                        to appear in clusters, a clear signal of their occurrence could
                                                                        be seen above noise from false positives.
                                                                           Examples of images of small ice particles falsely identified
                                                                        as pristine faceted ice are shown in Fig. 3b. As it is seen from
                                                                        Fig. 3b, the centers of growth of the ice crystals are absent in
Figure 2. Calculated ice column growth at vapor saturation over         the images. From a crystallographic viewpoint, such crystals
water at −3, −5, and −8 ◦ C. Triangles, circles, and squares are lab-   cannot be formed during vapor deposition growth, and they
oratory observations by Fukuta and Takahashi (1999).                    are most likely the result of breakups after impact with the
                                                                        CPI inlet (Appendix A). Such particles were excluded from
                                                                        the analysis as described in Appendix A.
3.4    Assessment of ice particle sizes                                    It is worth noting that some or similar images with irregu-
                                                                        lar shapes as in Fig. 3b could be a result of SIP and therefore
The estimate of τcorr allows for the assessment of ice particle         have a natural origin. Thus, fragments of droplets shattered
sizes that they may grow up to during this time. Since SIP is           during freezing may appear as irregularly shaped ice before
expected to occur in liquid or mixed-phase clouds, then the             they develop facets. So, the assessment of the concentration
water vapor humidity will be close to saturation over water             of the SIP particles based on the estimates of the concen-
(Korolev and Isaac, 2006).                                              tration of small faceted ice particles can be considered as a
   Figure 2 shows the calculated length of columns, which               lower limit.
were grown by water vapor deposition at saturation over liq-               In this study, the sizes of particle images are estimated
uid water at different temperatures. The results of the cal-            from the maximum size of the image measured in all possible
culations are in good agreement with the laboratory studies             directions (Lmax ). Note that, for randomly oriented hexago-
of ice growth in Fukuta and Takahashi (1999). As shown in               nal thin plates, Lmax provides an estimate of the diameter of
Fig. 2, during τcorr , the length of hexagonal columns Lmax             the prism base (a) with accuracy better than 15 %. For hexag-
may reach 50 to 150 µm depending on the temperature and                 onal columns, Lmax is not representative of the prism height
the aspect ratio (R = h/a). Based on this assessment, for the           h, and depending on the column orientation, it can be either
following identification of SIP, the size of small faceted crys-        Lmax > h or Lmax < h.
tals will be limited by Lmax < 100 µm.                                     Due to the uncertainty of the CPI sample area definition
                                                                        affected by the settings of acceptance of out-of-focus im-
3.5    Identification of SIP particles                                  ages during sampling and post-processing, we will be using
                                                                        counting rate (s−1 ) of small faceted ice particles to character-
Acquisition of small ice particles images was conducted with            ize their concentration. The assessment of the concentration
the help of the SPEC CPI (Lawson et al., 2001). The CPI was             of faceted ice provided in the foregoing discussion was done
designed for recording 256 grey-level images of ice particles           based on the comparisons of the CPI counting rate of droplets
with 2.3 µm resolution at a rate of up to approximately 500             with D > 40 µm and that measured by 2DS. After identifica-
images per second. Even though the acquisition rate of par-             tion of the scaling coefficient for the conversion of the CPI
ticle images is lower than that for 2-D-imaging optical array           droplet rate into concentration, this coefficient was applied
probes, the CPI provides crisp, high-resolution photographic-           to the counting rate of small hexagonal crystals. This pro-
quality images of small ice particles. This feature is critical         cedure is based on the approximation that the droplets and
for the goals of this study. Binary OAP images (e.g., SPEC              ice crystals < Lmax are in the same size range and their CPI
2DS, PMS 2DC) have lower pixel resolution (from 10 to                   sample volumes are approximately the same. The accuracy
25 µm), and their appearance may be significantly modified              of such estimation of the concentration of small ice particles
by diffraction effects (e.g., Korolev, 2007a; Vaillant de Guélis        is estimated as ±50 %.
et al., 2019).
   Identification of small pristine ice particles from the CPI
imagery was performed with the help of a pre-trained convo-

Atmos. Chem. Phys., 20, 1391–1429, 2020                                                  www.atmos-chem-phys.net/20/1391/2020/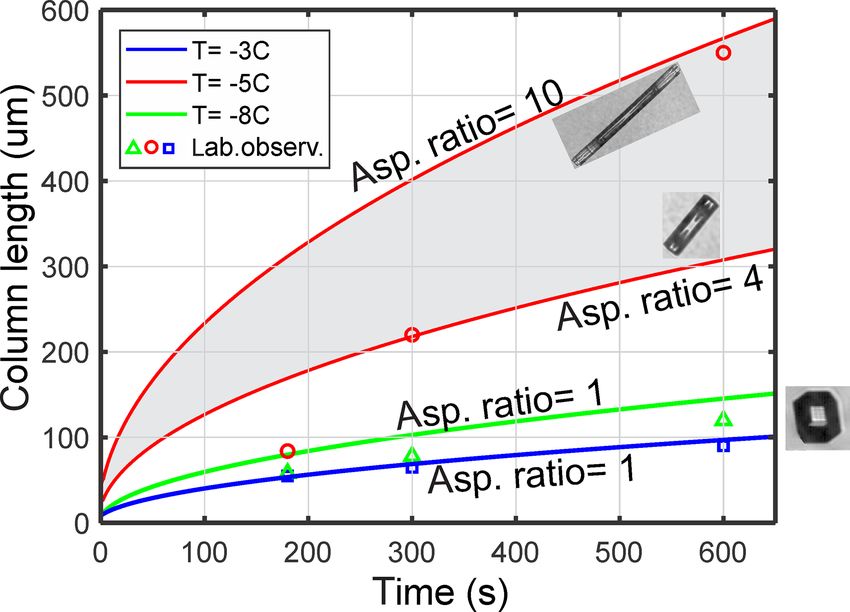
A. Korolev et al.: A new look at secondary ice production 1397
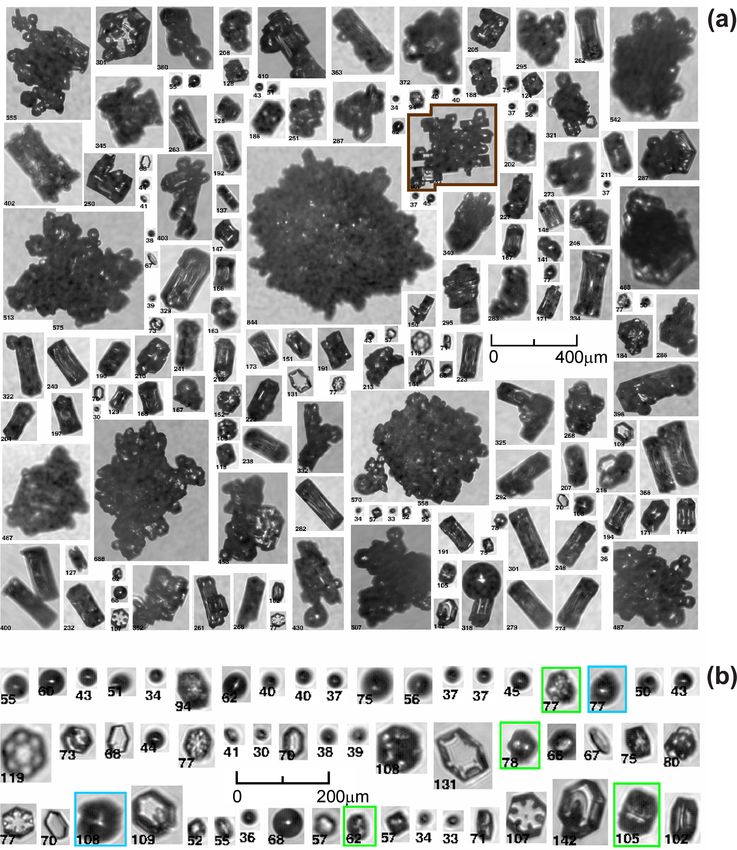
Figure 3. (a) Examples of CPI images used for neural net training to identify small faceted ice crystals. These ice crystals were collected in
the mesoscale convective clouds at altitudes 6200 < H < 7000 m and temperature range of −10 ◦ C < Ta < −3 ◦ C. (b) Examples of images
misidentified by the image recognition software as pristine faceted ice. The numbers below each image frame indicate maximum size of the
images in µm.
4 Results Npr200 ≈ 900 L−1 . As was shown in Ladino et al. (2017), the
estimated INP concentration remained nearly constant dur-
4.1 SIP observations in tropical MCSs ing the flight operations in French Guiana, and for the tem-
perature range of −6 ◦ C < Ta < −4 ◦ C it was approximately
In this section, we present the observations of SIP during the NINP ∼ 10−2 L−1 . So, the estimated NINP is nearly 4–5 or-
Convair 580 flight in a tropical MCS on 15 May 2015. The ders of magnitude lower than the concentration of small pris-
MCS was located off the shore of French Guiana with its tine ice particles Npr100 and Npr200 . Therefore, the observed
center approximately 350 km northeast of Cayenne. Figure 4 small ice particles cannot be explained by heterogeneous ice
shows two GOES-13 infrared images of the MCS with an nucleation, and the most likely pathway of their formation is
overlay of Convair 580 flight tracks. During the flight leg SIP.
in Fig. 4a (09:23–10:22 UTC), the altitude varied between To address the question regarding conditions favorable for
5600 and 5700 m with the air temperature ranging from −4 to SIP, we explore the correlations of different microphysical
−6 ◦ C. As it is seen in Fig. 4a, the Convair 580 crossed three parameters. As seen from Table 1, the ice particle concen-
convective cells with the cloud-top brightness temperatures tration has the highest correlation coefficient with droplets
ranging between approximately −55 and −65 ◦ C (marked by D > 60–80 µm. In many apparent SIP regions, droplets over
dashed circles). The flight leg in Fig. 4b (11:23–12:07 UTC) 300 µm in diameter were registered by the CPI. However, in
was performed at altitudes ranging from 7000 to 7300 m some cloud regions with D > 60 µm, small faceted ice was
and temperatures from −11 to −15 ◦ C. Despite its decay- not observed. Such cloud regions in Fig. 5 are indicated by
ing stage, the MCS remained dynamically active at the Con- pink strips.
vair 580 flight level. As will be discussed below, it was found The analysis of the entire HIWC data set showed that, as
that SIP was observed in convective cloud regions indicated a rule, SIP was not observed or was very unproductive in
by circles in Fig. 4a, b. supercooled liquid clouds with droplets Dmax < 40 µm. One
Figure 5 presents a time series of cloud microphysical such case in Fig. 5 is indicated by a yellow strip. In this spe-
parameters corresponding to the flight leg in Fig. 4a. The cific cloud region, the maximum size of droplets measured
top panel (Fig. 5a) shows the CPI counting rate of small by FSSP and CDP did not exceed Dmax = 30 µm.
faceted ice crystals with Lmax < 60 and 100 µm. Grey ver- Comparing Fig. 5a, f also indicates that intense SIP was
tical strips indicate cloud sections identified as SIP regions. observed in cloud regions with enhanced turbulence or ver-
In this cloud segment, the concentration of small pristine ice tical updrafts. Yet, in the regions on the left side of Fig. 5a
with Lmax < 100 µm attains values up to Npr100 ≈ 500 L−1 . (09:33–09:38 UTC), SIP was observed in the absence of any
Based on the discussion in Sect. 3, the origin of these small significant turbulence or updraft (uz < 0.2 m s−1 ).
pristine ice crystals is attributed to the vicinity of the level of
their observation.
After including aged pristine ice crystals with Lmax <
200 µm, the concentration of faceted ice crystals reached
www.atmos-chem-phys.net/20/1391/2020/ Atmos. Chem. Phys., 20, 1391–1429, 20201398 A. Korolev et al.: A new look at secondary ice production
Table 1. Correlation coefficient between droplet concentration in different size ranges and concentration of small faceted ice crystals with
Lmax < 100 µm for the cloud segment in Fig. 5 for 30 and 60 s averaging.
Droplet concentration D > 20 µm D > 40 µm D > 60 µm D > 80 µm D > 100 µm
Correlation coefficient (30 s) 0.48 0.66 0.85 0.77 0.69
Correlation coefficient (60 s) 0.56 0.71 0.9 0.85 0.8
sured by FSSP and CDP is quite low and varies from 2
to 6 cm−3 , whereas the concentration of droplets with D >
40 µm assessed from the CPI and 2DS data varies between 1
and 3 cm−3 .
Some of the droplets, identified as frozen and indicated
in Fig. 6a by blue frames, have distorted shapes and bulges.
As documented by Lauber et al. (2018) the formation of
bulges may be accompanied by bubble bursting or jetting,
which may be a primary source of SIP particles. A few other
droplets in the red frames appear as fragments of shattered
droplets. Altogether, the presence of droplet fragments and
frozen droplets with bulges is supportive of SIP from shatter-
ing of freezing drops.
The concentration of frozen drops in Fig. 6a is estimated
as Nfrd ∼ 6 L−1 . This concentration is still much higher than
the concentration of INPs (NINP ∼ 10−2 L−1 ) at Ta = −5 ◦ C
(Ladino et al., 2017), and therefore, droplet freezing cannot
be explained by heterogeneous nucleation on INPs alone.
This gap serves as a basis for explaining droplet freezing
due to impact with splinters produced by shattered freezing
drops.
It is worth noting that the actual concentration of frozen
droplets in Fig. 6a may be higher than the estimate Nfrd , since
some drops may freeze without deformation, and after com-
plete freezing, they may become transparent again and ap-
pear as liquid drops (e.g., Mason and Maybank, 1960). The
phase state of such drops cannot be unambiguously identified
and, in the frame of this study, is considered to be liquid.
Figure 6b shows images of aged ice particles sampled in
the same cloud volume as the newly generated SIP ice par-
Figure 4. GOES-13 infrared image of the MCS with the Con- ticles in Fig 6a. The aged ice particles come in two dis-
vair 580 track (courtesy of Pat Minnis) corresponding to time seg- tinct types: faceted columns with Lmax < 400 µm and grau-
ments shown in Figs. 5 and 8. Circles indicate the cloud regions
pel with Lmax < 1000 µm. The presence of graupel is a nec-
along the flight track where SIP was identified (see Fig. 5). The
essary condition for the HM process (Hallett and Mossop,
marked regions also coincide with convective cloud regions (see
text). 1974). However, visual analysis of graupel images (Fig. 6b)
shows that their surfaces appear smooth without small-scale
features. This appearance suggests that liquid droplets spread
over the graupel’s surface and freeze as a film. The way
4.1.1 Case 1
in which the droplets spread is determined primarily by the
droplet’s size and air temperature (Macklin and Payne, 1969;
Figure 6 shows CPI images of cloud particles from a 5 s cloud
Dong and Hallett, 1989).
segment (09:40:33–09:40:38 UTC) in Fig. 5. This cloud seg-
The surface of graupel in Fig. 6b appears different than
ment is characterized by an enhanced concentration of small
the surfaces of rimed ice cylinders in lab experiments on
faceted ice particles (Lmax < 100 µm) estimated as approx-
secondary ice production (Macklin, 1960; Choularton et
imately Npr100 ≈ 450 L−1 . The majority of the CPI images
al., 1978, 1980; Emersic and Connolly, 2017). The surfaces
of droplets are larger than 40 µm diameter with drizzle size
of the rimed ice cylinders were highly inhomogeneous with
drops up to 200 µm (Fig. 6a). The droplet concentration mea-
Atmos. Chem. Phys., 20, 1391–1429, 2020 www.atmos-chem-phys.net/20/1391/2020/A. Korolev et al.: A new look at secondary ice production 1399 Figure 5. Time series of microphysical parameters collected in oceanic MCS offshore French Guiana on 15 May 2015. (a) CPI count rate of small pristine ice with Lmax < 60 and 100 µm; (b) CPI count rate of cloud droplets with D > 40, 60, 80, and 100 µm; (c) concentration of cloud particles D > 40 µm measured by 2DS; (d) concentration of cloud droplets measured by FSSP and CDP; (e) Rosemount icing detector frequency; (f) vertical velocity measured by AIMMS20 and Doppler velocity calculated from W-band radar; (g) IWC calculated from 2DS and PIP; (h) air temperature. Grey strips indicate cloud regions with enhanced concentration of small faceted ice particles; red and yellow strips indicate regions where ice and liquid were present, but no SIP was observed (see text). The altitude of measurements varied between 5600 and 5700 m. distinct images of frozen droplets and small features down 4.1.2 Case 2 to 10 µm, which presumably serve as a source of splinter- ing. Comparing these observations with laboratory studies Figure 7a shows another 5 s segment with successive cloud poses a question regarding whether graupel without small- particle images measured by the CPI in another SIP re- scale features, as in Fig. 6b, could produce splinters. gion (09:46:39–09:46:44 UTC). Enlarged cloud droplets and Another condition for the HM process is the presence of SIP particles from Fig. 7a are shown in Fig. 7b. The con- droplets smaller than 12 µm (Mossop, 1978, 1985). For the centration of SIP particles is estimated as 70 L−1 , which is case in Fig. 6b, the concentration of droplets with D < 15 µm lower than that of the previous case. The concentration of is estimated from the CDP and FSSP data to be 0.5 to 1 cm−3 . droplets with D > 40 µm is also lower, and it is estimated The probability of graupel collision with droplets at such a from the 2DS and CPI measurements as 0.2–0.3 cm−3 . The small concentration is likely too low to have any significant droplet concentration with D < 40 µm measured by FSSP effect on the HM process. and CDP is approximately 1 cm−3 . However, due to the www.atmos-chem-phys.net/20/1391/2020/ Atmos. Chem. Phys., 20, 1391–1429, 2020
1400                                                                     A. Korolev et al.: A new look at secondary ice production

Figure 6. Spatial sequence of CPI images of (a) droplets and faceted ice crystals and (b) aged large ice particles. (a) Blue frames indicate
frozen droplets with modified shapes, and red frames indicate fragments of shattered frozen drops. Numbers under each image indicate their
maximum sizes (Lmax ). Cloud particles in panels (a, b) are spatially mixed, and they were split between two panels because of their difference
in size. The images were sampled at Ta = −5 ◦ C and H = 5650 m during 09:40:42–09:40:47 UTC on 15 May 2015 during measurements
shown in Fig. 5.

Atmos. Chem. Phys., 20, 1391–1429, 2020                                                      www.atmos-chem-phys.net/20/1391/2020/
A. Korolev et al.: A new look at secondary ice production                                                                             1401

Figure 7. (a) Spatial sequence of CPI images; (b) subset of droplets and faceted ice crystals from panel (a). Numbers under each image
indicate their maximum sizes (Lmax ). The images were sampled at Ta = −5 ◦ C and H = 5620 m during 09:46:36–09:46:39 UTC on 15 May
2015 during measurements shown in Fig. 5. (a) Purple frames indicate images of ice particles with evidence for their vertical circulation in
the storm.

www.atmos-chem-phys.net/20/1391/2020/                                                      Atmos. Chem. Phys., 20, 1391–1429, 2020
1402                                                              A. Korolev et al.: A new look at secondary ice production

large concentration of ice in this cloud region, half of the         Figure 9b shows a subset of zoomed-in images of droplets
FSSP- and CDP-measured concentration (∼ 0.5 cm−3 ) may            and small faceted ice particles extracted from Fig. 9a. The
be caused by shattering artifacts (A. V. Korolev et al., 2013).   majority of the small faceted ice particles are hexagonal
No droplets larger than 70 µm were observed in this cloud         plates. According to Magono and Lee (1966), these types of
segment.                                                          plates are expected to form in the near-saturated-over-water
   As seen from Fig. 7a, the background aged ice is rep-          air within the temperature range of −12 ◦ C < Ta < −18 ◦ C.
resented by columnar-shaped particles with well-developed         Hence, the origin and growth habit of the observed plates are
facets with minor riming. Some ice particles highlighted by       consistent with the temperature range where they were sam-
purple frames have features of recirculation. These parti-        pled.
cles started their growth as columns at −8 ◦ C < Ta < −4 ◦ C;        The concentration of droplets with D < 40 µm is estimated
then, they were ascended to a plate growth condition (e.g.,       from FSSP and CDP as less than 1 cm−3 , and the concentra-
−18 ◦ C < Ta < −12 ◦ C) and turned into capped columns.           tion of droplets with D > 40 µm is estimated from 2DS as
Then, they were brought down by a downdraft or sedimented         ∼ 2 cm−3 . Therefore, even though the ensemble of particles
back to the columnar growth environment (−8 ◦ C < Ta <            in Fig. 9 contains graupel, the rest of the parameters, such
−4 ◦ C) and developed columns growing out of the plate            as temperature and concentration of small and large droplets,
edges.                                                            are well outside the envelope of conditions required for the
   What is important about the case in Fig. 7 is that no          HM process, as documented in the literature.
graupel, heavily rimed ice, or significant amount of liquid
droplets were observed here. Therefore, the SIP in this spe-      4.1.4   Case 4
cific cloud region formally does not meet the HM process
criteria.                                                         Figure 10a shows another example of ice particles sampled
   Figure 8 shows a time series of microphysical and state        approximately 1 km away from those shown in Fig. 9. This
parameters in the same cloud area as in Fig. 5 but at a           cloud region is characterized by the absence of a liquid phase.
higher altitude (7000 m < H < 7300 m) and lower tempera-          However, the concentration of small ice particles in Fig. 10
ture (−14 ◦ C < Ta < −12 ◦ C). This locale offers the oppor-      appears to be even higher than that of the small ice in Fig. 9,
tunity to consider the evolution of ice crystals initiated at     where liquid droplets were present. It is worth noting that, in
lower levels and to explore the initiation of new ice in colder   most observational studies, the presence of liquid was con-
environments. Figure 8a shows that small faceted particles        sidered as one of the necessary conditions for SIP. How-
are spread horizontally over the entire cloud environment.        ever, in this particular case, it can be argued that the ab-
The clustering of the small ice parties and their association     sence of liquid droplets may be explained by their evapo-
with updrafts and liquid droplets is less pronounced than         ration as a result of the WBF process just before the cloudy
at the temperature level of −4 to −6 ◦ C (Fig. 5). As fol-        air arrived at the level of observation. The small ice plates
lows from Fig. 8b–f, the liquid phase appears in horizon-         in Fig. 10b could be formed at lower levels with tempera-
tally narrow segments associated with vertical updraft re-        tures −14 ◦ C < Ta < −12 ◦ C when liquid droplets were still
gions. As discussed in Korolev (2007b), updrafts may extend       present in the parcel. After that, the plates ascended in the
the maintenance of the liquid phase in mixed-phase clouds or      glaciated updraft to a higher level.
completely suppress the WBF process. The majority of the             The variety of habits of small ice particles in Figs. 9 and 10
cloud segment in Fig. 8 is associated with high IWC peak-         shows that SIP apparently occurred continuously during as-
ing up to 3 g m−3 within an ice number concentration up to        cent through different levels, with temperatures ranging from
1 cm−3 . A liquid phase with no updraft in this kind of envi-     −2 to −14 ◦ C (at the level of observation).
ronment can exist only for a short time period. For example,         Figure 11 shows a summary of the concentrations of small
a mixed-phase cloud with LWC ∼ 0.1 g m−3 and uz = 0 will          faceted ice crystals and droplets averaged over the entire
be glaciated within 50 s at Ta = −10 ◦ C.                         Convair 580 HIWC data set. These data were collected in
                                                                  10 tropical MCSs with a total sampling length of 9580 km
4.1.3   Case 3                                                    within the temperature range of −15 ◦ C < Ta < 0 ◦ C. It was
                                                                  found that small faceted ice crystals, along with cloud drops,
Figure 9a presents a sequence of cloud particle images mea-       occurred in spatial clusters with a typical horizontal exten-
sured during a 10 s time interval (12:05:31–12:05:41 UTC) at      sion from a few hundred meters to a few kilometers. In many
Ta = −14 ◦ C and H = 7250 m. The measurements were con-           cases, regions with liquid droplets and regions with enhanced
ducted within a moderate updraft (2 m s−1 < uz < 6 m s−1 ).       concentrations of the small ice may be separated by a few
As it is seen, aged ice particles are represented by graupel,     hundred meters or kilometers. In these SIP cloud regions,
a few lightly rimed particles, and numerous columns. The          the concentration of drops and SIP particles is significantly
origin of columns is related to nucleation at lower levels        higher than their average values as shown in Fig. 11.
(∼ 5300–5700 m) at temperatures corresponding to colum-              Figure 11 shows that, on average, the concentration of SIP
nar growth (−10 ◦ C < Ta < −4 ◦ C).                               particles increases, and the concentration of liquid droplets

Atmos. Chem. Phys., 20, 1391–1429, 2020                                            www.atmos-chem-phys.net/20/1391/2020/
A. Korolev et al.: A new look at secondary ice production 1403
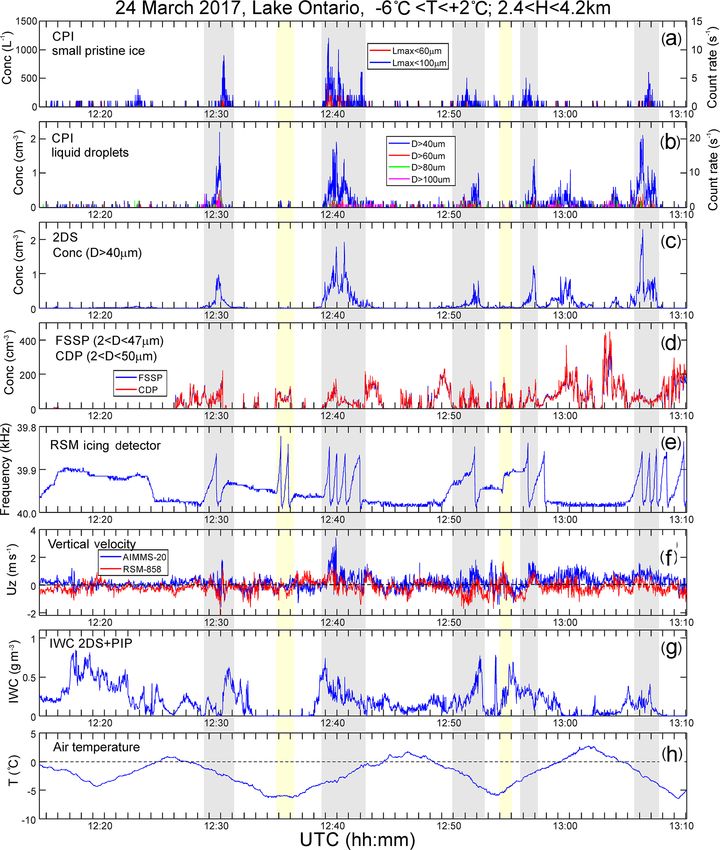
Figure 8. Same as in Fig. 5. The altitude of measurements varied between 7000 and 7300 m.
decreases with increasing height within the entire bulk of these measurements, the Convair 580 performed a series of
MCSs at −15 ◦ C < Ta . These trends may be related to the porpoise and spiral ascents and descents in the vicinity of the
cumulative effect of vertical transport of SIP particles by the melting layer with altitude and temperature changing in the
convective updrafts. ranges of 2400 m < H < 4200 m and −6 ◦ C < Ta < +2 ◦ C,
respectively.
4.2 SIP observations in midlatitude frontal clouds It turned out that in midlatitude frontal clouds the correla-
tion between the concentration of small faceted ice crystals
The next observation of SIP was conducted in clouds as- and liquid droplets is very similar to that observed in tropical
sociated with midlatitude winter frontal systems during the MCSs at Ta > −6 ◦ C. The correlation coefficients between
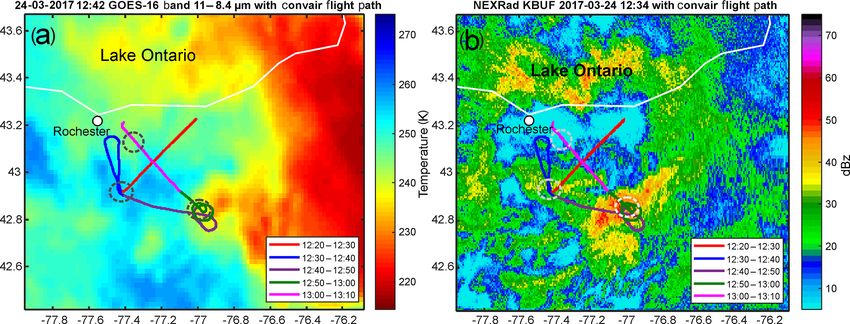
BAIRS2/WERVEX project on 24 March 2017. Figure 12 the concentrations of droplets with different diameters and
shows GOES-16 infrared (IR) image (Fig. 12a) and Buf- small faceted ice particles are shown in Table 2. As follows
falo NEXRAD reflectivity (Fig. 12b) overlaid with the Con- from Table 2, the best correlation is reached for droplets with
vair 580 flight track. The cloud regions identified as SIP are D > 40 µm, whereas for the tropical MCS, the best correla-
indicated by dashed circles. tion is reached for droplets with D > 60 µm (Table 1).
Figure 13 shows a 1 h segment of in situ cloud microphys- Similar to tropical MCSs, in frontal clouds, SIP was
ical measurements sampled from the Convair 580. During not observed in liquid- and mixed-phase clouds with D <
www.atmos-chem-phys.net/20/1391/2020/ Atmos. Chem. Phys., 20, 1391–1429, 20201404 A. Korolev et al.: A new look at secondary ice production
Figure 9. (a) Spatial sequence of CPI images; (b) subset of droplets and faceted ice crystals from panel (a). (b) Blue frames indicate frozen
droplets with modified shapes, and green frames indicate frozen drops with developed facets. Numbers under each image indicate their
maximum sizes (Lmax ). The images were sampled at Ta = −14 ◦ C and H = 7200 m during 12:05:27–12:05:38 UTC on 15 May 2015 during
measurements shown in Fig. 8.
Table 2. Correlation coefficient in different size ranges between droplet concentration and concentration of small faceted ice crystals with
Lmax < 100 µm for the cloud segment in Fig. 13 with 30 and 60 s averaging.
Droplet concentration D > 20 µm D > 40 µm D > 60 µm D > 80 µm D > 100 µm
Correlation coefficient (30 s) 0.44 0.51 0.48 0.26 0.11
Correlation coefficient (60 s) 0.65 0.71 0.59 0.29 0.18
Atmos. Chem. Phys., 20, 1391–1429, 2020 www.atmos-chem-phys.net/20/1391/2020/A. Korolev et al.: A new look at secondary ice production 1405
Figure 10. (a) Spatial sequence of CPI images; (b) subset of droplets and faceted ice crystals from panel (a). Numbers under each image
indicate their maximum sizes (Lmax ). No liquid droplets were present in this cloud region. The images were sampled Ta = −14 ◦ C and
H = 7200 m during 12:05:47–12:05:53 UTC on 15 May 2015 during measurements shown in Fig. 8.
30 µm. Such cloud segments are indicated by yellow strips in were observed in this SIP region. The concentration of vi-
Fig. 13. Most cases of SIP in Fig. 13 were associated with sually identified frozen drops is estimated at approximately
cloud regions with enhanced turbulence (uz ∼ ±3 m s−1 ). Nfrd ≈ 30 L−1 . During the BAIRS2/WERVEX project, the
UHSAS probe was not installed on the Convair 580, and
4.2.1 Case 5 therefore, the concentration of INPs could not be assessed
using the approach from Ladino et al. (2017). However, the
Figure 14a shows a sequence of CPI images of cloud parti- estimated concentrations of Npr100 and Nfrd still appear to
cles from a 40 s cloud segment with enhanced concentrations be much higher than expected INP concentrations of 10−6
of small faceted ice crystals. In this cloud region, the concen- to 10−3 L−1 at a −2 to −5 ◦ C temperature range (e.g., Kanji
tration of small ice crystals with Lmax < 100 µm peaked up et al., 2017; DeMott et al., 2016; Price et al., 2018; Welti et
to approximately Npr100 ≈ 100 L−1 . Like the case in Fig. 6, a al., 2018; Creamean et al., 2018; Wex et al., 2019).
number of frozen drops with deformed shapes (blue frames)
www.atmos-chem-phys.net/20/1391/2020/ Atmos. Chem. Phys., 20, 1391–1429, 20201406 A. Korolev et al.: A new look at secondary ice production
lographic axis (e.g., Pitter and Pruppacher, 1973; Iwabuchi
and Magono, 1975; Uyeda and Kikuchi, 1978). If the rimed
droplets continue to grow through vapor deposition, they will
regrow into faceted crystals with the orientation of princi-
pal axes the same as that of the “host” crystal. Examples
of such ice crystals can be found in Figs. 7 and 9 (brown
frames). The alternative to this arrangement is when small
faceted ice crystals on the surface of a frozen drop (brown-
red frame; Fig. 14b) have clearly multi-directional crystallo-
graphic orientations. Therefore, these small ice crystals most
likely formed independently of the frozen drop before they
were aggregated.
It is worth noting that the ice particles in the brown-red
frame include five visible small faceted ice crystals attached
to the surface of the frozen drop. Aggregation of the small
crystals may be enhanced by electrostatic charges, which
fragmented particles may have after shattering. Charge sep-
aration during droplet shattering was observed in studies
by many research groups (e.g., Mason and Maybank, 1960;
Kachurin and Bekryaev, 1960; Latham and Mason, 1961;
Evans and Hutchinson, 1963; Stott and Hutchinson, 1965;
Kolomeychuk et al., 1975). Therefore, the observation of
small faceted ice aggregated to the surface of large particles
with different orientations of principal axis is supportive of
their formation due to SIP.
4.2.2 Case 6
Figure 15 shows another example of a spatial sequence of
Figure 11. Average concentration of small faceted ice crystals (a) particle images from a cloud region with enhanced concen-
and drops (b) estimated from CPI measurements. The concentration trations of faceted ice particles apparently resulting from SIP.
was averaged over the entire flight length sampled during 13 flights What is interesting about this is that the background aged
in 10 tropical MCSs. The concentration was normalized on the sam- ice particles were not observed here. Ice particles are either
pling distance in each 1 ◦ C temperature interval. Total number of 1 s faceted ice crystals or frozen drops. The absence of small
average samples is 8.4 × 10⁴ ; total in-cloud length is 9580 km.
droplets and graupel suggests that the HM process is not rel-
evant to this case and that SIP most likely occurred here due
to shattering of large drops. This hypothesis is supported by
The aged ice particles in Fig. 14b are represented by rimed the presence of a large number of images of fragmented (red
columns and graupel-like particles. Therefore, this case is frames) and deformed frozen drops (blue frames). The pres-
consistent with the conditions required for the HM process. ence of such droplets supports the SIP mechanism of shatter-
In Fig. 14b, there are a few ice particles with small faceted ing of freezing drops. It should be noted that the sizes of most
crystals stuck to their surfaces, which are indicated using of the faceted ice crystals in Fig. 15 exceed 100–200 µm.
brown frames. The origin of small faceted ice on the surface Therefore, the age of such particles exceeds the threshold
of large particles may be explained by (1) vapor deposition time τcorr , as discussed in Sect. 3.3. However, the purpose
regrowth of rime into faceted crystals or (2) aggregation of of this case is to show another example of SIP in which the
newly formed small and pre-existing large ice particles. Op- criteria for the HM process are not met.
tion (1) may not be relevant to the particles in Fig. 14b, since Figure 16 shows the average concentration of faceted
a closer look at the small particles reveals that the centers of ice crystals and droplets for two flights from the
their growth are separated from the surface of the large ice BAIRS2/WERVEX field campaign. As it is seen, the con-
particle. centration of drops with D > 60 µm decreases with the de-
Another argument supporting aggregation is that droplets crease of Ta . However, the concentration of faceted ice parti-
D < 100 µm, at Ta > −10 ◦ C tend to freeze as monocrys- cles has a maximum at −3.5 ◦ C < Ta < −1.5 ◦ C. This type of
tals (e.g., Hallett, 1964; Pitter and Pruppacher, 1973). Small behavior is different from those in tropical MCSs, as shown
droplets freezing on the surface of a monocrystalline parti- in Fig. 11. This difference may be explained by the absence
cle usually have the same orientation of principal crystal- of well-defined convective regions present in MCSs, which
Atmos. Chem. Phys., 20, 1391–1429, 2020 www.atmos-chem-phys.net/20/1391/2020/You can also read


