Driving mechanisms of organic carbon burial in the Early Cretaceous South Atlantic Cape Basin (DSDP Site 361)
←
→
Page content transcription
If your browser does not render page correctly, please read the page content below
Clim. Past, 17, 469–490, 2021
https://doi.org/10.5194/cp-17-469-2021
© Author(s) 2021. This work is distributed under
the Creative Commons Attribution 4.0 License.

Driving mechanisms of organic carbon burial in the Early
Cretaceous South Atlantic Cape Basin (DSDP Site 361)
Wolf Dummann1,a , Sebastian Steinig2,b , Peter Hofmann1 , Matthias Lenz1 , Stephanie Kusch1 , Sascha Flögel2 ,
Jens Olaf Herrle3 , Christian Hallmann4,5 , Janet Rethemeyer1 , Haino Uwe Kasper1 , and Thomas Wagner6
1 Institute of Geology and Mineralogy, University of Cologne, 50674 Cologne, Germany
2 GEOMAR       Helmholtz Centre for Ocean Research Kiel, 24148 Kiel, Germany
3 Institute of Geosciences, Goethe University Frankfurt, 60438 Frankfurt am Main, Germany
4 Max Planck Institute for Biogeochemistry, 07745 Jena, Germany
5 MARUM, University of Bremen, 28359 Bremen, Germany
6 Lyell Centre, School of Energy, Geoscience, Infrastructure and Society, Heriot-Watt University, Edinburgh, EH14 4AS, UK
a now at: Institute of Geosciences, Goethe University Frankfurt, 60438 Frankfurt am Main, Germany
b now at: School of Geographical Sciences, University of Bristol, Bristol, BS8 1SS, UK

Correspondence: Wolf Dummann (wdummann@uni-koeln.de)

Received: 7 February 2020 – Discussion started: 4 March 2020
Revised: 21 November 2020 – Accepted: 4 January 2021 – Published: 19 February 2021

Abstract. Extensive black shale deposits formed in the Early     deposited during the global Oceanic Anoxic Event (OAE)
Cretaceous South Atlantic, supporting the notion that this       1a, as well as during repetitive intervals before and after
emerging ocean basin was a globally important site of or-        OAE 1a. In all cases, these short-term intervals of enhanced
ganic carbon burial. The magnitude of organic carbon burial      organic carbon burial coincided with strong influxes of sedi-
in marine basins is known to be controlled by various tec-       ments derived from the proximal African continent, indicat-
tonic, oceanographic, hydrological, and climatic processes       ing closely coupled climate–land–ocean interactions. Sup-
acting on different temporal and spatial scales, the nature      ported by our model results, we show that fluctuations in
and relative importance of which are poorly understood for       weathering-derived nutrient input from the southern African
the young South Atlantic. Here we present new bulk and           continent, linked to changes in orbitally driven humidity and
molecular geochemical data from an Aptian–Albian sedi-           aridity, were the underlying drivers of repetitive episodes
ment record recovered from the deep Cape Basin at Deep Sea       of enhanced organic carbon burial in the deep Cape Basin.
Drilling Project (DSDP) Site 361, which we combine with          These results suggest that deep marine environments of
general circulation model results to identify driving mech-      emerging ocean basins responded sensitively and directly to
anisms of organic carbon burial. A multimillion-year de-         short-term fluctuations in riverine nutrient fluxes. We explain
crease (i.e., Early Aptian–Albian) in organic carbon burial,     this relationship using the lack of wide and mature continen-
reflected in a lithological succession of black shale, gray      tal shelf seas that could have acted as a barrier or filter for
shale, and red beds, was caused by increasing bottom wa-         nutrient transfer from the continent into the deep ocean.
ter oxygenation due to abating hydrographic restriction via
South Atlantic–Southern Ocean gateways. These results em-
phasize basin evolution and ocean gateway development as a
decisive primary control on enhanced organic carbon preser-      1   Introduction
vation in the Cape Basin at geological timescales (> 1 Myr).
The Early Aptian black shale sequence comprises alterna-         The Early Cretaceous epoch (∼ 145–100.5 Ma) has long
tions of shales with high (> 6 %) and relatively low (∼ 3.5 %)   been a focus of interest for geologists and the petroleum
organic carbon content of marine sources, the former being       industry due to the widespread occurrence of marine black
                                                                 shales (i.e., organic-carbon-rich, fine-grained sediments),

Published by Copernicus Publications on behalf of the European Geosciences Union.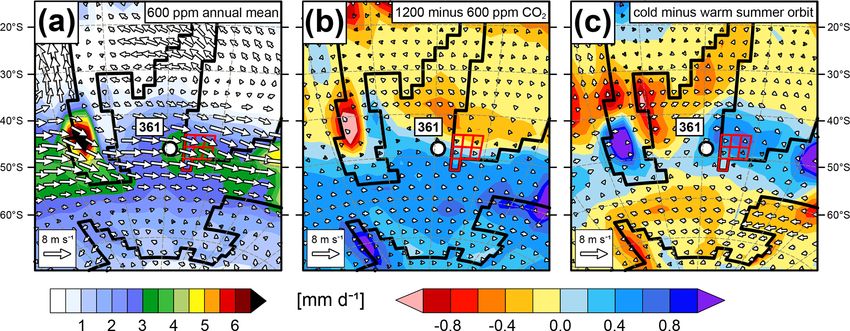
470                                 W. Dummann et al.: Driving mechanisms of OC burial in the Cretaceous South Atlantic

which were preferentially deposited in emerging ocean
basins that developed in the wake of the breakup of Pan-
gaea (Stein et al., 1986; Zimmerman et al., 1987). Within
these basins, organic carbon (OC) burial was controlled by
a complex interplay of productivity, preservation, and dilu-
tion (Pedersen and Calvert, 1990; Tyson, 2005; Arthur and
Sageman, 1994; Bralower and Thierstein, 1984), which was
affected by multiple processes acting on different timescales.
On a multimillion-year (geological) timescale, OC burial was
controlled by tectonic processes modifying basin geome-
try, marine gateway evolution, and ocean circulation (Don-
nadieu et al., 2016; Dummann et al., 2020; Arthur and Nat-
land, 1979; Wagner and Pletsch, 1999), while shorter term
(e.g., orbitally driven) changes in oceanic and atmospheric
circulation triggered pronounced fluctuations in the magni-
tude of OC burial on timescales of tens of thousands to hun-
dreds of thousands of years (Beckmann et al., 2005; Behrooz
et al., 2018; Hofmann and Wagner, 2011; Wagner et al.,
2013; Kolonic et al., 2005; Herrle et al., 2003). During brief
episodes ≤ 1 Myr, marine black shales were deposited re-
gionally to globally and accompanied by intense perturba-         Figure 1. Aptian paleogeographic reconstruction (Matthews et
tions in ocean chemistry and ecology (Jenkyns, 2010; Weis-        al., 2016) showing the Early Cretaceous distribution of climate-
sert et al., 1998; Erba, 1994). These carbon–climate pertur-      sensitive rock types (Boucot et al., 2013; Cao et al., 2019). Position
bation events are described as oceanic anoxic events (OAEs;       of climate belts according to Boucot et al. (2013) and Chumakov
                                                                  et al. (1995). Land–sea mask and distribution of shelf seas were
Schlanger and Jenkyns, 1976). OAE 1a, one of the most se-
                                                                  adapted from Cao et al. (2017). WR stands for Walvis Ridge, and
vere OAEs (Jenkyns, 2010, and references therein), occurred       FP stands for Falkland Plateau.
during the Early Aptian (Coccioni et al., 1992) and was
marked by a distinct negative stable carbon isotope excursion
at its onset (Menegatti et al., 1998), evidence for rapid warm-
ing (O’Brien et al., 2017, and references therein) and elevated   driven continental hydrology and run-off variability beneath
atmospheric CO2 concentrations (Naafs et al., 2016).              the ascending, tropical limb of the atmospheric Hadley cell
   During the Early Aptian, at the time of OAE 1a, the emerg-     (the Intertropical Convergence Zone; ITCZ). Near-shore sed-
ing South Atlantic Ocean consisted of two main rift basins        iment records located along continental margins, such as
that progressively opened from south to north (Pérez-Díaz         Site 364, often show particularly pronounced cycles of vari-
and Eagles, 2017) and which were separated from each other        able OC quantity and quality, as this is where hydrological
by the volcanic Walvis Ridge (Fig. 1). Each of the two sub-       changes on the continent are most directly translated into ma-
basins acted as a major depocenter for OC-rich sediments          rine sediments, while less pronounced cycles at sites further
(Zimmerman et al., 1987; Arthur and Natland, 1979; Mac-           offshore reflect an attenuation of the signal with increasing
donald et al., 2003) with exceptionally high OC burial rates      water depth and distance from the continent (Wagner et al.,
in the Early Cretaceous. Biogeochemical modeling indicates        2013).
that excess OC burial in the South Atlantic basin may have           Our study investigates the driving mechanisms of marine
accounted for around 16 % of global OC burial during the          OC burial in the deep Cape Basin (Fig. 1), south of the
Aptian in an area that covered only around 1 % of the total       Walvis Ridge, and their connections to midlatitude atmo-
global ocean (McAnena et al., 2013). Data from Deep Sea           spheric circulation and continental hydrology, which have
Drilling Project (DSDP) Site 364, located at a paleo-latitude     been studied less extensively. We provide new inorganic and
of 25◦ S and an estimated paleo-water depth of ∼ 300–400 m        organic (bulk and molecular) geochemical data from DSDP
(Zimmerman et al., 1987) in the Angola Basin (Fig. 1),            Site 361, located at a paleo-latitude of ∼ 45◦ S and a paleo-
suggest that enhanced OC deposition occurred north of the         water depth of 2–2.5 km (Fig. 1; Melguen, 1978; Thiede and
Walvis Ridge during the Early to early Late Aptian, sustained     Van Andel, 1977; Van Andel et al., 1977), where an exten-
by the restricted basin geometry and the continuous supply of     sive Aptian black shale sequence was recovered (The Ship-
nutrients from surrounding continents (Arthur and Natland,        board Scientific Party, 1978), including OAE 1a (Dummann
1979; Behrooz et al., 2018; Naafs and Pancost, 2014). In          et al., 2020). These black shales show repetitive alternations
line with previous studies (e.g., Beckmann et al., 2005), a re-   of OC-rich and (relatively) OC-poor sediments (Dummann
cent study by Behrooz et al. (2018) indicates that marine OC      et al., 2020), indicating highly dynamic depositional condi-
burial dynamics at Site 364 were tightly coupled to orbitally     tions on a timescale of < 1 Myr. We combine our new proxy

Clim. Past, 17, 469–490, 2021                                                           https://doi.org/10.5194/cp-17-469-2021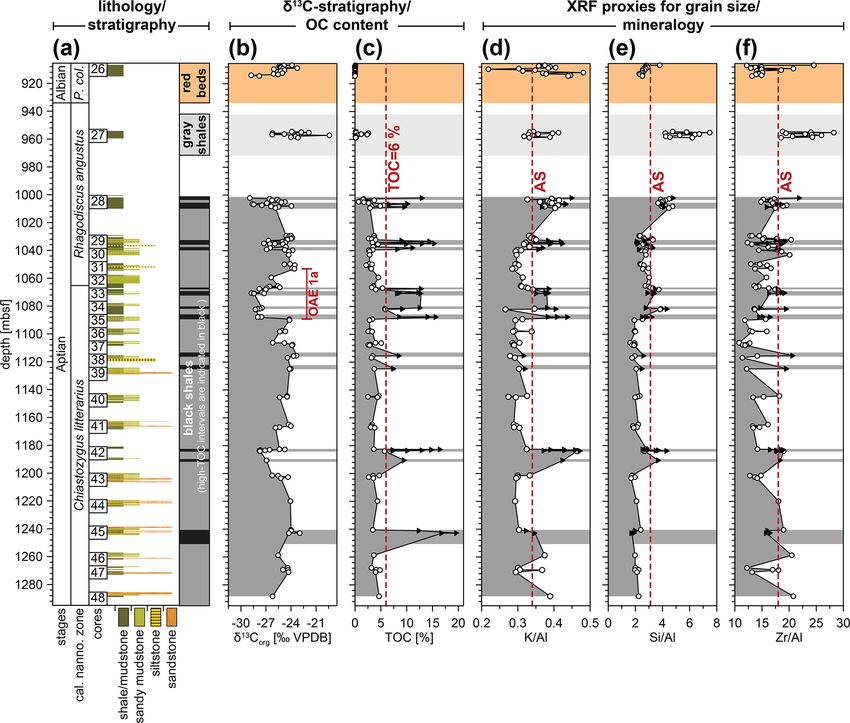
W. Dummann et al.: Driving mechanisms of OC burial in the Cretaceous South Atlantic                                          471

data with general circulation model (GCM) data to provide            In the present study, we divide the sedimentary sequence
insights into the nature and pacing of cyclic fluctuations in     into three lithostratigraphic units, which largely conform
atmospheric circulation and continental hydrology at midlat-      with the units defined by the shipboard scientific party: (1) a
itudes during the Early Cretaceous to evaluate its importance     black shale unit present in cores 48–28 (Fig. 2a), (2) a gray
for open marine OC burial dynamics in the deep Cape Basin.        shale unit in core 27, and (3) red beds in core 26. Gray shales
                                                                  and red beds are subdivided into two lithostratigraphic units
1.1     Geological setting and stratigraphy of DSDP               based on their distinct color and TOC content (Fig. 2c), as
        Site 361                                                  proposed by Dummann et al. (2020).

1.1.1    Lithostratigraphy
                                                                  1.1.2    Biostratigraphy and carbon isotope stratigraphy
Site 361 was drilled on the lower continental rise of South
                                                                  Age constraints for Early Cretaceous sediments at Site 361
Africa (35◦ 03.970 S, 15◦ 26.910 E) at a modern water depth
                                                                  are mainly based on calcareous nannofossil biostratigraphy,
of 4549 m (The Shipboard Scientific Party, 1978). A total of
                                                                  originally defined by Proto Decima et al. (1978) and re-
390 m of Early Cretaceous sediments were penetrated with
                                                                  cently updated by Dummann et al. (2020), indicating an
an average core recovery of ∼ 32 % (Fig. 2a). The shipboard
                                                                  Early Aptian–Albian age for the investigated sediment se-
scientific party of DSDP Leg 40 divided the Early Creta-
                                                                  quence (Fig. 2a). Supported by biostratigraphy (i.e., the first
ceous sediment sequence into two lithostratigraphic units
                                                                  occurrence of Eprolithus floralis at ∼ 1065 m below the
(The Shipboard Scientific Party, 1978). The lower unit (cores
                                                                  sea floor, b.s.f.), Dummann et al. (2020) further identified
28–48; Fig. 2a) is of Early Aptian age and was deposited in a
                                                                  OAE 1a in the Early Aptian black shale unit between 1089
deep proximal fan to fan–valley environment (Kagami, 1978;
                                                                  and 1050 m b.s.f., based on its characteristic carbon isotope
Natland, 1978). Shale intervals occur scattered throughout
                                                                  excursions (Fig. 2b; Menegatti et al., 1998).
the Early Aptian sequence and are intercalated with sand-
and siltstone beds, which account for ∼ 55 % of the recov-
ered sediments (Fig. 2a). These coarse-grained beds have          2     Materials and methods
been interpreted as turbidites, dense traction or debris flows,
and potentially bed loads (Natland, 1978). Intercalated shales    2.1     Sampling strategy
are mostly fissile, partly laminated, and frequently lack bio-    Sampling at Site 361 primarily targeted hemipelagic shale
turbation, indicating deposition under conditions of reduced      intervals, while turbiditic coarse-grained sediments and as-
bottom water oxygenation (Natland, 1978; Arthur and Nat-          sociated shale intervals (i.e., centimeter- to decimeter-thick
land, 1979; Thiede and Van Andel, 1977). Sedimentological         shale intervals, which lie on top of and between sandstone
evidence suggests that shales are partly of hemipelagic and       beds) were omitted. The geochemistry of turbiditic sedi-
turbiditic origin. The former are up to several meters thick      ments has, however, been described in previous studies (e.g.,
and frequently comprise thin alternations of nannofossil lay-     Jacquin and De Graciansky, 1988; Natland, 1978; Kagami,
ers and mudstone intervals, indicating fluctuating deposition     1978). These studies indicate that turbidites were derived
under tranquil conditions (Natland, 1978). The latter are as-     from granitic weathering source regions along the proximal
sociated with sandstone and sandy mudstone beds and pre-          southwestern African coast (Natland, 1978). TOC contents
sumably represent fine-grained turbiditic material, which set-    of sandstones cover a similar range to hemipelagic shales
tled out of suspension (Kagami, 1978).                            (Jacquin and De Graciansky, 1988) with a strong dominance
   The overlying lithostratigraphic unit (cores 26–27; Fig. 2a)   of terrigenous OC, including preserved coal particles and
consists of Late Aptian gray shales and Albian red beds, in       wood fragments (Jacquin and De Graciansky, 1988; Raynaud
which cross-laminated siltstone beds and burrowing struc-         and Robert, 1978). This OC was probably entrained by tur-
tures become abundant (Natland, 1978; The Shipboard Sci-          bidites and transported from the shelf to the deeper basin.
entific Party, 1978), reflecting a strengthening of deep water    To ensure homogenous grain size characteristics among all
circulation and ventilation, respectively (Arthur and Natland,    investigated samples, the samples were screened using geo-
1979). Sandstone beds become less frequent, which has been        chemical grain size proxies (i.e., Si/Al and Zr/Al ratios; e.g.,
linked to subsidence and/or erosion of sediment source re-        Croudace and Rothwell, 2015, and references therein) and
gions along the Southwest African margin (Natland, 1978).         compared to a number of reference samples (n = 8) taken
This profound change in the sedimentary environment of the        from turbiditic sandstones (Fig. 3a).
Cape Basin resulted from an intensified deep water mass
exchange with the adjacent Southern Ocean basin (Arthur
                                                                  2.2     Analytical methods
and Natland, 1979) due to the progressive opening of two
gateways, namely the shallow Falkland Plateau Gateway and         2.2.1    Major and trace element analysis by XRF
deep Georgia Basin Gateway (Dummann et al., 2020).
                                                                  Major (Al, Si, K, Ti) and trace element (Zr, Ni, Cu, V, Zn)
                                                                  concentrations were determined on 131 shale samples and

https://doi.org/10.5194/cp-17-469-2021                                                          Clim. Past, 17, 469–490, 2021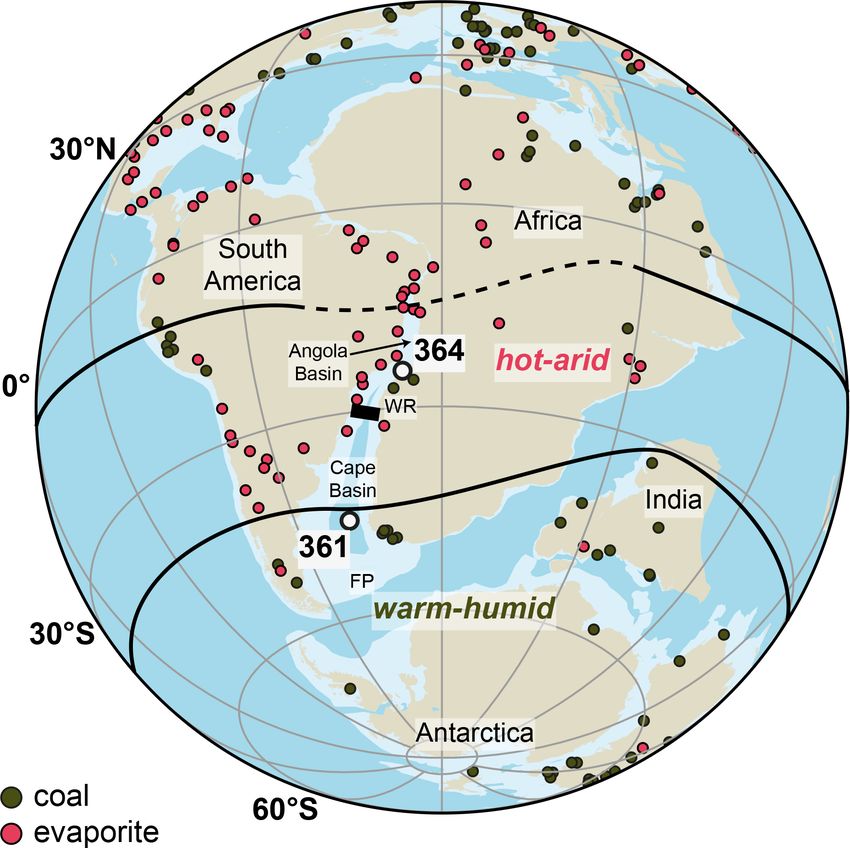
472                                    W. Dummann et al.: Driving mechanisms of OC burial in the Cretaceous South Atlantic

Figure 2. Stratigraphic framework and inorganic geochemistry at DSDP Site 361: (a) stage assignment, calcareous nannofossil zonation,
and lithology of the studied sediment sequence; (b) bulk δ 13 Corg ; (c) total organic carbon content; (d) K/Al ratios; (e) Si/Al ratios; and
(f) Zr/Al ratios. Black triangles with background shading indicate high-TOC black shales (> 6 % TOC). Dashed lines in panels (d)–(f)
represent average shale (AS) ratios. Bulk δ 13 Corg data and TOC content are taken from Dummann et al. (2020). P. col. is an abbreviation for
Prediscosphaera columnata.

8 sandstones using an Itrax x-ray fluorescence (XRF) core                element (REE) composition. Analyses were conducted us-
scanner (Cox Analytical Systems, Sweden) equipped with a                 ing a SCIEX ELAN 6100 inductively coupled plasma mass
Cr tube. Dried and ground samples were pressed into plas-                spectrometer (ICP-MS; Perkin Elmer, USA) following total
tic cubes, which were aligned under the core scanner. Anal-              acid digestion. Aliquots of dried and ground samples were
yses were performed at a resolution of 1 mm and an inte-                 combusted at 550 ◦ C for 4 h to remove OC and subsequently
gration time of 60 s per measurement, yielding 9 to 12 indi-             decomposed in a pressure digestion system (PDS6, Loft-
vidual measurements per sample, which were averaged over                 fields Analytical Solutions, Germany) following published
each sample. Absolute element concentrations were quanti-                protocols (Dulski, 2001). Acids used for digestion were HF
fied by calibration against reference samples of known el-               (40 %, suprapure, Merck, Germany), HNO3 (65 %, supra-
emental composition, which were measured alongside the                   pure, Merck, Germany), HClO4 (70 %, ultrapure, VWR,
samples (for details, see Supplement file S1).                           USA), and HCl (30 %, suprapure, Merck, Germany). Quan-
                                                                         tification was conducted using two external multi-element
                                                                         standard solutions (1 ng−1 , 10 ng−1 ) and a matrix solution.
2.2.2   Trace element analysis by ICP-MS                                 An internal Ru and Re standard was analyzed alongside the
In addition to XRF analysis, 15 black shale samples covering             samples to monitor instrumental drift. Two certified refer-
a range of TOC values from 2.5 %–15.7 % were investigated                ence materials (CRM) JA-2 (Dulski, 2001) and GA (Govin-
for their immobile trace element (Th, Sc, Zr) and rare-earth

Clim. Past, 17, 469–490, 2021                                                                  https://doi.org/10.5194/cp-17-469-2021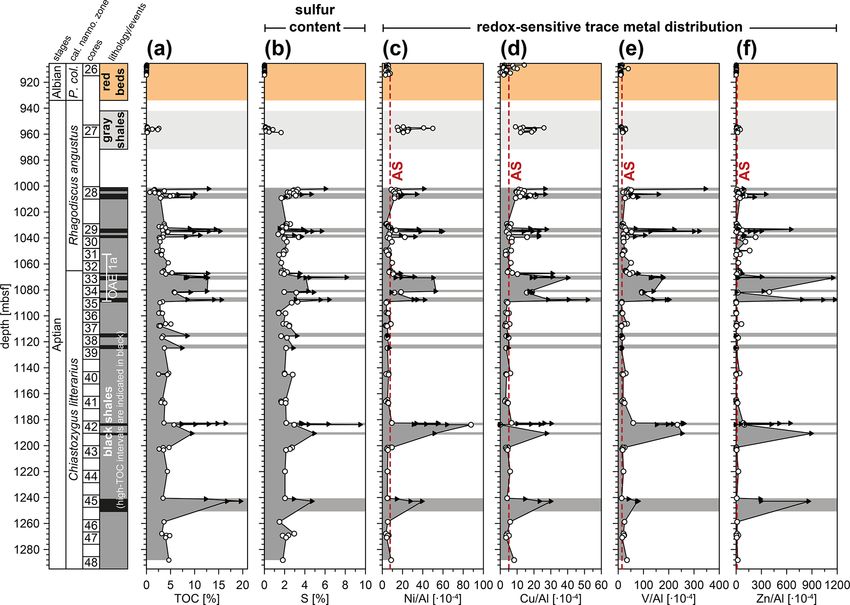
W. Dummann et al.: Driving mechanisms of OC burial in the Cretaceous South Atlantic                                                473

                                                                         daraju, 1994) were used to monitor precision and accuracy.
                                                                         All standards reproduced within ±3 %.

                                                                         2.2.3   Lipid biomarker analysis

                                                                         Aliquots from 71 samples (1–8 g) were extracted with
                                                                         methanol (Merck SupraSolv® , Germany; 30 mL),
                                                                         methanol and dichloromethane (1 : 1, v : v; 30 mL), and
                                                                         dichloromethane (Merck SupraSolv® , Germany; 30 mL) for
                                                                         10 min each in an ultrasonic bath. The extracts were com-
                                                                         bined in a separatory funnel and mixed with ultrapure water
                                                                         to remove methanol. The dichloromethane fraction was
                                                                         decanted and dried under mild vacuum (40 ◦ C, 800 mbar)
                                                                         using a rotary evaporator. Acid-activated copper turnings
                                                                         were added to the extracts to remove elemental sulfur.
                                                                         The samples were saponified using a 0.5 mol potassium
                                                                         hydroxide solution (methanol : water 9 : 1, v : v). Neutral
                                                                         lipids were extracted from the saponification solution with
                                                                         hexane (Merck SupraSolv® , Germany) and partitioned into
                                                                         three polarity fractions (aliphatic hydrocarbons, aromatic
                                                                         hydrocarbons, and heteroatomic nitrogen–sulfur–oxygen
                                                                         (NSO) compounds) over a self-packed silica column
                                                                         (500 mg, 0.063–0.200 mm, 70–230 mesh, Merck, Germany;
                                                                         deactivated with 1 % ultrapure water) using hexane, hexane
                                                                         and dichloromethane (2 : 1, v : v), and dichloromethane
                                                                         and methanol (1 : 1, v : v), respectively. To reduce inter-
                                                                         ferences during mass spectrometric analysis, the aliphatic
                                                                         fraction was further separated into saturated and unsatu-
                                                                         rated compounds using silver-ion chromatography (10 %
                                                                         AgNO3 -coated silica gel, Sigma-Aldrich, USA), which were
                                                                         eluted with hexane and ethyl acetate (Merck SupraSolv® ,
                                                                         Germany), respectively. Deuterated internal standards (i.e.,
                                                                         d50 -tetracosane and d4 -cholestane) were used for quantifi-
                                                                         cation and added to the saturated aliphatic fraction prior to
                                                                         analysis.
                                                                            The saturated aliphatic fractions were analyzed using
                                                                         coupled gas chromatography–mass spectrometry (GC-MS)
                                                                         and gas chromatography–tandem mass spectrometry (GC-
                                                                         MS/MS). The distribution of acyclic hydrocarbons (i.e., n-
                                                                         alkanes, acyclic isoprenoids) was analyzed using an Agilent
                                                                         6890N GC coupled to an Agilent 5975 mass selective detec-
                                                                         tor (MSD) operated in selected ion monitoring (SIM) mode
                                                                         scanning for m/z 85 ([C6 H13 ]+ ) and m/z 98 ([C6 D13 ]+ )
                                                                         fragments. Samples were injected onto a DB5-MS column
                                                                         (50 m, 0.2 mm, 0.25 µm) using a split/splitless injector op-
Figure 3. Geochemical characteristics of the different lithostrati-      erated in splitless mode and heated from 70 to 250 ◦ C. He-
graphic (sub)units: (a) histogram showing the TOC contents of sam-       lium was used as carrier gas at a constant flow rate of
ples from different lithostratigraphic units (i.e., black shales, gray   1.3 mL min−1 . The GC temperature was held at 40 ◦ C for
shales, and red beds). Panel (b) shows cross-plots of XRF-derived        2 min, increased to 140 ◦ C at 10 ◦ C min−1 , and then to 320 ◦
grain size proxies Si/Al and Zr/Al for black shale samples, which        C at 5 ◦ C min−1 . The final temperature was held for 22 min.
are grouped into high-TOC black shales (TOC > 6 %) and low-
                                                                         Ionization was achieved by electron impact (EI) at 70 eV and
TOC black shales (TOC < 6 %). Green diamonds represent samples
taken from intercalated sandstones, which are plotted for reference.
                                                                         230 ◦ C. Reproducibility was monitored using an authentic n-
Panel (c) shows cross-plots of TOC content and K/Al ratios. AS           alkane standard solution and was better than 1 %.
stands for average shale.                                                   Sterane and hopane distributions were analyzed using an
                                                                         Agilent 7890B GC coupled to an Agilent 7000C electron im-

https://doi.org/10.5194/cp-17-469-2021                                                                Clim. Past, 17, 469–490, 2021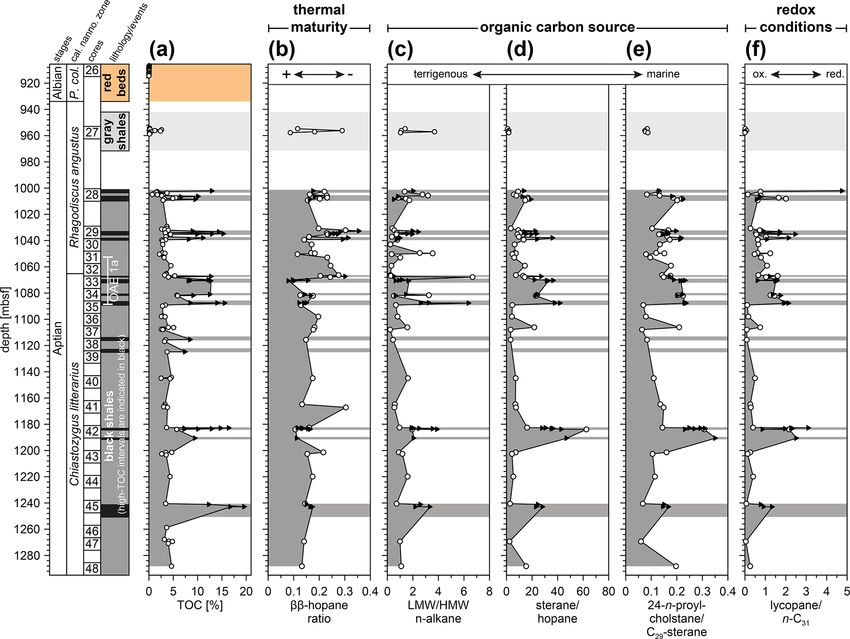
474                                 W. Dummann et al.: Driving mechanisms of OC burial in the Cretaceous South Atlantic

pact triple quadrupole mass spectrometer (EI-TQ-MS) op-              We further performed orbital sensitivity experiments at
erated in multiple reaction monitoring (MRM) mode. Sam-           600 and 1200 ppm pCO2 to assess the influence of cyclic
ples were injected onto a HP5-MS column (50 m, 0.25 mm,           fluctuations in solar insolation on continental hydrology. Nu-
0.25 µm) using a split/splitless injector operated in splitless   merical solutions for orbital parameters beyond ∼ 50 Ma be-
mode at 290 ◦ C. Helium was used as carrier gas at a con-         come highly uncertain (Laskar et al., 2011). We therefore fol-
stant flow rate of 1.2 mL min−1 . The initial GC tempera-         lowed the method of Crowley et al. (1993) and defined two
ture was held at 60 ◦ C for 2 min, then increased to 140 ◦ C at   end-member configurations representing maxima and min-
10 ◦ C min−1 and to 320 ◦ C at 4 ◦ C min−1 , which was held for   ima in summer insolation, implementing Pleistocene ranges
15 min. Ionization was achieved by EI at 70 eV and 300 ◦ C.       for eccentricity, obliquity, and precession (Berger, 1978).
Argon was used as a collision gas at a collision energy of        Both simulations with low and high pCO2 concentrations
10 V. Reproducibility was monitored using an in-house stan-       used a constant eccentricity of 0.06 with varying obliquity
dard containing all targeted compounds at similar concentra-      and precession to create a “warm summer orbit” (24.5◦ obliq-
tion levels. The reproducibility of measurements varied be-       uity; perihelion during southern summer solstice) and a “cold
tween different compounds and was mostly better than 5 %          summer orbit” (22.0◦ obliquity; perihelion during southern
but always better than 10 % for all reported biomarker ratios.    winter solstice) for the Southern Hemisphere. The sensitivity
                                                                  experiments were branched off from a modern orbit simu-
2.3   General circulation modeling                                lation (eccentricity = 0.0167; obliquity = 23.44; longitude of
                                                                  perihelion = 283) after 2500 model years and integrated for
Model simulations were carried out with the Kiel Cli-             another 500 years to allow the atmospheric dynamics to adapt
mate Model (KCM; Park et al., 2009). The KCM uses the             to the orbital perturbation.
ECHAM5 spectral atmospheric model with a horizontal res-
olution of ∼ 2.8◦ (T42) on 19 vertical levels (Roeckner et
                                                                  3     Results
al., 2003) coupled to the ocean–sea ice component NEMO
(Madec, 2008) on a tripolar grid with a horizontal reso-          3.1    Total organic carbon content
lution of 2◦ (ORCA2) and 31 vertical levels. The merid-
ional ocean resolution gradually increases to 0.5◦ towards        TOC contents and bulk δ 13 Corg data at Site 361 were pre-
the Equator. Modifications to the model for the Early Creta-      viously reported by Dummann et al. (2020). Aptian–Albian
ceous configuration are described in Dummann et al. (2020).       sediments at Site 361 range from 0 % to 19.7 % TOC
We slightly modified the bathymetry of the area north of the      (Figs. 2c and 3a) with marked differences between the three
Walvis Ridge (∼ 30◦ S) by replacing the Early Albian paleo-       lithostratigraphic units (i.e., black shales, gray, and red beds).
bathymetry used in Dummann et al. (2020) with the Early           Red beds and gray shales generally contain < 0.1 % TOC and
Aptian boundary conditions of Sewall et al. (2007) to account     0.1 %–2.6 % TOC, respectively, while TOC contents of black
for the reduced northward extent of the Angola Basin during       shales range from 0.7 % to 19.7 % (Fig. 3a). Black shale sam-
the Aptian (Fig. S1 in Supplement file S4).                       ples with < 3 % TOC are generally confined to short intervals
   Two 3000-year-long simulations with atmospheric pCO2           in core 28 in the top part of black shale unit (Fig. 2c). We
levels of 600 and 1200 ppm were performed to reflect pub-         broadly subdivide the black shale unit into “low-TOC black
lished range of stomata-based pCO2 reconstructions for the        shales” (i.e., 0.7 %–6 % TOC) and “high-TOC black shales”
Aptian–Albian (Jing and Bainian, 2018) and enhanced pCO2          (i.e., > 6 % TOC) to differentiate two OC burial end-member
levels during OAE 1a (Naafs et al., 2016), respectively. Even     states and to facilitate the discussion of related changes in
though peak pCO2 concentrations during the hyperthermal           paleo-environmental conditions. The former subunit com-
phase of OAE 1a may have been even higher (Naafs et al.,          prises the majority of black shale samples (i.e., 70 %), which
2016), Steinig et al. (2020) showed that the KCM is ca-           cluster around a mean of 3.5 % TOC (Fig. 3a) and appear
pable of simulating upper ocean temperatures at a pCO2            to constitute background sedimentation during the Early Ap-
of 1200 ppm, which are broadly consistent with the lower          tian (Fig. 2c). High-TOC black shales contain a broad range
end of proxy reconstructions for OAE 1a. This model–data          of TOC contents (i.e., 6 %–19.7 %; Fig. 3a) and, by contrast,
congruence can be achieved by assuming a regional warm            are restricted to narrow (several decimeters to meters thick)
bias in the Early Cretaceous TEX86 record in the young At-        and repetitive stratigraphic intervals (Fig. 2c). We note, how-
lantic Ocean. We are therefore confident that our 1200 ppm        ever, that changes in TOC content across individual high-
pCO2 model represents an OAE 1a-like climate state rea-           TOC intervals often occur gradually and are unrelated to vis-
sonably well, while the 600 ppm simulation instead reflects       ible changes in sedimentary facies. These observations sug-
lower Early Cretaceous background pCO2 levels (Jing and           gest that both subunits are interrelated and may represent a
Bainian, 2018). Results were averaged over the last 100           continuum. As such, the exact placement of the TOC thresh-
model years, when the model reached a quasi-steady state          old is to some extent arbitrary.
with a globally depth-integrated temperature drift over 1000
model years of below 0.2 ◦ C (Fig. S2 in Supplement file S4).

Clim. Past, 17, 469–490, 2021                                                          https://doi.org/10.5194/cp-17-469-2021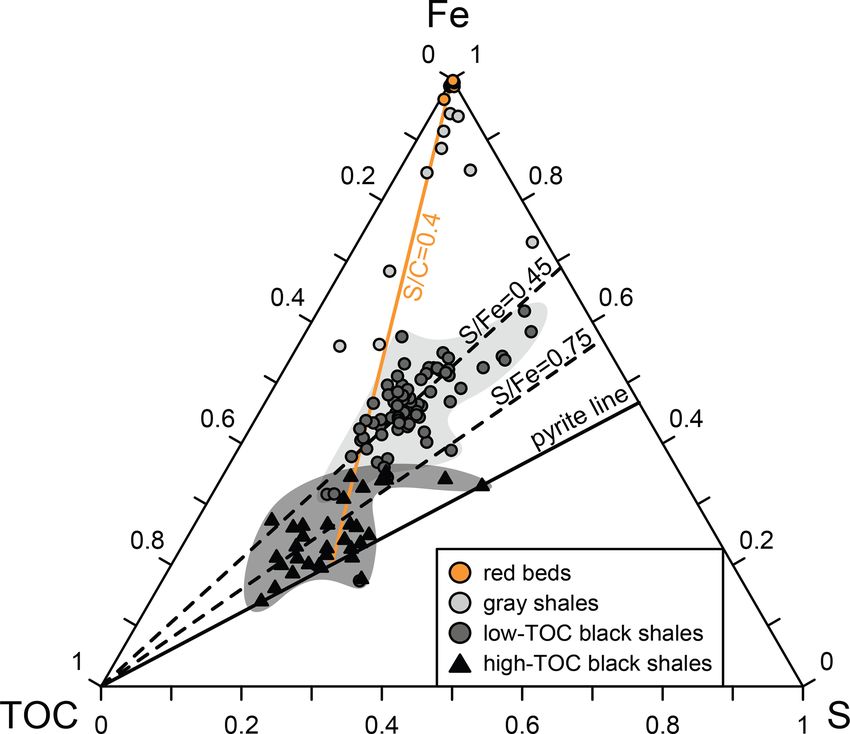
W. Dummann et al.: Driving mechanisms of OC burial in the Cretaceous South Atlantic 475
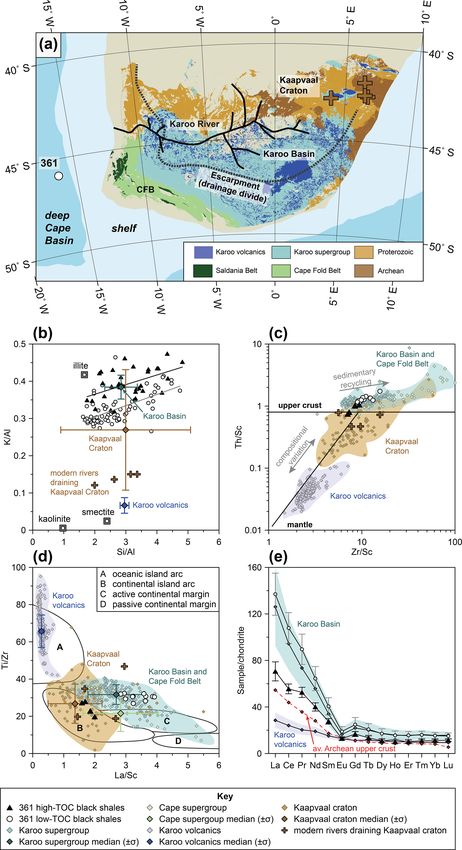
3.2 Sediment composition and provenance prising mafic rocks include the Kaapvaal Craton and Karoo
volcanics (Fig. 4c–e).
3.2.1 Distribution of K, Si, and Zr
To track changes in geochemical composition related to grain 3.3 Inorganic paleo-redox parameters
size and mineralogy of the sediments, we report K/Al, Si/Al,
3.3.1 Distribution of sulfur and iron
and Zr/Al ratios obtained by XRF analysis (Fig. 2d–f). All
black shales at Site 361 show Si/Al and Zr/Al ratios typical The stratigraphic variation of sulfur content closely paral-
for fine-grained sediments with ratios close to average shale lels that of the TOC content (Fig. 5b). Sulfur contents of
(AS) values (Wedepohl, 2004, 1971) and are distinctly lower Early Aptian black shales fluctuate around a mean value of
than in intercalated turbiditic sandstones (Figs. 2e, f and 3b). 2.9 % ± 1.4 % and decrease to 0.4 % ± 0.5 % in Late Aptian
Neither Si/Al nor Zr/Al ratios differ substantially between gray shales. Albian red beds are essentially sulfur-free. Low-
high-TOC and low-TOC black shale intervals. In contrast, TOC black shales are characterized by a mean sulfur content
K/Al ratios vary in concert with TOC (Figs. 2d and 3c), of 2.2 % ± 0.5 %, while high-TOC black shales contain ap-
with high-TOC black shales showing a higher mean K/Al proximately twice as high sulfur contents (4.5 % ± 1.6 %).
ratio of 0.39 ± 0.04 (x ± 1σ ) compared to low-TOC black Fe, S, and TOC relationships are used to differentiate be-
shales with a mean ratio of 0.32 ± 0.05. Turbiditic sand- tween paleo-redox states based on diagnostic S/C and S/Fe
stones show K/Al ratios, which mostly cover the same range ratios (Fig. 6; Dean and Arthur, 1989; Arthur and Sageman,
as shale samples. Some sandstones, however, show substan- 1994); the latter of which approximate the degree of pyriti-
tially higher K/Al ratios of > 0.6 (Fig. 3c). zation (DOP; Raiswell et al., 1988). Red bed and gray shale
samples scatter around a S/C mixing line of ∼ 0.4, typi-
3.2.2 Sediment provenance cal for sediments deposited in an oxic environment (Berner
and Raiswell, 1983; Leventhal, 1983). Gray shales and red
Immobile trace element and REE geochemistry were used beds show S/Fe ratios well below the threshold value of
to constrain the provenance of Early Aptian black shales. 0.45, which is generally used to discriminate oxic from “re-
To define provenance types and tectonic settings, we used stricted” (i.e., suboxic–anoxic) conditions (Raiswell et al.,
discrimination plots following the approach of Bhatia and 1988). Black shales show overall higher S/Fe ratios, cov-
Crook (1986) and McLennan et al. (1993), respectively. Fur- ering a broader range between the 0.25 and the pyrite line.
thermore, potential sediment source regions located on the Low-TOC black shales and high-TOC black shales clus-
proximal southern African continent were identified based on ter into two populations with minor overlap. S/Fe ratios
comparison with geochemical data compiled from the liter- of low-TOC black shales fall close to 0.45, with a rela-
ature. This data compilation comprising shale and mudstone tively large scatter between 0.25 and 0.75. High-TOC black
samples from sediment source regions is provided in Supple- shales instead tend to have S/Fe ratios greater than 0.45, of-
ment files S2 and S3 and includes all relevant references. ten exceeding 0.75 (mean of 0.85 ± 0.24), indicating “inhos-
All black shale samples show trace element and REE pitable” (i.e., strictly anoxic to euxinic) conditions (Raiswell
patterns typical for continental crust with clear differences et al., 1988).
between low-TOC and high-TOC black shales (Fig. 4c–
e). Low-TOC black shales show characteristics typical for
3.3.2 Distribution of redox-sensitive trace metals
a recycled sedimentary rock provenance (McLennan et al.,
1993), including Th/Sc > 1 and enrichment of Zr/Sc relative Distributions of the redox-sensitive trace metals (TMs) Ni,
to Th/Sc (Fig. 4c). In addition, all low-TOC samples show Cu, V, and Zn in black shales are presented as TM/Al ra-
Th/Zr and La/Sc ratios indicative for an active continental tios in Fig. 5c–f and enrichment factors (EFs) relative to
margin signature (Fig. 4d), implying a felsic to intermediate AS values in Fig. 7. All TM/Al ratios co-vary closely with
sediment source composition, which is also supported by a each other and with TOC (Fig. 5c–f). Albian red beds all
strong enrichment of the light REE La, Ce, Pr, Nd, and Sm show TM/Al close to or below AS values with mean EFs of
and a pronounced negative Eu anomaly (Fig. 4e). All above 0.7 ± 0.2, 0.9 ± 0.7, 0.8 ± 0.5, and 0.1 ± 0.2 for Ni, Cu, V,
proxy parameters overlap with those reported from the Karoo and Zn, respectively. Similarly low EFs for V (1.3 ± 0.4) and
and Cape supergroup (Fig. 4c–e). Zn (1.8 ± 1.4) are present in Late Aptian gray shales, which,
In contrast, the trace element and REE signature of high- however, show substantially higher EFs for Ni (3.4 ± 1.4)
TOC black shales suggests a greater contribution from mafic and Cu (3.2 ± 1.0). Low-TOC black shales show minor, if
sediment sources, as indicated by slightly lower Th/Sc ratios any, TM enrichment beyond AS values, with mean EFs of
(Fig. 4c), lower La/Sc ratios (Fig. 4d), and depletion of light 1.2 ± 1.3, 1.3 ± 0.8, 2.0 ± 2.0, and 3.2 ± 5.4 for Ni, Cu, V,
REE compared to low-TOC black shales (Fig. 4e). High- and Zn, respectively. In contrast, high-TOC black shales are
TOC samples plot close to the continental island arc end- characterized by consistently higher TM EFs, with V and
member (Fig. 4d), indicating a bulk sediment source com- Zn being particularly enriched, as indicated by mean EFs of
position close to granodiorite. Potential source regions com- 10.5 ± 5.9 and 31.4 ± 32.6, respectively. Enrichment of Ni
https://doi.org/10.5194/cp-17-469-2021 Clim. Past, 17, 469–490, 2021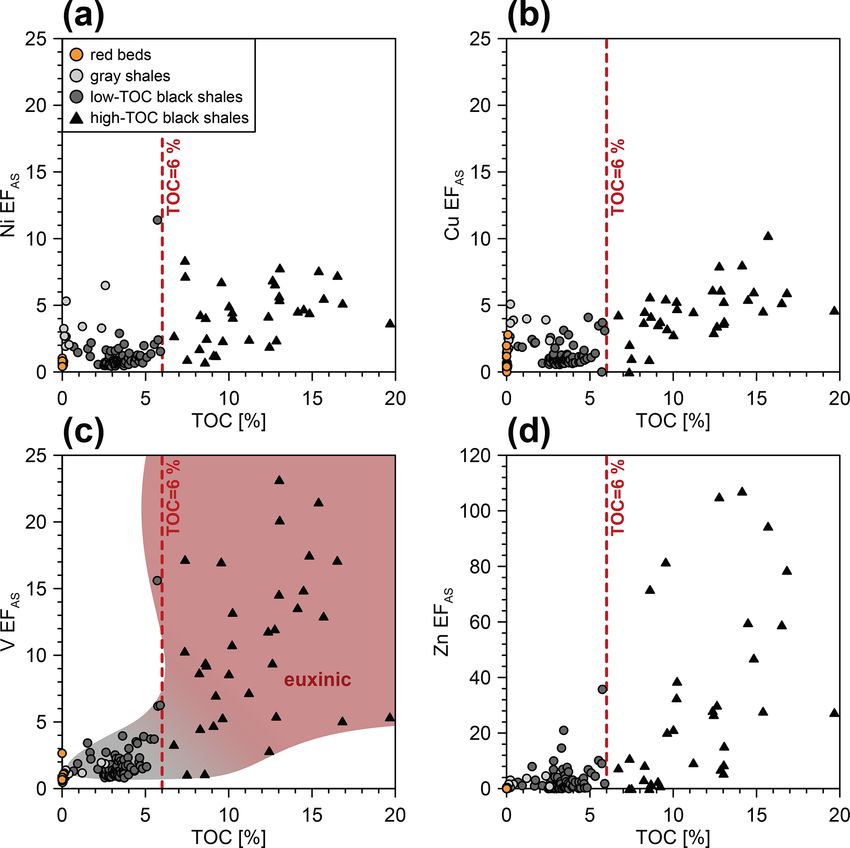
476                                    W. Dummann et al.: Driving mechanisms of OC burial in the Cretaceous South Atlantic

Figure 4. Provenance assessment of Early Aptian black shales based on major and trace metal discrimination plots: (a) geological map
of southern Africa showing potential sediment source areas. Early Cretaceous paleo-drainage reconstruction adapted from De Wit (1999).
Panel (b) shows cross-plots of Si/Al and K/Al. Average elemental composition of different clay minerals was taken from Weaver and
Pollard (1973). Panels (c) and (d) show cross-plots of Zr/Sc vs. Th/Sc (McLennan et al., 1993) and La/Sc vs. Ti/Zr (Bhatia and Crook,
1986), respectively. Panel (e) shows chondrite-normalized rare-earth element distributions. Trace element data for source areas were compiled
from the literature. Data and references are provided in Supplements files S2 and S3.

Clim. Past, 17, 469–490, 2021                                                                  https://doi.org/10.5194/cp-17-469-2021
W. Dummann et al.: Driving mechanisms of OC burial in the Cretaceous South Atlantic                                                  477

Figure 5. Inorganic geochemical parameters used to reconstruct paleo-redox conditions: (a) total organic carbon content (Dummann et al.,
2020); (b) total sulfur content; and (c–f) Ni/Al, Cu/Al, V/Al, and Zn/Al ratios. Black triangles with background shading indicate high-TOC
black shales (> 6 % TOC). Average shale TM/Al ratios (AS) are plotted as red dashed lines. P. col. is short for Prediscosphaera columnata.

and Cu in high-TOC black shales is more modest with mean               3.4.1    Thermal maturity
values of 4.4 ± 2.2 and 4.5 ± 2.0, respectively.
                                                                       Sediments at Site 361 are thermally immature at an esti-
   Cross-plots of TM EFs against TOC provide additional in-
                                                                       mated RO of < 0.4 % (Peters et al., 2007). Steranes mainly
formation on the mechanisms of sedimentary TM enrichment
                                                                       possess the thermally least stable 5α,14α,17α(H)-20R
and thus paleo-redox conditions (Tribovillard et al., 2006;
                                                                       or 5β,14α,17α(H)-20R stereoisomeric configurations.
Algeo and Maynard, 2004). High-TOC black shales show
                                                                       Thermally unstable 17β,21β(H)-hopanes dominate over
pronounced differences in TM-TOC relationships for Ni, Cu,
                                                                       more stable 17α,21β(H) and 17β,21α(H) hopanes and
V, and Zn relative to low-TOC black shales (Fig. 7). Ni and
                                                                       the most stable configurations such as 17α,21β(H)-30S-
Cu EFs tend to increase with TOC content, although only Cu
                                                                       homohopanes and 18α(H)-22,29,30-trisnorneohopane (Ts)
exhibits a clear linear relationship (R 2 = 0.38) to TOC con-
                                                                       are either absent or occur in trace amounts only. The ratios
tent. In contrast, V and Zn EFs show a substantial scatter and
                                                                       of 17β,21β(H)/[17α,21β(H)+17β,21α(H)+17β,21β(H)]-
no relationship to TOC content.
                                                                       C30 -hopane (ββ-hopane-ratios) vary between 0.08 and 0.36
                                                                       (mean of 0.18 ± 0.06; Fig. 8b), do not increase downcore,
3.4   Biomarker distribution                                           and show no systematic trend when compared to TOC,
Our biomarker assessment focuses on thermal maturity, OC               indicating that thermal maturation effects had a negli-
sources, and paleo-redox conditions, for which we report se-           gible impact on down-core variations in the biomarker
lected biomarker parameters, while a detailed discussion of a          distribution.
whole suite of biomarkers is beyond the scope of this study.
                                                                       3.4.2    Organic carbon sources
                                                                       Variations in OC sources are assessed based on the rela-
                                                                       tive abundances of n-alkanes, desmethylsteranes, and regu-

https://doi.org/10.5194/cp-17-469-2021                                                                 Clim. Past, 17, 469–490, 2021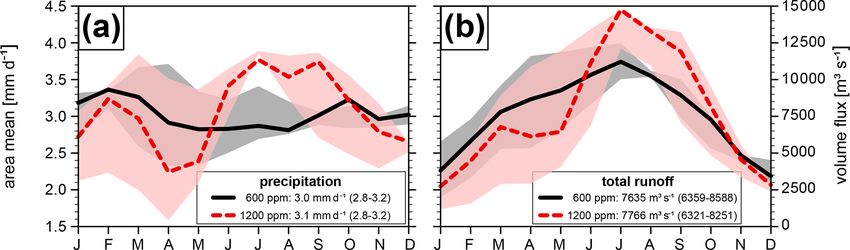
478 W. Dummann et al.: Driving mechanisms of OC burial in the Cretaceous South Atlantic
bution of marine and terrigenous OC. The ratios of 24-
npc / C29 -sterane co-vary with TOC (Fig. 8e) and range be-
tween 0.06 and 0.35. Low-TOC black shales show a 24-
npc / C29 -sterane mean ratio of 0.14 ± 0.08, which increases
to 0.21 ± 0.09 in high-TOC black shales.
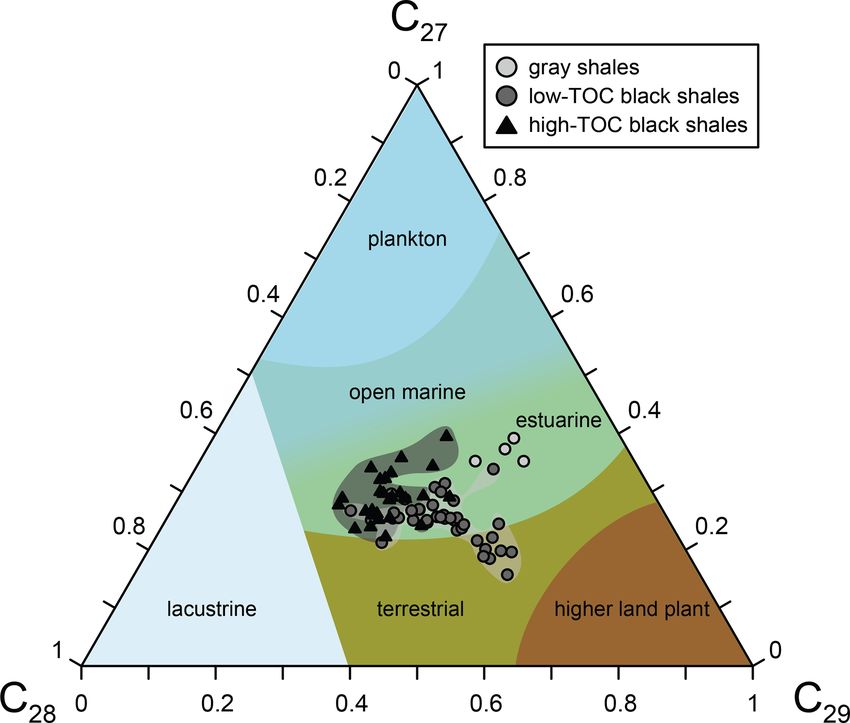
Fractional abundances of regular C27 , C28 , and C29 ster-
anes, depicted as a ternary diagram (Fig. 9), are used to
differentiate different eukaryotic sources (Huang and Mein-
schein, 1979). Higher land plant-derived C29 -steranes tend to
dominate in low-TOC black shales, while C27 and C28 domi-
nate over C29 in high-TOC black shales, suggesting a greater
contribution of marine OC.
3.4.3 Paleo-redox conditions
Our molecular paleo-redox assessment is based on the dis-
Figure 6. Ternary diagram illustrating TOC, S, and Fe rela- tribution of lycopane, a tail-to-tail linked acyclic isoprenoid,
tionships in the different lithostratigraphic (sub)units. Character- the occurrence of which is limited to anoxic depositional set-
istic S/Fe and S/C ratios used to discriminate redox states (i.e., tings (Sinninghe Damsté et al., 2003). Lycopane abundances
oxic conditions: S/C = 0.4 and S/Fe < 0.45; suboxic–anoxic con- are normalized to C31 n-alkane, following Sinninghe Damsté
ditions: S/Fe = 0.45–0.75; and strictly anoxic–euxinic conditions: et al. (2003). Lycopane / n-C31 ratios range from 0.04 to
S/Fe > 0.75) are plotted as proposed by Raiswell et al. (1988), Lev- 4.8 and co-vary closely with TOC (Fig. 8f), with low-TOC
enthal (1983), and Berner and Raiswell (1983). TOC data are taken black shales and high-TOC black shales showing mean ra-
from Dummann et al. (2020). tios of 0.7 ± 0.5 and 1.7 ± 1.0, respectively. Furthermore, we
screened the aromatic hydrocarbon fraction of all samples
for isorenieratene derivatives and related compounds, whose
lar hopanes (i.e., C27 and C29 –C33 hopanes). Chain lengths presence imply photic-zone euxinia (Koopmans et al., 1996).
of n-alkanes range from C15 to C35 . High molecular weight However, no isorenieratene derivatives were detected in any
(HMW) C25 to C35 n-alkanes show an odd-over-even pre- of the analyzed samples.
dominance (with a mean carbon preference index CPI25–33
of 1.9; Bray and Evans, 1961), indicating a higher land plant
4 Discussion
origin (Bray and Evans, 1961; Eglinton and Hamilton, 1967).
The ratio of low molecular weight (LMW) C15 , C17 , and 4.1 Temporal trends in organic carbon burial
C19 n-alkanes, indicative of algal and/or bacterial OC in-
put (Han and Calvin, 1969), to HMW odd carbon-numbered Changes in OC burial in the Aptian–Albian Cape Basin
C25 to C35 n-alkanes varies from 0.2 to 6.7 (Fig. 8c). Low- occurred on different timescales. On a multimillion-year
TOC black shales show a lower mean LMW/HMW ratio of timescale, OC burial decreased in two steps, as reflected
1.3 ± 1.1 compared to high-TOC black shales, which have a in the lithological succession of black shales in the Ap-
mean LMW/HMW ratios of 2.1 ± 1.4. tian (6.0 ± 4.4 % TOC), gray shales in the latest Aptian
A suite of C27 to C35 hopanes, reflecting OC inputs (0.8 ± 1.0 % TOC), and red beds in the Albian (< 0.1 %
from prokaryotic or bacterial sources, and regular C27 to TOC). Superimposed on this long-term trend, we identify
C30 desmethylsteranes, indicative of eukaryotic OC sources, several distinct episodes of enhanced OC burial (i.e., high-
are present in varying concentrations. Eukaryotic OC gen- TOC black shales), punctuating the Early Aptian interval
erally dominates over bacterial OC, as indicated by ster- (Fig. 2c). Most of these high-TOC intervals reach peak TOC
ane / hopane ratios (ratio of C27 to C29 desmethylsteranes to levels well above 10 % (11.5 ± 3.2 % TOC), clearly sepa-
regular C27 and C29 to C33 hopanes) ranging from 2.3 to 62.5 rating them from background sedimentation with still el-
(Fig. 8d). Low-TOC black shales are characterized by mean evated but much lower TOC content (3.5 ± 1.0 % TOC).
sterane / hopane ratios of 10.9 ± 9.3, which increase in high- These high-TOC intervals occurred during different time
TOC black shale interval to a mean value of 28.3 ± 12.8. intervals across the Aptian, including, but not limited to,
The extended 24-n-propylcholestane (24-npc), a proxy OAE 1a (Fig. 2b, c). The exact duration and the frequency
that can indicate contributions of marine algae to OC of these intervals is difficult to assess based on the incom-
(Moldowan et al., 1990), is present throughout the record. We plete stratigraphic coverage at Site 361; i.e., they may have
normalize the abundance of 24-npc to C29 -desmethylsterane, lasted longer, and there may have been other high-TOC in-
which is generally linked to higher land plant inputs (Huang tervals in non-recovered sediment sections. However, com-
and Meinschein, 1979), to approximate the relative contri- parable TOC alternations in black shale sequences have been
Clim. Past, 17, 469–490, 2021 https://doi.org/10.5194/cp-17-469-2021W. Dummann et al.: Driving mechanisms of OC burial in the Cretaceous South Atlantic 479
Figure 7. Cross-plots of total organic carbon content and average shale-normalized enrichment factors (EFAS ) of (a) Ni, (b) Cu, (c) V, and
(d) Zn. Black triangles indicate high-TOC black shales (> 6 % TOC). TOC data are taken from Dummann et al. (2020).
reported from both the North Atlantic and South Atlantic 4.2 Paleo-redox variations
basins throughout the Cretaceous and have been attributed
to geochemical expressions of large-scale climate variations 4.2.1 Paleo-redox conditions during black shale
driven by orbital forcing (Beckmann et al., 2005; Behrooz et deposition in the Early Aptian
al., 2018; Hofmann and Wagner, 2011; Wagner et al., 2013; Early Aptian black shales contain high S contents of
Kolonic et al., 2005; Herrle et al., 2003). To test the impact 2.9 ± 1.4 % (Fig. 5b) with S/Fe ratios 0.6 ± 0.3 (Fig. 6)
of orbital forcing on OC burial, we conducted a series of and high abundances of the redox-sensitive biomarker ly-
GCM experiments implementing different orbital configura- copane, as reflected in elevated lycopane / n-C31 ratios of
tions (i.e., variations in precession and obliquity). The set- 1.1 ± 0.9 (Fig. 8f), which fall within the range of modern
up of our GCM is geared to simulate atmospheric processes, anoxic settings, e.g., oxygen minimum zones along the Peru
including changes in precipitation, run-off, and wind-driven Margin and the northern Arabian Sea (Sinninghe Damsté et
oceanic upwelling, all of which are known to directly or in- al., 2003). These observations indicate low oxygen concen-
directly influence the magnitude of marine OC burial (e.g., trations in porewaters and bottom waters during the Early
Wagner et al., 2013, and references therein). Based on our Aptian. S/Fe ratios of ∼ 0.5 (indicating a DOP range of
proxy and GCM results, we provide a depositional model for 0.45–0.75, Raiswell et al., 1988) and a limited degree of
these episodes of enhanced OC burial, which is discussed authigenic TM enrichment (TM EFs close to AS values) in
in the context of large-scale reorganizations of tectonic and low-TOC black shales suggest overall dysoxic–suboxic con-
oceanographic boundary conditions induced by the opening ditions during background sedimentation. Consistent with
of South Atlantic–Southern Ocean gateways (Dummann et paleo-bathymetric reconstructions (Pérez-Díaz and Eagles,
al., 2020). 2017) and sedimentological evidence (Arthur and Natland,
1979), we link reduced oxygen conditions to sluggish deep
water ventilation, caused by the narrow and restricted geom-
etry of the Early Aptian Cape Basin. In support of this hy-
pothesis, our GCM results indicate nearly stagnant deep wa-
https://doi.org/10.5194/cp-17-469-2021 Clim. Past, 17, 469–490, 2021480 W. Dummann et al.: Driving mechanisms of OC burial in the Cretaceous South Atlantic Figure 8. Distribution of selected biomarker parameters used to reconstruct thermal maturity, OC source, and paleo-redox conditions: (a) total organic carbon content (Dummann et al., 2020), (b) ββ / (ββ +αβ +βα)-C30 -hopane ratio, (c) low molecular weight/high molecular weight n-alkane ratio, (d) sterane / hopane ratio, (e) 24-n-propylcholestane / C29 -sterane ratio, and (f) lycopane / n-C31 ratio. Black triangles with background shading indicate high-TOC black shales (> 6 % TOC). P. col. is short for Prediscosphaera columnata. ter circulation in the deepest parts of the Cape Basin, where sensitive TMs, however, may serve to distinguish these subtle warm and saline waters accumulated (Fig. S3 in Supplement fluctuations at the extreme end of the redox scale (Algeo and file S4). This halokinetic mode of deep water circulation Maynard, 2004; Tribovillard et al., 2006; Meyer and Kump, is generated in all model runs, regardless of implemented 2008). climatic boundary conditions (i.e., pCO2 levels of 600 and At Site 361, all analyzed redox-sensitive TMs show close 1200 ppm; Fig. S3 in Supplement file S4), indicating that it parallel trends of enrichment and depletion concurrent with represents a persistent feature of South Atlantic overturning TOC variations (Fig. 5). This strong similarity of trends be- circulation during the Early Aptian. tween different redox-sensitive TMs supports that changes Anoxia intensified during high TOC intervals, as indicated in the dissolved TM inventory are negligible and that paleo- by (1) a doubling of sulfur contents (Fig. 5b), (2) sharp redox conditions exerted the dominant control over TM en- increases in redox-sensitive TM/Al ratios (Fig. 5c–f), and richment (Algeo and Maynard, 2008). Cross-plots of TM EFs (3) elevated lycopane / n-C31 ratios (Fig. 8f). Furthermore, and TOC reveal two distinct patterns of TM enrichment for Fe, S, and TOC relationships show that most of high-TOC Ni and Cu and V and Zn in high-TOC black shales (Fig. 7). black shales have S/Fe ratios greater than 0.75 (Fig. 6), ar- Ni and Cu EFs increase in parallel with TOC content, sug- guing for strictly anoxic–euxinic conditions (Raiswell et al., gesting that excess TM enrichment was controlled by OC 1988). Distinguishing euxinic conditions, characterized by supply to the sediment. Such a coupling of Ni and Cu en- accumulation of H2 S in the water column, from non-sulfidic richment with OC flux has been observed in sediments de- but anoxic (“ferruginous”) conditions is difficult based on posited under both anoxic ferruginous conditions and eux- Fe, S, and TOC systematics alone. The distribution of redox- inic conditions (Algeo and Maynard, 2004; Tribovillard et Clim. Past, 17, 469–490, 2021 https://doi.org/10.5194/cp-17-469-2021
W. Dummann et al.: Driving mechanisms of OC burial in the Cretaceous South Atlantic                                           481

                                                                    of euxinia are difficult to assess based on the data presented
                                                                    here. However, our GCM results indicate relatively vigorous
                                                                    overturning at intermediate water depths in the Cape Basin
                                                                    (i.e., < 1000 m; Fig. S3 in Supplement file S4). These water
                                                                    masses, which have previously been identified and referred
                                                                    to as “South Atlantic intermediate waters” by Dummann et
                                                                    al. (2020), may have caused an efficient ventilation at inter-
                                                                    mediate water depths, thereby providing a barrier for upward
                                                                    migration of H2 S into shallow waters.

                                                                    4.2.2    Early Aptian–Albian long-term increase in
                                                                             seawater oxygenation
                                                                    Early Aptian black shales were replaced by Late Aptian gray
                                                                    shales and Albian red beds (Fig. 2c), reflecting a decrease in
                                                                    OC burial over at least 13 Myr (Gradstein et al., 2012). Our
                                                                    multi-proxy paleo-redox data suggest that this long-term de-
                                                                    cline in OC burial was accompanied by major redox changes
Figure 9. Ternary diagram showing the distribution of regular       in the deep Cape Basin. Evidence includes (1) a stepwise de-
desmethylsteranes in gray shales, low-TOC black shales (< 6 %       crease in sulfur concentrations (Fig. 5b), (2) shifts in Fe, S,
TOC), and high-TOC black shales (> 6 % TOC). Organic car-           and TOC relationships with decreasing S/Fe ratios (Fig. 6),
bon source end-members were adapted from Huang and Mein-            (3) a decrease in redox-sensitive trace element enrichment, in
schein (1979).                                                      particular of V and Zn (Fig. 5c–f), and (4) decreasing lyco-
                                                                    pane / n-C31 ratios (Fig. 8f; Sinninghe Damsté et al., 2003).
                                                                    These results are consistent and suggest a two-step shift from
al., 2006) and mainly stems from their behavior as micronu-         suboxic–anoxic/euxinic to suboxic and oxic conditions, re-
trients (Tribovillard et al., 2006; Little et al., 2015). In con-   spectively, which was caused by a strengthening of deep
trast, high-TOC black shales are characterized by substan-          water ventilation due the progressive opening of two South
tial enrichment of V, which is decoupled from OC input,             Atlantic–Southern Ocean gateways located on the Falkland
as indicated by the lack of correlation between V EFs and           Plateau and in the Georgia Basin, as indicated by a recent
TOC (Fig. 7c). This mode of V enrichment supports euxinic           study based on Nd-isotope data and ocean current simula-
conditions at the sediment–water interface and possibly the         tions (Dummann et al., 2020).
(lower) water column (Algeo and Maynard, 2004; Tribovil-               It is noteworthy, however, that Late Aptian gray shales
lard et al., 2006). The presence of free H2 S favors reduction      show relatively high EFs of Ni and Cu but not the other TMs
to V(III) (Wanty and Goldhaber, 1992), which forms insol-           (Fig. 5c–f). Taking above lines of evidence into account, we
uble hydroxide phases that can precipitate in quantity from         consider it unlikely that this enrichment stems from redox-
the water column and/or the sediment–water interface, lead-         related authigenic processes, but it instead suggests addi-
ing to a decoupling of V supply from OC flux. Zn EFs exhibit        tional processes supplying micro-nutrients to Late Aptian
a distribution similar to V EFs (Fig. 7d), which is typical for     sediments in the Cape Basin through detrital input (Garver
euxinic settings and potentially results from the formation of      et al., 1996) or scavenging by biogenic silica (Böning et al.,
independent zinc sulfide (ZnS) phases at the sediment–water         2015; Twining et al., 2012). The exact mechanism, however,
interface (Algeo and Maynard, 2004). Further evidence for           remains to be identified.
euxinic conditions during high-TOC intervals comes from
the occurrence of type IIS kerogens (Hartwig et al., 2012),         4.3     Composition of organic carbon in Early Aptian black
indicating excess availability of sulfur.                                   shales
   In contrast to many Mesozoic black shales deposited under
                                                                    Both low TOC and high-TOC black shales contain thermally
euxinic conditions (Meyer and Kump, 2008, and references
                                                                    immature OC, as indicated by the continuous down-core
therein), high-TOC black shales at Site 361, however, do not
                                                                    presence of 5β-steranes and 17β,21β-hopanes. ββ-Hopane
contain biomarkers derived from phototrophic H2 S oxidiz-
                                                                    ratios do not increase downcore and show no systematic
ing bacteria (i.e., isorenieratene derivatives and other aryl
                                                                    trend with TOC (Fig. 8b). Hence, changes in the sterane and
isoprenoids; Koopmans et al., 1996). This general lack of
                                                                    hopane biomarker distribution due to thermal maturation are
photic-zone euxinia-indicating compounds at Site 361 puts
                                                                    negligible and are interpreted to reflect primary variations in
constraints on the extent of water column euxinia and sug-
                                                                    the source and/or preservation of OC.
gests that H2 S did not pervade into the upper water column.
The oceanographic conditions that favored this limited extent

https://doi.org/10.5194/cp-17-469-2021                                                           Clim. Past, 17, 469–490, 2021
482 W. Dummann et al.: Driving mechanisms of OC burial in the Cretaceous South Atlantic
Early Aptian low-TOC background sediments contain a Immobile trace element and REE data suggest that high
mixture of marine and terrestrial OC with a greater propor- TOC–low TOC alternations were accompanied by consis-
tion of terrestrial OC compared to high-TOC black shale tent changes in sediment provenance, which we attribute to
intervals, as indicated by (1) lower LMW/HMW n-alkane changes in sediment routing and weathering regime on the
ratios (Fig. 8c), (2) lower sterane / hopane ratios (Fig. 8d) proximal southern African continent. Similar to today, sedi-
indicating a higher contribution from bacteria, typical for ments accumulating in the deep Cape Basin were most likely
land-derived OC (e.g., Moldowan et al., 1985), (3) lower transported to the Southwest African shelf by west-flowing
24-npc / C29 -sterane ratios (Fig. 8e), and (4) higher abun- river systems (De Wit, 1999; Dingle and Hendry, 1984; Par-
dances of C29 -sterane (Fig. 9). These results are consistent tridge and Maud, 1987). According to paleo-drainage re-
with previously published Rock-Eval data that show a dom- constructions, one major sediment route may have been the
inance of terrigenous type III kerogen in low-TOC black paleo-Karoo River, which entered the South Atlantic close
shales (Hartwig et al., 2012). to the modern Olifants River mouth in close proximity to
In contrast, high-TOC black shales mainly comprise ma- Site 361 (Fig. 4a; De Wit, 1999). Recent apatite fission-
rine OC, as indicated by the dominance of LMW n-alkanes track analyses support these paleo-drainage reconstructions
(Fig. 8c). In connection with high sterane / hopane ratios and date the incision of the paleo-Karoo River into coastal
(Fig. 8d), the dominance of algal C27 -sterane and C28 - areas of southwestern Africa at ∼ 120 to ∼ 110 Ma (Kounov
sterane over higher land plant-derived C29 -sterane support et al., 2008), implying active river input to the Aptian Cape
a predominantly marine OC source (Fig. 9; Huang and Basin. We consider three potential sediment source regions,
Meinschein, 1979; Moldowan et al., 1985). Increased 24- representing the major geological provinces of the southern
npc / C29 -sterane ratios similarly suggest enhanced input of African continent (Fig. 4a): (1) Paleozoic to Early Mesozoic
marine OC (Fig. 8e), as 24-npc has been linked to OC in- sediments from the Karoo and Cape supergroup, mainly lo-
puts from chrysophyte algae (Moldowan et al., 1990) and/or cated in the southwest and central part of southern Africa;
Rhizaria (Nettersheim et al., 2019), a group of heterotrophic (2) Jurassic volcanics related to the Karoo large igneous
unicellular protists, including Foraminifera and Radiolaria province, capping and intervening the Karoo supergroup in
that occurs ubiquitously in the global ocean and plays a key the east and northeast; and (3) Archean to Proterozoic sed-
in the export of carbon from the photic zone to sediments imentary, volcanic, and metamorphic rocks of the Kaapvaal
(Caron, 2016; Lampitt et al., 2009). Based on the above lines Craton, located in the northeast. The geochemical compo-
of evidence, we conclude that high-TOC black shales mark sition of potential sediment source regions is presented in
episodes of enhanced productivity and preservation of ma- Fig. 4c–e. Due to the complex geology of the Kaapvaal Cra-
rine OC in the Cape Basin. This is further supported by the ton and related intracratonic sediment sequences, we also in-
occurrence of II and IIS kerogens with hydrogen index values cluded geochemical data of river bed sediments from modern
of up to 700 mg g−1 TOC in high-TOC black shales (Herbin rivers draining the Kaapvaal Craton, reflecting a more inte-
et al., 1987; Hartwig et al., 2012). grated signal (Garzanti et al., 2014).
Trace element discrimination plots suggest that Paleo-
4.4 Depositional processes and provenance of Early zoic sediments from the Karoo and Cape supergroup were
Aptian black shales the dominant weathering source of low-TOC black shales
(Fig. 4c–e). This indicates a minor contribution from the
Early Aptian black shales are intercalated with abundant Kaapvaal Craton and Karoo volcanics in the east and north-
sandstones, sandy mudstones, and siltstones (Fig. 2a), which east, which display more mafic geochemical signatures,
represent turbidites deposited in a fan to fan–valley environ- as indicated by lower Th/Sc, Zr/Sc, La/Sc, higher Ti/Zr
ment (The Shipboard Scientific Party, 1978; Natland, 1978). (Fig. 4c, d) and light REE depletion (REE characteristics of
This raises the question as to whether high TOC–low TOC al- the Kaapvaal Craton are approximated by average Archean
ternations reflect changes between turbiditic and hemipelagic upper crust composition; Fig. 4e). Hence, we propose a dom-
sedimentation, similar to those observed at numerous sites in inant sediment input from Paleozoic source regions located
the opening North Atlantic and South Atlantic basins (De- along the coast in the west and southwest, with a minor con-
gens et al., 1986; Forster et al., 2008). Our geochemical grain tribution from mafic rocks further inland. Similar coastal re-
size proxies (i.e., Si/Al and Zr/Al ratios), however, indicate a gions have been inferred as the source region of turbiditic
homogenous grain size among all investigated shale samples sediments at Site 361 (Natland, 1978). This may indicate that
with a markedly higher abundance of fine-grained siliciclas- sediment input during low-TOC background sedimentation
tic material compared to sandstones (Fig. 3b). These observa- predominantly originated from areas located west of the es-
tions and the good reproducibility of global δ 13 C variations carpment (Fig. 4a), which today represents a major drainage
recorded in black shales at Site 361 (Fig. 2b; Dummann et al., divide that possibly already existed during the Early Creta-
2020) suggest that both black shale types are of hemipelagic ceous (Moore et al., 2009).
origin. In contrast, trace element and REE compositions of high-
TOC black shales support a shift to more mafic signatures,
Clim. Past, 17, 469–490, 2021 https://doi.org/10.5194/cp-17-469-2021You can also read


