Collective invasion induced by an autocrine purinergic loop through connexin-43 hemichannels
←
→
Page content transcription
If your browser does not render page correctly, please read the page content below
ARTICLE
Collective invasion induced by an autocrine
purinergic loop through connexin-43 hemichannels
Antoine A. Khalil1,2, Olga Ilina2, Angela Vasaturo3, Jan-Hendrik Venhuizen2, Manon Vullings2, Victor Venhuizen2, Ab Bilos4, Carl G. Figdor3,
Paul N. Span5, and Peter Friedl1,2,6,7
Progression of epithelial cancers predominantly proceeds by collective invasion of cell groups with coordinated cell–cell
junctions and multicellular cytoskeletal activity. Collectively invading breast cancer cells express the gap junction protein
Downloaded from http://rupress.org/jcb/article-pdf/219/10/e201911120/1048361/jcb_201911120.pdf by guest on 16 November 2020
connexin-43 (Cx43), yet whether Cx43 regulates collective invasion remains unclear. We here show that Cx43 mediates gap-
junctional coupling between collectively invading breast cancer cells and, via hemichannels, adenosine nucleotide/nucleoside
release into the extracellular space. Using molecular interference and rescue strategies, we identify that Cx43 hemichannel
function, but not intercellular communication, induces leader cell activity and collective migration through the engagement
of the adenosine receptor 1 (ADORA1) and AKT signaling. Accordingly, pharmacological inhibition of ADORA1 or AKT signaling
caused leader cell collapse and halted collective invasion. ADORA1 inhibition further reduced local invasion of orthotopic
mammary tumors in vivo, and joint up-regulation of Cx43 and ADORA1 in breast cancer patients correlated with decreased
relapse-free survival. This identifies autocrine purinergic signaling, through Cx43 hemichannels, as a critical pathway in leader
cell function and collective invasion.
Introduction
Collective invasion of multicellular groups with intact cell–cell 2018; Marins et al., 2009). Gap junctions consist of connexins
junctions is an important mechanism to local invasion and me- (Cxs) oligomerized into hemichannels that engage across cell
tastasis in epithelial cancers (Gaggioli et al., 2007; Friedl and membranes (Goodenough and Paul, 2009). The resulting
Gilmour, 2009; Cheung and Ewald, 2016). Collective invasion transmembrane connections mediate gap-junctional transfer
is initiated and maintained by leader cells that extend actin-rich of ions and small molecules (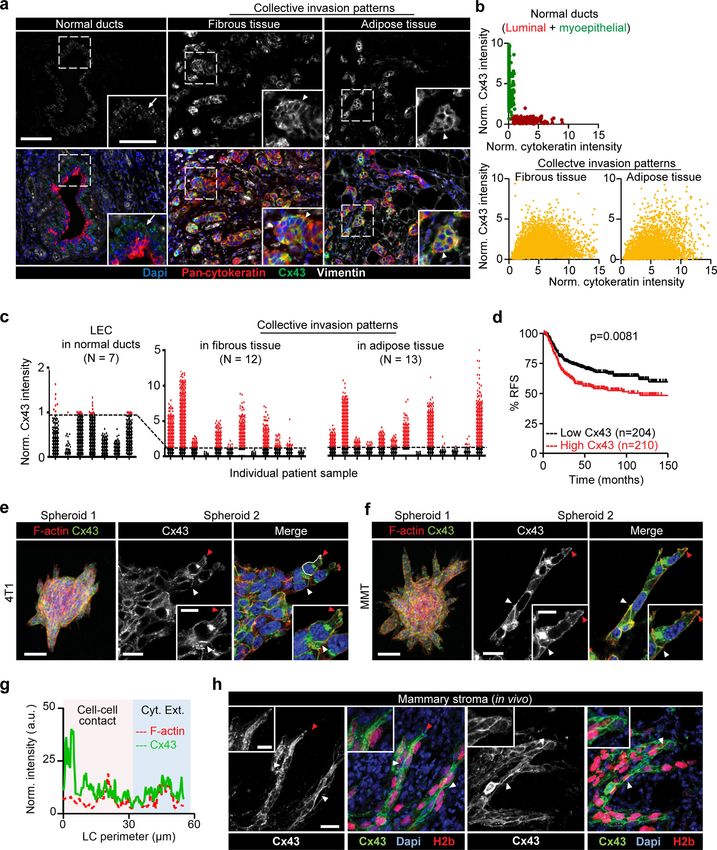
release of chemotactic factors to induce cell polarity and mi- breast cancer patients (Györffy et al., 2010), high Cx43 gene
gration (Barletta et al., 2012; Haynes et al., 2006; Kaczmarek expression was associated with decreased relapse-free survival
et al., 2005). In morphogenesis, Cxs are indispensable for coor- (RFS) in patients with estrogen receptor (ER)–negative sub-
dinated tissue growth (Sinyuk et al., 2018). By regulating cell types, including the basal subtype (Fig. 1 d), and Her2-positive
differentiation, Cxs further counteract neoplastic transformation tumors (Fig. S1 e). No inverse association was detected when
(Bazzoun et al., 2019; Fostok et al., 2019; Saunders et al., 2001; patients were classified based on tumor grade or on the ER-
Zhang et al., 2003), and forced expression of Cxs in transformed positive subtype (Fig. S1 e).
cells reduces tumor cell growth and inhibits invasion by re- To address whether Cx43 supports invasion, the ER-negative
verting the epithelial-to-mesenchymal transition (Kazan et al., metastatic breast cancer cells 4T1, which express E-cadherin,
2019; McLachlan et al., 2006). On the other hand, Cxs remain and mouse mammary tumor (MMT) cells, which lack E-cadherin
expressed in several solid tumors, and their expression increases but expresses N-cadherin (Ilina et al., 2018), were embedded
in metastases (Bos et al., 2009; Elzarrad et al., 2008; Kanczuga- as multicellular spheroids in 3D collagen lattices and moni-
Koda et al., 2006; Stoletov et al., 2013). Interference with Cx43 tored for invasion over 24–48 h (Videos 1 and 2). 4T1 and
expression or channel function inhibits cancer cell migration MMT cells invaded as collective strands and expressed high
in vitro (Ogawa et al., 2012) and reduces metastatic seeding by levels of Cx43 and Cx45 mRNA and low levels of other Cxs after
Downloaded from http://rupress.org/jcb/article-pdf/219/10/e201911120/1048361/jcb_201911120.pdf by guest on 16 November 2020
reducing binding of circulating tumor cells to vascular endo- isolation from collagen matrix culture (Fig. S1 f). During col-
thelial cells (el-Sabban and Pauli, 1991; Elzarrad et al., 2008; lective invasion, Cx43 was localized along cell–cell junctions
Stoletov et al., 2013). Because Cxs exert a range of functions, and (Fig. 1, e and f, white arrowheads) and in nonjunctional do-
these may vary between tumor types and experimental con- mains, along cell protrusions (Fig. 1, e and f, red arrowheads;
ditions, an integrating concept on how Cxs either suppress or and Fig. 1 g). Junctional and nonjunctional Cx43 localization
enhance neoplastic progression is lacking (Aasen et al., 2019; was further observed during invasion into the mammary fat
Naus and Laird, 2010). pad in vivo (Fig. 1 h). In contrast to Cx43, Cx45 was absent along
Whereas a role of Cxs in collective processes in morpho- cell–cell junctions but localized in the cytosol (Fig. S1 g). Thus,
genesis has been established, the contribution of gap-junctional Cx43 is expressed at the surface of collectively invading breast
communication in collective tumor cell invasion remains un- cancer cells in vitro and in vivo.
clear (Friedl and Gilmour, 2009). We here revisited Cx43 ex-
pression and function in breast cancer models of collective Cx43 mediates GJIC during collective invasion
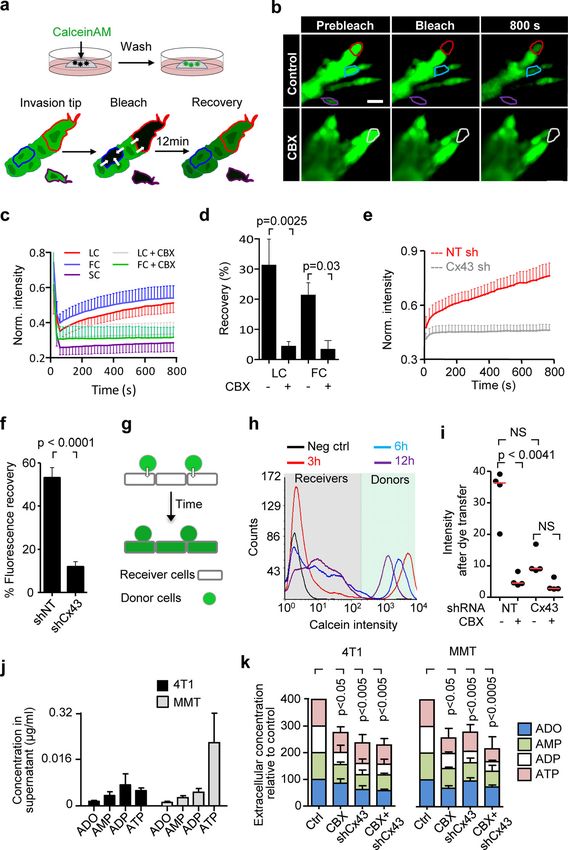
invasion. Using pharmacological inhibition, molecular interference, Collective invasion in 3D spheroid culture was initiated by single
and rescue strategies, we show that Cx43 mediates gap-junctional or few leader cells, which extended actin-rich protrusions to the
intercellular communication (GJIC) between collectively invading front and maintained cadherin-based junctions with following
cells and, via hemichannels, the release of purine derivatives into cells (Fig. S2, a and b). To examine whether gap junctions are
the extracellular space. Cx43 hemichannel-mediated release of active during collective invasion, intercellular dye transfer was
adenosine (ADO) nucleotides initiate an autocrine loop inducing measured in 3D spheroid invasion cultures using gap FRAP
leader cell function and collective invasion, but not single-cell (Video 3 and Fig. 2 a). Within minutes after photobleaching,
motility, through ADO receptor 1 (ADORA1) and AKT/protein leader and follower cells recovered the calcein signal by 20–30%
kinase B signaling. (Fig. 2, b and c), with unbleached neighboring cells acting as
donors (Video 3; and Fig. S2, c and d). As internal control, de-
tached single cells lacked dye transfer after photobleaching
Results (Fig. 2, b and c; Fig. S2, c and d, purple cell outline; Video 3).
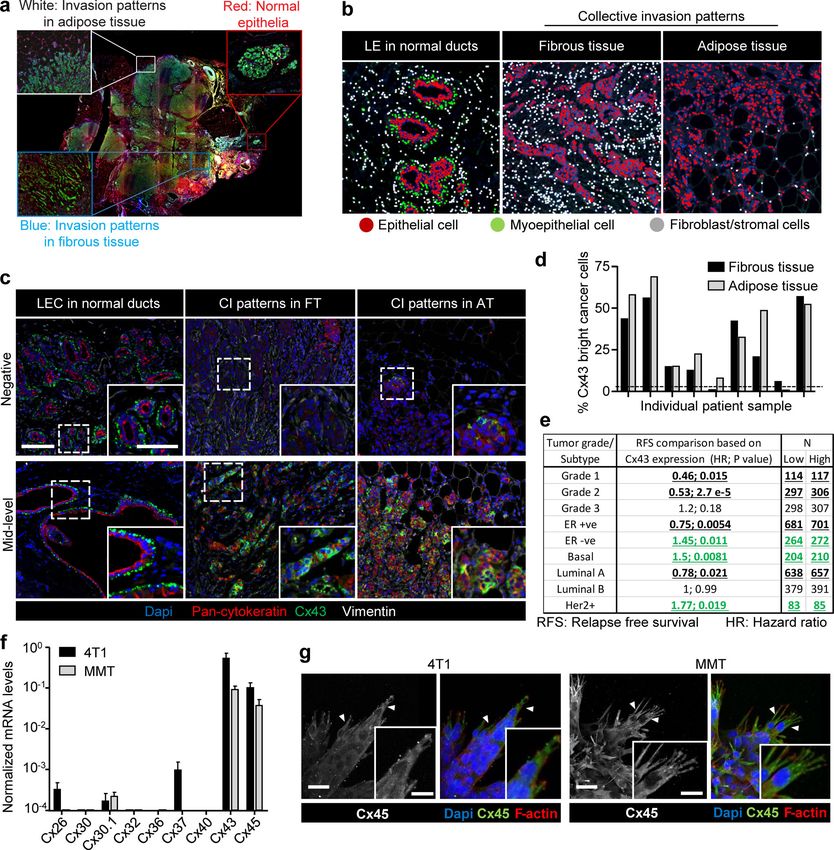
Breast cancer cells express Cx43 during collective invasion Fluorescence recovery was reduced by 70–85% after inhibition
To address whether Cxs are expressed in invasive ductal breast of Cx channel function by carbenoxolone (CBX; Fig. 2, b–d; and
carcinoma infiltrating the fibrous tumor stroma and adipose Video 3). Fluorescence recovery was further impaired when
tissue, Cx43 expression was detected in patient samples by Cx43 expression was stably down-regulated (by >80%) using
multispectral imaging (Fig. S1, a and b; and Mascaux et al., 2019). shRNA (Fig. 2, e and f; and Fig. S2, e–h).
Nonneoplastic ducts consisted of luminal epithelial cells with To test whether all cells maintain GJIC or only specific cell
negative to low Cx43 expression and Cx43-positive myoepithe- subsets, dye transfer between freshly interacting breast cancer
lial cells (Fig. 1, a and b; and Fig. S1 c). In tumors, however, cells was measured (parachute assay; Abbaci et al., 2008; Fig. 2 g).
multicellular epithelial strands or roundish clusters with cyto- Within a 12-h observation period, the majority of control 4T1 cells
keratin expression located in the fibrous or adipose tissue (90–95%) received dye from the calcein-loaded monolayer (Fig. 2 h).
showed increased Cx43 expression in 9 out of 12 samples, and The extent of dye transfer was strongly reduced by 67–84% by CBX
expression was increased compared with normal luminal epi- treatment or Cx43 down-regulation (Figs. 2 i and S2 i). These data
thelium (Fig. 1 a, arrowheads; Fig. 1 c; and Fig. S1, c and d). The indicate that collectively invading breast cancer cells interact by
fraction of Cx43bright cells, as quantified by single-cell in situ GJIC through Cx43.
cytometry in Cx43-positive samples (Fig. 1 c, red label), varied
from 5% to 75% (Fig. S1 d). This indicates that invasive ductal Cx43 hemichannels release purine nucleotides
carcinomas contain subregions of high Cx43 expression in the Besides gap junctions, Cxs can form transmembrane hemi-
invasion zones. Using meta-analysis of the Györffy cohort of channels (Ye et al., 2003), which release small molecules from
Khalil et al. Journal of Cell Biology 2 of 18
Connexin-43–mediated collective invasion https://doi.org/10.1083/jcb.201911120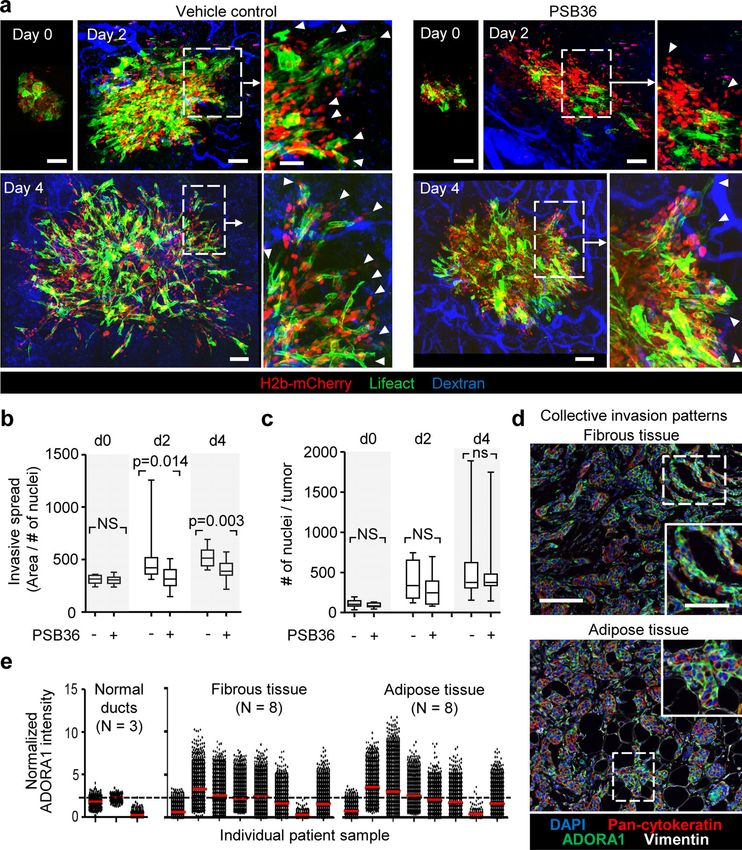
Downloaded from http://rupress.org/jcb/article-pdf/219/10/e201911120/1048361/jcb_201911120.pdf by guest on 16 November 2020

Figure 1. Increased expression of Cx43 in breast cancer cells during collective cancer cell invasion in vivo and in vitro. (a) Multispectral microscopy of
breast cancer tissue sections stained for Cx43 (green), pan-cytokeratin (red; epithelial cells), vimentin (white; stromal cells, cancer cells after epithelial-to-
mesenchymal transition). The three panels represent example slices for normal ducts and the invasion zones in the collagen-rich fibrous or adipose tissue.
Detection of Cx43 in myoepithelial cells surrounding the luminal epithelium and epithelial cancer cells along cell–cell junctions. Arrows and arrowheads depict
Cx43 at cell–cell contacts with puncta or linear patterns, respectively. (b) Colocalization analysis of Cx43 versus pan-cytokeratin expression and classified
myoepithelial cells, luminal epithelial cells, and invading cancer cells in fibrous or adipose tissue. Cx43 and pan-cytokeratin levels were acquired using su-
pervised automated tissue segmentation software (Inform). (c) Cx43 levels in luminal epithelium cells (LEC) and cancer cells within the fibrous or adipose tissue
from 13 clinical samples (see Table 1 for sample details). Dotted line represents the threshold level for Cx43 negativity, determined by receiving operator

Khalil et al.                                                                                                                            Journal of Cell Biology     3 of 18
Connexin-43–mediated collective invasion                                                                                  https://doi.org/10.1083/jcb.201911120
characteristic (ROC) analysis with intensity values obtained from the luminal epithelial cells as control. (d) Kaplan–Meier survival plot predicting RFS for high
versus low Cx43 expression in basal-type breast cancer patients (Györffy et al., 2010). P values, log-rank test. (e and f) Distribution of Cx43 along cell–cell
junctions (white arrowheads) and at the polar extensions (red arrowheads) of leader cells during collective invasion of 4T1 (e) and MMT (f) spheroids in 3D
collagen. (g) Intensity distribution of Cx43 and F-actin along the circumference of a leader cell (LC; e, white dashed border). Values show the pixel intensity
with background subtraction. Confocal images are displayed as maximum-intensity projections from a 3D confocal stack. (h) Cx43 expression and distribution
during collective invasion of 4T1 cells in the stroma of the mouse mammary gland, 4 d after implantation and monitored by confocal microscopy. Scale bars:
100 µm (a, e, and f, overview), 50 µm (a, inset), 20 µm (e and f, spheroid 2; h), 10 µm (e, f, and h, inset). Cyt. Ext., cytoplasmic extension. Norm, normal.
the cytosol into the extracellular space, including glutamate, shape. Invasion strands, emerging despite interference, retained
prostaglandins, and the purine nucleotides ATP and ADP intact morphology and cortical F-actin organization (Fig. 3 c,
(Baroja-Mazo et al., 2013; Eltzschig et al., 2006; Retamal et al., arrowheads; and Fig. 3 d).
2007). Extracellular ATP and ADP and their degradation pro- The decreased initiation and prolongation of invasion strands
duct, ADO, are important energy equivalents. In addition, ex- after interference with Cx43 suggested that the activity of leader
tracellular nucleotides/nucleosides are effective extracellular cells was compromised. Leader cells are critical in initiating and
signaling molecules, which promote the directional migration in maintaining collective invasion (Cheung et al., 2013; Zhang et al.,
Downloaded from http://rupress.org/jcb/article-pdf/219/10/e201911120/1048361/jcb_201911120.pdf by guest on 16 November 2020
endothelial cells (Kaczmarek et al., 2005), microglia (Haynes 2019). To test whether leader cell function depends on Cx43,
et al., 2006), and neutrophils (Barletta et al., 2012), as well as fluorescent mosaic spheroids of cells expressing nontargeting or
in individually moving cancer cells (transwell assay; Zhou et al., Cx43 shRNA at equal ratio were allowed to invade. Cells with
2015). In addition to its localization at cell–cell contacts between down-regulated Cx43 were 50% less likely to acquire leader cell
invading cells, Cx43-positive foci were present in protrusions of position (Fig. 3, j and k). CBX treatment reduced the speed of
leader cells (Fig. 1, e, f, and h, red arrowheads; and Fig. 1 g). To leader cells as assessed by cell tracking (Fig. S3 f and Video 4).
address whether breast cancer cells release purine nucleotides Besides decreasing leader cell initiation, intermittent inhibition
during invasion, supernatants from 3D collagen cultures were of GJIC by CBX in spheroids with established collective invasion
analyzed for ADO, AMP, ADP, and ATP by HPLC. Whereas cell- affected leader cell function. CBX caused near-instantaneously
free media contained no purine metabolites, 3D spheroid inva- collapsing protrusive tips, followed by speed reduction, and,
sion cultures after 24 h contained high levels of extracellular ATP ultimately, strand retraction (Fig. 3 l and Video 5). Leader cell
(0.1–0.25 µg/ml) and moderate levels of ADO, AMP, and ADP functions were restored after CBX washout (Video 5), indicating
(10–50 ng/ml; Fig. 2 j). that Cx channels were required for the initiation and mainte-
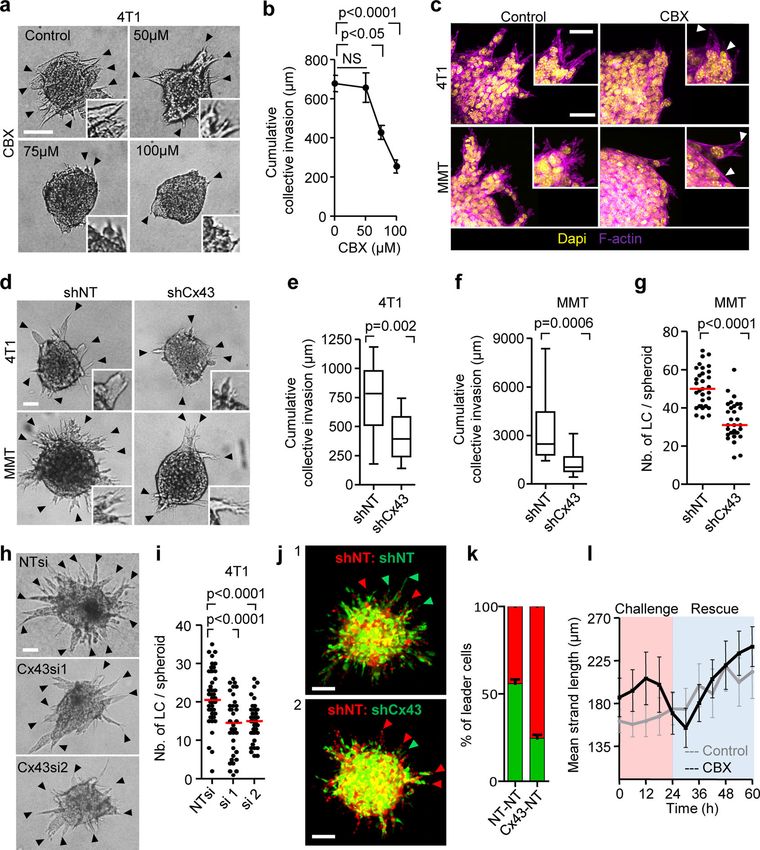
Inhibition of Cx channel-function by CBX and Cx43 knock- nance of collective invasion.
down both reduced the extracellular levels of ADO (by 26–42%), We next aimed to understand which of the two channel
AMP (by 40–41%), ADP (by 60–64%), and ATP (by 28–52%; Figs. functions of Cx43, GJIC or hemichannel activity, is required for
2 k and S2 j). This indicates that breast cancer cells release pu- collective invasion. Therefore, we bypassed hemichannel func-
rine nucleosides and nucleotides through Cx43 hemichannels in tion by exogenous addition of ADO in Cx-inhibited cultures and
3D invasion culture. tested whether invasion was restored. Exogenous ADO was
added to 4T1 and MMT spheroid cultures in the presence of CBX
Cx43 is required for leader cell function or after Cx43 down-regulation. Increasing concentrations of
To determine whether Cx43 function, including GJIC and hem- ADO partially (35–50%) restored the frequency of leader cells
ichannel activity, is required for collective cell invasion, 3D compared with untreated cells (Fig. 4, a–c; and Fig. S4 a). ADO
spheroid cultures were treated with the pharmacological chan- substitution further restored defective leader cell function
nel blockers CBX or 18 α-glycyrrhetinic acid (18aGA) at doses caused by down-regulation of Cx43 in mosaic spheroids (Fig. 4 d,
that did not compromise growth (Fig. S3, a and b). Cultures were green cells; and Fig. 4 e). These data suggest that nucleotide/
treated either before (prevention) or after collective invasion nucleoside release via hemichannels is essential, while GJIC is
has started (intervention). Both compounds dose-dependently dispensable for collective invasion. The restored leader cell
reduced strand initiation and impaired the emergence of leader function by exogenous ADO thus indicates an autocrine Cx43-
cells compared with the inactive homologue glycyrrhizic acid hemichannel-dependent purinergic signaling loop to secure
ammonium salt (GLZ) or vehicle control (Fig. 3 a, arrowheads, collective migration.
Fig. 3, b and c; Fig. S3, c and d, arrowheads; and Fig. 3 e). Con-
sequently, the invasion speed and cumulative length of collective Autocrine purinergic receptor signaling maintains collective
invasion strands after 24 h were reduced by up to 10-fold cell invasion
(Fig. 3 b; and Fig. S3, f–h). The signaling function of extracellular ADO depends on its
Likewise, stable down-regulation of Cx43 by shRNA com- binding to P1 purinergic receptors (Barletta et al., 2012). P1 re-
promised both the number and length of collectively invading ceptors belong to the G-protein–coupled family of receptors,
strands (Fig. 3, d–g). To rule out adaptation or off-target effects with the members ADORA1, ADORA2a, ADORA2b, and ADORA3
of stable Cx43 down-regulation, transient Cx43 down-regulation (Antonioli et al., 2013). 4T1 and MMT cells isolated from 3D
using individual RNAi probes was used, leading to reduced in- invasion culture expressed ADORA1 and ADORA2b mRNA but
vasive strand initiation and elongation (Fig. 3, h and i). Neither no other ADO or ADP receptor (Fig. S4 b). We thus tested
pharmacological nor RNAi with GJIC altered cell–cell cohesion or whether ADORA1 or ADORA2b mediate collective invasion using
Khalil et al. Journal of Cell Biology 4 of 18
Connexin-43–mediated collective invasion https://doi.org/10.1083/jcb.201911120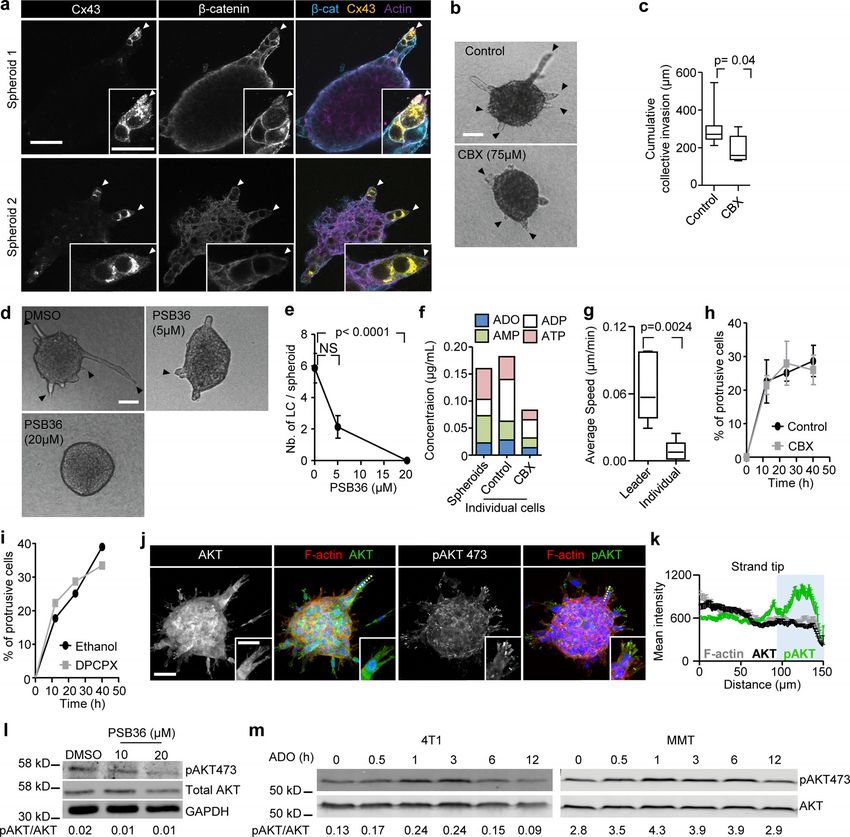
Downloaded from http://rupress.org/jcb/article-pdf/219/10/e201911120/1048361/jcb_201911120.pdf by guest on 16 November 2020

Figure 2. Cx43 mediates GJIC and extracellular release of nucleotides/nucleosides during collective invasion. (a) Workflow of time-resolved 3D gap
FRAP, including calcein labeling of multicellular spheroids in 3D collagen cultures and 3D gap-FRAP procedure of leader and follower cells within a 3D invasion
strand by asymmetric region of interest selection and photobleaching, followed by recording the change in fluorescence intensity over time. (b) Single confocal
slices of calcein-labeled invasive 4T1 strands before and after photobleaching. Dashed contours represent the bleached leader cell (LC; red), FC (blue), and SC
(purple) in control media and LC in the presence of CBX (white). (c) Normalized calcein fluorescence intensity in bleached LCs, FCs, and SCs in the presence or
absence of CBX. Values represent normalized mean fluorescence intensities with SEM; 11–16 cells per treatment condition from four independent experiments.
(d) Effect of CBX on percentage fluorescence recovery after photobleaching of LCs and FCs. Values are represented as the means and SEM of three inde-
pendent experiments. P values, two-tailed unpaired Mann–Whitney test. (e) Average fluorescence recovery in cells stably expressing control vector (shNT) or
Cx43 shRNA (shCx43) during invasion in 3D collagen. Values represent the normalized mean intensities and SEM of four leader cells for shNT and pooled two
leader cells and two follower cells for shCx43 condition. (f) Inhibition of fluorescence recovery of MMT cells after Cx43 down-regulation (cell groups in Petri
dish culture). Normalized mean intensity and SEM of 19–22 cells from three independent experiments. P value, two-tailed unpaired Mann–Whitney test.
(g and h) Parachute assay to measure de novo junction formation (g) followed by dye transfer into nonlabeled cells (h) and example histograms obtained by

Khalil et al.                                                                                                                          Journal of Cell Biology    5 of 18
Connexin-43–mediated collective invasion                                                                                https://doi.org/10.1083/jcb.201911120
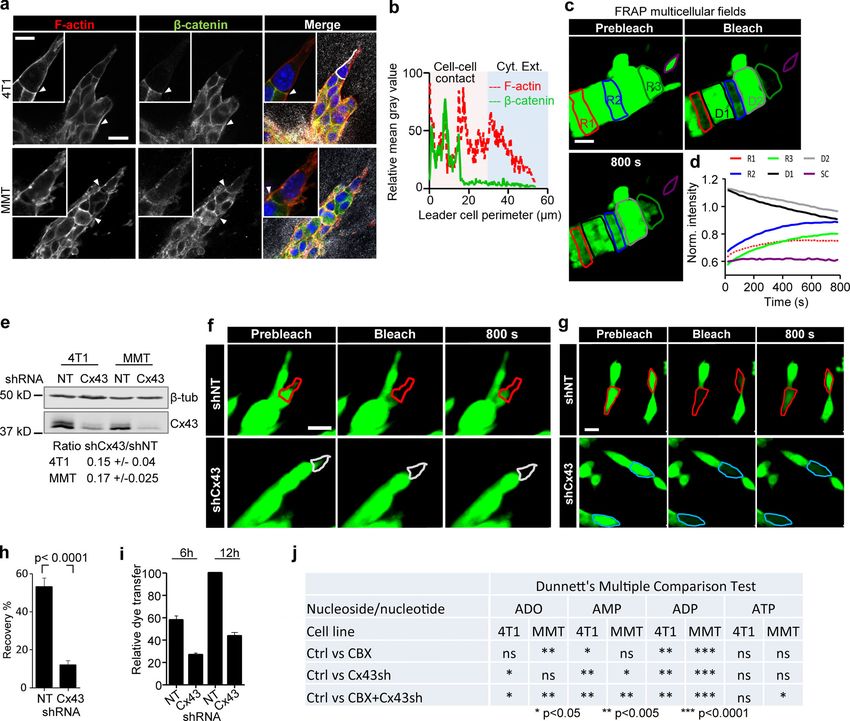
flow cytometry showing the time-dependent alterations of calcein label in donor and recipient cells. (i) Intensity of calcein in 4T1 receiver cells after 12 h of
incubation with 4T1 donor cells in control conditions and during inhibition with CBX or after Cx43 down-regulation. Median (red line) intensities from four
independent experiments. P values, Kruskal-Wallis test with Dunn’s multiple comparison test. (j and k) HPLC analysis of purines released from 4T1 and MMT
spheroids into the supernatant after 24 h of invasion in 3D collagen. Values represent average concentrations of each purine (j) and the relative change of the
total purine concentrations after treatment with CBX and/or Cx43 down-regulation in 4T1 and MMT cells (k). Mean values and SEM from four (j) or SD from
three (k) independent experiments. P values, ANOVA Dunnett’s multiple comparison test. Scale bar: 20 µm (b). Neg ctrl, negative control; Norm., normalized;
FC, follower cell; LC, leader cell; SC, single detached cell.

pharmacological interference. PSB36 and 8-cyclopentyl-1,3-di-                     hemichannel–ADORA loop does not support cell protrusion of
propylxanthine (DPCPX), both selective ADORA1 antagonists                         individual breast cancer cells.
with established activity in vitro and in vivo (Abo-Salem et al.,
2004; Töpfer et al., 2008), caused dose-dependent inhibition of                  AKT phosphorylation in Cx/ADORA-mediated invasion
collective invasion in 4T1 and MMT cells (Fig. 5, a–c; Fig. S4 c;                 In 2D sheet migration of nontransformed epithelial cells, leader
and Fig. S4 d). PSB36 did not affect the mitotic frequency of the                 cell function depends on phosphoinositide 3-kinase and AKT
cells (Fig. S4 e). Unlike ADORA1, interference with ADORA2b                       signaling (Yamaguchi et al., 2015). Since AKT activation is a

                                                                                                                                                                         Downloaded from http://rupress.org/jcb/article-pdf/219/10/e201911120/1048361/jcb_201911120.pdf by guest on 16 November 2020
using the antagonist PSB1115 showed no effect on the emergence                    major event downstream of ADO signaling via ADORA1 (Park
of leader cells of 4T1 and MMT cells (Fig. S4 f).                                 et al., 2010; Umapathy et al., 2013), we investigated the in-
    PSB36 abolished the effects of exogenous ADO on rescuing                      volvement of AKT in Cx/ADORA1-mediated invasion. In 3D in-
collective invasion (Fig. 5, d and e) and prevented leader cells to               vasion culture, the active form of AKT (AKT-pSer473) was
develop pointed anterior protrusions (Video 6). As a conse-                       abundant near the protrusion tips of leaders, but not in follower
quence of leader cell collapse, invasion strands retracted, and                   cells (Fig. 6 a; and Fig. S5, j and k). The focal AKT-Ser473 in-
this was reversible after washout of the inhibitor (Video 6).                     tensity in leader cells was reduced after addition of CBX (Fig. 6,
Thus, leader cell function in collective invasion critically de-                  a–d). Likewise, PSB36 reduced AKT-pSer473 levels (Fig. S5 l),
pends on ADO signaling and ADORA1.                                                whereas AKT-pSer473 levels increased within 1 h of ADO addi-
    ADORA1 localization during collective invasion in vitro was                   tion (Fig. S5 m), in line with previous reports showing time-
predominantly cytosolic, and its expression levels were not af-                   dependent regulation of AKT phosphorylation in response to
fected by CBX treatment (Fig. S4, g and h). The localization of                   purinergic signaling (Jacques-Silva et al., 2004). To determine
ADORA1 is in line with previously reported cytosolic distribu-                    whether AKT activation is required for invasion, we treated 4T1
tion of ADORA1 and other chemokine receptors (G-protein–                          and MMT 3D invasion cultures with the AKT inhibitor IV. The
coupled receptors) such as in nerve terminals and gastric cancer                  emergence of leader cells and strand formation in both 4T1 and
tissues (Iwasa et al., 2009; Rebola et al., 2003).                                MMT spheroids were reduced by >84%, compared with the
    To address whether Cx43/ADORA1 regulates collective                           DMSO controls (Fig. 6, e and f). These data suggest that the
movement of nontumorigenic cells, we embedded spheroids of                        hemichannel/ADO loop regulates collective invasion by acti-
the normal mammary cell line NMuMG (Nemir et al., 2000) in                        vating AKT in leader cells.
3D collagen. Normal Mus muculus mammary gland (NMuMG)
cells are deficient in both junctional expression of Cxs (including               ADORA1 in breast cancer invasion and progression in vivo
Cx43) and GJIC (Sheng et al., 2007). Consistent with defective                    To address whether ADORA1 signaling supports collective breast
GJIC, Cx43 was enriched in the cytosols of NMuMG leader cells                     cancer cell invasion in vivo, multicellular tumoroids were im-
guiding collective invasion strands (Fig. S5 a, arrowheads).                      planted into the mammary fat pad and the effect of systemic
Treatment with the channel blocker CBX or ADORA1 inhibitor                        administration of PSB36 on progressing invasion was monitored
PSB36 reduced invasion of NMuMG (Fig. S5, b–e), suggesting                        by intravital multiphoton microscopy through a body window
that Cx43 hemichannels and extracellular ADO signaling rather                     for 4 d (Ilina et al., 2018). Untreated tumors invaded into the
than GJIC support collective movement. Thus, the autocrine                        mammary fat pad via collective strands with elongated leading
nucleotide loop is not restricted to cancer cells but may repre-                  tip cells (Fig. 7 a, arrowheads), as described previously (Ilina
sent a general collective steering mechanism.                                     et al., 2018). PSB36 inhibited the extent of invasion with fewer
    We next tested whether single-cell invasion is also regulated                 strands with tips and reduced strand length (Fig. 7 a, arrow-
by Cx hemichannels and ADORA1. 4T1 cells were individualized                      heads; and Fig. 7 b). PSB36 did not affect tumor growth, as as-
and embedded in 3D collagen and their movement followed by                        sessed by the number of nuclei per spheroid (Fig. 7 c), and this
cell tracking over a time course of 40 h. Although individual cells               resulted in more compact tumors with increased packing den-
maintained the release of nucleotides and nucleosides into the                    sity of cells. These data establish ADORA1 in promoting collec-
culture supernatant (Fig. S5 f), only 20–30% of individualized                    tive breast cancer cell invasion in vivo.
4T1 cells developed elongated morphology, and single cells only                       In tumor lesions in vivo, extracellular ADO levels are elevated
migrated on the spot with an average speed of 0.009 µm/min,                       to micromolar ranges (Blay et al., 1997; Kumar, 2013), and
which is at least six times below the average speed of collectively               ADORA1 mRNA and protein expression were reported to be
invading 4T1 cells (0.06 µm/min; Fig. S5 g). Treatment with the                   increased in whole-tissue lysates of primary tumors compared
pan-Cx inhibitor CBX or the ADORA1 inhibitor PSB36 did not                        with normal tissue (Khoo et al., 1996; Mirza et al., 2005). To
affect the number of protrusive cells (Fig. S5, h and i). Thus, the               verify that ADORA1 was also present in the invasion zone of

Khalil et al.                                                                                                                           Journal of Cell Biology     6 of 18
Connexin-43–mediated collective invasion                                                                                 https://doi.org/10.1083/jcb.201911120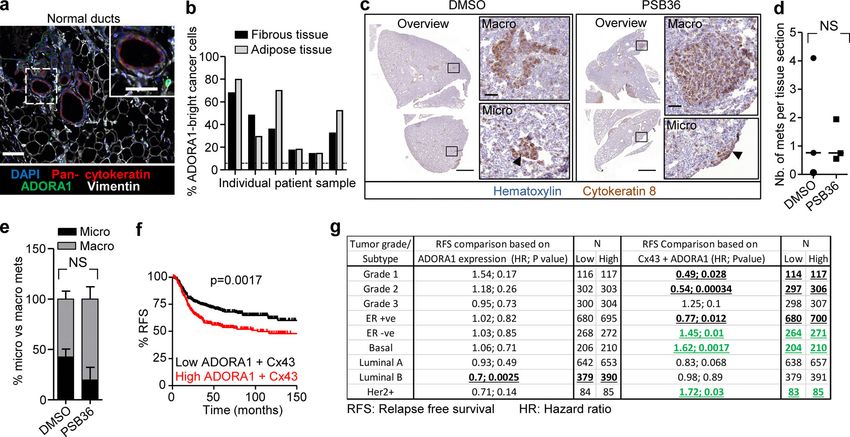
Downloaded from http://rupress.org/jcb/article-pdf/219/10/e201911120/1048361/jcb_201911120.pdf by guest on 16 November 2020
Figure 3. Cx43 dependence of leader cell function. (a) Bright-field images of 4T1 spheroids after 24 h of invasion in 3D collagen in the presence of in-
creasing concentration of CBX. Arrowheads, tips of invasion strands. (b) Mean cumulative length of collective invasion strands in response to CBX. Mean values
and SEM from three independent experiments each comprising seven spheroids/condition. P values, Kruskal–Wallis test with Dunn’s multiple comparison test.
(c) Maximum intensity projection from a confocal 3D stack, showing F-actin and DAPI in control and CBX-treated spheroids (100 µM). (d–g) Cx43-dependent
collective invasion. Bright-field images (d), cumulative collective invasion (e and f), and leader cell initiation (g) of spheroids composed of 4T1 or MMT cells
stably expressing Cx43 or nontargeting shRNA (NT). Values represent the medians (black line), 25th/75th percentiles (box) and maximum/minimum (whiskers)
from three or four independent experiments with three to eight spheroids each. P values, two-tailed unpaired Mann–Whitney test. (h) Bright-field images of
4T1 spheroids in response to transient Cx43 down-regulation using two different Cx43 RNAi probes. (i) Number of leader cells (LCs) per spheroid. P values,
Kruskal–Wallis test with Dunn’s multiple comparison test. (j) Maximum intensity projection from a confocal 3D stack showing mosaic spheroids composed of
fluorescence-coded MMT cells stably expressing NT or Cx43 shRNA as indicated (1:1 ratio); arrowheads depict red or green leader cells. (k) Frequency of green
or red leader cells. Bars represent the mean values and SEM pooled from one (j1) and three (j2) independent experiments. (l) Effect of CBX on the kinetics of
established invasion strands. Mean length per invasion strand after addition of CBX at 0 h (intervention) and washout at 24 h (rescue). Data show the mean
values and SEM from six to eight invasion strands from one spheroid per condition. Scale bars: 100 µm (a), 50 µm (c, d, and h), 25 µm (c, inset). LC, leader cell.

ductal breast cancer, clinical samples were stained for ADORA1,                   eight samples) with increased levels and heterogeneity com-
and the collective invasion patterns located in the fibrous and                   pared with the luminal epithelial cells of normal ducts (Fig. 7, d
adipose tissues were analyzed by multispectral microscopy                         and e; and Fig. S6 a). In ADORA1-positive samples, 14–68% of the
(Fig. 7 d). Multicellular strands and nests containing cytokeratin-               cancer cells within the invasion patterns were ADORA1 bright
positive epithelial cancer cells expressed ADORA1 (in six out of                  (Fig. S6 b) with a predominant cytosolic distribution, consistent

Khalil et al.                                                                                                                            Journal of Cell Biology     7 of 18
Connexin-43–mediated collective invasion                                                                                  https://doi.org/10.1083/jcb.201911120
Downloaded from http://rupress.org/jcb/article-pdf/219/10/e201911120/1048361/jcb_201911120.pdf by guest on 16 November 2020
Figure 4. Cx43 hemichannel function in leader cell induction by purine nucleotide release. (a–c) Rescue of invasion in 4T1 and MMT spheroids in 3D
collagen in the presence of CBX and escalating doses of ADO; for comparison with untreated baseline levels refer to Figs. 3 b and S3 (c and e). Representative
bright-field images (a), cumulative collective invasion (b), and number of leader cells (LC) per spheroid (c). Mean values and SEM from four independent
experiments, each comprising 5–11 spheroids/condition. P values, Kruskal–Wallis test with Dunn’s multiple comparison test. (d and e) Rescue of leader cell
deficiency after Cx43 down-regulation by exogenous ADO. (d) Maximum intensity projection from a 3D confocal stack showing mosaic spheroids with
MMT cells stably expressing NT or Cx43 shRNA (1:1 ratio) in the absence or presence of ADO and (e) frequency of LC with green color expressing Cx43 shRNA.
Bars represent the means and SEM from three independent experiments, each comprising three to six spheroids. P values, two-tailed unpaired Mann–Whitney
test. Scale bars: 50 µm (a), 100 µm (d).

with the ADORA1 distribution detected in 3D invasion culture                    provides a cell-autonomous mechanism sustaining collective
in vitro.                                                                       invasion in breast cancer and may deliver a rational basis for
   We finally tested whether inhibition of ADORA1 also reduces                  targeted intervention using hemichannel and ADORA inhibitors.
spontaneous metastasis to the lungs. 4T1 cells were implanted                       The data indicate a previously unappreciated role for nucle-
into the mammary fat pad, and the mice were treated daily with                  otide release via Cx43 hemichannels and autocrine ADO sig-
DMSO or PSB36. PSB36 therapy had no effect on the number or                     naling in inducing leader cells that guide collective invasion of
size of metastases to the lungs 30–36 d after tumor implantation                breast cancer cells. The concept of hemichannel-mediated nu-
(Fig. S6, c–e). Thus, although PSB36 inhibited local invasion                   cleotide release in our study is supported by (1) focal Cx43 lo-
in vivo, it had no effect on spontaneous metastasis in the 4T1                  calization at cytoplasmic extensions of leader cells and lateral
model. ADORA1 expression was inversely correlated with RFS                      sites of follower cells, (2) dependence of extracellular nucleotide
in ER-negative patients with high Cx43 expression, but not                      levels in 3D tumor spheroid culture on Cx43 channel function,
ADORA1 alone (Fig. S6, f and g). This indicates that Cx43/                      (3) the decreased probability of cells with low Cx43 expression
ADORA1 expression correlates with poor outcome in ER-                           to reach leader cell position, (4) the rapid loss of leader cell ac-
negative cancer, including the basal subtype.                                   tivity after Cx channel inhibition or antagonization of ADORA1,
                                                                                and (5) reversion of invasion inhibition by CBX or Cx43 down-
                                                                                regulation by exogenous ADO addition. These data strongly
Discussion                                                                      suggest Cx43 hemichannel-mediated nucleotide release as major
We here identify an autocrine mechanism of leader cell activa-                  pathway to collective invasion.
tion and maintenance through Cx43 hemichannels, which re-                           The release of nucleotides by Cx hemichannels reveals a
lease nucleotides that induce AKT activation in leader cells and                tumor-cell–autonomous, autocrine mechanism of induction and
collective invasion of breast cancer cells via a signaling cascade              continuation of collective invasion. Hemichannel/purinergic
involving ADORA1. ADORA1 drives local invasion and dissemi-                     signaling loops are known to regulate polarized protrusions of
nation from implanted tumors in mice, and ER-negative breast                    microglial cells during response to brain injury (Davalos et al.,
cancer patients with high Cx43/ADORA1 expression suffer                         2005) and single-cell migration of neutrophils during chemo-
from worsened prognosis. Autocrine nucleotide signaling thus                    taxis (Wang et al., 2017). In contrast to microglia and

Khalil et al.                                                                                                                         Journal of Cell Biology    8 of 18
Connexin-43–mediated collective invasion                                                                               https://doi.org/10.1083/jcb.201911120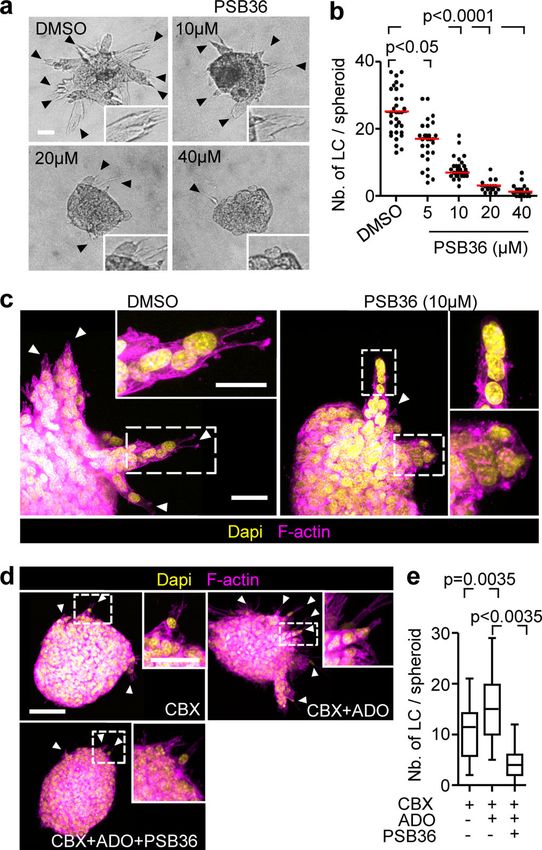
as ECM contact and paracrine factors. As example, cadherin-
                                                                                  dependent mechanocoupling promotes front–rear asymmetry
                                                                                  by directing protrusion orientation and ECM binding toward
                                                                                  the cell-free edge (Khalil and de Rooij, 2019; Mayor and
                                                                                  Carmona-Fontaine, 2010; Plutoni et al., 2016). Thus, to induce
                                                                                  leader cell activity and collective invasion, purinergic signaling
                                                                                  may cooperate with the cell–cell junction machinery.
                                                                                     Our data further indicate that Cx43 hemichannel activity is
                                                                                  essential but GJIC is dispensable for leader cell function and
                                                                                  collective invasion. Whether, beyond the short-term effects
                                                                                  detected here, GJIC contributes to mid- and long-term sustain-
                                                                                  ability of collective invasion remains to be addressed. By al-
                                                                                  lowing cytoplasmic continuity between invading cells, Cx43
                                                                                  intercellular- and hemichannels may act in series and contribute
                                                                                  to ADO delivery and availability to the invasion front for release

                                                                                                                                                                 Downloaded from http://rupress.org/jcb/article-pdf/219/10/e201911120/1048361/jcb_201911120.pdf by guest on 16 November 2020
                                                                                  into the extracellular space.
                                                                                     In the extracellular space, ATP and ADP are degraded into
                                                                                  ADO by ectonucleotidases, including CD39 and CD73 (de Andrade
                                                                                  Mello et al., 2017), and ADO levels in the high-micromolar range
                                                                                  are present in the tumor microenvironment (Blay et al., 1997);
                                                                                  therefore ADO released in 3D invasion cultures and in vivo acts
                                                                                  as both, metabolite and signaling effector of cancer progression
                                                                                  (Antonioli et al., 2013). The ADO levels released by 4T1 and
                                                                                  MMT cells during in vitro culture were one to five orders lower
                                                                                  than ADO levels detected in the extracellular space of the tumor
                                                                                  microenvironment (10–100 µM; Vaupel and Mayer, 2016; Vaupel
                                                                                  and Multhoff, 2016). It is difficult to compare ADO levels present
                                                                                  in the tumor tissue to the levels detected in spheroid invasion
                                                                                  culture. Extracellular ADO in intact tissues is contributed by
                                                                                  both tumor and stromal cells (de Lourdes Mora-Garcı́a et al.,
                                                                                  2016) over long periods of time. The resulting steady-state level
                                                                                  of ADO reached in vivo may thus be higher compared with levels
                                                                                  reached in invasion cultures over 24 h, with cancer cells as the
Figure 5. Autocrine purinergic receptor signaling maintains leader cell           sole source of ADO. Leader cell induction by auto- or paracrine
functions. (a) Bright-field images of 4T1 spheroids cultured in 3D collagen for   nucleotides depends on downstream signaling function through
24 h in the presence of escalating concentrations of PSB36. (b) Median            ADORAs to induce polarized cell–substrate interaction, and
numbers of leader cells (LC) per spheroid (red line) from three independent       this is shared with nucleotide activity inducing single-cell
experiments. P values, Kruskal–Wallis test with Dunn’s multiple comparison
                                                                                  migration in other contexts. AKT signaling, which is induced
test. (c) Maximum intensity projection from a 3D confocal stack of 4T1
spheroid in the presence or absence of PSB36. Arrowheads, leading ex-             by G-protein–coupled receptors (ADORA1, ADORA2a, ADORA2b,
tensions of individual LCs. (d) Maximum intensity projections of 3D MMT           and ADORA3), mediates polarization of moving cells down-
spheroids with different treatments and (e) resulting number of leader cells      stream of ADORA signaling (Chen et al., 2006; Gao et al., 2001;
per spheroid. Data represent the medians (black line), 25th/75th percentiles      Othman et al., 2003; Stagg et al., 2010; Umapathy et al., 2013;
(boxes) and maximum/minimum values (whiskers) from two independent
                                                                                  Wen et al., 2011). Active AKT was increased in leader, but not
experiments each comprising 10 to 16 spheroids/condition. P values, ANOVA
with Bonferroni multiple comparison test. Scale bars: 50 µm (a and d), 20 µm      follower, cells and required both Cx channel and ADORA1
(c), 25 µm (d, inset), 10 µm (c, inset).                                          function. In single-cell migration, individualized keratino-
                                                                                  cyte migration along electrical gradient depends on the Cx/
                                                                                  G-protein–coupled receptor axis (Riding and Pullar, 2015). In
leukocytes, the autocrine nucleotide loop was not sufficient to                   brain-damage responses, astrocyte processes protrude in a Cx-
induce polarization and migration of individualized breast                        ADORA–dependent manner to interact and close the micro-
cancer cells. Several parameters may account for this differ-                     defect (Davalos et al., 2005; Riding and Pullar, 2015). Although
ential hemichannel function in epithelial contexts. Collective,                   both ADORA1 and ADORA2b are expressed, only ADORA1 me-
but not individual-cell, polarity is reinforced by cell–cell junc-                diated ADO-dependent invasion of 4T1 and MMT cells. Possi-
tions, including cadherins and Cxs, and receptor–ligand inter-                    bly, the reported 70-fold higher affinity of ADO to ADORA1
cellular interactions, such as notch/delta and ephrin/Eph                         (Fredholm et al., 2001) accounts for its dominance in leader cell
signaling (Friedl and Mayor, 2017). Intercellular junctions and                   activation. However, in difference to ADORA-stimulated single-
interactions mediate mechanical and biochemical trans-                            cell migration, autocrine stimulation of tip cells favors their
ductions between cells that enhance promigratory signals such                     engagement toward ECM while remaining coupled to follower

Khalil et al.                                                                                                                     Journal of Cell Biology   9 of 18
Connexin-43–mediated collective invasion                                                                           https://doi.org/10.1083/jcb.201911120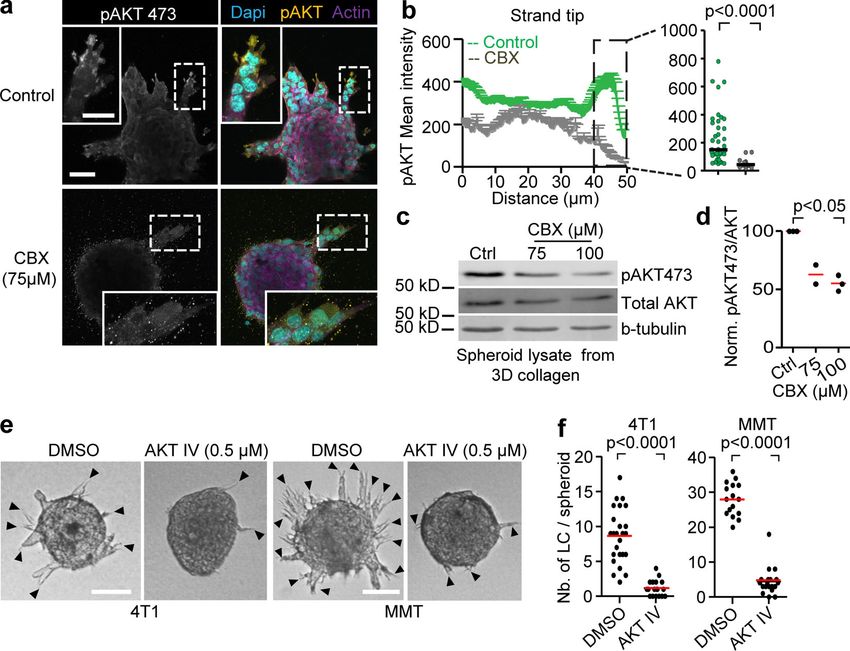
Downloaded from http://rupress.org/jcb/article-pdf/219/10/e201911120/1048361/jcb_201911120.pdf by guest on 16 November 2020
Figure 6. AKT regulation and requirement for leader cell function and invasion. (a) Maximum intensity projection of phospho-AKT473 and F-actin
staining in MMT spheroids treated with vehicle control or CBX. Maximum intensity projection of 3D confocal stack. (b) Distribution of phospho-AKT473 along
protrusions of leader cells in both conditions with dot plot comparing phospho-AKT473 levels in the last 10 µm of leader cell protrusions in vehicle- and CBX-
treated condition. Line graphs and dot plot represent intensities of phospho-AKT473 from 11 (control) or 21 (CBX) leader cells from three or four spheroids per
respective condition. P values, two-tailed unpaired Mann–Whitney test. (c) Western blot for phospho-AKT473, AKT and β-tubulin as loading control. Whole-
cell lysates extracted from MMT spheroids after 24 h of invasion into 3D collagen in the presence of 0, 75, and 100 µM of CBX. (d) Values represent normalized
intensities of phospho-AKT473/total AKT with median values (red line) from two (75 µM) or three independent experiments (0 and 100 µM). P value,
Kruskal–Wallis test with Dunn’s multiple comparison test. (e) Bright-field images of 4T1 and MMT spheroids embedded in 3D collagen for 15 h in the presence
of DMSO or AKT inhibitor IV. (f) Number of leader cells (LC) per spheroid; red line represents the median value from 18 to 25 spheroids (4T1) and 16–19
spheroids (MMT) pooled from two independent experiments. P values, two-tailed unpaired Mann–Whitney test. Scale bars: 50 µm (a), 25 µm (a, inset), 100 µm (e).

cells, thus mediating the maintenance and elongation of col-                     enhancing invasion, hemichannels and ADORAs also contribute
lective invasion strands.                                                        to tumor growth and immunomodulation (Schalper et al., 2014)
   While ADORA1 function was clearly involved in local tissue                    and orchestrate an integrated program to enhance local cancer
invasion, and collective invasion in breast carcinoma samples is                 progression. Purinergic signaling thus establishes a proinvasive
positively associated with clinical progression to metastasis                    microenvironment through multipronged mechanisms, render-
(Khalil et al., 2017), spontaneous metastasis to the lungs was not               ing pharmacological interference of nucleotide signaling through
affected by pharmacological ADORA1 antagonization. The 4T1                       the Cx/ADORA axis in patient subsets as an attractive route to
in vivo model resulted in 100% penetrance of spontaneous micro-                  reprogram the tumor stroma and neoplastic invasion.
and macrometastases, and the used dosing of PSB36 inhibited in-
vasion in mammary fat pads, suggesting that the drug is efficient
in vivo. The lack of inhibition of metastases may indicate that                  Materials and methods
leader cell function maintained by ADORA1 is of lower relevance in               Antibodies and reagents
secondary organ colonization and metastatic outgrowth. A similar                 The following antibodies were used: rabbit anti-human Cx43
disconnect between local invasion and metastatic ability in distant              (3512; CST), chicken anti-human vimentin (ab24525; Abcam),
organs was recently shown after deletion of E-cadherin, which                    mouse anti-mouse β-catenin (clone 14/β-Catenin; BD Bio-
caused increased local invasion in breast cancer models but                      sciences), rabbit anti-mouse AKT (9272; CST), mouse anti-
strongly compromised metastatic ability due to a survival defect                 human AKT (2920; CST); rabbit anti-human phospho-AKT
(Padmanaban et al., 2019). Interfering with ADORA1 pathways                      Ser473 (4060; CST); mouse anti-human Pan Keratin (4545;
may thus be justified to limit locally invasive disease, which cannot            CST); rabbit anti-rat ADORA1 (ab82477; Abcam); rabbit anti-
be effectively treated by surgery (Bakst et al., 2019). Beyond                   human ADORA1 (ab124780; Abcam); and secondary polyclonal

Khalil et al.                                                                                                                          Journal of Cell Biology    10 of 18
Connexin-43–mediated collective invasion                                                                                https://doi.org/10.1083/jcb.201911120
Downloaded from http://rupress.org/jcb/article-pdf/219/10/e201911120/1048361/jcb_201911120.pdf by guest on 16 November 2020
Figure 7. Pharmacological interference with ADORA1 inhibits collective invasion in vivo. (a) Invasion of 4T1 dual-color cells (H2B/mCherry; LifeAct/YFP)
from microtumors implanted into the mouse mammary fat pad and imaged by multiphoton microscopy through a mammary window at days 0, 2, and 4 after
implantation. Mice were treated with DMSO (vehicle) or 30 mg/kg PSB36 via intraperitoneal injection. Arrowhead, tip of collective invasion strand.
(b and c) Analysis of invasion as the average area covered by the lesion normalized to the number of nuclei (b) and the tumor growth expressed as number of
cells per lesion (c). Data in b and c represent the medians (black line), 25th/75th percentiles (boxes), and maximum/minimum values (whiskers) from at least
nine implanted tumors from four independent experiments. P values, two-tailed unpaired Mann–Whitney test. (d) Detection of ADORA1 in fibrous or adipose
tissue invasion zones of breast cancer samples using multispectral microscopy. (e) Relative ADORA1 levels in epithelial cancer cells quantified from eight
independent lesions (see Table 1 for sample characteristics). Dotted line represents the threshold level for ADORA1 negativity, determined by ROC analysis
with intensity values obtained from the luminal epithelial cells as control. Scale bars: 100 µm (a and d), 50 µm (a and d, inset).

Alexa Fluor 488/647–conjugated goat anti-mouse, anti-rabbit,                   Aldrich); and the ADORA2b selective antagonist 4-(2,3,6,7-tetra-
or anti-chicken antibody. For F-actin visualization, Alexa Fluor               hydro-2, 6-dioxo-1-propyl-1H-purin-8-yl)-benzenesulfonic acid
568–conjugated phalloidin (Invitrogen) was used. ADO (A4036;                   (PSB1115; Tocris; Lin et al., 2010). CBX was dissolved in water
Sigma-Aldrich) was dissolved in water at a concentration of 1 mg/              (stock concentration: 163 mM); all other inhibitors and antagonists
ml and stored in aliquots at −20°C. The following inhibitors were              were dissolved in DMSO (stock concentration 100–200 mM). All
used: gap junction channel inhibitors CBX disodium salt, 18aGA,                drugs were aliquoted (5–20 µl) and stored at −20°C.
and its inactive homologue, GLZ (Sigma-Aldrich; Kenny et al.,
2002; Marins et al., 2009); the ADORA1 selective and competi-                  Cell lines and culture
tive antagonists 1-butyl-3-(3-hydroxypropyl)-8-(3-noradamantyl)                The following metastatic breast cancer cell lines were used: 4T1
xanthine (PSB36) and 8-cyclopentyl-1,3-dipropylxanthine (Sigma-                (CRL-2539 ATCC); MMT wild-type and MMT dual-color cells

Khalil et al.                                                                                                                       Journal of Cell Biology    11 of 18
Connexin-43–mediated collective invasion                                                                             https://doi.org/10.1083/jcb.201911120
(H2b-GFP and cytosolic RFP; Tsuji et al., 2006; a generous gift        (J-051694-05 and J-051694-06) were used at a final concentra-
from R. Hoffman, AntiCancer Inc., San Diego, CA); and NMuMG            tion of 50 nM using Dharmafect transfection reagent 4 (Thermo
cells (a generous gift from M. Vooijs, Maastricht University           Fisher Scientific). After 12 h, RNAi containing supernatant was
Medical Center, Netherlands; Owens et al., 1974). The identity of      removed and replaced by penicillin/streptomycin free media.
4T1, MMT and NMuMG cells was verified by short tandem re-              After a recovery period of at least 6 h, cells were used for
peat DNA profiling (IDEXX BioResearch). No mammalian in-               spheroid generation. For assessment of knockdown efficiency,
terspecies contamination was detected. Cells were routinely            whole-cell lysates were analyzed after 24, 48, and 72 h after
tested for mycoplasma contamination (MycoAlert; Lonza). All            removal of siRNA by Western blot.
cell lines were negative for mycoplasma contamination. Cells
were maintained (37°C, 5% CO2, humidified atmosphere) in               Resazurin cytotoxicity assay
RPMI media (Invitrogen) supplemented with 10% fetal bovine             Mitochondrial activity was assessed by resazurin labeling
serum (Sigma-Aldrich), penicillin (100 U/ml) and streptomycin          (Czekanska, 2011). 4T1 and MMT spheroids embedded in 3D
(100 µg/ml; both PAA), and L-glutamine (2 mM; Invitrogen).             collagen were incubated with resazurin-containing media (100
For generation of 4T1 and MMT cells with stable Cx43 RNA               µg/ml) for 4h (at 37°C, 5% CO2, humidified atmosphere). Gels were
down-regulation, mission lentiviral vector targeting mouse GJA1        gently washed with PBS, and cell-bound fluorescence was mea-

                                                                                                                                                     Downloaded from http://rupress.org/jcb/article-pdf/219/10/e201911120/1048361/jcb_201911120.pdf by guest on 16 November 2020
(TRCN0000068473, sequence: 59-CCGGCCCACCTTTGTGTCTTC                    sured (excitation/emission 560/590 nm) using an ELISA reader.
CATACTCGAGTATGGAAGACACAAAGGTGGGTTTTTG-39) and
nontargeting control sequence (59-CCGGCAACAAGATGAAGA                   Real-time quantitative PCR
GCACCAACTCGAGTTGGTGCTCTTCATCTTGTTGTTTTT-39)                            Collagen gels containing spheroids were dissolved with Trizol
was used (Sigma-Aldrich). For tumor implantation into the              (250 µl/100 µl gel; Invitrogen) and homogenized before chlo-
mammary fat pad in vivo, a stable 4T1/H2B-mCherry/LifeAct-             roform (Merck) phase separation (Farhat, 2012). After centrif-
GFP cells were used, as described previously (Ilina et al., 2018).     ugation (15 min, 12 × 103 g, 4°C), the upper phase was mixed with
Fluorescence-expressing cells did not deviate from the wild-type       70% vol/vol ethanol and transferred to an RNeasy MinElute spin
counterparts in parameters such as growth and invasion (data           column for RNA extraction according to the manufacturer’s
not shown).                                                            instructions (Qiagen’s RNeasy kit). After RNA quality control,
                                                                       reverse transcription (SuperScript II Reverse transcription;
Cancer spheroid and single-cell culture                                Thermo Fisher Scientific) was performed. Primers for Cxs and
Spheroids from 4T1, MMT, and NMuMG cells used in short-term            purinergic receptors (Table S1) were designed using Homo-
in vitro migration assays were generated using the hanging drop        loGene (http://www.ncbi.nlm.nih.gov) and validated in silico
method (Venhuizen et al., 2019). In brief, cells from subcon-          using Oligoanalyzer software and in vitro using positive controls
fluent culture were detached with EDTA (1 mM) and trypsin              (RNA isolated from mouse tissues including brain and heart).
(0.075%; Invitrogen), washed in PBS, suspended in medium/              Quantitative PCR was performed using CFX96 Real-Time PCR
methylcellulose (2.4%; Sigma), and maintained as hanging droplets      Detection System with C1000 Thermocycler (Bio-Rad) and ana-
(25 µl), each containing 1,000 cells. Hanging drops were kept in       lyzed using the Bio-Rad CFX Manager software (version 2.0). RNA
37°C, 5% CO2 humidified atmosphere for 24 h (Del Duca et al.,          levels for the genes of interest were normalized to the pooled
2004). Spheroids were harvested and placed into DMEM media             levels of three housekeeping genes (β-actin, GAPDH, and ΥWhaz).
without FCS and without penicillin/streptomycin in a six-well plate.
   After cell aggregation, spheroids were washed in PBS and            Western blot analysis
incorporated into 3D type I collagen lattices consisting of non-       Cells from 2D culture were lysed using SDS sample buffer
pepsinized rat-tail collagen (BD Biosciences) at a final concen-       (62.5 mM Tris-HCl, 2% SDS, 10% glycerol, 50 mM DTT, and
tration of 4 or 6 mg/ml for 4T1 or MMT cells (Ilina et al., 2018).     bromophenol blue). Collagen gels containing spheroids were
In brief, spheroids were washed in complete medium, mixed              digested by highly purified type VII collagenase (C0773; Sigma-
with collagen solution, and prevented from sinking during col-         Aldrich), followed by whole-cell lyses using SDS buffer. Western
lagen polymerization (37°C, 5% CO2) by rotation of the sample.         blotting was performed by SDS-PAGE. Briefly, whole-cell lysates
Only spheroids invading into the 3D phase of the collagen matrix       were loaded and separated on a 10% acrylamide gel with Tris-
were analyzed, whereas spheroids moving as 2D sheets under-            glycine running buffer followed by blotting to polyvinylidene
neath or on top of the culture were excluded.                          difluoride membrane by wet transfer. Polyvinylidene difluoride
   For single-cell invasion, cells from subconfluent culture were      membranes were blotted with monoclonal mouse anti-β-tubulin
detached with EDTA (2 mM), washed and embedded in 3D                   (E7; Department of Cell Biology, Radboud University Medical
nonpepsinized rat-tail collagen (4 mg/ml; BD Biosciences) at a         Center, Nijmegen, Netherlands) as loading control, anti-Cx43
density of 20,000 cells/100 μl collagen.                               (dilution 1:1,000), anti-AKT (1:1,000), and anti-phospho-AKT
                                                                       Ser473 (1:500) followed by fluorescence detection (Odyssey;
Transient down-regulation of Cx43 by RNAi                              LI-COR Biosciences) and densitometric analysis.
4T1 and MMT cells were seeded in a 12-well plate at a density of
60 × 103/well, in the presence of siRNA duplex (Dharmacon,             HPLC analysis for purine content in media
Thermo Fisher Scientific). ON-Target plus nontargeting siRNA           Supernatants from 3D single-cell or spheroid cultures (24 h)
(D-001810-10) and two Cx43-specific targeting sequences                were used for purine analysis. Media contained 80°C heated

Khalil et al.                                                                                                         Journal of Cell Biology   12 of 18
Connexin-43–mediated collective invasion                                                               https://doi.org/10.1083/jcb.201911120
FCS, which minimizes the degradation of nucleotides and nu- antigens, gels were washed with PBS, permeabilized using
cleosides (Gendaszewska-Darmach et al., 2003). ADO, AMP, 5–10% normal goat serum, 0.3% Triton X-100 or 0.2% Saponin in
ADP, and ATP levels were determined by HPLC using a modified PBS (1 h, 20°C), incubated with antibody in PBS containing 0.1%
method from Bhatt et al. (2012). In brief, culture supernatant BSA, 0.3% Triton X-100, or 0.2% Saponin. Antibody dilutions
(1 ml) was mixed with chloroacetaldehyde (250 µl; 6x diluted in were as follows: Cx43 (1:50), AKT (1:50), S473 pAKT (1:50),
1 M acetate buffer, pH 4.5; Sigma-Aldrich), followed by deriva- β-Catenin (1:200), ZO-1 (1:100), and vimentin (1:200). Primary
tization (60 min, 70°C, 500 rpm) using Thermomixer comfort antibody was incubated at 4°C with shaking overnight, followed
(Eppendorf AG) and centrifugation (3 min, RT, 12,100 × g). For by at least five washing steps of 15 min each with PBS. Samples
HPLC, supernatant (400 µl) was transferred to a HPLC vial and were then incubated with secondary antibody (1:400) in PBS
injected. Purines were separated by HPLC (1200 Series; Agilent buffer for intracellular staining, together with DAPI (5 µg/ml)
Technologies) using a Polariz C18-A column (150 × 4.6 mm) with and phalloidin (1:200; 4 h, RT), washed at least five times (15 min
a gradient elution using eluent A (0.1 M K2HPO4, 10 mM tetra- each) and imaged by confocal microscopy (Olympus FV1000;
butylammonium hydrogen sulfate, pH 6.5, and 2% MeOH) and long working distance objectives 20×/NA 0.50, 40×/NA 0.80, or
eluent B (H2O/ACN/THF 50:49:1). Retention times were 6.5 60×/NA 1.35). Subcellular localization and quantification of
(ADO), 7.7 (AMP), 11.8 (ADP), 15.6 (ATP), and 15.0 min (cAMP). Cx43, β-catenin, AKT, and pAKT at cell–cell contacts and cyto-
Downloaded from http://rupress.org/jcb/article-pdf/219/10/e201911120/1048361/jcb_201911120.pdf by guest on 16 November 2020
Quantification was based on peak areas of the samples, and plasmic extensions were determined by manually outlining
reference standards were measured with fluorescence detection F-actin–positive regions followed by background correction us-
(excitation, 280 nm; emission, 420 nm). ing ImageJ.
For time-lapse confocal microscopy, 3D spheroid cultures
Bright-field microscopy consisting of MMT dual-color cells or 4T1/H2B-mCherry within
Single or collective invasion was detected by digital time-lapse 3D collagen were imaged (37°C, 5% CO2, humidified atmos-
bright-field microscopy, as described previously (Wolf et al., phere). Time-lapse confocal microscopy (20×/NA 0.5 air objec-
2013). In brief, single cells or 3D spheroid cultures were main- tive, LSM 510 system; Carl Zeiss) was performed with time
tained at 37°C and images were taken with 5-min intervals for intervals of 10–15 min for 24 h with usually four to seven z-scans
up to 72 h. For pharmacological intervention, spheroids were comprising all of the strands per spheroid (∼100 µm in depth).
allowed to migrate for 24 h, followed by addition of inhibitor or The confocal slices were reconstructed as maximum intensity
vehicle (solvent) for 24 h and washout using 1 ml of growth projection and image analysis, including leader cell tracking,
media and follow-up for additional 24 h. Single cells and leader was performed using ImageJ. The minimum and maximum pixel
cells were tracked using the manual tracking plugin from ImageJ intensity values of different samples were equally adjusted per
(1.40v; National Institutes of Health). The number, length, and experiment using the color balance tool of ImageJ.
elongation speed of invading single cells or strands were quan-
tified using ImageJ. For endpoint experiments, bright-field mi- Gap FRAP
crographs of spheroid cultures in 3D collagen after 15, 24, and Cancer cells grown as monolayers on glass-bottom dishes or as
48 h of incubation were recorded using a CCD camera (Sentech), multicellular spheroids in 3D collagen were labeled with calcein-
10x/0.20 NA air objective (Leica) and frame grabber system AM (2–3 µM, 30 min) using a modified method described pre-
(Vistek). The number of pointed and protrusive tips (leader viously (Kuzma-Kuzniarska et al., 2014). Regions of interest
cells) per spheroid was counted manually; length of invad- were defined for single cells or small regions and bleaching was
ing strands were quantified using the image analysis software performed using 100% Argon laser output 1 mW with 200
ImageJ. iterations using a large pinhole (∼8 airy units) and 20-s interval
at 37°C, 5% CO2 and humidified atmosphere. For 12 min of
Parachute assay and FACS analysis follow-up, calcein transfer between cells seeded on 2D cover-
Receiver 4T1 cells (150 × 103 cells/well) were incubated for 24 h glass or within collagen gels was monitored using confocal mi-
(37°C, 5% CO2 humidified atmosphere) in 48-well plates to reach croscopy (LSM 510; 20×/NA 0.5 air; Carl Zeiss; 37°C, 5% CO2).
95–100% confluency. Donor 4T1 cells were loaded with calcein- Inhibition of GJIC was achieved using CBX (100 µM) at least
AM (1 µM; Life Technologies) for 30 min, washed, and incubated 45 min before gap FRAP imaging. Time-resolved bleaching and
for a further 45 min (Abbaci et al., 2008). Calcein-labeled postbleaching recovery was quantified using ImageJ as the mean
cells were detached with EDTA (1 mM) and trypsin (0.075%), fluorescence intensity. For normalizing fluorescence after pho-
centrifuged (251 g, 5 min), resuspended in media, and 75 × 103 tobleaching, cells in nonbleached control regions were coregis-
cells/well were added over the receiver cell culture at a ratio of tered and the signal used for background correction. Detached
1:2 (donor/receiver) and co-cultured (3, 6, or 12 h). For analysis single cells were used as an internal negative control for GJIC-
of dye transfer, cells were detached with EDTA (1 mM) and dependent fluorescence recovery.
trypsin (0.075%), assayed by flow cytometry (FACS Caliber), and
analyzed using FCS Express software. Breast cancer tissue section immunofluorescence
For multispectral imaging of Cx43 and ADORA1, tissue sections
Immunofluorescence staining and confocal microscopy with positive invasion margin were selected from 19 breast
3D spheroid samples were fixed with 4% paraformaldehyde at cancer patients (Table 1). The use of coded tumor tissue was
room temperature (RT) for 15 min. For detection of intracellular approved by the institutional review board, according to
Khalil et al. Journal of Cell Biology 13 of 18
Connexin-43–mediated collective invasion https://doi.org/10.1083/jcb.201911120You can also read