Future changes in isoprene-epoxydiol-derived secondary organic aerosol (IEPOX SOA) under the Shared Socioeconomic Pathways: the importance of ...
←
→
Page content transcription
If your browser does not render page correctly, please read the page content below
Atmos. Chem. Phys., 21, 3395–3425, 2021
https://doi.org/10.5194/acp-21-3395-2021
© Author(s) 2021. This work is distributed under
the Creative Commons Attribution 4.0 License.

Future changes in isoprene-epoxydiol-derived secondary organic
aerosol (IEPOX SOA) under the Shared Socioeconomic Pathways:
the importance of physicochemical dependency
Duseong S. Jo1,2,3 , Alma Hodzic3 , Louisa K. Emmons3 , Simone Tilmes3 , Rebecca H. Schwantes3,a,b , Michael J. Mills3 ,
Pedro Campuzano-Jost1,2 , Weiwei Hu1,2,c , Rahul A. Zaveri4 , Richard C. Easter4 , Balwinder Singh4 , Zheng Lu5 ,
Christiane Schulz6,7 , Johannes Schneider6 , John E. Shilling4 , Armin Wisthaler8,9 , and Jose L. Jimenez1,2
1 Cooperative   Institute for Research in Environmental Sciences (CIRES), University of Colorado, Boulder, CO, USA
2 Department    of Chemistry, University of Colorado, Boulder, CO, USA
3 Atmospheric Chemistry Observations and Modeling Laboratory,

National Center for Atmospheric Research, Boulder, CO, USA
4 Atmospheric Sciences and Global Change Division, Pacific Northwest National Laboratory, Richland, WA, USA
5 Department of Atmospheric Sciences, Texas A&M University, College Station, Texas
6 Particle Chemistry Department, Max Planck Institute for Chemistry, Mainz, Germany
7 Leibniz Institute for Tropospheric Research, Leipzig, Germany
8 Department of Chemistry, University of Oslo, Oslo, Norway
9 Institute for Ion Physics and Applied Physics, University of Innsbruck, Innsbruck, Austria
a now at: Cooperative Institute for Research in Environmental Sciences, University of Colorado, Boulder, CO, USA
b now at: Chemical Sciences Laboratory, National Oceanic and Atmospheric Administration, Boulder, CO, USA
c now at: State Key Laboratory of Organic Geochemistry, Guangzhou Institute of Geochemistry,

Chinese Academy of Sciences, Guangzhou, China

Correspondence: Duseong S. Jo (duseong.jo@colorado.edu)

Received: 3 June 2020 – Discussion started: 3 July 2020
Revised: 19 December 2020 – Accepted: 21 January 2021 – Published: 5 March 2021

Abstract. Secondary organic aerosol (SOA) is a dominant          compare the predictions with the empirical parameterization
contributor of fine particulate matter in the atmosphere, but    based on the volatility basis set (VBS) approach. We then use
the complexity of SOA formation chemistry hinders the ac-        the Community Earth System Model 2 (CESM2.1.0) with
curate representation of SOA in models. Volatility-based         detailed isoprene chemistry and reactive uptake processes for
SOA parameterizations have been adopted in many recent           the middle and end of the 21st century under four Shared So-
chemistry modeling studies and have shown a reasonable           cioeconomic Pathways (SSPs): SSP1–2.6, SSP2–4.5, SSP3–
performance compared to observations. However, assump-           7.0, and SSP5–8.5. With the explicit chemical mechanism,
tions made in these empirical parameterizations can lead to      we find that IEPOX SOA is predicted to increase on aver-
substantial errors when applied to future climatic conditions    age under all future SSP scenarios but with some variabil-
as they do not include the mechanistic understanding of pro-     ity in the results depending on regions and the scenario cho-
cesses but are rather fitted to laboratory studies of SOA for-   sen. Isoprene emissions are the main driver of IEPOX SOA
mation. This is particularly the case for SOA derived from       changes in the future climate, but the IEPOX SOA yield from
isoprene epoxydiols (IEPOX SOA), for which we have a             isoprene emissions also changes by up to 50 % depending on
higher level of understanding of the fundamental processes       the SSP scenario, in particular due to different sulfur emis-
than is currently parameterized in most models. We predict       sions. We conduct sensitivity simulations with and without
future SOA concentrations using an explicit mechanism and        CO2 inhibition of isoprene emissions that is highly uncer-

Published by Copernicus Publications on behalf of the European Geosciences Union.
3396                              D. S. Jo et al.: Future changes in isoprene-epoxydiol-derived secondary organic aerosol

tain, which results in factor of 2 differences in the predicted   changes, and they can provide different performance in pre-
IEPOX SOA global burden, especially for the high-CO2 sce-         dicting future SOA concentrations, as discussed below.
narios (SSP3–7.0 and SSP5–8.5). Aerosol pH also plays a              In order to obtain realistic predictions of future SOA
critical role in the IEPOX SOA formation rate, requiring ac-      changes, all the variables affecting SOA concentrations
curate calculation of aerosol pH in chemistry models. On the      should be considered. However, parameterizations inevitably
other hand, isoprene SOA calculated with the VBS scheme           omit some important processes; for example, the two-product
predicts a nearly constant SOA yield from isoprene emis-          or VBS approaches conventionally used in chemical trans-
sions across all SSP scenarios; as a result, it mostly follows    port models do not consider acid-catalyzed multiphase chem-
isoprene emissions regardless of region and scenario. This is     istry (Marais et al., 2016; Zhang et al., 2018a) and autoxida-
because the VBS scheme does not consider heterogeneous            tion (Bianchi et al., 2019; Schervish and Donahue, 2020).
chemistry; in other words, there is no dependency on aerosol      Based on recent laboratory and theoretical studies, which
properties. The discrepancy between the explicit mechanism        provide a nearly complete gas-phase oxidation mechanism
and VBS parameterization in this study is likely to occur for     for isoprene and its major products (Wennberg et al., 2018,
other SOA components as well, which may also have de-             and references therein), SOA models have started to em-
pendencies that cannot be captured by VBS parameteriza-           ploy explicit chemistry rather than relying on parameteri-
tions. This study highlights the need for more explicit chem-     zation schemes, especially for isoprene SOA. As a result,
istry or for parameterizations that capture the dependence on     state-of-the-art chemical transport models have started to use
key physicochemical drivers when predicting SOA concen-           a hybrid approach to simulate SOA by using both parame-
trations for climate studies.                                     terizations and explicit chemistry, including heterogeneous
                                                                  reactions (Pye et al., 2013; Marais et al., 2016; Jo et al.,
                                                                  2019; Shrivastava et al., 2019; Zare et al., 2019; Hodzic et
                                                                  al., 2020).
1   Introduction                                                     When it comes to climate modeling studies, generally sim-
                                                                  plified SOA parameterizations have been used (e.g., Sporre
Secondary organic aerosol (SOA) contributes substantial           et al., 2019). In the fifth phase of the Coupled Model In-
mass fractions of submicron particle concentrations globally      tercomparison Project (CMIP5), most models used a con-
(Zhang et al., 2007), but it is difficult to predict due to its   stant SOA yield without performing the oxidation of volatile
complex sources and behavior in the atmosphere (Tsigaridis        organic compounds (VOCs) and gas-to-particle partitioning
et al., 2014). There are typically many thousands of organic      calculations (Tsigaridis and Kanakidou, 2018). Climate stud-
species and reactions involved depending on the precursor         ies focusing on SOA employed more detailed schemes with
hydrocarbon (Lannuque et al., 2018), which necessitates the       initial oxidation of VOCs and dynamic gas-to-particle parti-
use of parameterizations in chemistry–climate SOA simula-         tioning such as the two-product scheme (Heald et al., 2008;
tions. Over the last 2 decades, there has been much progress      Liao et al., 2009; Wu et al., 2012; Cholakian et al., 2019b)
in understanding the chemistry of SOA (Ziemann and Atkin-         and the VBS scheme (Megaritis et al., 2013; Pommier et al.,
son, 2012; Glasius and Goldstein, 2016; Shrivastava et al.,       2018; Zhang et al., 2018b). Recent studies used even more
2017; Bianchi et al., 2019), which has helped chemical trans-     detailed processes such as SOA formation from highly oxy-
port models to develop more advanced SOA parameteriza-            genated molecules (Zhu et al., 2019) and heterogeneous re-
tions (Hodzic et al., 2016; Tsimpidi et al., 2018; Schervish      actions (Lin et al., 2016).
and Donahue, 2020).                                                  A few previous studies examined the effects of differ-
   Parameterizations range from simplified empirical meth-        ent SOA schemes on future SOA prediction. Cholakian et
ods (Hodzic and Jimenez, 2011) to volatility basis set (VBS)      al. (2019a) showed that the complex VBS scheme shows a
approaches of various complexity (Donahue et al., 2006,           higher relative change in biogenic SOA between future and
2012), which can calculate not only mass concentrations but       historical simulations than the two-product scheme. On the
also oxidation states (Tsimpidi et al., 2018). A recent evalu-    other hand, Day and Pandis (2015) reported that the inclusion
ation of global OA schemes reported that a simple parame-         of the volatility of primary particles and chemical aging pro-
terization showed similar performance compared to explicit        cesses in the VBS scheme does not increase its sensitivity to
chemistry and a complex parameterization scheme in terms          climate change. However, these studies only compared dif-
of bias and variability (Pai et al., 2020). This can be ex-       ferent volatility-based parameterizations, not including ex-
plained by the fact that simple parameterizations are based       plicit chemistry. As pointed out by Jo et al. (2019), the SIM-
on observational constraints from field campaigns (Hodzic         PLE and VBS parameterizations in GEOS-Chem cannot cap-
and Jimenez, 2011; Kim et al., 2015). However, even though        ture the response to changes in NOx and SO2 emissions pre-
two different SOA schemes simulated similar SOA con-              dicted by the explicit chemistry. This is critical because these
centrations in present-day atmospheric conditions, they can       emissions are expected to be substantially different in fu-
have different responses to not only preindustrial conditions     ture climate and emissions scenarios (Feng et al., 2020). Lin
(Tilmes et al., 2019) but also future emissions and climate       et al. (2016) used the hybrid approach to simulate global

Atmos. Chem. Phys., 21, 3395–3425, 2021                                             https://doi.org/10.5194/acp-21-3395-2021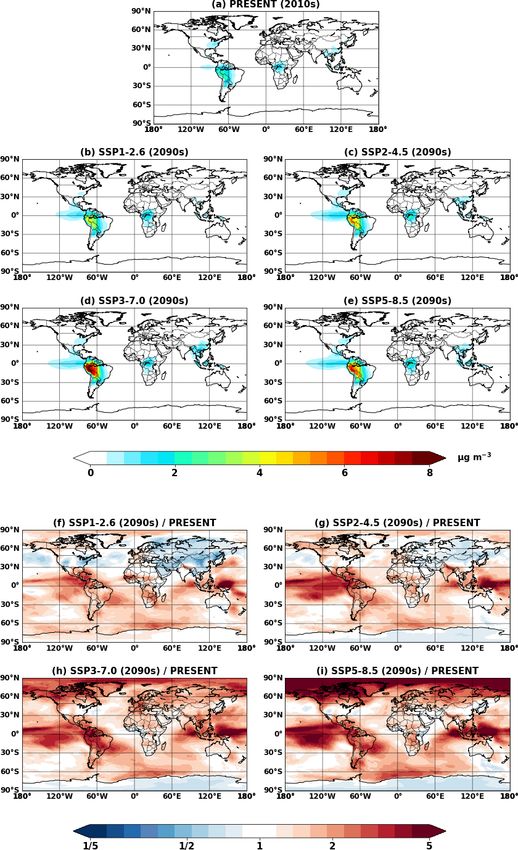
D. S. Jo et al.: Future changes in isoprene-epoxydiol-derived secondary organic aerosol                                    3397

SOA using both parameterizations and explicit chemistry.           istry representation (CAM6-chem) was used, with a hor-
In their sensitivity simulation, they investigated the effects     izontal resolution of 0.95◦ in latitude by 1.25◦ in longi-
of aerosol acidity on present-day and future SOA concen-           tude and 32 vertical layers up to 1 hPa (40 km) (Emmons
trations by comparing two cases using the constant and the         et al., 2020). Simulations were conducted for 10 years to
pH-dependent reactive uptake coefficient of isoprene epoxy-        construct multiyear-averaged chemical fields under present
diols (IEPOXs), and they concluded that the global average         (2005–2014) and future (2045–2054 and 2091–2100) atmo-
SOA production rate changes very little. This result is con-       spheric conditions; the first 2 years were not included in
trary to the results by Marais et al. (2017), who concluded        the analysis (used for spin-up). Atmospheric (CAM6-chem)
that isoprene SOA mass yields per unit of isoprene oxidized        and land (Community Land Model version 5; CLM5) mod-
decreased from 13 % in 1991 to 3.5 % in 2013 over the south-       els were fully coupled online. We constrained sea surface
eastern US. This could be because Lin et al. (2016) investi-       temperatures and sea ice conditions from observations for
gated aerosol pH effects only, while keeping other conditions      present runs and from the Whole Atmosphere Community
the same (e.g., HO2 / NO oxidation channel and aerosol sur-        Climate Model version 6 (WACCM6) results for future runs.
face area), whereas all the conditions were changed in Marais      The WACCM6 results used in this study were those of the
et al. (2017). Furthermore, Lin et al. (2016) calculated the       CMIP phase 6 (Gettelman et al., 2019).
effects of acidity on total SOA, but most SOA components              For present-day conditions, anthropogenic emissions are
were not affected by the acidity change except for IEPOX           from the Community Emissions Data System (CEDS)
SOA. Stadtler et al. (2018) also investigated the IEPOX SOA        (Hoesly et al., 2018), and biomass burning emissions are
sensitivity to variable aerosol pH compared to fixed pH and        from the inventory developed for CMIP6 (van Marle et al.,
found 58 % differences between the two cases.                      2017). The SSPs were used for future climatic scenarios
   In this study, we investigate the future SOA change as pre-     (Riahi et al., 2017). We selected all four Tier 1 scenarios
dicted by the Community Earth System Model version 2.1.0           – SSP5–8.5, SSP3–7.0, SSP2–4.5, and SSP1–2.6 (O’Neill
(CESM2.1.0) using explicit IEPOX SOA chemistry and com-            et al., 2016; Gidden et al., 2019). A detailed description of
pare it with the SOA predictions by the VBS parameteriza-          each SSP scenario is briefly summarized in Table S1 (nar-
tion recently implemented in the model (Tilmes et al., 2019).      rative, forcing category, population, regulation, and emis-
We focus on IEPOX SOA as we have a relatively higher               sion amount) and Fig. S1 (emission trajectories for SO2
mechanistic understanding of the IEPOX SOA formation               and NOx ). Biogenic emissions were calculated online within
compared to other SOA species, and IEPOX SOA contributes           CLM5 using the Model of Emissions of Gases and Aerosols
a substantial mass fraction of SOA, especially under low-NO        from Nature (MEGAN) version 2.1 (Guenther et al., 2012).
conditions (Hu et al., 2015). The CESM includes several up-        To address isoprene emission uncertainties related to CO2
dates such as an adjustment of isoprene emissions, detailed        inhibition effects, we conducted two types of simulations
isoprene chemistry, NOx -dependent yields of the VBS, and          with and without CO2 inhibition effects (see Sect 2.2.3 for
the heterogeneous uptake of IEPOX. We evaluate the sim-            details). Aerosol simulations were based on the four-mode
ulated IEPOX SOA against aircraft campaign and surface             version of the Modal Aerosol Module (MAM4) (Liu et al.,
network measurements. We then predict future IEPOX SOA             2016), with substantial changes to the treatments of inorganic
concentration changes for the middle and end of the 21st cen-      and secondary organic aerosol species. Two very different
tury under four Shared Socioeconomic Pathways (SSPs) –             treatments of secondary organic aerosol are used: an explicit
SSP1–2.6, SSP2–4.5, SSP3–7.0, and SSP5–8.5 (O’Neill et             treatment of IEPOX SOA (Sect. 2.2.2) and a modified ver-
al., 2016; Riahi et al., 2017). We also conduct sensitivity sim-   sion of the Tilmes et al. (2019) five-bin VBS SOA mecha-
ulations to examine the effects of CO2 inhibition on isoprene      nism (Sect. 2.2.4). Dynamic partitioning of H2 SO4 , HNO3 ,
change and IEPOX SOA budget, as well as the effects of             HCl, and NH3 to each mode and the related particle-phase
aerosol pH on IEPOX SOA formation. Finally, we compare             thermodynamics are calculated using the Model for Simulat-
the explicit scheme and the VBS parameterization to inves-         ing Aerosol Interactions and Chemistry (MOSAIC) aerosol
tigate the differences between the two schemes in predicting       module (Zaveri et al., 2008, 2021; Lu et al., 2021).
future SOA concentrations.                                            For the model evaluation in Sect. 3, we used a speci-
                                                                   fied dynamics option (FCSD compset) to reduce uncertain-
                                                                   ties related to dynamic simulations in the atmospheric model
2     Model description                                            (CAM6). The meteorological fields (temperature, wind, and
                                                                   surface fluxes) were nudged towards the Modern-Era Ret-
2.1    General                                                     rospective analysis for Research and Applications version 2
                                                                   (MERRA2) (Gelaro et al., 2017) with a relaxation time of
We used CESM2.1.0 to simulate present and future climatic          50 h.
conditions (Danabasoglu et al., 2020). For the atmospheric
configuration, the Community Atmosphere Model version 6
with comprehensive tropospheric and stratospheric chem-

https://doi.org/10.5194/acp-21-3395-2021                                           Atmos. Chem. Phys., 21, 3395–3425, 2021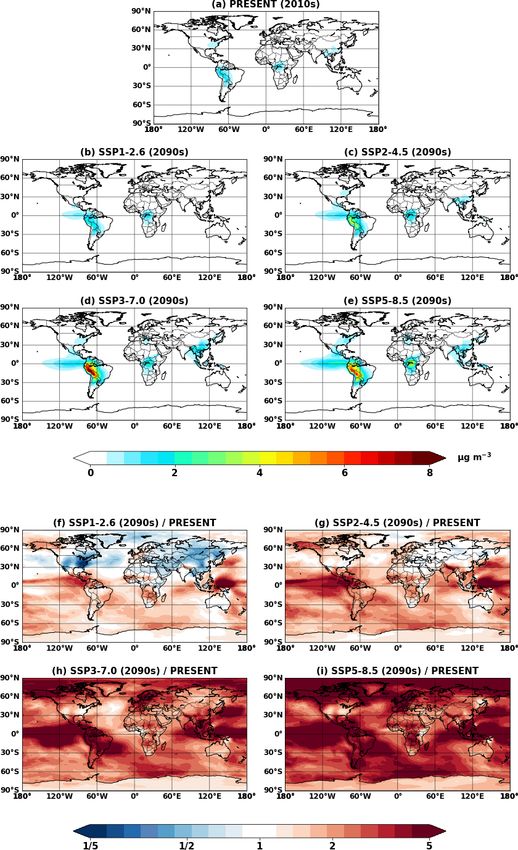
3398                              D. S. Jo et al.: Future changes in isoprene-epoxydiol-derived secondary organic aerosol

2.2     Model updates                                             ilar nitrate levels compared to the observed nitrate aerosol
                                                                  concentrations over the US and East Asia (Lu et al., 2021),
2.2.1    Gas-phase chemistry of isoprene                          but additional studies will be needed to evaluate the nitrate
                                                                  simulation in other regions.
Because the isoprene SOA yield strongly depends on the               The effects of organic coatings have often been neglected
gas-phase chemistry, we used the MOZART-TS2 (Model                in previous studies using the explicit chemistry for IEPOX
of Ozone And Related chemical Tracers, Troposphere–               SOA (Lin et al., 2016; Marais et al., 2016; Budisulistiorini et
Stratosphere V2) detailed isoprene chemical mechanism re-         al., 2017; Stadtler et al., 2018; Shrivastava et al., 2019), al-
cently developed by Schwantes et al. (2020). The MOZART-          though it can reduce the IEPOX SOA formation rate by up to
TS2 chemical mechanism includes more comprehensive and            ∼ 30 % (Zhang et al., 2018a; Schmedding et al., 2019). We
updated isoprene and terpene chemistry, but for computa-          considered the organic coating effect by assuming an inor-
tional efficiency, we only implemented the new isoprene           ganic core and organic shell mixture, as described in detail
chemistry. The updates for isoprene chemistry added 39 new        in Jo et al. (2019).
compounds and 139 reactions on top of the MOZART-TS1                 The SOA yield of IEPOX reactive uptake was assumed
chemistry (Emmons et al., 2020) and included updates to           to be 100 %, and IEPOX SOA was treated as non-volatile
isoprene hydroxy hydroperoxide (ISOPOOH) and IEPOX                in the model. This is consistent with other previous model-
chemistry relevant to this work. These updates were applied       ing (Marais et al., 2016; Budisulistiorini et al., 2017; Stadtler
to all simulations in this work.                                  et al., 2018; Schmedding et al., 2019) based on field stud-
                                                                  ies showing that ambient IEPOX SOA has very low volatil-
2.2.2    Heterogenous IEPOX reactive uptake                       ity (Hu et al., 2016; Lopez-Hilfiker et al., 2016; Riva et
                                                                  al., 2019). A recent chamber-based study by D’Ambro et
We implemented the heterogeneous uptake of IEPOX based            al. (2019) confirmed the low volatility of IEPOX SOA and
on the work by Jo et al. (2019). We used the resistor model       suggested that the semi-volatile products (2-methyltetrols,
equation (Anttila et al., 2006; Gaston et al., 2014b) to calcu-   C5-alkene triols, and 3-MeTHF-3,4-diols) measured by some
late the reactive uptake coefficient of IEPOX (γIEPOX ). The      techniques in ambient IEPOX SOA mostly resulted from
equation needs several parameters such as Henry’s law con-        thermal decomposition in those methods. On the other hand,
stant and diffusion coefficients of IEPOX in the aqueous core     they reported that the semi-volatile 2-methyltetrols that are
and in the organic layer; all input parameter values and equa-    also formed can evaporate after IEPOX reactive uptake and
tions are available in Supplement Sect. S1 of Jo et al. (2019).   can be lost to gas-phase reactions with OH and dry–wet de-
In addition to IEPOX SOA, other SOAs were simulated using         position, resulting in an IEPOX SOA yield lower than unity.
the VBS scheme as described in Sect. 2.2.4.                       However, the evaporation is completed within 1 h and is thus
   Aerosol pH was calculated online for each mode by the          not inconsistent with the very low-volatility characteristics
MOSAIC module (Zaveri et al., 2008), as implemented in            of ambient IEPOX SOA. The observed volatility of ambi-
CESM by Zaveri et al. (2021) and Lu et al. (2021). In addi-       ent IEPOX SOA can be explained by the low volatility of
tion, we modified MOSAIC to calculate submicron (Aitken           organosulfates and oxidation products, which comprise more
and accumulation modes) aerosol pH without sea salt fol-          than half of the IEPOX SOA tracers (Cui et al., 2018; Chen
lowing Jo et al. (2019) based on previous studies showing         et al., 2020). D’Ambro et al. (2019) also pointed out that the
that sea salt aerosols were dominantly externally mixed with      measured γIEPOX is an order of magnitude or more higher
submicron sulfate–nitrate–ammonium rather than internally         than often used in models. We conducted sensitivity tests to
mixed (Guo et al., 2016; Bondy et al., 2018; Murphy et al.,       investigate the effect of these uncertain parameters on model
2019). We note that sea salt was calculated in the model          results in Sect. 3.
but excluded only for pH calculation. Removing sea salt re-          In addition to determining volatility, the formation of
sulted in substantially lower pH (more acidic aerosol) over       organosulfates is also important in terms of aerosol pH and
the ocean and better agreement with the observationally con-      its effect on the IEPOX SOA formation rate. Substantial
strained pH values by Nault et al. (2021). The effects of         amounts of inorganic sulfate can be converted to organosul-
sea salt on global aerosol pH and IEPOX SOA formation             fates, especially in regions with a high ratio of IEPOX to
are discussed in Sect. 4.2. It is worth noting that the submi-    inorganic sulfate concentration (Riva et al., 2019). Riva et
cron aerosol nitrate burden predicted by MAM4-MOSAIC is           al. (2019) showed that up to 90 % of inorganic sulfate was
about 50 % of MAM7-MOSAIC (Lu et al., 2021; Zaveri et             converted to organosulfates under laboratory conditions that
al., 2021) due to the different treatments of submicron sea       mimicked the Amazon. As a result, the aerosol became less
salt and dust between MAM7 (Liu et al., 2012) and MAM4            acidic and reduced the reactive uptake of IEPOX (Zhang et
(Liu et al., 2016), while the supermicron aerosol nitrate bur-    al., 2019). A sensitivity simulation was carried out to esti-
dens are close. Nitrate aerosol affects pH and in turn IEPOX      mate the changes in IEPOX SOA concentrations due to con-
SOA formation, and pH also strongly affects nitrate aerosol       version of inorganic sulfate to organosulfate (Sect. 3). In
formation. MAM4-MOSAIC has been found to predict sim-             this sensitivity run, we assumed 90 % conversion as an up-

Atmos. Chem. Phys., 21, 3395–3425, 2021                                             https://doi.org/10.5194/acp-21-3395-2021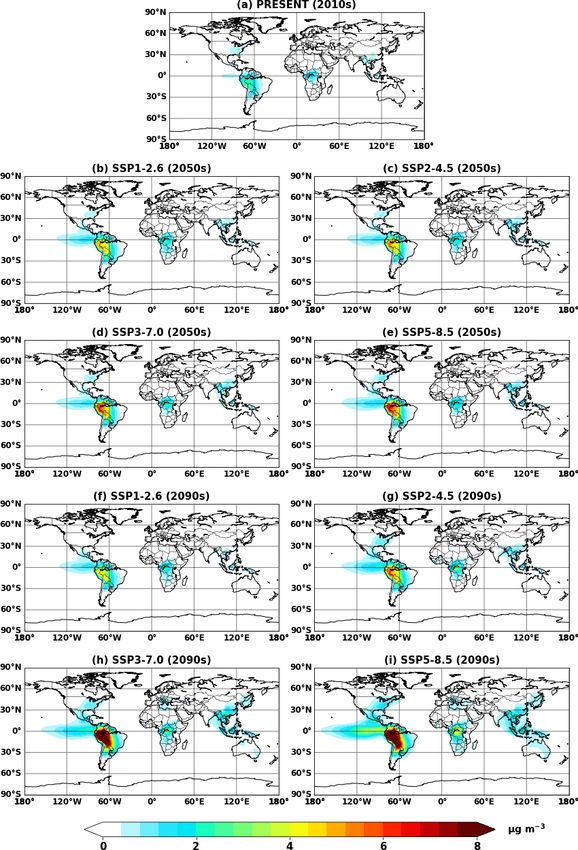
D. S. Jo et al.: Future changes in isoprene-epoxydiol-derived secondary organic aerosol                                      3399

per limit in the atmosphere. Because thermodynamic models          et al., 2014). On the other hand, aircraft flux measure-
used in 3D chemistry models (e.g., ISORROPIA; Fountoukis           ments have suggested that MEGAN v2.0 and v2.1 underesti-
and Nenes, 2007) do not take into account organics (e.g., all      mated isoprene emissions over the Amazon (v2.0 in Karl et
models participated in the recent AeroCom phase III; Bian et       al., 2007, and v2.1 in Gu et al., 2017). Sarkar et al. (2020)
al., 2017), we assumed that organics have a negligible effect      showed that the same MEGAN algorithm with different in-
on aerosol pH. Therefore, aerosol pH changes were solely           puts can both overestimate and underestimate the observed
calculated by the loss of inorganic sulfates. There are also       isoprene emission fluxes at a tower site over the Amazon;
high uncertainties in acid dissociation constant (pKa ) values     i.e., MEGAN v2.1 using emissions factors based on the plant
for IEPOX-derived organosulfates, which makes it difficult         functional type (PFT) overestimated the observed isoprene
to include organosulfates in the thermodynamic calculation         flux, whereas MEGAN v2.1 with the 1 km emission factor
(Zhang et al., 2019) and requires further study.                   distribution map underestimated the flux.
   Once IEPOX SOA is formed, there is no further oxida-               In order to calculate the isoprene emissions as realisti-
tion in the model, as in previous studies (Marais et al., 2016;    cally as possible, especially for the tropics, we used two
Budisulistiorini et al., 2017; Schmedding et al., 2019). How-      constraints. First, we compared the simulated global iso-
ever, measurement studies have observed further heteroge-          prene emissions by CESM2.1.0–MEGANv2.1 (PFT-based
neous OH oxidation of 3-methyltetrol sulfate ester (Lam et         emission factors, MODIS-based leaf area index – LAI) with
al., 2019), 2-methyltetrol sulfates (Chen et al., 2020), and       isoprene top-down estimates using HCHO from the Ozone
IEPOX SOA by positive matrix factorization (PMF) (Hu et            Monitoring Instrument (OMI) (Bauwens et al., 2016). As dis-
al., 2016). Aged IEPOX SOA can be lost to the gas phase            cussed above, the model overestimated isoprene emissions,
via volatilization if fragmentation is dominant (Hu et al.,        especially for the tropics (Sect. S1 and Figs. S2 and S3 in
2016; Lam et al., 2019) or transformed to highly oxidized          the Supplement). Second, we evaluated the modeled isoprene
molecules if functionalization is more favorable (Chen et          concentrations against aircraft measurements over the Ama-
al., 2020). Reaction rate constants with OH were similar           zon, which also suggested an overestimation (see Sect. 3.2
among these studies: 2.0–5.5 × 10⁻¹³ cm3 molec.−1 s−1 in-          for details). To reduce discrepancies found in both of these
cluding error ranges (Hu et al., 2016; Lam et al., 2019; Chen      comparisons, we reduced isoprene emission factors for trop-
et al., 2020). We used 4.0 × 10⁻¹³ cm3 molec.−1 s−1 , which        ical PFTs (broadleaf evergreen tropical trees and broadleaf
is based on the best guess of Hu et al. (2016), because the        deciduous tropical trees) by a factor of 2. The resulting iso-
model simulates bulk IEPOX SOA. The sensitivity results of         prene emissions were comparable to OMI-based isoprene
heterogeneous OH oxidation are also discussed in Sect. 3.          emission estimates in terms of the annual global total value,
                                                                   although there were still some regional differences (Figs. S2
2.2.3   Isoprene emission adjustment                               and S3). For example, the base model overestimated OMI-
                                                                   based isoprene emissions over the Amazon by a factor of
Isoprene emission changes are one of the main driving fac-         3–4. Because satellite-based top-down emissions also have
tors of IEPOX SOA change in the future climate (Sect. 5).          uncertainties in the inversion process (e.g., a priori source
MEGAN v2.1 has been considered the most reliable biogenic          uncertainty) and the aircraft comparison of ambient isoprene
emission algorithm and is used in many chemistry mod-              over the Amazon (Sect. 3.2) only supported reducing iso-
els (e.g., all models that participated in the intercomparison     prene emissions by a factor of 2, we considered reducing
study by Hodzic et al., 2020, used MEGAN). However, there          isoprene emissions by a factor of 3–4 excessive.
are still many uncertainties in calculating isoprene emissions        The CO2 inhibition effect on isoprene emissions becomes
in models, especially for tropical forests, which are less un-     important at high CO2 concentrations under future climatic
derstood than their temperate and boreal counterparts due to       conditions, which can solely offset an isoprene emission in-
great heterogeneity, with many forest subtypes at scales of        crease associated with future temperature increase (Tai et
hundreds of meters (Batista et al., 2019). For example, ter        al., 2013). Controlled chamber experiments revealed that
Steege et al. (2013) reported that Amazonia harbors ∼ 16 000       isoprene emissions are lower at elevated CO2 conditions
different tree species, and Silk et al. (2015) showed that there   (Wilkinson et al., 2009; Possell and Hewitt, 2011), and
are 40 000–53 000 tree species in the tropics, in contrast to      MEGANv2.1 includes the CO2 inhibition effect in the iso-
only 124 across temperate Europe. Furthermore, there have          prene emission calculation (Guenther et al., 2012). How-
been fewer emission studies over the tropics (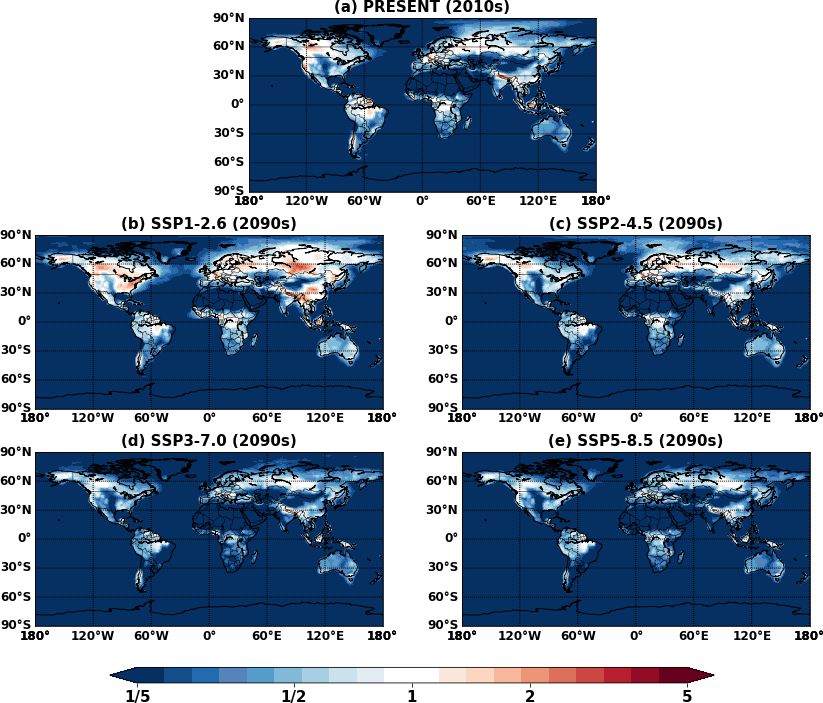
3400                               D. S. Jo et al.: Future changes in isoprene-epoxydiol-derived secondary organic aerosol

hibition effects as a base case, and we additionally carried out   not consumed by the VBS reactions to avoid duplication
simulations with CO2 effects to estimate the robustness of         of the detailed gas-phase isoprene chemistry in Sect. 2.2.1.
our conclusions with regard to CO2 effects. We note that the       In other words, the VBS does not affect gas chemistry in
CO2 inhibition effect is included in MEGANv2.1 in CESM             the model, so all simulations in Table 1 have the same gas
as a default (Guenther et al., 2012).                              chemistry. The isoprene peroxy radical (ISOPO2VBS) is a
                                                                   non-transported tracer to reduce computational cost. It is rea-
2.2.4   NOx -dependent yield of VBS scheme                         sonable, as a typical lifetime of isoprene peroxy radicals in
                                                                   the atmosphere is less than a few minutes (Wennberg et al.,
The VBS scheme (Hodzic et al., 2016) as implemented in             2018; Jo et al., 2019). The reaction rate constant of the iso-
CESM2.1.0 considers only low-NOx conditions (Tilmes et             prene + OH reaction matches the isoprene gas-phase reac-
al., 2019). Because NOx levels in the future are predicted         tion (Schwantes et al., 2020). Similarly high NOx yields for
to change substantially (Feng et al., 2020), it is important       SOA formed from terpenes, benzene, toluene, and xylenes
to consider NOx -dependent yields to capture the response to       have been included in the mechanism.
HO2 / NO ratio change in the future. We updated the VBS
scheme to simulate high- and low-NOx pathways of SOA
formation based on yields from Hodzic et al. (2016). For
                                                                   3     Model evaluation
example, for isoprene, the default scheme includes a reac-
tion with OH forming the SOA precursor gas-phase species
                                                                   3.1    SEAC4 RS
(SOAG) for the five VBS bins:
Isoprene + OH → Isoprene + OH + αlow, 0 · SOAG0                    The Studies of Emissions, Atmospheric Composition,
                                                                   Clouds and Climate Coupling by Regional Surveys
+ αlow, 1 · SOAG1 + αlow, 2 · SOAG2
                                                                   (SEAC4 RS) campaign in August–September 2013 sampled
+ αlow, 3 · SOAG3 + αlow, 4 · SOAG4,                               the continental US troposphere with a heavy emphasis on
                                                                   the SE US and provided aircraft measurements of iso-

               −11         410
k = 2.54 × 10      × exp         ,                         (R1)    prene and its oxidation products (Marais et al., 2016; Toon
                            T
                                                                   et al., 2016). We evaluated the model against isoprene,
where SOAG0–4 represents gas-phase SOA species simu-               isoprene hydroxy hydroperoxide (ISOPOOH), IEPOX, and
lated by the VBS scheme spanning saturation vapor concen-          IEPOX SOA. Isoprene was observed by proton transfer reac-
trations from 0.01 µg m−3 to 100 at 300 K; αlow, n is the SOA      tion mass spectrometry (PTR-MS) (de Gouw and Warneke,
molar yield at low-NOx conditions for the volatility bin n         2007; Müller et al., 2014). Biomass-burning-impacted air
with values of 0.0031, 0.0035, 0.0003, 0.0271, and 0.0474; k       masses ([CH3CN] >200 ppt; Travis et al., 2016) were ex-
is the reaction rate coefficient (cm3 molecule−1 s−1 ); and T      cluded from the analysis in order to remove furan interfer-
is the temperature in Kelvin.                                      ence in detecting isoprene concentrations. The 2-methyl-3-
   To account for the high- and low-NOx conditions, we             buten-2-ol (MBO) interferences in the PTR-MS measure-
added two reactions to calculate the peroxy radical + HO2          ment of isoprene were assumed to be negligible over the
and peroxy radical + NO explicitly, as follows:                    SE US. ISOPOOH and IEPOX were measured by a chem-
                                                                   ical ionization mass spectrometer (CIMS) using the CF3 O
Isoprene + OH → Isoprene + OH + ISOPO2VBS,
                                                                 ion, and IEPOX and ISOPOOH were individually quanti-
              −11         390                                      fied by tandem MS (Crounse et al., 2006; Paulot et al.,
 k = 2.7 × 10     × exp         ,                        (R2a)
                           T                                       2009; St. Clair et al., 2010). IEPOX SOA concentrations
ISOPO2VBS + HO2 → HO2 + αlow, 0 · SOAG0                            were quantified by applying PMF to aerosol mass spec-
                                                                   trometer (AMS) OA measurements (Hu et al., 2015; Marais
 + αlow, 1 · SOAG1 + αlow, 2 · SOAG2
                                                                   et al., 2016). We also excluded urban plumes as diag-
 + αlow, 3 · SOAG3 + αlow, 4 · SOAG4,                              nosed by [NO2 ] >4 ppb and stratospheric air as diagnosed by
                                                                   [O3 ] / [CO] >1.25 mol mol−1 based on Travis et al. (2016).

                            1300
  k = 2.12 × 10⁻¹³ × exp           ,                     (R2b)        Figure 1 compares observed and modeled vertical pro-
                               T
                                                                   files of isoprene, ISOPOOH, IEPOX, and IEPOX SOA. The
ISOPO2VBS + NO → NO + αhigh, 0 · SOAG0
                                                                   model generally captured vertical distributions but underes-
 + αhigh, 1 · SOAG1 + αhigh, 2 · SOAG2                             timated observed concentrations. Normalized mean biases
 + αhigh, 3 · SOAG3 + αhigh, 4 · SOAG4,                            (NMBs) were −64 %, −73 %, −52 %, and −57 % for iso-

                            350
                                                                  prene, ISOPOOH, IEPOX, and IEPOX SOA, respectively.
                −12
 k = 2.7 × 10       × exp         ,                      (R2c)     The model substantially underestimated median values, es-
                             T
                                                                   pecially for isoprene and ISOPOOH, but showed better per-
where αhigh, 0–4 represents 0.0003, 0.0003, 0.0073, 0.0057,        formance for later generation products (IEPOX and IEPOX
and 0.0623, respectively. Isoprene, OH, HO2 , and NO are           SOA) with longer lifetimes. IEPOX SOA concentrations over

Atmos. Chem. Phys., 21, 3395–3425, 2021                                              https://doi.org/10.5194/acp-21-3395-2021
D. S. Jo et al.: Future changes in isoprene-epoxydiol-derived secondary organic aerosol                                    3401

6 km were overestimated by the model but underestimated          IOP2. The German High Altitude and Long Range Research
below 6 km. This tendency is opposite to the vertical gradi-     Aircraft (HALO) was deployed during the ACRIDICON-
ent of IEPOX SOA over the Amazon in Sect. 3.2. In terms          CHUVA (Aerosol, Cloud, Precipitation, and Radiation Inter-
of frequency distributions (Fig. S4), the model simulated        actions and Dynamics of Convective Cloud Systems) field
more low-concentration points and fewer high-concentration       campaign, which was performed in cooperation with IOP2
points compared to measurements.                                 of the GoAmazon campaign (Wendisch et al., 2016). Un-
   We conducted an additional sensitivity test as discussed in   like the G-1 aircraft, HALO flew not only in the boundary
Sect. 2.2.2. We decreased the IEPOX SOA yield from IEPOX         layer but also in the middle and upper troposphere. Isoprene
to 0.2 (based on Fig. 8 of D’Ambro et al., 2019). To increase    was measured by PTR-MS (Shilling et al., 2018) in the G-
γIEPOX in the model, we increased the effective Henry’s law      1, and IEPOX SOA was calculated from AMS data using
constant (H∗ ), which is highly uncertain and spans 2 or-        PMF analysis on the G-1 (Shilling et al., 2018) and on HALO
ders of magnitude in previous literature (1.0 × 10⁶ –1.7 ×       (Schulz et al., 2018) using the m/z 82 tracer method by Hu
108 M atm−1 ). Previous studies have used 1.0×10⁶ M atm−1        et al. (2015).
(Zhang et al., 2019), 2.7 × 10⁶ M atm−1 (Pye et al., 2013;           This dataset was used to evaluate the model results in typ-
Lin et al., 2016), 1.7 × 10⁷ M atm−1 (Zheng et al., 2020),       ical tropical forest conditions characterized by elevated iso-
3.0 × 10⁷ M atm−1 (Budisulistiorini et al., 2017; Pye et al.,    prene emissions. Given the coarse model resolution, we have
2017; Zhang et al., 2018a), 3.3 × 10⁷ M atm−1 (Marais et         filtered out urban and biomass burning plumes from low-
al., 2016), 1.3 × 10⁸ M atm−1 (Eddingsaas et al., 2010), and     altitude G-1 flights and focused on evaluating the model’s
1.7 × 10⁸ M atm−1 (Gaston et al., 2014a). We increased H∗        ability to simulate SOA in background conditions. Based on
by a factor of 5 (8.5×10⁷ M atm−1 from 1.7×10⁷ M atm−1 ).        cluster analyses at the surface (T3) site by de Sá et al. (2018)
The results are shown in Fig. S5a and d for IEPOX and            for IOP1 and de Sá et al. (2019) for IOP2, we used the
IEPOX SOA, respectively. We found that IEPOX (NMB of             following criteria for removing polluted air masses from
−55 %) stayed at similar levels, while IEPOX SOA (NMB            the data for evaluation: NOy >1 ppb, ozone >20 ppb, and
of −87 %) was greatly reduced in the model, which was            particle number >1200 cm−3 for IOP1 and NOy >1.3 ppb,
attributed to the lower SOA yield of 20 %, since the to-         ozone >36 ppb, and particle number >2240 cm−3 for IOP2.
tal production of IEPOX stays the same. We further con-          We applied these criteria to observations from the G-1 air-
ducted sensitivity tests to investigate the IEPOX SOA con-       craft by assuming that both the G-1 aircraft and the T3 sur-
centrations using extremely high H∗ values (50 and 500           face site were affected by similar air masses. The G-1 air-
times higher, shown in Fig. S5b, c, e, f). Even in these ex-     craft mostly sampled the boundary layer (∼ 75 % data points
treme cases, IEPOX SOA concentrations were substantially         below 1 km, see Fig. 2), and its flight tracks were close to
decreased (NMBs of −78 % and −81 %) compared to the              the T3 site (Martin et al., 2016). To estimate the impact of
base case due to low SOA yield. The mean modeled IEPOX           the uncertainty in modeled isoprene emissions, we conducted
and IEPOX SOA ratios between the extreme case (H∗ of             three simulations with different isoprene emissions by scal-
8.5 × 10⁹ M atm−1 and the yield of 0.2) and the base case        ing the emission factors of tropical trees by 100 % (base),
(H∗ of 1.7×10⁷ M atm−1 and the yield of 1.0) were 0.68 and       50 % (half), and 25 % (quarter).
0.51, which shows that the extreme case tends to exacerbate          Figure 2 shows vertical profiles of isoprene and IEPOX
the low bias in the model. Although the fraction of IEPOX        SOA from the G-1 (a, b, c) and HALO (d), respectively.
taken up increases in this case, it is not enough to compen-     Isoprene and IEPOX SOA concentrations simulated by
sate for the reduced yield compared to the base case.            CESM2.1.0 with MEGANv2.1 substantially overestimate
                                                                 observed concentrations. The data (blue line) in Fig. 2 show
3.2   GoAmazon and ACRIDICON-CHUVA                               NMBs of 65 % and 99 % for isoprene during IOP1 (a) and
                                                                 IOP2 (b), respectively. The overestimations were higher for
The Green Ocean Amazon (GoAmazon) experiment pro-                IEPOX SOA, which were 430 % during IOP1 (c) and 769 %
vided a variety of chemical measurements over the Ama-           during IOP2 (d). We attribute these overestimations to iso-
zon with aircraft and surface measurements in the wet and        prene emissions that are too high, as discussed in Sect. 2.2.3.
dry seasons of 2014. One of the main goals of the GoA-           A sensitivity simulation with the isoprene emissions from
mazon campaign was to investigate the interaction between        tropical trees decreased by 50 % reduced model biases to
pollution plumes from Manaus city and background condi-          −51 % and −46 % for isoprene during IOP1 and IOP2, re-
tions in the central Amazon Basin. There were two intensive      spectively, and to 225 % and 394 % for IEPOX SOA. A fur-
operating periods (IOP1 and IOP2). IOP1 was carried out          ther reduction of isoprene emissions to 25 % led to sub-
from 1 February to 31 March 2014 in the wet season, and          stantial underprediction of isoprene concentrations with bi-
IOP2 was conducted from 15 August to 15 October 2014             ases of −84 % during IOP1 and −77 % during IOP2. Mean
in the dry season (Martin et al., 2016). A low-flying G-159      IEPOX SOA concentrations were still overestimated (75 %
Gulfstream I (G-1) aircraft collected data including isoprene    and 121 %), with strong variability in biases according to alti-
mostly in the atmospheric boundary layer during IOP1 and         tude (Fig. 2d). Even the model with the lowest isoprene emis-

https://doi.org/10.5194/acp-21-3395-2021                                          Atmos. Chem. Phys., 21, 3395–3425, 2021
3402                                 D. S. Jo et al.: Future changes in isoprene-epoxydiol-derived secondary organic aerosol

Figure 1. Vertical profiles of (a) isoprene, (b) ISOPOOH, (c) IEPOX, and (d) IEPOX SOA during the SEAC4 RS campaign over the south-
eastern US. Profiles are binned to the 1 km vertical resolution grid. Boxes show the 25th–75th percentile, with the orange line being the
median. Whiskers represent 10th and 90th percentiles, and the black dot indicates the mean value. The model results are sampled along the
flight tracks and shown in blue, with the solid line for the mean and the dashed line for median values. The number of 60 s merged data points
in each kilometer interval is shown at the right of each panel.

sions overestimated IEPOX SOA below 5 km, but it substan-                convection over land compared to the previous convection
tially underestimated IEPOX SOA above 5 km (green line in                schemes in CESM (Danabasoglu et al., 2020), but it may still
Fig. 2d). One possible reason is inaccuracies in the convec-             contribute to the observed differences. In terms of IEPOX
tion scheme in the model because the ACRIDICON-CHUVA                     SOA concentrations above 5 km, NMBs were 181 %, 6 %,
period was strongly influenced by tropical deep convection               and −42 % for the base, half, and quarter isoprene emission
(Schulz et al., 2018). It is worth noting that the convection            cases, respectively.
scheme in CAM6 (CLUBB; Cloud Layers Unified By Bi-                         The higher model IEPOX SOA biases against the
normals) has shown improved performance for tropical deep                ACRIDICON-CHUVA (121 %–769 %) compared to the

Atmos. Chem. Phys., 21, 3395–3425, 2021                                                     https://doi.org/10.5194/acp-21-3395-2021
D. S. Jo et al.: Future changes in isoprene-epoxydiol-derived secondary organic aerosol                                               3403

Figure 2. Vertical profiles of isoprene (a, b) and IEPOX SOA (c, d) during the GoAmazon (a, b, c) and ACRIDICON-CHUVA (d) campaigns.
Profiles are binned to the 1 km vertical resolution. Boxes show the 25th–75th percentile, with the orange line showing the median. Whiskers
represent the 10th and 90th percentiles and the black dot indicates the mean value. The model results are shown in blue, red, and green
for the base, half, and quarter isoprene emissions from tropical tree PFTs, respectively. The solid line represents the mean, and the dashed
line indicates median values. The observed median and quartile values are not visible at the 3–4 km level in (c), as they are smaller than
0.001 µg m−3 . The number of data points in each kilometer interval is shown at the right of each panel.

https://doi.org/10.5194/acp-21-3395-2021                                                   Atmos. Chem. Phys., 21, 3395–3425, 2021
3404                              D. S. Jo et al.: Future changes in isoprene-epoxydiol-derived secondary organic aerosol

GoAmazon (75 %–430 %) measurements can be partially ex-          shown in Fig. S8, which shows aerosol pH increases of 1–
plained by particle losses in the constant-pressure inlet used   2 units over the Amazon; this is similar to the results by
by the HALO AMS. Mei et al. (2020) reported that there           Zhang et al. (2019). Given the fact that the ratio of IEPOX
were particle losses in the constant-pressure inlet used on      to inorganic sulfate is especially high over the Amazon, the
the HALO AMS by comparing G1 AMS and HALO AMS                    modeling of the conversion may improve the model perfor-
during coordinated flights. The differences between G1 and       mance over the Amazon while maintaining the model perfor-
HALO AMS were up to a factor of 2 below 2 km (Fig. 11 in         mance over the SE US and other regions. However, it did not
Mei et al., 2020). The model biases during the ACRIDICON-        improve the comparison, especially for the free troposphere.
CHUVA were reduced to 88 %–641 % after increasing the            The results of this sensitivity run will be further discussed in
observed IEPOX SOA concentrations below 2 km 2 times.            Sect. 3.3 with other sensitivity model runs.
   We further investigated the effects of IEPOX SOA evap-           Considering the isoprene and IEPOX SOA evaluations to-
oration (Sect. 2.2.2) on the model performance by using          gether, the model with the half isoprene emissions showed
H∗ of 8.5 × 10⁷ M atm−1 and the yield of 0.2 (IEPOX SOA          relatively better performance, although it overestimated
yield from IEPOX reactive uptake), especially for the model      IEPOX SOA concentrations below 5 km. The other model
with the half isoprene emissions (Fig. S6). NMBs were 11 %       results showed isoprene and IEPOX SOA that are too high
and 28 % over all altitudes for IOP1 and IOP2, respectively.     (base emission case) or an isoprene mixing ratio that is too
For the ACRIDICON-CHUVA campaign (Fig. S6b), this im-            low (quarter emission case). The model with the half iso-
provement results from a combination of an overestimation        prene emissions also showed better results in terms of the
of IEPOX SOA below 3 km and an underestimation above             frequency distribution (Fig. S9). Hereafter, the model simu-
3 km. The model showed a strong vertical gradient, which         lations are based on the reduced isoprene emission factors
was different from the observed vertical profiles. NMB was       by half for tropical tree PFTs. This treatment mainly af-
−70 % above 5 km. However, in general, contrary to the eval-     fected isoprene emissions over the tropics (25◦ S–25◦ N; see
uation against SEAC4 RS measurements (Sect. 3.1), the in-        Fig. S2e).
clusion of the recent findings from the chamber study by
D’Ambro et al. (2019) improved the model simulation in           3.3   Global surface AMS dataset
terms of model bias (225 %–394 % to 11 %–28 %). One pos-
sible explanation is different IEPOX SOA molecular compo-        We evaluated the model against global IEPOX SOA concen-
nents between the southeastern US and the Amazon; how-           trations reported by Hu et al. (2015) with seven more recent
ever, the reported composition is similar for both locations     observations (Table S2). They reported surface IEPOX SOA
(Yee et al., 2020). This new approach also changed IEPOX as      concentrations averaged for each campaign period (from a
shown in Sect. 3.1. Combined field measurements of IEPOX         month to a few months). Figure 3 shows the comparison
and IEPOX SOA will be needed to clarify the behaviors of         of modeled versus observed IEPOX SOA concentrations at
IEPOX SOA in different regions.                                  the surface spanning the years between 2008 and 2014. In
   Unlike the volatilities of IEPOX SOA, even if the molec-      this section, the modeled isoprene emissions of tropical trees
ular compositions of IEPOX SOA are similar for different         were reduced by half according to the evaluation in Sect. 3.2.
locations, the formation rates of IEPOX SOA could be dif-        Analogous to the evaluations against aircraft measurements
ferent. Depending on the ratio of IEPOX to inorganic sulfate,    above, the model generally underestimated IEPOX SOA over
aerosol pH can change substantially due to the conversion        the SE US but overestimated IEPOX SOA over the Amazon.
of inorganic sulfate to organic sulfate (Riva et al., 2019).     However, the model captured the spatial variability reason-
This inorganic-to-organic conversion can be especially im-       ably well across several chemical regimes and the interan-
portant for IEPOX SOA over the Amazon, where the con-            nual variability of IEPOX SOA (R 2 = 0.62).
version was observed to be up to ∼ 90 % in the laboratory           A sensitivity model run with 90 % of inorganic sulfate con-
experiment mimicking the Amazon (Riva et al., 2019). To          version to organic sulfate over the Amazon was also evalu-
explore this effect, we conducted a sensitivity simulation in    ated (black line in Fig. S10). The overestimation of the model
which we assumed that 90 % of the inorganic sulfate had con-     over the Amazon was significantly reduced and became com-
verted to organic sulfate and excluded organic sulfate from      parable to observed IEPOX SOA concentrations. R 2 was also
the thermodynamic calculation (Sect. 2.2.2). The result is       improved to 0.83 from 0.62. Another sensitivity model run
shown in Fig. S7. Model biases were substantially reduced        with heterogeneous OH oxidation of IEPOX SOA was also
and changed from positive (225 % and 394 % for the GoA-          investigated (blue line in Fig. S10). Contrary to the inor-
mazon IOP1 and ACRIDICON-CHUVA campaigns, respec-                ganic sulfate conversion sensitivity run, heterogeneous OH
tively) to negative (−9 % and −49 %). The model showed           oxidation did not change the model results significantly, even
improved performance for GoAmazon IOP1 but substan-              though we assumed 100 % loss (via fragmentation) of aged
tially underestimated the observed IEPOX SOA concentra-          IEPOX SOA. R 2 remained similar (0.62 to 0.61) as the sim-
tions during the ACRIDICON-CHUVA campaign except be-             ulated IEPOX SOA concentration changed only slightly. As
low 1 km. This change is due to less acidic conditions as        shown in Fig. S11, fresh IEPOX SOA is dominant globally

Atmos. Chem. Phys., 21, 3395–3425, 2021                                            https://doi.org/10.5194/acp-21-3395-2021
D. S. Jo et al.: Future changes in isoprene-epoxydiol-derived secondary organic aerosol                                      3405

except over the remote ocean. This is because the IEPOX            The relative contribution of fragmentation and functionaliza-
SOA lifetime against heterogeneous OH oxidation is about           tion, as well as detailed reaction mechanisms with molecular
∼ 19 d, assuming an average ambient OH concentration of            structures, should be investigated from observational studies
1.5 × 10⁶ molec. cm−3 (Hu et al., 2016), which is substan-         (e.g., newly identified organosulfate molecules from Chen et
tially longer than the IEPOX SOA lifetime against wet and          al., 2020) for future IEPOX SOA models. Overall, sensitiv-
dry deposition (∼ 6 d, Sect. 4).                                   ity studies revealed that future models will need to include
   The evaluations in this section show the challenges in ac-      a more molecular-level-based treatment of SOA. However,
curately predicting isoprene and IEPOX SOA. The model              there are many uncertain parameters that should be investi-
underestimated IEPOX SOA during SEAC4 RS (Fig. 1) but              gated first, such as the molecular composition of fresh and
overestimated IEPOX SOA in the Amazon (Fig. 2). Fur-               aged IEPOX SOA as well as resulting volatility, viscosity,
thermore, the model biases as a function of altitude over          acidity, pKa , and hygroscopicity.
the Amazon were opposite to those over the SE US during               Finally, we evaluated IEPOX SOA concentrations simu-
SEAC4 RS. Even within the SE US region, the model showed           lated by the VBS (red line in Fig. S10). The VBS scheme
different performance for different years (Centreville, Look       also showed the underestimation of IEPOX SOA over the
Rock, Atlanta, and Yorkville in Fig. 3). The apparent dif-         SE US and the overestimation over the Amazon. However,
ferences in model performance across regions, altitudes, and       the VBS scheme substantially underestimated the observed
time periods indicate that significant complexities still exist    IEPOX SOA over the SE US, and the R 2 value (0.42) was
in the ambient atmosphere for IEPOX SOA formation de-              significantly decreased. The explicit scheme showed better
spite significant advances in laboratory studies. For instance,    performance than the VBS scheme in terms of both bias and
results cannot be consistently improved by adjusting single        variability.
parameters like Henry’s law constant, and other model pro-            It is worth noting that there is also a limitation with the
cesses such as vertical mixing and wet deposition may be           coarse grid resolution of the global model (0.95◦ × 1.25◦ )
imperfect as well. Although we implemented a new compre-           in addition to chemistry. The model representativeness may
hensive gas-phase and heterogeneous chemistry, more stud-          be insufficient in some observation locations. Currently, the
ies are needed to reduce the gap between observations and          regional refinement version of the CESM2–CAM6-chem
models.                                                            model is under development, which can simulate air pollu-
   Three sensitivity model runs in this section indicate           tants with a regionally refined grid of ∼ 14 km resolution or
that the accurate prediction of aerosol composition is key         finer over the region of interest while maintaining the capa-
for predicting IEPOX SOA. (i) If newly formed IEPOX                bility of simulating the whole globe at 1◦ resolution (Pfister
SOA is mainly composed of semi-volatile species (e.g., 2-          et al., 2020). This multiscale model will be able to better rep-
methyltetrols) instead of very low-volatility species (e.g.,       resent specific observational sites.
organosulfates), it is likely to undergo evaporation, and the         We have selected the model version evaluated in this
effective IEPOX SOA yield should be decreased in the               section to assess IEPOX SOA concentrations under future
model unless the model explicitly calculates reevaporation         climatic scenarios. This version has the most comprehen-
(D’Ambro et al., 2019). (ii) In terms of model evaluation,         sive representation of gas-phase chemistry of isoprene and
the inclusion of organics in aerosol thermodynamic calcula-        IEPOX heterogeneous uptake that is available to date, and
tions (conversion of inorganic to organic sulfates) seems to       it captures the measured IEPOX SOA concentrations reason-
be most important, as it improves the model performance in         ably well across different chemical regimes. The mechanistic
regions where the model overpredicts IEPOX SOA (e.g., the          approach included with the explicit chemistry in this model
Amazon). This conversion also affects the viscosity of the         can assess the sensitivity of IEPOX SOA to multiple factors,
organic phase and increases inhibition of the IEPOX reac-          which cannot be evaluated from widely used parameteriza-
tive uptake rate because IEPOX-derived organosulfates have         tions such as the two-product scheme or VBS approaches, as
likely higher viscosity values than alpha-pinene SOA (Riva         shown below.
et al., 2019; Zhang et al., 2019). Although the results are sig-
nificantly improved over the Amazon, this conversion will re-
duce IEPOX SOA concentrations in regions where the model           4   IEPOX SOA changes in future climatic conditions
already underestimated the IEPOX SOA concentrations (e.g.,
the SE US), even though the conversion fraction over the           In this section, we present future IEPOX SOA concentrations
SE US is expected to be lower than that over the Amazon            predicted by the explicit chemistry using four SSP scenar-
(Riva et al., 2019). (iii) The heterogeneous OH reaction was       ios (SSP5–8.5, SSP3–7.0, SSP2–4.5, and SSP1–2.6), along
found to be unimportant except over remote regions due to          with IEPOX SOA under present conditions. The character-
a longer lifetime compared to other loss pathways of IEPOX         istics of the simulations are listed in Table 1. One present
SOA in the model. However, this reaction can be important          (2010s) and two future (2050s and 2090s) simulations were
in terms of aerosol–cloud interaction by changing the proper-      conducted. In each set of simulations shown in Table 1, we
ties of cloud condensation or ice nuclei over remote regions.      simulated 10 years to account for interannual variability. The

https://doi.org/10.5194/acp-21-3395-2021                                            Atmos. Chem. Phys., 21, 3395–3425, 2021
3406 D. S. Jo et al.: Future changes in isoprene-epoxydiol-derived secondary organic aerosol
Figure 3. Global surface IEPOX SOA observations (gray bar) versus the model results (solid line). Detailed information about site locations,
time period, and IEPOX SOA concentrations is available in Table S2. The southeastern US, the Amazon, and urban regions are shown in
blue, green, and red, respectively.
Table 1. Description of IEPOX SOA simulations under present and future conditions.
Simulation name SOA Yearsa Sea salt CO2 inhibition
scheme in aerosol effect in isoprene
pH calculation emissions
EXP_2010 Explicit 2005–2014 Excluded NO
EXP_CO2_2010 Explicit 2005–2014 Excluded YES
EXP_SS_2010 Explicit 2005–2014 Included NO
EXP_SS_CO2_2010 Explicit 2005–2014 Included YES
EXP_2050_SSPxc Explicit 2045–2054 Excluded NO
EXP_CO2_2050_SSPxc Explicit 2045–2054 Excluded YES
EXP_2090_SSPxc Explicit 2091–2100 Excluded NO
EXP_CO2_2090_SSPxc Explicit 2091–2100 Excluded YES
EXP_SS_2090_SSPxc Explicit 2091–2100 Included NO
EXP_SS_CO2_2090_SSPxc Explicit 2091–2100 Included YES
VBS_2010 VBS 2005–2014 n/ab NO
VBS_CO2_2010 VBS 2005–2014 n/ab YES
VBS_2050_SSPxc VBS 2045–2054 n/ab NO
VBS_CO2_2050_SSPxc VBS 2045–2054 n/ab YES
VBS_2090_SSPxc VBS 2091–2100 n/ab NO
VBS_CO2_2090_SSPxc VBS 2091–2100 n/ab YES
a The first 2 years were not used for analysis.
b SOA simulated by the VBS does not have a dependency on aerosol pH.
c Here x can be 5 (SSP5–8.5), 3 (SSP3–7.0), 2 (SSP2–4.5), and 1 (SSP1–2.6).
first 2 years were discarded as a spin-up period, and the re- increased IEPOX SOA concentrations is the increase in iso-
maining 8 years were used for the analysis. In addition to the prene emissions, as shown in Fig. 6. Higher surface temper-
future IEPOX SOA changes, we investigated the effects of atures mainly increased isoprene future emissions under the
aerosol pH (Sect. 4.2) and CO2 inhibition of isoprene emis- base case simulations without CO2 inhibition (see Sect. 4.3
sions (Sect. 4.3) on IEPOX SOA budgets. for a further discussion of multiple factors changing isoprene
emissions under future climatic scenarios). Global mean
4.1 IEPOX SOA changes surface temperatures were 278.8, 280.7, and 285.3 K for
EXP_2010, EXP_2090_SSP1, and EXP_2090_SSP5 simu-
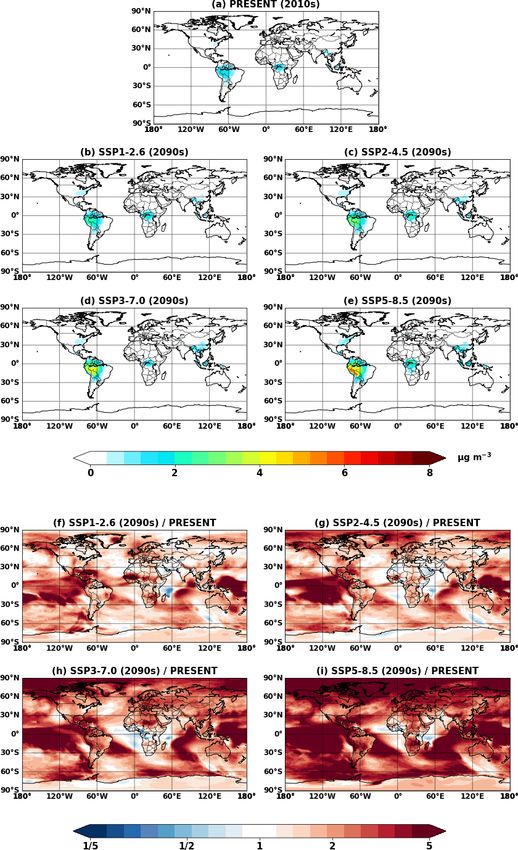
Figure 4 shows global mean surface concentrations of lations, respectively.
IEPOX SOA under present and future conditions for the ex- The westward continental outflow from the Amazon was
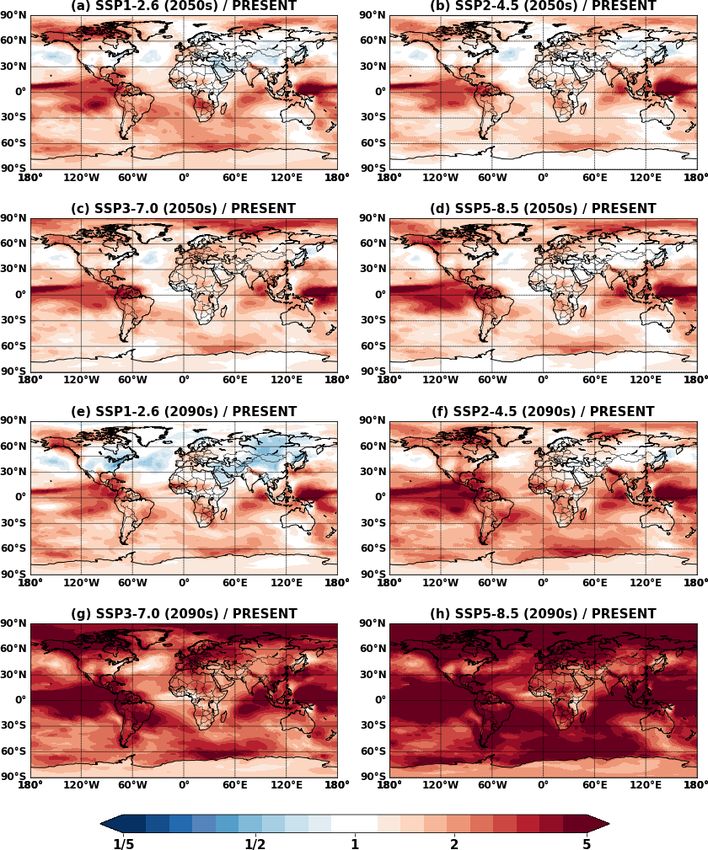
plicit (EXP) simulations, while Fig. 5 shows IEPOX SOA enhanced under all SSP scenarios as shown in Figs. 4 and
changes under future climates with respect to present con- 5. This was due to longer lifetimes of isoprene and its prod-
ditions. Generally, IEPOX SOA concentrations are predicted ucts (Fig. 6), which resulted from lower OH concentrations in
to increase globally, especially under high climate forcing future conditions (Fig. S12). Increased OH consumption by
scenarios (SSP3–7.0 and SSP5–8.5). The driving factor for
Atmos. Chem. Phys., 21, 3395–3425, 2021 https://doi.org/10.5194/acp-21-3395-2021You can also read