Science of the Total Environment
←
→
Page content transcription
If your browser does not render page correctly, please read the page content below
Science of the Total Environment 788 (2021) 147868

                                                                  Contents lists available at ScienceDirect

                                                      Science of the Total Environment

                                                journal homepage: www.elsevier.com/locate/scitotenv

A global-scale screening of non-native aquatic organisms to identify
potentially invasive species under current and future climate conditions
Lorenzo Vilizzi a, Gordon H. Copp a,b,c,d, Jeffrey E. Hill e, Boris Adamovich f, Luke Aislabie b, Daniel Akin g,
Abbas J. Al-Faisal h, David Almeida i, M.N. Amal Azmai j, Rigers Bakiu k,l, Adriana Bellati m, Renée Bernier n,
Jason M. Bies o, Gökçen Bilge p, Paulo Branco q, Thuyet D. Bui r, João Canning-Clode s,t,
Henrique Anatole Cardoso Ramos u, Gustavo A. Castellanos-Galindo v,w, Nuno Castro s, Ratcha Chaichana x,
Paula Chainho y,z,aa, Joleen Chan ab, Almir M. Cunico ac, Amelia Curd ad, Punyanuch Dangchana ae,
Dimitriy Dashinov af, Phil I. Davison b, Mariele P. de Camargo ac, Jennifer A. Dodd ag,
Allison L. Durland Donahou e,ah, Lennart Edsman ai, F. Güler Ekmekçi aj, Jessica Elphinstone-Davis ak,
Tibor Erős al, Charlotte Evangelista am, Gemma Fenwick an, Árpád Ferincz ao, Teresa Ferreira ap, Eric Feunteun aq,
Halit Filiz p, Sandra C. Forneck ac, Helen S. Gajduchenko ar, João Gama Monteiro s, Ignacio Gestoso s,t,
Daniela Giannetto as, Allan S. Gilles Jr at, Francesca Gizzi s, Branko Glamuzina au, Luka Glamuzina au,
Jesica Goldsmit av,aw, Stephan Gollasch ax, Philippe Goulletquer ay, Joanna Grabowska a, Rogan Harmer b,
Phillip J. Haubrock az,ba,bb, Dekui He bc, Jeffrey W. Hean bd,be, Gábor Herczeg bf, Kimberly L. Howland aw,
Ali İlhan bg, Elena Interesova bh,bi,bj, Katarína Jakubčinová bk, Anders Jelmert bl, Stein I. Johnsen bm,
Tomasz Kakareko bn, Kamalaporn Kanongdate bo, Nurçin Killi p, Jeong-Eun Kim bp, Şerife Gülsün Kırankaya bq,
Dominika Kňazovická br, Oldřich Kopecký br, Vasil Kostov bs, Nicholas Koutsikos bt, Sebastian Kozic a,
Tatia Kuljanishvili br, Biju Kumar bu, Lohith Kumar bv, Yoshihisa Kurita bw, Irmak Kurtul bg, Lorenzo Lazzaro bb,
Laura Lee bx, Maiju Lehtiniemi by, Giovanni Leonardi bz, Rob S.E.W. Leuven ca, Shan Li cb, Tatsiana Lipinskaya cc,
Fei Liu cd, Lance Lloyd ce,cf, Massimo Lorenzoni cg, Sergio Alberto Luna ch, Timothy J. Lyons e,ci, Kit Magellan cj,ck,
Martin Malmstrøm cl, Agnese Marchini cm, Sean M. Marr bd, Gérard Masson cn, Laurence Masson co,
Cynthia H. McKenzie cp, Daniyar Memedemin cq, Roberto Mendoza ch, Dan Minchin cr,cs, Laurence Miossec ay,
Seyed Daryoush Moghaddas ct, Moleseng C. Moshobane cu,cv,cw, Levan Mumladze cx, Rahmat Naddafi cy,
Elnaz Najafi-Majd cz, Aurel Năstase da, Ion Năvodaru da, J. Wesley Neal o, Sarah Nienhuis db, Matura Nimtim x,
Emma T. Nolan dc, Anna Occhipinti-Ambrogi m, Henn Ojaveer dd,de, Sergej Olenin cs, Karin Olsson b,df,dg,
Norio Onikura bw, Kathryn O'Shaughnessy dh, Daniele Paganelli di, Paola Parretti s,dj, Jiří Patoka br,
Richard Thomas B. Pavia Jr at, Daniele Pellitteri-Rosa cm, Michèle Pelletier-Rousseau av, Elfritzson M. Peralta at,
Costas Perdikaris dk, Dariusz Pietraszewski a, Marina Piria a,dl,⁎, Sophie Pitois b, Laura Pompei cg,
Nicolas Poulet dm, Cristina Preda cq, Riikka Puntila-Dodd by, Ali T. Qashqaei dn, Tena Radočaj dl,
Hossein Rahmani do, Smrithy Raj bu,dp, David Reeves dq, Milica Ristovska dr, Viktor Rizevsky ar,
D. Ross Robertson w, Peter Robertson ds, Laura Ruykys dt,du, Abdulwakil O. Saba j,dv, José M. Santos q,
Hasan M. Sarı bg, Pedro Segurado q, Vitaliy Semenchenko cc, Wansuk Senanan dw, Nathalie Simard av,
Predrag Simonović dx, Michał E. Skóra dy, Kristína Slovák Švolíková bk, Evangelia Smeti bt, Tereza Šmídová br,
Ivan Špelić dl, Greta Srėbalienė cs, Gianluca Stasolla dz, Paul Stebbing ak,ea, Barbora Števove bk,
Vettath R. Suresh eb, Bettina Szajbert bf, Kieu Anh T. Ta dt, Ali Serhan Tarkan a,p, Jonathan Tempesti ec,
Thomas W. Therriault ed, Hannah J. Tidbury ak, Nildeniz Top-Karakuş p, Elena Tricarico bb, Débora F.A. Troca ee,
Konstantinos Tsiamis ef, Quenton M. Tuckett e, Pero Tutman eg, Umut Uyan eh, Eliza Uzunova af,

  ⁎ Corresponding author.
     E-mail address: mpiria@agr.hr (M. Piria).
  1
    Prof. Weyl passed away suddenly during the final stages of this manuscript's preparation.

https://doi.org/10.1016/j.scitotenv.2021.147868
0048-9697/© 2021 The Author(s). Published by Elsevier B.V. This is an open access article under the CC BY license (http://creativecommons.org/licenses/by/4.0/).
L. Vilizzi, G.H. Copp, J.E. Hill et al.                                                                                                      Science of the Total Environment 788 (2021) 147868

Leonidas Vardakas bt, Gaute Velle ei,ej, Hugo Verreycken ek, Lizaveta Vintsek el, Hui Wei em,en,
András Weiperth ao, Olaf L.F. Weyl eo,bd,1, Emily R. Winter dc, Radosław Włodarczyk ep, Louisa E. Wood ak,
Ruibin Yang eq, Sercan Yapıcı p, Shayne S.B. Yeo ab, Baran Yoğurtçuoğlu aj, Anna L.E. Yunnie er, Yunjie Zhu es,
Grzegorz Zięba a, Kristína Žitňanová bk, Stacey Clarke b
a
   Department of Ecology and Vertebrate Zoology, Faculty of Biology and Environmental Protection, University of Lodz, 90-237 Lodz, Poland
b
   Centre for Environment, Fisheries and Aquaculture Science, Lowestoft, Suffolk NR33 0HT, UK
c
   Centre for Ecology, Environment and Sustainability, Bournemouth University, Poole, Dorset BH12 5BB, UK
d
   School of the Environment, Trent University, Peterborough, Ontario K9L 0G2, Canada
e
   Tropical Aquaculture Laboratory, Program in Fisheries and Aquatic Sciences, School of Forest Resources and Conservation, University of Florida, Ruskin, FL 33570, USA
f
   Faculty of Biology, Belarusian State University, 220030 Minsk, Belarus
g
   College of Science and Mathematics, Auburn University, Auburn, AL 36849, USA
h
   Marine Science Centre, University of Basrah, PO Box 49, Basrah, Iraq
i
   Departamento de Ciencias Médicas Básicas, Facultad de Medicina, Universidad San Pablo CEU, 28003 Madrid, Spain
j
   Department of Biology, Faculty of Science, Universiti Putra Malaysia, 43400 Seri Kembangan, Selangor, Malaysia
k
   Department of Aquaculture and Fisheries, Faculty of Agriculture and Environment, Agricultural University of Tirana, Tirana 1000, Albania
l
   Albanian Center for Environmental Protection and Sustainable Development, Tirana 1000, Albania
m
    Department of Ecological and Biological Sciences, University of Tuscia, 01100 Viterbo, Italy
n
   Fisheries and Oceans Canada, Gulf Fisheries Centre, Moncton, New Brunswick E1C 5K4, Canada
o
   Department of Wildlife, Fisheries & Aquaculture, Mississippi State University, Mississippi State, MS 39762, USA
p
   Department of Basic Sciences, Faculty of Fisheries, Muğla Sıtkı Koçman University, 48000 Menteşe, Muğla, Turkey
q
   Forest Research Centre, School of Agriculture, University of Lisbon, Tapada da Ajuda 1349-017, Lisbon, Portugal
r
   Faculty of Marine Science, Hanoi University of Natural Resources and Environment, 41A Phu Dien, Bac Tu Liem, Hanoi, Viet Nam
s
   MARE - Marine and Environmental Sciences Centre, Agência Regional para o Desenvolvimento da Investigação Tecnologia e Inovação (ARDITI), 9020-105 Funchal, Madeira, Portugal
t
   Smithsonian Environmental Research Center, Edgewater, MD 21037, USA
u
   Coordination of Sustainable Use of Fisheries Resources, Department of Species Conservation, Ministry of Environment, 70068-900 Brasilia, Brazil
v
   Leibniz Centre for Tropical Marine Research (ZMT), 28359 Bremen, Germany
w
    Smithsonian Tropical Research Institute, Apartado 2072, Balboa, Panamá
x
   Department of Environmental Technology and Management, Faculty of Environment, Kasetsart University, Bangkok 10900, Thailand
y
   MARE – Marine and Environmental Sciences Centre, Faculty of Sciences, University of Lisbon, 1749-016 Lisboa, Portugal
z
   Department of Animal Biology, Faculty of Sciences, University of Lisbon, 1749-016 Lisboa, Portugal
aa
    Polytechnic Institute of Setúbal, 2910-761 Setúbal, Portugal
ab
     Department of Biological Sciences, National University of Singapore, 117558, Singapore
ac
    Laboratory of Ecology, Fisheries and Ichthyology, Biodiversity Department - Palotina Sector, Federal University of Paraná (UFPR), Curitiba 80060-000, Brazil
ad
     Laboratory of Coastal Benthic Ecology, French Research Institute for Exploitation of the Sea (IFREMER), 29280 Plouzané, France
ae
    Division of Research Policy and Plan, National Research Council of Thailand, Bangkok 10900, Thailand
af
    Department of General and Applied Hydrobiology, Faculty of Biology, Sofia University, 1164 g.k. Lozenets, Sofia, Bulgaria
ag
    Animal and Plant Sciences Group, Edinburgh Napier University, Sighthill, Edinburgh EH11 4BN, UK
ah
     Florida Southern College, Lakeland, FL 33801, USA
ai
    Department of Aquatic Resources, Institute of Freshwater Research, Swedish University of Agricultural Sciences, SE-750 07 Drottningholm, Sweden
aj
    Hydrobiology section, Department of Biology, Faculty of Science, Hacettepe University, Çankaya-Ankara 06800, Turkey
ak
     Centre for Environment, Fisheries and Aquaculture Science, Weymouth, Dorset DT4 8UB, UK
al
    Centre for Ecological Research, Balaton Limnological Institute, Tihany 8237, Hungary
am
      Centre for Ecological and Evolutionary Synthesis, University of Oslo, NO-0316 Oslo, Norway
an
     Lancaster Environment Centre, Lancaster University, Lancaster, Lancashire LA1 4YW, UK
ao
     Institute for Natural Resources Conservation, Department of Aquaculture, Faculty of Agriculture and Environmental Sciences, Szent István University, Gödöllő 2100, Hungary
ap
     Department of Natural Resources, Environment and Landscape, School of Agriculture, University of Lisbon, 1349-017 Lisbon, Portugal
aq
     Muséum National d'Histoire Naturelle, Laboratoire Biologie des Organismes et Ecosystèmes Aquatiques, BOREA (MNHN, CNRS, Sorbonne Université, Université de Caen, IRD, Université de
Guadeloupe Antilles), Station Marine de Dinard, CRESCO, 35800 Dinard, France
ar
    Laboratory of Ichthyology, Scientific and Practical Center for Bioresources, National Academy of Sciences of Belarus, Minsk 220072, Belarus
as
    Department of Biology, Faculty of Science, Muğla Sıtkı Koçman University, 48000 Menteşe, Muğla, Turkey
at
    Department of Biological Sciences, College of Science, Research Center for the Natural and Applied Sciences, Graduate School, University of Santo Tomas, Manila, 1008, Metro Manila, Philippines
au
     Department of Applied Ecology, University of Dubrovnik, 20000 Dubrovnik, Croatia
av
    Fisheries and Oceans Canada, Maurice Lamontagne Institute, Mont-Joli, Quebec G5H 3Z4, Canada
aw
      Arctic and Aquatic Research Division, Freshwater Institute, Fisheries and Oceans Canada, Winnipeg, Quebec MB R3T 2N6, Canada
ax
     GoConsult, 22763 Hamburg, Germany
ay
    Scientific Direction, French Research Institute for Exploitation of the Sea (IFREMER), 44980 Nantes, France
az
    Senckenberg Research Institute and Natural History Museum Frankfurt, Department of River Ecology and Conservation, 63571 Gelnhausen, Germany
ba
     Nature and Environment Management Operators s.r.l., 50121 Florence, Italy
bb
     Department of Biology, University of Florence, 50121 Florence, Italy
bc
    The Key Laboratory of Aquatic Biodiversity and Conservation, Institute of Hydrobiology, Chinese Academy of Sciences, Wuhan 430071, China
bd
     DST/NRF Research Chair in Inland Fisheries and Freshwater Ecology, South African Institute for Aquatic Biodiversity, Grahamstown 6140, South Africa
be
     GroundTruth, Water, Wetlands and Environmental Engineering, Hilton, KwaZulu-Natal 3245, South Africa
bf
    Behavioural Ecology Group, Department of Systematic Zoology and Ecology, ELTE Eötvös Loránd University, H-1117 Budapest, Hungary
bg
     Faculty of Fisheries, Ege University, 35100 Bornova, Izmir, Turkey
bh
     Tomsk State University, Tomsk 634050, Russia
bi
    Institute of Systematics and Ecology of Animals, Siberian Branch of the Russian Academy of Sciences, Novosibirsk 630090, Russia
bj
    Novosibirsk branch of Russian Federal Research Institute of Fisheries and Oceanography, Novosibirsk 630090, Russia
bk
     Department of Ecology, Faculty of Natural Sciences, Comenius University, 841 04 Bratislava, Slovakia
bl
    Institute of Marine Research, Flødevigen Research Station, NO-7485 His, Norway
bm
      Norwegian Institute for Nature Research, NO-7485 Trondheim, Norway
bn
     Department of Ecology and Biogeography, Faculty of Biological and Veterinary Sciences, Nicolaus Copernicus University, 87-100 Toruń, Poland
bo
     Faculty of Environment and Resource Studies, Mahidol University, Salaya 73170, Thailand
bp
     College of Biological Sciences and Biotechnology, Chungnam National University, Daejeon 305-764, Republic of Korea
bq
     Department of Biology, Faculty of Arts and Science, Düzce University, 81620 Düzce, Turkey
br
    Department of Zoology and Fisheries, Faculty of Agrobiology, Food and Natural Resources, Czech University of Life Sciences Prague, 165 00 Praha, Czechia
bs
    Department of Fisheries, Institute of Animal Science, Ss Cyril and Methodius University, Skopje 1000, Macedonia
bt
    Institute of Marine Biological Resources & Inland Waters, Hellenic Centre for Marine Research, Anavissos, 19013, Attica, Greece

                                                                                                 2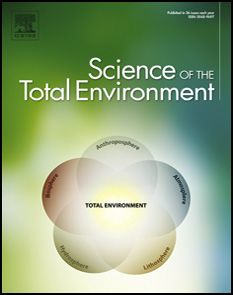
L. Vilizzi, G.H. Copp, J.E. Hill et al.                                                                                                   Science of the Total Environment 788 (2021) 147868

bu
    Department of Aquatic Biology & Fisheries, University of Kerala, Thiruvananthapuram, Kerala 695034, India
bv
    REF Division, ICAR-Central Inland Fisheries Research Institute, Kolkata, West Bengal 700120, India
bw
     Fishery Research Laboratory, Kyushu University, Fukutsu, Fukuoka 811-3304, Japan
bx
    Department of Evolution, Ecology and Behaviour, Faculty of Health and Life Sciences, University of Liverpool, Liverpool L69 7TX, England, United Kingdom
by
    Marine Research Centre, Finnish Environment Institute, 00790 Helsinki, Finland
bz
    Hierofalcon Research Group, 95124 Catania, Italy
ca
    Department of Animal Ecology and Physiology, Institute for Water and Wetland Research, Radboud University & Netherlands Centre of Expertise on Exotic Species, 6500 GL Nijmegen, the
Netherlands
cb
    Natural History Research Center, Shanghai Natural History Museum, Branch of Shanghai Science & Technology Museum, Shanghai 200041, China
cc
   Laboratory of Hydrobiology, Scientific and Practical Center for Bioresources, National Academy of Sciences of Belarus, Minsk 220072, Belarus
cd
    Aquatic Science Institute, Tibet Academy of Agriculture and Animal Husbandry Science, Lhasa 850009, China
ce
   Lloyd Environmental Pty Ltd, Somers, Victoria 3927, Australia
cf
   School of Health and Life Sciences, Federation University Australia, Ballarat, Victoria 3350, Australia
cg
    Department of Chemistry, Biology and Biotechnologies, University of Perugia, 06123 Perugia, Italy
ch
    Facultad de Ciencias Biológicas, Universidad Autónoma de Nuevo León, Nuevo León 66455, Mexico
ci
   New Mexico Biopark Society, Albuquerque, NM 87102, USA
cj
   South African Institute for Aquatic Biodiversity, Grahamstown 6140, South Africa
ck
    University of Battambang, 02360 Battambang, Cambodia
cl
   Norwegian Scientific Committee for Food and Environment (VKM), NO-0213 Oslo, Norway
cm
     Department of Earth and Environmental Sciences, University of Pavia, 27100 Pavia, Italy
cn
    Laboratoire interdisciplinaire des environnements continentaux, Centre national de la recherche scientifique, Université de Lorraine, 57000 Metz, France
co
    Freshwater Fish Ecology Laboratory, Ecosystem Science and Management Program, University of Northern British Columbia, Prince George, British Columbia V2N 4Z9, Canada
cp
    Northwest Atlantic Fisheries Centre, Fisheries and Oceans Canada, St. John's, Newfoundland and Labrador A1A 5J7, Canada
cq
    Faculty of Natural and Agricultural Sciences, Ovidius University of Constanta, Constanta 900527, Romania
cr
   Marine Organism Investigations, Marina Village, Ballina, Killaloe, Clare V94 767X, Ireland
cs
   Marine Research Institute, Klaipėda University, 92294 Klaipėda, Lithuania
ct
   Department of Biodiversity and Ecosystems Management, Environmental Sciences Research Institute, Shahid Beheshti University, 1983963113 Tehran, Iran
cu
    South African National Biodiversity Institute, Biological Invasions Directorate, Pretoria 0001, South Africa
cv
    Department of Biology, Sefako Makgatho Health Sciences University, Gauteng 0208, South Africa
cw
     Young Water Professionals, South African Chapter, Limpopo 1685, South Africa
cx
    Institute of Zoology, Ilia State University, Tbilisi 0162, Georgia
cy
    Swedish University of Agricultural Sciences, Department of Aquatic Resources, Division of Coastal Research, SE-453 30 Oregrund, Sweden
cz
   Department of Biology, Faculty of Sciences, Ege University, 35040 Izmir, Turkey
da
    Department of Biodiversity Conservation and Sustainable Use of Natural Resources, Danube Delta National Institute for Research and Development, Tulcea 820112, Romania
db
    Ontario Ministry of Natural Resources and Forestry, Peterborough, Ontario K9J 8M5, Canada
dc
    Department of Life and Environmental Sciences, Faculty of Science and Technology, Bournemouth University, Talbot Campus, Poole BH12 5BB, UK
dd
    University of Tartu, 80012 Pärnu, Estonia
de
    National Institute of Aquatic Resources, Technical University of Denmark, 2800 Lyngby, Denmark
df
   School of Zoology, Tel Aviv University, Tel Aviv 6997801, Israel
dg
    The Inter-University Institute for Marine Sciences in Eilat, Coral Beach, Eilat 8810302, Israel
dh
    Texas Parks and Wildlife Department, Coastal Fisheries, 4200 Smith School Rd., Austin, TX 78744, USA
di
   CNR-IRSA Water Research Institute, 28922 Verbania, Italy
dj
   CIBIO, Research Center in Biodiversity and Genetic Resources, InBIO Associate Laboratory and Faculty of Sciences and Technologies, University of the Azores, 9500-321 Ponta Delgada, Portugal
dk
    Department of Fisheries, Regional Unit of Thesprotia, Epirus, 46 100, Igoumenitsa, Greece
dl
   Department of Fisheries, Apiculture, Wildlife Management and Special Zoology, University of Zagreb Faculty of Agriculture, 10000 Zagreb, Croatia
dm
     Pôle écohydraulique OFB-IMFT-P, French Agency for Biodiversity, 31400 Toulouse, France
dn
    Sahel Square, Tehran 1493889881, Iran
do
    Sari Agricultural Sciences and Natural Resources University, Sari, 4816118771, Mazandaran, Iran
dp
    National Centre for Biological Sciences, Bangalore 560065, India
dq
    National Fish and Wildlife Foundation, Baton Rouge, LA 70808, USA
dr
   Institute of Biology, Faculty of Natural Sciences and Mathematics, Ss Cyril and Methodius University, 1000 Skopje, Macedonia
ds
    Modelling, Evidence and Policy Group, School of Natural and Environmental Resources, Newcastle University, Newcastle NE1 7RU, UK
dt
   Nature and Biodiversity Conservation Agency, Vietnam Environment Administration, Ministry of Natural Resources and Environment, 10 Ton That Thuyet, Nam Tu Liem District, Hanoi, Viet Nam
du
    Flora and Fauna Division, Department of Environment and Natural Resources, Palmerston, Northern Territory 0828, Australia
dv
    School of Agriculture, Lagos State University, Epe Campus, 106101 Epe, Lagos State, Nigeria
dw
     Department of Aquatic Science, Faculty of Science, Burapha University, Chon Buri 20130, Thailand
dx
    Faculty of Biology & Institute for Biological Research “Siniša Stanković”, University of Belgrade, Belgrade 11000, Serbia
dy
    University of Gdańsk, Faculty of Oceanography and Geography, Institute of Oceanography, Professor Krzysztof Skóra Hel Marine Station, 84-150 Hel, Poland
dz
    Dadoda S.r.l.s, 70029 Santeramo in colle, Italy
ea
    APEM Ltd, A17 Embankment, Business Park, Heaton Mersey, Manchester, Cheshire SK4 3GN, UK
eb
    Division of Mariculture, Central Marine Fisheries Research Institute, Cochin, Kerala 682018, India
ec
   Department of Biology, University of Pisa, 56126 Pisa, Italy
ed
    Pacific Biological Station, Fisheries and Oceans Canada, Nanaimo, British Columbia V9T 6N7, Canada
ee
    Institute of Oceanography, Federal University of Rio Grande, 96203-900 Rio Grande, Brazil
ef
   Institute of Oceanography, Hellenic Centre for Marine Research, Attica, Anavyssos 19013, Greece
eg
    Laboratory for Ichthyology and Coastal Fisheries, Institute of Oceanography and Fisheries, 21000 Split, Croatia
eh
    Skretting Turkey, Güllük Milas, 48670, Muğla, Turkey
ei
   Norwegian Research Centre, 5007 Bergen, Norway
ej
   Department of Biological Sciences, University of Bergen, 5007 Bergen, Norway
ek
    Research Institute for Nature and Forest (INBO), B-1630 Linkebeek, Belgium
el
   Institute of Botany, Faculty of Biology, Jagiellonian University, 30-387 Kraków, Poland
em
     Pearl River Fisheries Research Institute, Chinese Academy of Fishery Science, Guangzhou 510380, China
en
    Key Laboratory of Recreational fisheries Research, Ministry of Agriculture and Rural Affairs, Guangzhou 510380, China
eo
    Centre for Invasion Biology, South African Institute for Aquatic Biodiversity, Makhanda 6139, South Africa
ep
    Department of Biodiversity Studies and Bioeducation, Faculty of Biology and Environmental Protection, University of Lodz, 90-237 Lodz, Poland
eq
    College of Fisheries, Huazhong Agricultural University, Wuhan 430070, China
er
   PML Applications Ltd, Plymouth, Devon PL1 3DH, UK
es
   Aquaculture Technology Promotion Station of Nantong, Nantong, China

                                                                                               3
L. Vilizzi, G.H. Copp, J.E. Hill et al. Science of the Total Environment 788 (2021) 147868
H I G H L I G H T S G R A P H I C A L A B S T R A C T
• A global approach is required to identify
invasive species posing high risk impact.
• 195 assessors screened 819 non-native
species from 15 groups of aquatic or-
ganisms.
• Risk thresholds were identified for 14
aquatic organism groups.
• The resulting risk thresholds and rankings
will help management and conservation.
a r t i c l e i n f o a b s t r a c t
Article history: The threat posed by invasive non-native species worldwide requires a global approach to identify which intro-
Received 13 April 2021 duced species are likely to pose an elevated risk of impact to native species and ecosystems. To inform policy,
Received in revised form 13 May 2021 stakeholders and management decisions on global threats to aquatic ecosystems, 195 assessors representing
Accepted 14 May 2021
120 risk assessment areas across all six inhabited continents screened 819 non-native species from 15 groups
Available online 20 May 2021
of aquatic organisms (freshwater, brackish, marine plants and animals) using the Aquatic Species Invasiveness
Editor: Damia Barcelo Screening Kit. This multi-lingual decision-support tool for the risk screening of aquatic organisms provides
assessors with risk scores for a species under current and future climate change conditions that, following a
statistically based calibration, permits the accurate classification of species into high-, medium- and low-risk cat-
Keywords: egories under current and predicted climate conditions. The 1730 screenings undertaken encompassed wide
Decision support tools geographical areas (regions, political entities, parts thereof, water bodies, river basins, lake drainage basins,
AS-ISK and marine regions), which permitted thresholds to be identified for almost all aquatic organismal groups
Hazard identification screened as well as for tropical, temperate and continental climate classes, and for tropical and temperate marine
Non-native species
ecoregions. In total, 33 species were identified as posing a ‘very high risk’ of being or becoming invasive, and the
Risk analysis
scores of several of these species under current climate increased under future climate conditions, primarily due
Climate change
to their wide thermal tolerances. The risk thresholds determined for taxonomic groups and climate zones provide
a basis against which area-specific or climate-based calibrated thresholds may be interpreted. In turn, the risk
rankings help decision-makers identify which species require an immediate ‘rapid’ management action (e.g.
eradication, control) to avoid or mitigate adverse impacts, which require a full risk assessment, and which are
to be restricted or banned with regard to importation and/or sale as ornamental or aquarium/fishery
enhancement.
© 2021 The Author(s). Published by Elsevier B.V. This is an open access article under the CC BY license (http://
creativecommons.org/licenses/by/4.0/).
1. Introduction hence posing a threat to native species, usually possess life-history traits
including frequent reproduction with a high incidence of ovoviviparity,
The threat posed by invasive non-native species (NNS) worldwide to large body size and a long life span, the ability to exploit opportunisti-
native species and ecosystems requires a global approach to identify cally available food resources, a history of invasion success, and a close
species that pose a high risk of becoming invasive across varied geogra- climate matching with the RA area (Statzner et al., 2008; Chan et al.,
phies and climates (Gordon et al., 2008). Use of the same risk screening 2021). In addition, these species often tolerate higher salinity, broader
protocols worldwide can provide the larger-scale information with environmental temperatures and higher levels of organic pollution
which to inform the decisions of policy makers and environmental man- than native species (Leuven et al., 2009). Importantly, the identification
agers in dealing with species invasions (Early et al., 2016; Shackleton of species posing a high risk of being (or becoming) invasive in a certain
et al., 2019). Indeed, reliable, evidence-based risk assessment (RA) RA area provides a basis for advice to policy, decision-makers and other
methods are vital to decision-making in biosecurity management at na- stakeholders regarding management options for existing and potential
tional and international levels in order to prevent or mitigate unwanted future invasive NNS (Copp et al., 2005b, 2016b; Mumford et al., 2010;
biological invasions (Kaiser and Burnett, 2010). Ideally, the RA out- David et al., 2013; David and Gollasch, 2018, 2019).
comes should compare and prioritise NNS according to their potential The objectives of the present study were to: (i) construct a global da-
invasiveness under current and future climate conditions (Barney and tabase of risk screenings that span the broadest range of aquatic organ-
DiTomaso, 2010), which aids in identifying the underlying factors asso- isms possible, given available resources, across the widest possible
ciated with invasion hotspots (O'Donnell et al., 2012; Chapman et al., geographical spread; (ii) subject the global database of screenings to
2020). calibration and accuracy analysis; and (iii) generate global-scale risk
The first step in the NNS risk analysis process is risk screening (i.e. thresholds at the organism group and climate class/marine ecoregion
hazard identification), which aims to identify the NNS that are likely levels under both current and future climate conditions. The global-
to pose an elevated threat to native species and ecosystems and, there- scale thresholds identified will provide a basis against which thresholds
fore, warrant more comprehensive (i.e. full) RA (Copp et al., 2005b). calibrated for specific RA areas may be interpreted and will also allow
Aquatic species that are likely to carry a high risk of becoming invasive, the ‘rapid risk screening’ of individual species for a certain RA area
4L. Vilizzi, G.H. Copp, J.E. Hill et al. Science of the Total Environment 788 (2021) 147868
whenever specific calibration is not possible. In addition, these global- Change Assessment (CCA), which require the assessor to evaluate how
scale thresholds will place RA area-specific risk screening calibrations future predicted climate conditions are likely to affect the BRA with re-
within a broader, global context, also accounting for climate change pre- spect to risks of introduction, establishment, dispersal and impact. To
dictions. In turn, this will enhance the value and scope of more localised achieve a valid screening, for each question the assessor must provide
calibrations to inform environmental policy and decision-makers of the a response, a level of confidence in the response, and a justification. In
relative risk rankings of aquatic NNS so as to facilitate the cost-effective all cases, the assessor is a specialist in the biology/ecology of the aquatic
allocation of management resources. organism under screening for the RA area under study. Upon comple-
tion of the screening, the species receives both a BRA score and a
2. Materials and methods BRA + CCA (composite) score (ranging from −20 to 68 and from
−32 to 80, respectively). Scores < 1 suggest that the species is unlikely
2.1. Risk screening procedure to become invasive and is therefore classified as ‘low risk’ (Pheloung
et al., 1999). Higher scores classify the species as posing either a ‘me-
For the purposes of this study, ‘invasive species’ are defined, as per dium risk’ or a ‘high risk’ of becoming invasive. Distinction between
Copp et al. (2005c, p. 244), as those NNS “that spread, with or without medium-risk and high-risk levels depends upon setting a ‘threshold’
the aid of humans, in natural or semi-natural habitats, producing a sig- value (see Section 2.2 Data processing and analysis).
nificant change in composition, structure, or ecosystem processes, or The ranked levels of confidence (1 = low; 2 = medium; 3 = high;
cause severe economic losses to human activities”. Species were evalu- 4 = very high) associated with each question-related response mirror
ated for their potential to become invasive in the assessor(s)-defined RA the confidence rankings recommended by the International Programme
area using the Aquatic Species Invasiveness Screening Kit (AS-ISK: free on Climate Change (IPCC, 2005; see also Copp et al., 2016b). Based on
download at www.cefas.co.uk/nns/tools/). This is a decision-support the confidence level (CL) allocated to each response, a confidence factor
tool (Copp et al., 2016b, 2021) adapted from the Fish Invasiveness (CF) is computed as:
Screening Kit (Copp et al., 2009, 2005a), which itself was derived from
the globally-applied Weed Risk Assessment of Pheloung et al. (1999). CF ¼ ∑ CLQi =ð4 55Þ ði ¼ 1, . . . , 55Þ
The AS-ISK comprises questions from the generic screening module of
the European Non-native Species in Aquaculture Risk Analysis Scheme where CLQi is the confidence level for the ith Question (Qi), 4 is the max-
(Copp et al., 2016a) and incorporates the ‘minimum requirements’ imum achievable value for confidence (i.e. very high: see above) and 55
(Roy et al., 2018) for the assessment of invasive NNS with regard is the total number of questions. Based on the 49 Qs comprising the BRA
to the 2014 EU Regulation 1143/2014 (European Union, 2014). As a and the six Qs comprising the CCA, the CLBRA and CLCCA are also com-
taxon-generic toolkit, the AS-ISK is applicable to any aquatic species puted (out of the CLTotal for all 55 Qs).
(other than parasites and pathogens) in virtually any climatic/marine
ecoregion zone (Copp et al., 2016b; Table 1), and allows the screening 2.2. Data processing and analysis
of 27 groups of aquatic organisms in total (taxonomy after Ruggiero
et al., 2015): mammals, birds, reptiles, amphibians, fishes (freshwater, Data consisted of: (i) individual contributions to the present study
brackish, marine), tunicates, lancelets, invertebrates (freshwater, brack- by assessors invited to screen one (or more) NNS belonging to one or
ish, marine), ‘other’ animals (freshwater, brackish, marine), plants more aquatic organismal groups of choice (i.e. falling within their ex-
(freshwater, brackish, marine), protists (freshwater, brackish, marine), pertise) for a certain RA area; and (ii) datasets from more comprehen-
fungi (freshwater, brackish, marine), and bacteria (freshwater, brackish, sive screening studies of NNS for a certain RA area, both published
marine). (see Table 1) and unpublished. For each species screened, the scien-
The screening protocol consists of 55 questions (Copp et al., 2016b). tific name used in the original contribution or study was updated
The first 49 questions comprise the Basic Risk Assessment (BRA), which to the most recent taxonomy after the World Register of Marine
are concerned with the biogeographical and biological aspects of the Species (www.marinespecies.org), else after the Integrated Taxonomic
species being screened. The last six questions address the Climate Information System (www.itis.gov/) or FishBase (www.fishbase.org).
This was followed by ‘cross-checking’ for the existence of at least one
Table 1 peer-reviewed publication that used the updated scientific name in
Published initial applications of the Aquatic Species Invasiveness Screening Kit (AS-ISK) by case of a change in taxonomy. A notable exception was the retention
aquatic organismal group. of the original name Crassostrea gigas instead of the recently proposed
Aquatic Reference(s) Magallana gigas for the Pacific oyster (see Bayne et al., 2017).
organismal group Taxonomic details of the corresponding Order and Family were also re-
Reptiles Ruykys et al. (2021) trieved for each species screened.
Amphibians Ruykys et al. (2021) Except for marine regions, for each RA area the corresponding
Freshwater fishes Glamuzina et al. (2017), Li et al. (2017), Tarkan et al. (2017a), Köppen-Geiger climate class (i.e. Tropical, Dry, Temperate, Continental,
Tarkan et al. (2017b), Dodd et al. (2019), Suresh et al. (2019),
Polar: Peel et al., 2007) was identified, noting that in several cases more
Interesova et al. (2020), Moghaddas et al. (2020), Zięba et al.
(2020), Glamuzina et al. (2021), Haubrock et al. (2021), than one climate class applied to the same RA area. For marine regions,
Kumar et al. (2021), Moghaddas et al. (2021), Radočaj et al. the classification by Spalding et al. (2007) was used including: (i) Arctic,
(2021), Ruykys et al. (2021), Wei et al. (2021) (ii) Temperate Northern Atlantic and Temperate Northern Pacific
Brackish fishes Castellanos-Galindo et al. (2018), Clarke et al. (2020) (grouped in the present study into ‘Temperate marine’), and (iii)
Marine fishes Filiz et al. (2017a), Filiz et al. (2017b), Bilge et al. (2019),
Clarke et al. (2020), Lyons et al. (2020), Uyan et al. (2020)
Central Indo-Pacific, Tropical Atlantic, Tropical Eastern Pacific and
Tunicates Clarke et al. (2020) Western Indo-Pacific (grouped in the present study into ‘Tropical
Freshwater Paganelli et al. (2018), Ruykys et al. (2021), Semenchenko marine’).
invertebrates et al. (2018) The shape of the global distribution of the BRA and BRA + CCA
Brackish Clarke et al. (2020), Ruykys et al. (2021)
scores was tested in R x64 v3.6.3 (R Development Core Team, 2020)
invertebrates
Marine Clarke et al. (2020), Killi et al. (2020), Stasolla et al. (2020), using the package 'moments' v0.14 (Komsta and Novomestky, 2015),
invertebrates Ruykys et al. (2021) with normality, skewness and kurtosis evaluated by the Jarque-Bera
Freshwater plants Ruykys et al. (2021) (JB), D'Agostino and Anscombe tests, respectively. Computation of risk
Marine plants Clarke et al. (2020), Ruykys et al. (2021) outcomes was based on receiver operating characteristic (ROC) curve
Marine protists Clarke et al. (2020)
analysis (Bewick et al., 2004). An ROC curve is a graph of sensitivity vs
5L. Vilizzi, G.H. Copp, J.E. Hill et al. Science of the Total Environment 788 (2021) 147868
1 – specificity for each threshold value, where in the present context confidence intervals of specificities, which were computed along the en-
sensitivity and specificity will be the proportion of a priori invasive tire range of sensitivity points (i.e. 0 to 1, at 0.1 intervals).
and non-invasive species, respectively, correctly identified as such. For Following Smith et al. (1999), three measures of accuracy were
ROC curve analysis to be implemented, the species selected for screen- defined:
ing must be categorised a priori as non-invasive or invasive using inde-
pendent literature sources. 1) for a priori invasive species: Ai = (Ir/It) × 100, where Ir is the number
The a priori categorisation was as follows (see also Clarke et al., of a priori invasive species rejected, and It the total number of a priori
2020): (i) a first search was made of FishBase for any reference to the invasive species screened;
species' threat, with the species categorised as non-invasive if listed as 2) for a priori non-invasive species: An = (Na/Nt) × 100, where Na is the
‘harmless’, categorised as invasive if listed as ‘potential pest’, or scored number of a priori non-invasive species accepted and Nt the total
as absent if either not evaluated or not listed in the above database; number of a priori non-invasive species screened;
(ii) a second search was made of the Centre for Agriculture and Biosci- 3) overall: Ao = (Na + Ir)/(Nt + It).
ence International Invasive Species Compendium (CABI ISC: www.
cabi.org/ISC) and the Global Invasive Species Database (GISD: www. In all cases, values above 50% are indicators of the accuracy of the
iucngisd.org), with the species categorised as invasive if it appeared in screening tool.
any of such lists or scored as absent if not listed; (iii) a third search
was made of the Invasive and Exotic Species of North America list 3. Results
(www.invasive.org), with the species categorised as invasive if it ap-
peared in any of such lists or scored as absent if not listed; (iv) except In total, 1730 screenings were conducted by 195 assessors (the co-
for those species categorised as invasive in any (or all) of the previous authors of this study) on 819 taxa comprising 798 species, nine sub-
three steps, a Google Scholar (literature) search was performed to species, three hybrids, and nine genera (Supplementary data Table S1).
check whether at least one peer-reviewed reference is found that ‘dem- Of these taxa (hereafter, loosely termed ‘species’), 562 (68.6%) were
onstrates’ (hence, not ‘assumes’) invasiveness/impact. The latter was categorised a priori as non-invasive and 257 (31.4%) as invasive
then taken as ‘sufficient evidence’ for categorising the species as (Supplementary data Table S1) and were screened relative to 120 RA
invasive; whereas, if no evidence was found, then the species was areas (Supplementary data Tables S2 and S3) across all six inhabited con-
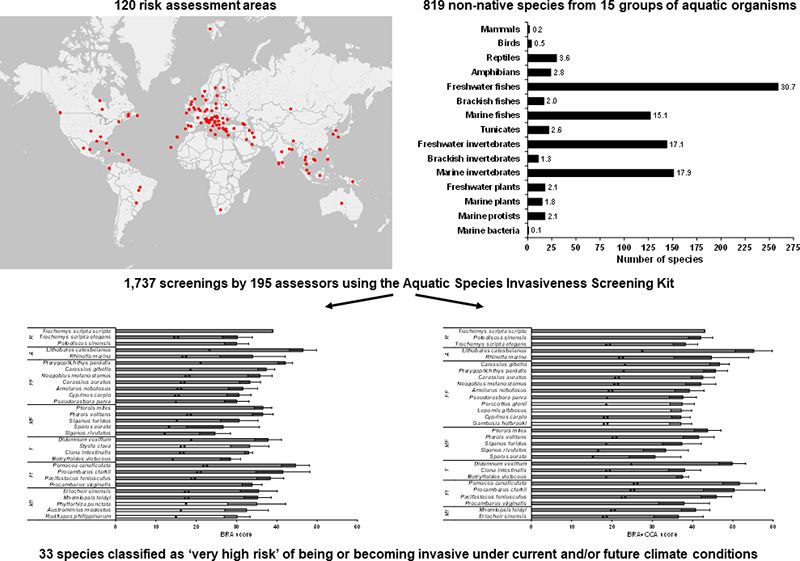
categorised as non-invasive. Overall, the advantage of this method is tinents (Fig. 1). The RA areas consisted of extensive geographical areas,
that, by virtue of its meta-analytical foundation, it draws upon and com- regions, countries, parts of countries, states, other political entities,
bines previous approaches into a multi-tiered protocol. This maximises water bodies, river basins, lake drainage basins, and marine regions
the amount of information collectable about the NNS under screening, (Supplementary data Table S2). Screenings encompassed 15 groups of
thereby increasing the accuracy of the screening outcomes (Vilizzi, aquatic organisms (Fig. 2) in 104 Orders (Supplementary data
Copp and Hill, unpublished). Table S2), with 24 species assigned to two different groups depending
A measure of the accuracy of the calibration analysis is the Area on the RA area's aquatic habitat (Supplementary data Table S4).
Under the Curve (AUC), which ranges from 0 to 1: a model whose pre- The BRA scores ranged from −15.0 to 55.0, with a mean = 18.6, a
dictions are 100% correct has an AUC of 1, one whose predictions are median = 18.0, and 5th and 95th percentiles = −4.0 and 42.5. Their
100% wrong has an AUC of 0. In the former case there are neither distribution was not normal (JB = 36.664, P < 0.001), not skewed
‘false positives’ (a priori non-invasive species classified as high risk, (skewness = 0.076, z = 1.230, P = 0.195), but platykurtic (kurtosis =
hence false invasive) nor ‘false negatives’ (a priori invasive species clas- 2.305, z = −9.359, P < 0.001) (Fig. 3a). The BRA + CCA scores ranged
sified as low or medium risk, hence false non-invasive); in the latter from −27.0 to 67.0, with a mean = 22.3, a median = 22.0, and 5th
case, the test cannot discriminate between ‘true positives’ (a priori inva- and 95th percentiles = −5.6 and 51.1. Their distribution was not nor-
sive species classified as high risk, hence true invasive) and ‘true nega- mal (JB = 16.378, P < 0.001), not skewed (skewness = −0.039, z =
tives’ (a priori non-invasive species classified as low or medium risk, −0.675, P = 0.499), but platykurtic (kurtosis = 2.531, z = −5.210,
hence true non-invasive). Following ROC curve analysis, the best P < 0.001) (Fig. 3b). The majority of delta values (i.e. differences be-
threshold value that maximises the true positive rate and minimises tween BRA + CCA and BRA scores, hence accounting for climate change
the false positive rate was determined using Youden's J statistic. predictions) were equal to 0, 4, 6 and 10 (>10% of the total in all cases),
Because of sample size constraints (see Vilizzi et al., 2019), group- and overall the proportion of the positive differences was much larger
specific thresholds for both the BRA and BRA + CCA were fitted to than that of the negative differences (68.8% vs 16.7%) (Fig. 3c). Across
those groups of aquatic organisms for which >10 species were all species, the mean CL values were: CLTotal = 2.73 ± 0.01, CLBRA =
screened. Consequently, for mammals and birds for which there were 2.78 ± 0.01, and CLCCA = 2.25 ± 0.02, indicating in all cases medium
low numbers of taxa a combined threshold was computed by pooling to high confidence (Supplementary data Table S5).
together the screened species for these groups with those screened for Thresholds were computed for all screened groups of aquatic organ-
reptiles and amphibians. This rendered the respective thresholds isms except those represented by ≤10 species (Table 2). For reptiles,
statistically significant, permitting their use for distinguishing between amphibians, freshwater and marine fishes, tunicates, freshwater and
high-risk and low-to-medium risk species until such time that RA- brackish invertebrates and marine protists, the BRA threshold was
area-specific calibrations can be undertaken for those taxonomic lower than the BRA + CCA one, whereas the opposite was true for
groups. To highlight ‘very high risk’ species for the aquatic organismal brackish fishes, marine invertebrates, and freshwater and marine
groups with large enough sample sizes, ad hoc thresholds for the BRA plants. Except for marine protists (BRA), the mean AUC values (in
and BRA + CCA were set weighted according to the range of scores Table 2) were in all cases > 0.5 – this confirmed the ability of the toolkit
for the high-risk species (see Clarke et al., 2020) and with the constraint to differentiate between a priori invasive and non-invasive species.
that the species was screened for a ‘representative’ number of RA areas After pooling, BRA and BRA + CCA thresholds could be computed for
(i.e. weighted according to the corresponding organismal group). mammals and birds, and in both cases the BRA threshold was lower
Additionally, climate class-specific thresholds were computed for fresh- than the BRA + CCA one (Table 2).
water fishes, and marine ecoregion-specific thresholds for marine fishes Based on the aquatic organismal group-specific thresholds (excluding
and invertebrates – the aquatic organismal groups with large enough the pooled ones), all three measures of accuracy had a mean value ≥50%
sample size for successful computation of such thresholds. In all cases, for all groups except tunicates (BRA + CCA only), marine plants and ma-
ROC curve analysis was carried out with the package 'pROC' (Robin rine protists (both BRA and BRA + CCA) – a result of the relatively small
et al., 2011) for R x64 v3.6.3 using 2000 bootstrap replicates for the sample sizes (Table 3). The number (and proportion) of true positives
6L. Vilizzi, G.H. Copp, J.E. Hill et al. Science of the Total Environment 788 (2021) 147868
Fig. 1. Map of the risk assessment areas for which species were screened with the Aquatic Species Invasiveness Screening Kit (AS-ISK; see also Supplementary data Table S2).
was consistently larger than that of the false negatives, which in all cases by the Dry climate was removed from further analysis (noting that the
accounted for only 0–5.6% of the screened species for each group Polar climate was found only in combination with the Temperate and/
(Table 4). Similarly, the proportion of false positives was in most cases or Continental climates, hence could not be analysed separately regard-
smaller than that of the true positives, and the proportion of the less of sample size). In total, 59 non-marine region RA areas were there-
medium-risk species was always relatively high. In total, 33 species fore considered. For freshwater fishes in tropical, temperate and
were identified as carrying a very high risk of invasiveness: 26 species continental climates, both the BRA and BRA + CCA thresholds were
based on both the BRA and BRA + CCA, four on the BRA only, and three higher for the tropical climate, lower for the temperate and even
on the BRA + CCA only (Fig. 4a, b). lower for the continental climate, whereas the BRA + CCA was similar
Of the 82 non-marine region RA areas, 56 included one climate class. to the BRA in all cases (Table 5). Of the 38 marine ecoregion RA areas,
To these RA areas, an additional four were added for which the second four fell within the Arctic ecoregion, 24 in the Temperate grouping
climate class (namely, Continental) was only marginally represented (including 23 RA areas in the Temperate Northern Atlantic and one in
(Supplementary data Table S2), whereas the only RA area represented the Temperate Northern Pacific ecoregions), and ten in the Tropical
Fig. 2. Number (and corresponding percentage) of species screened according to aquatic organismal group.
7L. Vilizzi, G.H. Copp, J.E. Hill et al. Science of the Total Environment 788 (2021) 147868
Fig. 3. (a) Frequency distribution of the Basic Risk Assessment (BRA) scores for the species screened with AS-ISK; (b) same for the BRA + CCA (Climate Change Component) scores;
(c) same for delta CCA values (i.e. differences between BRA + CCA and BRA scores for each of the species screened) with corresponding percentage.
8L. Vilizzi, G.H. Copp, J.E. Hill et al. Science of the Total Environment 788 (2021) 147868
Table 2
Basic Risk Assessment (BRA) and BRA + Climate Change Assessment (CCA) AS-ISK thresholds from receiver operating characteristic curve analysis for the groups of aquatic organisms
screened in the present study (Marine bacteria added for completeness). For each aquatic organismal group, the following is provided: number of screened species (n), threshold
(Thr) values for the BRA and BRA + CCA [the Area Under the Curve (AUC) values are >0.5, and therefore are statistically valid, including for Mammals, Birds, Reptiles and Amphibians –
with the latter two groups pooled together with Mammals and Birds for computation of the thresholds], with corresponding mean, lower confidence interval (LCI) and upper confidence
interval (UCI) for the AUC, very high risk threshold (VH Thr) and minimum number of risk assessment areas (RAAs) for selection of the very high risk species. Note that threshold values
are given in increments of 0.05 and rounded to the first or second decimal (as applicable, following AS-ISK threshold notation).
Aquatic organismal group n BRA BRA + CCA
Thr Mean LCI UCI VH Thr RAAs Thr Mean LCI UCI VH Thr RAAs
Mammals 2 25.5 0.7180 0.5834 0.8525 – – 31.6 0.6639 0.5223 0.8056 – –
Birds 4 25.5 0.7180 0.5834 0.8525 – – 31.6 0.6639 0.5223 0.8056 – –
Reptiles 30 28.5 0.6550 0.4176 0.8924 – 2 36.5 0.5975 0.3489 0.8461 – 2
Amphibians 24 15.5 0.7983 0.6144 0.9822 – 3 19.5 0.7815 0.5934 0.9696 – 3
Freshwater fishes 259 14.7 0.8446 0.7957 0.8936 30 10 17.7 0.8213 0.7691 0.8735 36 10
Brackish fishes 17 38 0.7917 0.5542 1.0000 – – 29.5 0.6875 0.3969 0.9781 – –
Marine fishes 127 12.75 0.8254 0.7089 0.9420 – 3 19 0.7819 0.6541 0.9096 – 3
Tunicates 22 22.5 0.6417 0.3943 0.8890 – 2 36.75 0.5792 0.3119 0.8464 – 2
Freshwater invertebrates 144 13.25 0.8243 0.7185 0.9301 30 4 25.75 0.8199 0.7076 0.9322 36 4
Brackish invertebrates 11 15 0.6111 0.0247 1.0000 – – 26.9 0.7222 0.4142 1.0000 – –
Marine invertebrates 151 15.1 0.8842 0.8333 0.9351 30 3 14.25 0.8483 0.7859 0.9107 36 3
Freshwater plants 15 24.5 0.8611 0.6697 1.0000 – – 12.5 0.9028 0.7522 1.0000 – –
Marine plants 15 32 0.6161 0.3098 0.9224 – – 27.25 0.6250 0.3197 0.9303 – –
Marine protists 18 34 0.4545 0.1639 0.7452 – – 42.75 0.5779 0.2899 0.8659 – –
Marine bacteria 1 – – – – – – – – – – – –
grouping (including three RA areas in the Central Indo-Pacific, four in 4. Discussion
the Tropical Atlantic, one in the Tropical Eastern Pacific, and two in
the Western Indo-Pacific ecoregions) (Supplementary data Table S2). 4.1. Risk screening extent
However, owing to low sample sizes, thresholds could not be computed
for any aquatic organismal group in the Arctic ecoregion. For marine In this study, fishes and invertebrates represented the largest pro-
fishes, the BRA and BRA + CCA thresholds were higher for the temper- portion of screened aquatic species, thus reflecting the composition of
ate relative to the tropical ecoregion grouping, and the BRA + CCA introduced animal species recorded for e.g. European waters (Alcaraz
threshold was higher than the BRA threshold in both cases (Table 5). et al., 2005; Gherardi et al., 2009; Katsanevakis et al., 2013) but also
For marine invertebrates, the BRA and BRA + CCA thresholds the relative number of experts (cf. assessors) in the various aquatic or-
were higher for the tropical relative to the temperate ecoregion ganismal groups. After freshwater fishes, freshwater and marine inver-
grouping, and the BRA threshold was similar to the BRA + CCA tebrates comprised the second most-widely screened group of aquatic
for the temperate ecoregion grouping but lower for the tropical organisms, with the marine invertebrates including a large proportion
ecoregion grouping (Table 5). In all cases, the mean AUC values of Decapoda – an Order that comprises several of the world's worst in-
were well above 0.5. vasive species (Lowe et al., 2000; Souty-Grosset et al., 2006). The large
Based on the climate/marine ecoregion-specific thresholds, all number of screenings for freshwater fishes in this study can be at-
three measures of accuracy had a mean value well above 50% in all tributed to the importance of inland waters as providers of ecosys-
cases and for both the BRA and BRA + CCA (Table 6). The number tem services for human societies (e.g. Wilson and Carpenter, 1999)
(and proportion) of true positives was consistently larger than that and to the fact that these habitats are under high human-induced
of the false negatives, which always accounted for only 0–1.6% of pressure, including NNS introductions (e.g. Hughes et al., 1998;
the screened species for each combination (Table 7). Similarly, the Rahel, 2000). The broad geographical spread of most of the screened
proportion of false positives was in most cases smaller than that of freshwater fish species reflects the increasing homogenisation of
the true positives, and the proportion of medium-risk species was al- aquatic fauna and flora as a result of worldwide introductions (e.g.
ways relatively high. McKinney, 1998; Rahel, 2000). Further, the taxonomic Orders that
were more frequently screened are those usually ecologically flexi-
ble, able to withstand adverse ecological conditions, generally wide-
Table 3
spread over large spatial scales, and often of economic importance
Accuracy measures for screenings on the groups of aquatic organisms for which BRA and (e.g. Hulme, 2009).
BRA + CCA thresholds were directly computed (cf. Table 2). Ai = accuracy for a priori in- Despite the large number of aquatic species screened in this study,
vasive species; An = accuracy for a priori non-invasive species; Ao = overall accuracy (see bacteria were represented by only one species and no screenings for
text for details). In italics, values < 50%.
fungi were contributed. Risk screenings of these groups of aquatic or-
Aquatic organismal group BRA BRA + CCA ganisms would require the participation of experts in the fields of mi-
Ai An A0 Ai An A0 crobiology and mycology, respectively. This points to the need for
greater multi-disciplinarity in future risk identification/assessment stud-
Reptiles 70.0 75.0 73.3 70.0 75.0 73.3
Amphibians 100.0 70.6 79.2 50.0 50.0 50.0
ies, which is particularly important as both aquatic bacteria and fungi are
Freshwater fishes 83.9 74.7 78.0 77.4 71.7 73.7 known to exert in some cases severe ecological impacts once established
Brackish fishes 62.5 100.0 82.4 62.5 88.9 76.5 and spread in their invasive range (Litchman, 2010), similar to their ter-
Marine fishes 88.9 75.2 77.2 72.2 79.8 78.7 restrial counterparts (Alderman, 1996; Loo, 2008). Regardless, it must be
Tunicates 80.0 58.3 68.2 40.0 91.7 68.2
noted that pathogenic and parasitic organisms are normally evaluated
Freshwater invertebrates 76.9 83.9 82.6 65.4 95.8 90.3
Brackish invertebrates 88.9 50.0 81.8 66.7 100.0 72.7 separately from other NNS using risk assessment protocols specific to in-
Marine invertebrates 86.4 78.3 81.5 83.1 75.0 78.1 fectious agents (e.g. Peeler et al., 2007; D'hondt et al., 2015; Copp et al.,
Freshwater plants 83.3 100.0 88.9 58.3 100.0 72.2 2016a). In addition, the diminutive size of these taxa could cause their
Marine plants 42.9 87.5 66.7 28.6 75.0 53.3 presence to go un-noticed, thereby limiting knowledge of their spread
Marine protists 42.9 36.4 38.9 71.4 27.3 44.4
and extent of invasiveness.
9L. Vilizzi, G.H. Copp, J.E. Hill et al. Science of the Total Environment 788 (2021) 147868
Table 4 saltwater intrusion, and increased environmental disturbances, climate
Risk outcomes (given as number of screened species and corresponding percentage) for change is likely to favour the spread of NNS along their invasion path-
the BRA and BRA + CCA for the groups of aquatic organisms for which risk thresholds
were directly computed. Species are categorised a priori as either Non-invasive or Invasive
ways as these conditions present opportunities for enhanced survival
(see Supplementary data Table S2). Medium-risk and high-risk outcomes for each group and lower invasion resistance of the invaded habitats (Rahel and
are based on the thresholds given in Table 2, whereas low-risk outcomes are based on a Olden, 2008). Further, climate change may result in altered transport
‘default’ threshold of 1. and/or introduction mechanisms or reduced effectiveness of control
Aquatic organismal group BRA BRA + CCA strategies (Hellmann et al., 2008).
Several of the top (i.e. ‘very high risk’) species under current climate
Non-invasive Invasive Non-invasive Invasive
conditions achieved an even higher score under conditions of climate
n % n % n % n % change (Fig. 4). Of these species, most are either primarily warm-
Reptiles water/tropical or have wide thermal tolerances. For example, the red-
Low 0 0.0 1 3.3 0 0.0 1 3.3 eared slider Trachemys scripta scripta is a very common semi-aquatic
Medium 15 50.0 2 6.7 15 50.0 2 6.7
turtle native to the south-eastern USA (Florida to south-eastern
High 5 16.7 7 23.3 5 16.7 7 23.3
Virginia: Powel et al., 1991) and in its introduced range occurs in a
Amphibians wide variety of habitats, including slow-flowing rivers, floodplain
Low 1 4.2 0 0.0 12 50.0 0 0.0
swamps, marshes, seasonal wetlands and permanent ponds (Scriber
Medium 11 45.8 0 0.0 5 20.8 7 29.2
High 5 20.8 7 29.2 17 70.8 7 29.2 et al., 1986). Both goldfish Carassius auratus and gibel carp Carassius
gibelio are known to establish across a wide geographical and climatic
Freshwater fishes
range. These species are widespread and locally invasive both in
Low 43 16.6 2 0.8 50 19.3 3 1.2
Medium 81 31.3 13 5.0 69 26.6 18 6.9 Europe's more northerly parts, such as Finland and Poland (e.g.
High 42 16.2 78 30.1 47 18.1 72 27.8 Grabowska et al., 2010; Puntila et al., 2013), across the Mediterranean
region (e.g. Crivelli, 1995; Tarkan et al., 2012), and further afield in
Brackish fishes
Low 0 0.0 0 0.0 0 0.0 0 0.0 Australia (e.g. Beatty et al., 2017) and the Americas (Magalhães and
Medium 9 52.9 3 17.6 8 47.1 3 17.6 Jacobi, 2013; Halas et al., 2018). The common lionfish Pterois miles is an-
High 0 0.0 5 29.4 1 5.9 5 29.4 other highly invasive species, especially since its invasion of the western
Marine fishes Atlantic and Mediterranean Sea, which has been unprecedentedly rapid
Low 36 28.3 1 0.8 33 26.0 1 0.8 (Bariche et al., 2017; Schofield, 2010). The channelled applesnail
Medium 46 36.2 1 0.8 54 42.5 4 3.1 Pomacea canaliculata is native to South America and has been intro-
High 27 21.3 16 12.6 22 17.3 13 10.2 duced as an ornamental species in Europe and the Mediterranean
Tunicates area, but also elsewhere in the world through aquaculture (https://
Low 0 0.0 0 0.0 0 0.0 0 0.0 www.cabi.org/isc/datasheet/68490). Phyllorhiza punctata is native to
Medium 7 31.8 2 9.1 11 50.0 6 27.3 the tropical Western Pacific, i.e. from Australia to Japan (Rippingale
High 5 22.7 8 36.4 1 4.5 4 18.2
and Kelly, 1995) and has been reported across the Mediterranean
Freshwater invertebrates Region (Abed-Navandi and Kikinger, 2007; Boero et al., 2009; Çevik
Low 14 9.7 0 0.0 1 0.7 0 0.0 et al., 2011; Gueroun et al., 2014; Deidun et al., 2017). An in-depth,
Medium 85 59.0 6 4.2 112 77.8 9 6.3
High 19 13.2 20 13.9 5 3.5 17 11.8
species-specific description of all the ‘very high risk’ species identified
in this study (Fig. 4) is provided in the Supplementary data, Appendix
Brackish invertebrates A1.
Low 0 0.0 0 0.0 0 0.0 0 0.0
Medium 1 9.1 1 9.1 2 18.2 3 27.3
Overall, the responses to climate-change questions tended to in-
High 1 9.1 8 72.7 0 0.0 6 54.5 crease scores as well as thresholds for most taxonomic groups in most
climatic regions. Species with broad distributions tended to possess
Marine invertebrates
Low 15 9.9 0 0.0 16 10.6 0 0.0
broad thermal tolerances, suggesting that those species are likely to be
Medium 57 37.7 8 5.3 53 35.1 10 6.6 able to expand their ranges, and thus impacts, poleward under future
High 20 13.2 51 33.8 23 15.2 49 32.5 climate conditions. For example, six freshwater fish species not native
Freshwater plants
to Great Britain were predicted to benefit from the forecasted future cli-
Low 1 5.6% 0 0.0% 4 22.2% 1 5.6% mate conditions, thus offering the potential to expand their ranges
Medium 5 27.8% 2 11.1% 2 11.1% 4 22.2% (Britton et al., 2010), which in Great Britain would be northward. Such
High 0 0.0% 10 55.6% 0 0.0% 7 38.9% poleward shifts in marine species distributions were initially deemed
Marine plants likely (VanDerWal et al., 2013), based in part on shifts observed in pre-
Low 0 0.0 0 0.0 0 0.0 0 0.0 vious warm periods (Drinkwater, 2006), and they have been predicted
Medium 7 46.7 4 26.7 6 40.0 5 33.3 for some freshwater fishes, e.g. channel catfish Ictalurus punctatus
High 1 6.7 3 20.0 2 13.3 2 13.3
(McCauley and Beitinger, 1992). Indeed, poleward shifts have been doc-
Marine protists umented in a recent meta-analysis of marine species distributions
Low 0 0.0 0 0.0 0 0.0 0 0.0 (Chaudhary et al., 2021). As such, tropical species are likely to expand
Medium 4 22.2 4 22.2 3 16.7 2 11.1
poleward into temperate regions (e.g. Quero, 1998; Scavia et al.,
High 7 38.9 3 16.7 8 44.4 5 27.8
2002), and temperate species to expand poleward into continental re-
gions (Root et al., 2003; Hickling et al., 2006). Whereas, species with
4.2. Risk outcomes under current and future climate conditions more limited thermal tolerances are likely to undergo shifts in their dis-
tributions (and thus impacts), which are characterised by range reces-
The high proportion of positive ‘delta’ values (i.e. after accounting for sions and range expansions in a poleward direction (Roessig et al.,
climate change predictions: Fig. 3c) is in line with findings that climate 2004; Rahel and Olden, 2008; Eissa and Zaki, 2011; Renaud et al.,
change is likely to exacerbate the risk of introduction, establishment, 2012). Wide thermal tolerances may be enhanced by local adaptation,
dispersal and impact of several NNS, though some species might re- such as is apparent in the cold-adapted population of eastern mosquitofish
spond negatively to changes in climate conditions (Kernan, 2015). Gambusia holbrooki, which has established a self-sustaining population in
With predicted warmer temperatures, reduced lake ice cover, altered Normandy, France (Beaudouin et al., 2008). This reflects the wide geo-
flow regimes, increased salinity due to changes in precipitation and graphical distribution of Gambusia holbrooki in its native range, which
10You can also read