Co-occurrence of gray whales and vessel traffic in the North Pacific Ocean - Inter-Research Science Publisher
←
→
Page content transcription
If your browser does not render page correctly, please read the page content below
Vol. 44: 177–201, 2021                 ENDANGERED SPECIES RESEARCH
                                                                                                      Published February 25
 https://doi.org/10.3354/esr01093                  Endang Species Res

                                                                                                         OPEN
                                                                                                         ACCESS

 Co-occurrence of gray whales and vessel traffic in
            the North Pacific Ocean
       Gregory K. Silber1,*, David W. Weller2, Randall R. Reeves3, Jeffrey D. Adams4,
                                    Thomas J. Moore5
                              1
                       Smultea Environmental Sciences, Washington Grove, MD 20880, USA
   2
   Marine Mammal and Turtle Division, Southwest Fisheries Science Center, National Marine Fisheries Service, NOAA,
                                             La Jolla, CA 92037, USA
                                    3
                                     Okapi Wildlife Associates, Hudson, Quebec J0P1H0, Canada
           4
               Office of Protected Resources, National Marine Fisheries Service, NOAA, Silver Spring, MD 20910, USA
                                             5
                                              Independent Researcher, Seattle, WA, USA

        ABSTRACT: All species of large whales are susceptible to vessel strikes, but the true scale and
        geographical extent of such strikes is not known. This paper provides a qualitative assessment of
        the range-wide risks posed to gray whales Eschrichtius robustus by vessels, by comparing pat-
        terns of whale distribution with the density of vessel traffic seasonally throughout the North
        Pacific in 2019. Areas of very high vessel density were evident year-round near many coastlines,
        along inter-continental trade routes, and at hubs of commercial shipping near port entrances.
        Gray whales were exposed to vessel strikes throughout their range and in their feeding, south-
        bound migration, wintering, and northbound migration periods. Areas of apparently high risk
        were in the Russian Far East (Kamchatka peninsula and Okhotsk Sea), Bering Sea (including the
        Aleutian Islands), Gulf of Alaska, and along the entire west coast of North America. Risk appeared
        greatest during south- and northbound migration when much of the gray whale population is
        moving through waters near shore. Tanker, container, and bulk-carrier ships represent consider-
        able risk to whales in the North Pacific Ocean, but the large geographical extent of commercial
        fishing activities suggests that fisheries are also a substantial source of risk. Vessel-strike risk
        maps indicate the relative extent of exposure of gray (and other) whales to underwater vessel
        noise. The number of gray whales killed by ship strikes each year may be in the tens, or perhaps
        the low hundreds. Additional analyses, including quantitative assessments, are warranted to fur-
        ther clarify the risk of vessel strikes to gray whales.

        KEY WORDS: Vessel-strike risk · Gray whale · Eschrichtius robustus · Ship strike · Vessel traffic ·
        Spatio-temporal co-occurrence

                     1. INTRODUCTION                               2015, Thomas et al. 2016). In some endangered or de-
                                                                   pleted whale populations, such as the North Atlantic
  All species of large whales are susceptible to being             right whale Eubalaena glacialis (Kraus et al. 2005,
struck by vessels (Clapham et al. 1999, Van Waerbeek               Vanderlaan & Taggart 2007), deaths due to ship strike
et al. 2007) and vessel (or ship) strike is regarded as            have been sufficiently frequent to limit population
an important conservation concern for most of the                  growth (Cates et al. 2017).
populations that are recovering from commercial                      In the North Pacific Ocean (NP), fatal or debilitat-
exploitation (Bettridge et al. 2015, Monnahan et al.               ing ship strikes have been most commonly reported,
                                                                   © G. K. Silber, R. R. Reeves, T. J. Moore and, outside the USA, the
*Corresponding author: gregsilber2@gmail.com                       US Government 2021. Open Access under Creative Commons by
                                                                   Attribution Licence. Use, distribution and reproduction are unre-
                                                                   stricted. Authors and original publication must be credited.
                                                                   Publisher: Inter-Research · www.int-res.com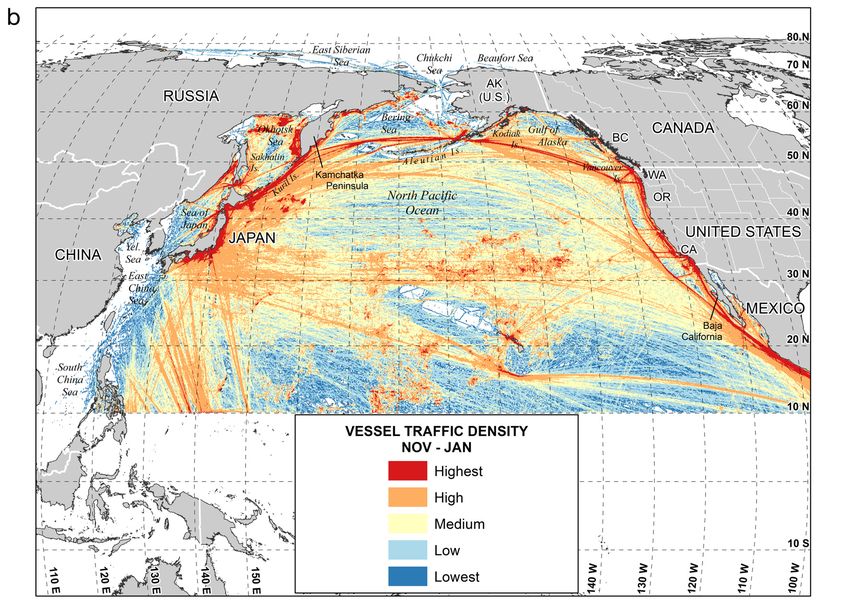
178                                        Endang Species Res 44: 177–201, 2021

in descending order, for gray Eschrichtius robustus,            Another UME began in 2019 and continued into 2020
humpback Megaptera novaeangliae, fin Balaenop-                  (https://www.fisheries.noaa.gov/national/marine-life-
tera physalus, and blue whales B. musculus (Jensen              distress/2019-2020-gray-whale-unusual-mortality-
& Silber 2003). Ship-strike risk has been modeled for           event-along-west-coast#gray-whale-strandings).
each of these species (except gray whales) in specific            The distribution of gray whales shifts seasonally.
portions of the NP (e.g. Williams & O’Hara 2010, Red-           In spring, they migrate northward primarily along
fern et al. 2013), but in all cases, the range-wide ef-         coastal margins to relatively high-latitude feeding
fects of vessel-strike mortality (and morbidity) on             grounds. A reverse migration to wintering areas
abundance and population growth are uncertain.                  takes place in late autumn and winter using similar
Nevertheless, in the last decade or more, many spe-             corridors (Rice & Wolman 1971, Swartz 2018). From
cies of whales in the NP that were depleted by com-             June through October, ENP gray whales feed in
mercial whaling have shown steady increases in abun-            areas that include coastal portions of the Bering,
dance despite ever-increasing non-whaling threats               Chukchi and Beaufort Seas (Weller et al. 2002, Swartz
from vessels and other human activities (Bettridge et           2018). A small component of the ENP population
al. 2015, Thomas et al. 2016).                                  (called the Pacific Coast Feeding Group, PCFG)
   In the western NP (WNP), gray whales were heav-              occupies coastal foraging areas between British
ily exploited and close to extinction by the 1960s              Columbia (Canada) and parts of Washington, Ore-
(Bowen 1974, Weller et al. 2002). Although the small            gon, and northern California (USA) (Ford et al. 2013,
population of about 200 whales that feeds off Sakhalin          Calambokidis et al. 2019). The primary known feed-
Island, Russia, during the summer and autumn has                ing areas for WNP gray whales are on the northeast-
been increasing slowly since the late 1990s, it is              ern Sakhalin Island shelf in the Russian Far East and
listed as an Endangered sub-population on the IUCN              to a lesser degree in nearshore waters of southeastern
Red List (Cooke et al. 2018). The population is also            Kamchatka (Weller et al. 2002, Tyurneva et al. 2010).
listed as endangered under the US Endangered Spe-                 Southward-migrating gray whales are found
cies Act and designated as depleted under the US                throughout the Bering Sea, in parts of the Okhotsk,
Marine Mammal Protection Act. In April 2020, the                Chukchi, and Beaufort Seas, and in the Gulf of Alaska.
Red Data Book of the Russian Federation listed the              They are also relatively abundant along parts of the
‘Okhotsk Sea population of the gray whale’ as criti-            North American coastline.
cally endangered (Reeves et al. 2020).1                           Gray whale wintering areas are largely limited to
   While some of the gray whales that feed off Sak-             south of 32° N latitude. Large numbers of whales
halin migrate in winter to the eastern NP (ENP), oth-           aggregate annually in shallow wintering lagoons or
ers appear to remain in the WNP and, based on                   embayments along the west coast of Baja California,
photo-identification matches, migrate at least as far           Mexico (Rice & Wolman 1971, Swartz 2018). The spe-
south as northern Japan (Weller et al. 2008, 2015,              cies is less common, but is known to occur, in the
2016). Recovery of gray whales in the WNP is a long-            Gulf of California and along mainland coast of Mex-
term conservation aspiration of the IUCN, the Inter-            ico south to about 15° N latitude (Swartz 2018). Win-
national Whaling Commission (IWC), international                tering areas in the WNP are less well studied and
non-governmental organizations, and some govern-                there is uncertainty about where they are and how
ments and stakeholders in the relevant range states             many whales visit them (Weller et al. 2002, 2016).
where gray whales occur.                                          Gray whales occur primarily, but not entirely, on or
   The abundance of gray whales in the ENP was esti-            near the continental shelf and in coastal waters dur-
mated to be nearly 27 000 in 2016 (Durban et al. 2017,          ing much of the year (Guazzo et al. 2017). Parts of
IWC 2018). The population grew through at least the             their migration routes pass near large human popu-
late 1990s (Punt & Wade 2012) followed by a decline             lation centers and through areas with substantial
in 1999−2000 due to an ‘unusual mortality event’                maritime activities (e.g. Moore & Clarke 2002, Weller
(UME) of unknown cause (Gulland et al. 2005). The               et al. 2002, Calambokidis et al. 2015), creating a seri-
population subsequently recovered, returning to its             ous risk of injury or death from vessel strikes.
highest recorded abundance (Durban et al. 2017).                  Records of vessel-strike deaths and serious injuries
                                                                of gray whales are compiled and reported annually
1
 Order of the Ministry of Natural Resources and Environ-        in some locations (e.g. Carretta et al. 2018, Scordino
ment of the Russian Federation from 24 March 2020 No. 162
                                                                et al. 2020). Multiple instances of strikes are reported
‘On approval of the list of fauna objects included in the Red
Data Book of the Russian Federation’, ratified by the Min-      every year. However, the data are limited primarily
istry of Justice on 02.04.2020, effective from 12.04.2020       to jurisdictions where regular reporting systems are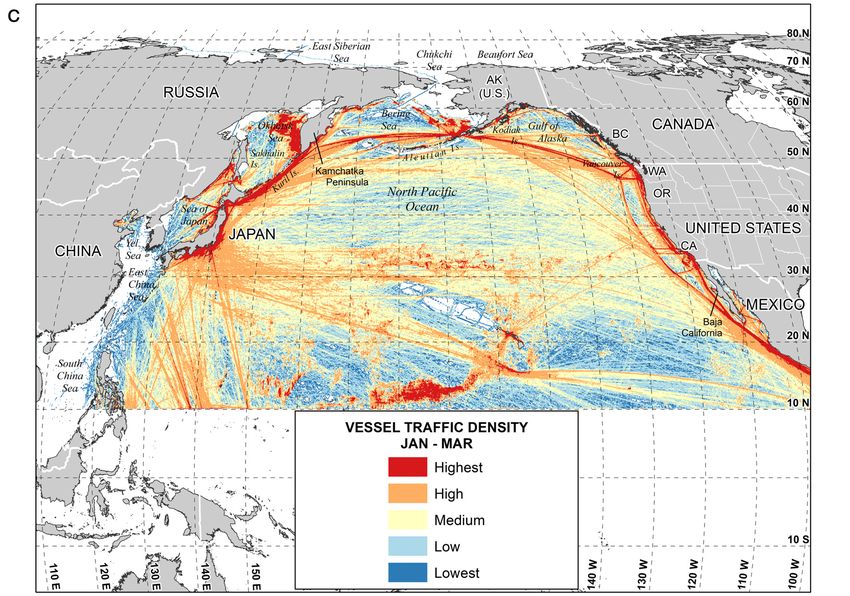
Silber et al.: Gray whales and ship traffic                                        179

in place (e.g. the US Marine Mammal Health and               data. We transformed this linear feature in ArcGIS to
Stranding Response Program, www.fisheries.noaa.              vector polygons by using the Buffer Tool and a 10
gov/national/marine-life-distress/marine-mammal-             nautical mile (n mile) geodesic distance on each side.
health-and-stranding-response-program; and the               Depending on the original placement of the linear
Marine Mammal Response Program under Canada’s                feature in the KML-formatted data relative to the
Species at Risk Act, www.dfo-mpo.gc.ca/species-              coastline, this produced a roughly 20 n mile wide
especes/mammals-mammiferes/program-programme/                migration corridor (this band was somewhat wider in
index-eng.html) and thus do not represent the true           some areas where adjustments were necessary to
scale and geographical extent of strikes. Further,           extend the polygon to the coastline).
most records of vessel-struck large whales come                 The volume and distribution of vessel traffic coincid-
from stranded carcasses (Laist et al. 2001, Jensen &         ing with the occurrence of gray whales in the NP were
Silber 2003), but carcass detection and reporting are        derived from Automatic Identification System (AIS)
undoubtedly incomplete (Kraus et al. 2005, Punt &            data. The International Maritime Organization (IMO)
Wade 2012, Rockwood et al. 2017).                            requires AIS capabilities on all vessels of 300 gross
   This paper provides a qualitative assessment of the       tons (GT) and greater that make international voyages
range-wide risks posed to gray whales by vessels.            and all vessels 150+ GT that are carrying 12 or more
The approach used was to compare patterns of whale           passengers on an international voyage.3 Therefore,
distribution with heat maps of the density of vessel         we assume that our data include trip information for
traffic seasonally throughout the NP in 2019. This           all vessels ≥ 300 GT due to the IMO carriage require-
analysis was used to determine where the risks are           ments. The data also include vessels smaller than this
likely most acute and therefore where more detailed,         tonnage threshold because some vessels transmit AIS
focused efforts at quantitative risk assessment, fol-        signals for safety-of-navigation purposes.
lowed by risk reduction and mitigation measures,                A vessel with AIS capabilities broadcasts messages
might be warranted.                                          containing information on its identity and character-
                                                             istics, as well as messages containing its position,
                                                             speed, and direction of travel using low-power, very
                   2. METHODS                                high-frequency radio signals (Tetreault 2005, Ro-
                                                             bards et al. 2016). For this analysis, we used satellite
   Gray whale range data were extracted from source          AIS data obtained from ORBCOMM for the full cal-
data associated with published maps showing gener-           endar year 1 January to 31 December 2019 for the NP
alized patterns of the occurrence and movements of           between 10 and 80° N latitude.
gray whales during the 4 main (and overlapping) sea-            AIS signals generally include information about
sons of their annual cycle: summer−autumn feeding            vessel type and size. However, given that our intent
(June−October), southbound migration (November−              was to characterize strike risk from all vessel types
January), wintering (January−March), and north-
bound migration (February−May) (IWC 2017)2. The
                                                             2
4 seasons were defined on the basis of general refer-         These maps were produced under the joint aegis of the Sci-
                                                             entific Committee (SC) of the International Whaling Com-
ences on gray whale phenology (e.g. Rice & Wolman            mission and the Western Gray Whale Advisory Panel of
1971, Rugh 1984, Swartz 2018). The periods used in           the IUCN. Their content was based on review of literature
the analysis are imprecise and are dynamic to some           and elicitation of expert knowledge during SC and IUCN
degree in both space and time, but generally capture         workshops. They are also available at: https://www.iucn.
                                                             org/western-gray-whale-advisory-panel/about-gray-whales/
the annual migration cycles of gray whales. The maps         rangewide-conservation-issues; and at https://iwc.int/
depicting 2019 vessel traffic and associated vessel-         western-gray-whale-cmp
strike risk were aligned with these same seasonal/be-        3
                                                               The US Coast Guard expanded the IMO mandate by
havioral periods.                                            requiring AIS on vessels that operate in US waters and meet
   ArcGIS Desktop software (version 10.7.1) was used         the following criteria: self-propelled vessels 20+ m (65+ feet)
                                                             in length engaged in commercial service, towing vessels
to perform data conversion from Keyhole Markup               8+ m (26+ feet) in length with more than 600 horsepower
Language (KML) format to vector features in the file         engaged in commercial service, and self-propelled vessels
geodatabase format. Most of the source data for gray         certified to carry more than 150 passengers (33 [US]CFR
whale distributions were represented by geographi-           §164.46). In May 2019, Canada expanded AIS carrying re-
                                                             quirements to include vessels carrying more than 12 passen-
cal areas (i.e. polygonal data). However, the migra-         gers or vessels 8 m or more in length and carrying passengers.
tion corridor along the WNP coastline was represented        https://tc.canada.ca/sites/default/files/migrated/ssb_09_
by an offshore linear feature in the KML-formatted           2019e.pdf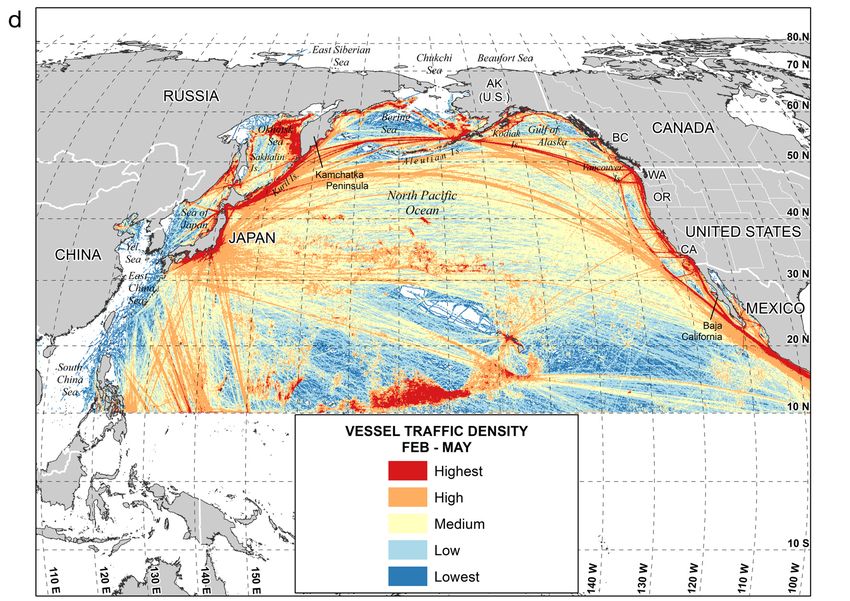
180                                     Endang Species Res 44: 177–201, 2021

based solely on overlap of whales and vessel traffic,       equal-area projection (Brodzik et al. 2014). For each
no attempt was made to analyze ancillary informa-           cell, the cumulative amount of time (operational
tion regarding vessel types. Nonetheless, it is possi-      hours) spent by all vessels was calculated by sum-
ble to draw inferences about vessel type based on           ming the elapsed time associated with all vessel tran-
features of route and traffic patterns depicted in          sit segments (geometric features created by connect-
heat maps. For example, fishing operations could be         ing temporally adjacent AIS transmissions) located
inferred from clusters of relatively intense vessel         within the grid cell. Elapsed times were interpolated
activity that do not exhibit clear ‘point A to point B’     for transit segments that crossed grid-cell boundaries
transits that are characteristic of shipping routes.        using the ratio of the transit-segment distance lo-
Fishery activities were also inferred from various          cated within the respective grid cells (i.e. distance
published sources (e.g. FAO 2017, Lowry et al. 2018).       within cell/transit segment distance). While vessel
Seismic surveys and research cruises can be evi-            characteristics such as vessel type, size, gross ton-
dent as systematic grid lines in a finite area; and ves-    nage, speed, and country of registration are included
sel activity associated with oil and gas development        in AIS messages, our intent was to characterize strike
can be inferred around known facilities and plat-           risk from all vessel types based solely on overlap of
forms (e.g. Sakhalin; Reeves et al. 2005, IUCN              whales and vessel traffic. As such, no attempt was
2020). Accordingly, heat maps were used in general          made to parse vessel traffic by vessel characteristics
descriptions of activities of various vessel types and      such as vessel type or size.
the risk those vessel types represent, as discussed            The gridded, monthly cumulative operational
in Section 3.1 below.                                       hours were then summed for each of the 4 periods
   Raw AIS data were decoded into monthly comma-            noted earlier. Some of the periods have overlapping
separated value files using the Transview (TV32)            months, and all periods have a different number of
software application developed by the US Depart-            total days (feeding = 153, wintering = 90, northbound
ment of Transportation’s Volpe National Transporta-         migration = 120, southbound migration = 92), so the
tion Systems Center (www.volpe.dot.gov). These              cumulative operational-hours value in each grid cell
data were then imported into a spatially enabled            was normalized by the number of days in the period.
PostgreSQL database. For this analysis, any AIS             These daily means for each grid cell were then log-
transmissions that indicated vessel speeds of less          transformed, which resulted in a normal distribution
than 0 knots or greater than 50 knots were removed,         of vessel traffic data across the NP grid for each
as those data obviously contained errors. Temporally        period.
adjacent AIS transmissions belonging to the same               To characterize the vessel-traffic density distribu-
vessel were aggregated into transits if the time            tion spatially throughout the NP, we used 5 classes in
elapsed between the transmissions was less than 4 h.        ArcGIS generated by the natural breaks method (or
If the elapsed time was greater than 4 h, a new vessel      Jenks optimization method). The breakpoints are
transit was started. The geometric distance between         standardized for all periods, to ease cross-period
adjacent transmissions in a transit was checked             comparisons, based on the values from the wintering
against a computed distance value obtained using            period. We also projected the data using the Equal
the elapsed time and rate of speed between the 2            Earth Asia Pacific projection (EPSG: 8859), with a
transmissions. If the difference between the geomet-        modified central meridian of 180°, for better presen-
ric and computed distance exceeded 5 n miles per            tation oriented for the Pacific Ocean basin, while
hour of travel, the segment resulting from joining the      continuing to preserve area designations with equal-
adjacent transmissions was flagged and removed              area characteristics.
from the final analysis because the reported raw data          Assessments of relative risk were performed by
likely contained an error.                                  focusing attention on the regions where gray whales
   Shortcomings in the vessel data set for the East         were expected to have some level of exposure to ves-
China, South China, and Yellow Seas are described           sel traffic based on known, possible, or historical use
in Section 4. Nonetheless, these areas were included        patterns documented in the literature. An acknowl-
in vessel density and risk maps using a demarcation         edged limitation of this analysis is a paucity of fine-
set at 10° N latitude, northward, to accommodate            scale data on the spatial occurrence of gray whales in
possible gray whale occurrence basin-wide.                  some locations. A reliance on generalized maps of
   Monthly vessel-traffic data were summarized into         seasonal whale occurrence (i.e. where whales might
10 × 10 km grid cells using the EASE-Grid 2.0 North-        be expected to occur) was a means to generate qual-
ern Hemisphere, Lambert Azimuthal (EPSG: 6931)              itative assessments of risk.
Silber et al.: Gray whales and ship traffic 181
We used the Clip Tool in ArcGIS to extract the involving long transits, concentration near major
vessel traffic data (documented in Fig. 1) that over- transportation centers, and clustering of commercial
laid these seasonally relevant gray whale regions. fishing operations.
The same breakpoints used for the vessel-traffic dis- While our study focused on the risk of vessel
tribution mapping were the basis for this relative- strikes, areas of high vessel-strike risk also indicate
risk mapping, except that the data from the bottom where gray whales are most exposed to elevated
3 classes were collapsed into 1 class and the afore- underwater noise from vessels. In addition, the ves-
mentioned highest class was split into 2 classes sel-density maps provide indications of vessel-strike
(very high and extremely high) based on a new risk to other baleen whale species whose ranges
breakpoint value that was defined as the mean plus overlap with high-density vessel traffic.
3 standard deviations. Few places in the entire area
examined where gray whales are known to occur on
a regular basis had little or no vessel activity. There- 3.2. Feeding areas
fore, to account for varying exposure scenarios for
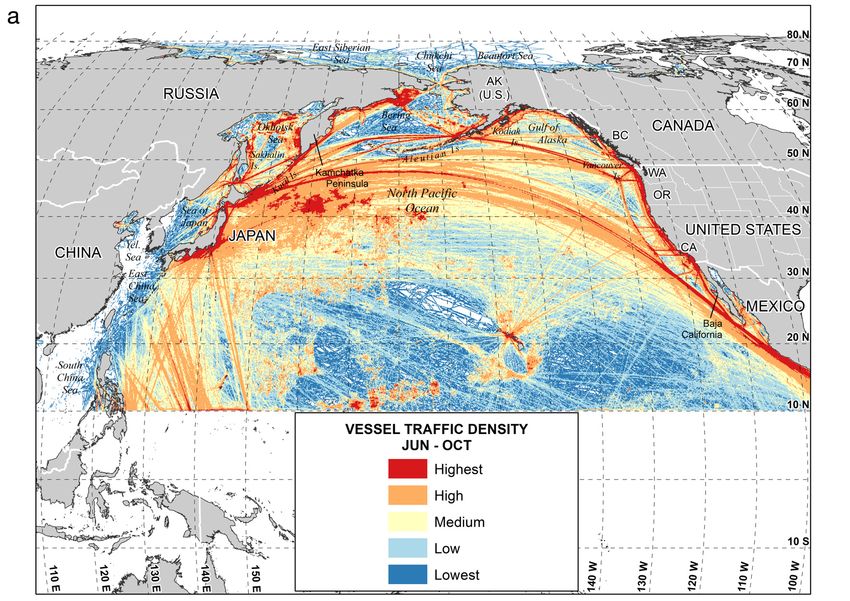
gray whales based on geographic uncertainty, we Overall, the volume of vessel activity appeared
differentiated the risk classification based on known highest during the feeding season, with very high
whale-use areas versus potential whale-use areas densities along nearly all Asian and North Ameri-
(the latter category representing areas deemed to can coastlines (Fig. 1a). Notably high concentrations
have probable, possible, occasional, or historical of vessel activity were evident along the Kamchatka
whale presence). These data provided an ordinal peninsula, in other portions of the Okhotsk Sea, and
ranking of relative vessel-strike risk based on the in the western Bering Sea. In the ENP, vessel activ-
likelihood of co-occurrence of vessel traffic and gray ity was most pronounced along portions of the
whales (see Table A1 in the Appendix for additional Alaskan coastline and the entire British Columbian
detail on category designations). and western US seaboards. Traffic in the central
NP, Bering Sea, and southern Gulf of Alaska was
dominated by vessels engaged in trips between
3. RESULTS Asian and North American ports, and such traffic
appeared heavier in the feeding period than in the
3.1. Vessel-density and risk maps others. Coastal portions of the Chukchi and western
Beaufort Seas also exhibited relatively high vessel
Vessel traffic was extensive throughout the entire densities.
NP in 2019 (Fig. 1), as thousands of vessels made tens High-risk locations during the feeding period were
of thousands of trips. Few places in the entire area observed in the western Bering Sea and along the
examined had little or no vessel activity. Vessel- east coast of the Kamchatka peninsula (Fig. 2a,b). An
traffic densities were high along nearly all Asian and area of relatively high risk was also evident off north-
North American mainland coastlines as well as a num- eastern Sakhalin Island (Fig. 2a). A region extending
ber of insular areas. High-density hubs of commer- seaward hundreds of kilometers from the Chukotka
cial shipping near port entrances and inter-continental and northeastern Kamchatka coasts was among
trade routes were evident year-round. Concentra- the areas of highest risk and largest spatial extent
tions of geographically vast vessel activity attributa- (Fig. 2b). Risk appeared to be very high off Kodiak
ble primarily to large-scale regional shipping, com- Island and along the coasts of Vancouver Island and
mercial fishing, and industrial operations were the northwestern US mainland (Fig. 2c). Areas of
situated on continental shelves (Fig. 1). moderate risk were located around the other British
Alignment of whale and vessel distribution indi- Columbian islands and in southeast Alaska.
cated that the risk of vessel strikes to gray whales Except for a few locations, vessel transits in most of
exists throughout the range and during all phases of the northern Bering Sea and in the Chukchi and
the annual cycle: migration, feeding, and wintering Beaufort Seas apparently pose only a moderate risk
(Fig. 2). However, the relative degree of risk differed to gray whales during this season. However, rela-
spatially and temporally, corresponding to whale tively small pockets of high risk were indicated along
movement patterns and areas of seasonally high the Russian Chukchi Sea coastline and in nearshore
whale density. Overall, risk appears highest during waters of Norton Sound, Kotzebue Sound, and else-
north- and southbound migration owing to the co- where along the western and northern Alaska coast-
incidence of whale occurrence and vessel activities lines (Fig. 2b,c).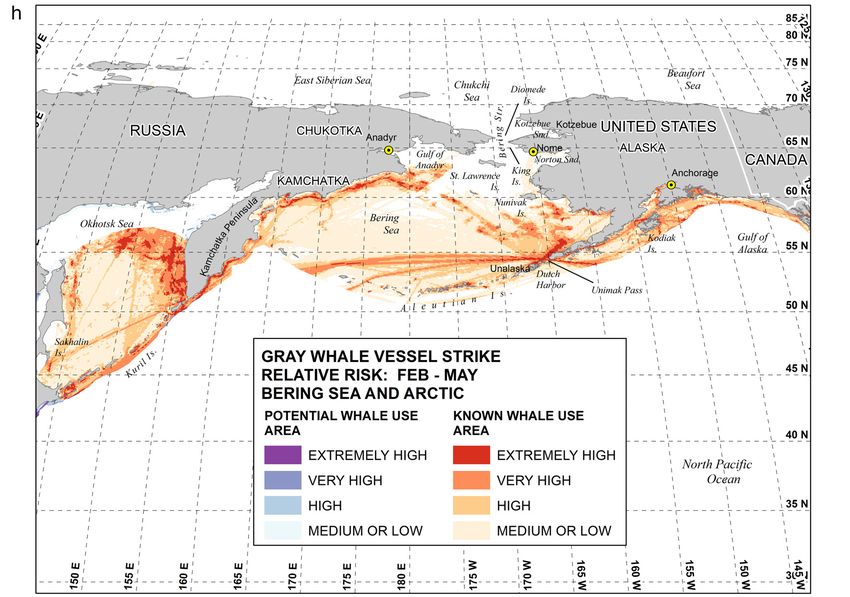
182                                         Endang Species Res 44: 177–201, 2021

                                                                                                                               Fig. 1 continued on next page

Fig. 1. Relative densities of vessel activity in 2019 shown as hours of operation per 10 × 10 km grid cell. Traffic densities are
roughly aligned with the gray whale annual migration cycle: (a) summer−autumn feeding (June−October), (b) southbound migra-
tion (November−January), (c) wintering (January−March), and (d) northbound migration (February−May). (See Section 2 for
additional description of the location and timing of these periods.) The scale codes for vessel operational hours range from 0 h
(white) to maximum activity (red). See Table A1 in the Appendix for divisions used for numerical vessel activity density classes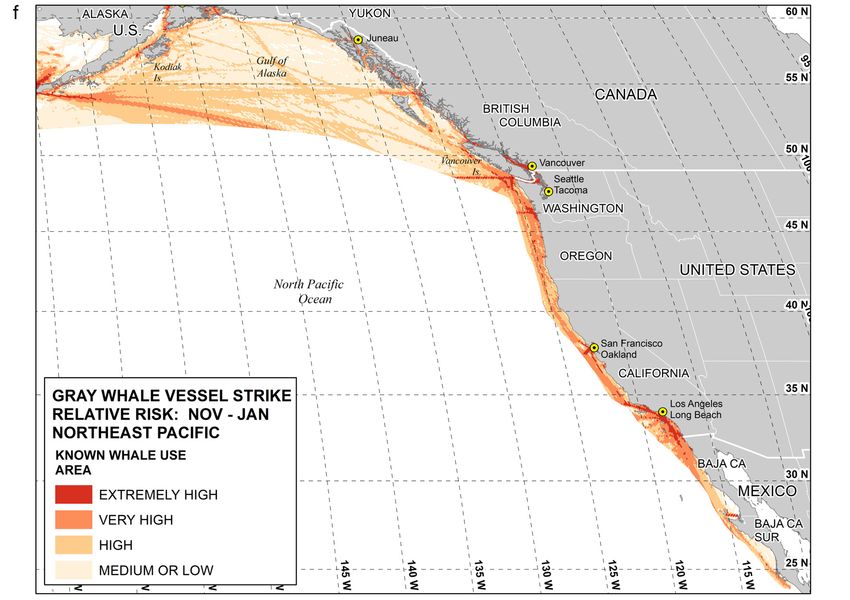
Silber et al.: Gray whales and ship traffic   183

            Fig. 1 continued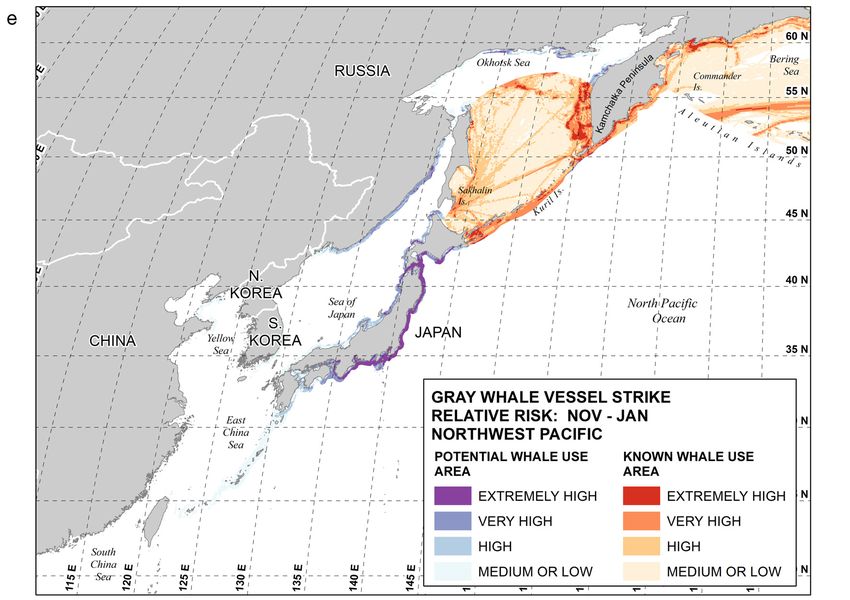
184 Endang Species Res 44: 177–201, 2021
Fig. 2 continued on next 4 pages
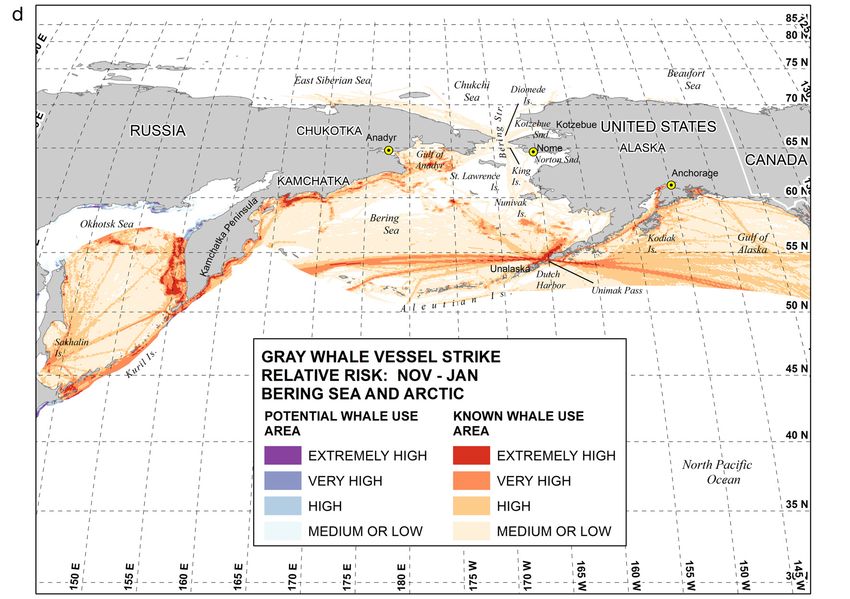
Fig. 2. Region-scale maps of relative vessel-strike risk to gray whales during feeding, wintering, and north- and southbound
migration periods: (a) Russian Far East during the feeding period (June−October), (b) Bering and Chukchi Seas during the
feeding period (June−October), (c) eastern North Pacific during the feeding period (June−October), (d) Bering and Chukchi
Seas, western and central North Pacific, and the Gulf of Alaska during southbound migration (November−January), (e) west-
ern North Pacific during southbound migration (November−January), (f) eastern North Pacific during southbound migration
(November−January), (g) eastern North Pacific during the wintering period (January−March), (h) Bering and Chukchi Seas,
western and central North Pacific, and Gulf of Alaska during northbound migration (February−May), (i) western North Pacific
during northbound migration (February−May), and (j) eastern North Pacific during northbound migration (February−May)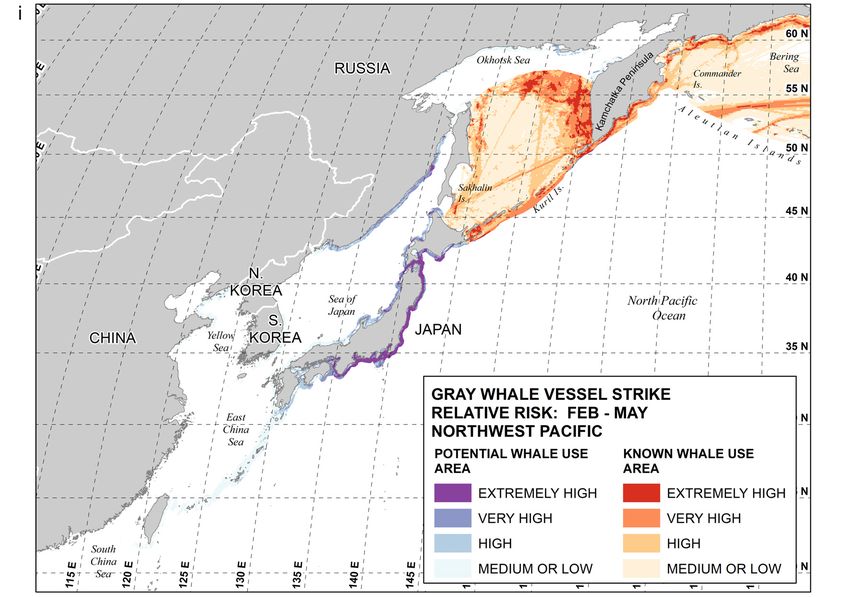
Silber et al.: Gray whales and ship traffic   185

            Fig. 2 continued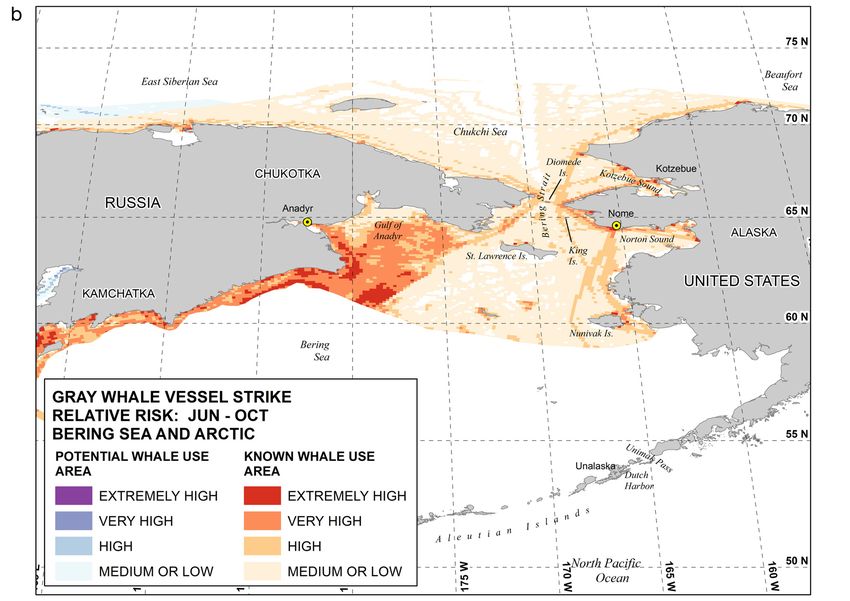
186   Endang Species Res 44: 177–201, 2021

                Fig. 2 continued
Silber et al.: Gray whales and ship traffic 187
Fig. 2 continued188 Endang Species Res 44: 177–201, 2021
Fig. 2 continuedSilber et al.: Gray whales and ship traffic 189
3.3. Southbound migration be relatively high-risk to the extent that gray whales
occur there in any density. Little could be determined
Overall vessel distribution during the southbound or inferred concerning vessel-strike risk in Southeast
migration period generally paralleled that during the Asian waters because the AIS data are limited there
feeding period, but densities were somewhat dimin- (Fig. 1c) and gray whale wintering locations there (if
ished. Waters near Japan, around the Kuril Islands, any at present) are not well defined. However, vessel
in portions of the Bering Sea, and along the coast of traffic is known to be heavy in Southeast Asia, and
North America again featured the highest vessel given the size of fishing and commercial fleets oper-
densities (Fig. 1b). There was less use of interna- ating in the region, the few gray whales that may
tional trade routes across the central NP than in the occur there would be at high risk.
feeding period. Discrete areas of very heavy traffic
volume were shown in the Okhotsk Sea, along the
west coast of Kamchatka, and in the eastern and 3.5. Northbound migration
central Bering Sea. Vessel densities were also very
heavy along the entire US coast. Once again, we found very high vessel densities in
Overall, the southbound (and northbound) migra- the coastal waters of Japan and along the Kuril
tion periods had the greatest relative risk of vessel Islands in this period (Fig. 1d). Dense and geograph-
strikes. Whales were exposed to major intercontinen- ically broad bands of activity were evident in Russian
tal shipping routes in the southern Bering Sea and waters of the western Bering Sea. Except for this con-
Gulf of Alaska (Fig. 2d,h). Vulnerability also ap- centrated activity in the western Bering Sea, the traf-
peared to be high near the Kuril Islands and Sakhalin fic in the Bering Sea as a whole appeared to be less
Island and along the Russian coastline of the western in this period than at other times. Vessel activity in
Bering Sea (Fig. 2d,e,h,i). Areas of high risk included the Okhotsk Sea was again very heavy, but its distri-
waters near large port entrances on the North Amer- bution appeared to shift eastward and northward rel-
ican coastline such as Vancouver, Seattle, San Fran- ative to other periods. Long-distance trips bisecting
cisco-Oakland, and Los Angeles-Long Beach. the southern Bering Sea and southern Gulf of Alaska
and crossing the central NP were once again evident.
In the ENP, vessel activity levels were high in coastal
3.4. Wintering areas areas along much of southern Alaska and along the
coastlines of the Gulf of Alaska. Vessel densities
In the wintering period, vessel densities were very were also high near and along the coasts of Canada,
high along the coast of Japan and around the Kuril Is- the USA, and Mexico.
lands, as was also true off the coast of North America Concentrations of relatively high vessel-strike risk
including mainland Mexico (Fig. 1c). Areas of very were identified along parts of the Kuril Island chain
dense traffic occurred in the north-central Okhotsk and the south coast of Kamchatka, in portions of the
Sea and along the western Kamchatka peninsula. Okhotsk Sea and the southern Bering Sea, and near
Similarly dense areas were evident north of the Aleu- the Aleutian chain (Fig. 2h,i), much like the south-
tian Islands and extending into the central and south- bound migration. Risk also appeared to be high in
ern Bering Sea. Central NP arcs of international ship some parts of southeast Alaska. Gray whales were
transits were reduced relative to summer densities in definitely at risk in areas of high vessel density along
this period, although the long-distance routes inter- the entire coast of North America, especially in Wash-
secting the Aleutian chain and extending into the ington, Oregon, and California waters and at port
southern Bering Sea were still heavily traveled. Heavy entrances (Figs. 1d & 2j).
ice cover in high latitudes restricts most types of mar-
ine transport at this time of the year. Only limited ves-
sel activity was recorded in the Chukchi and Beaufort 4. DISCUSSION
Seas and parts of the northern Bering Sea (Fig. 1d),
presumably because of sea-ice cover and other inhos- 4.1. Use of AIS data
pitable maritime navigation conditions.
Risk appeared limited primarily to areas near the Although AIS was initially conceived as a technol-
Baja California wintering lagoons and along portions ogy to reduce at-sea collision risk for ships, the trans-
of the western Baja California peninsula (Fig. 2g). missions are widely accessible and have been used
Parts of the Mexican mainland coast also appeared to in a variety of other maritime safety and environmen-190 Endang Species Res 44: 177–201, 2021 tal protection applications (Robards et al. 2016). Con- sonably accurate assessment of risk at the broad geo- stellations of low-orbiting microsatellites now allow graphical scale of this study. Regardless of any data acquisition of AIS transmissions from around the limitations, it is plainly evident that the risk of vessel world and provide a near-census of vessel movements strike is high in many locations throughout the range anywhere on the globe (Høye et al. 2008, Wu et al. of gray whales and at all times of the year. 2017). Archived data enable retrospective analyses on a variety of subjects involving vessel movements (Robards et al. 2016). 4.2. Feeding areas However, the system is not perfect. Very large data sets can present processing challenges. As the vol- 4.2.1. WNP ume of signals transmitted by vessels increases, such as in or near coastal areas, so too does the difficulty of Areas of extremely high relative risk during the processing satellite AIS data. This can result in data feeding period in the WNP (Fig. 2a,b) likely result gaps leading to underrepresentation of vessel traffic primarily from fishing, industrial, and coastal ship- (Carson-Jackson 2012). In most cases, on-board pro- ping operations. Vessels suspected of being associ- cessing capabilities on satellite platforms are suffi- ated with Sakhalin Island oil and gas activities ap- ciently robust to provide a data set suitable for analy- pear evident on the eastern Sakhalin coast. Clusters ses of large-scale vessel movement. of vessel activity are also evident along much of the AIS equipment (Class B transponders) used by eastern Kamchatka coast (Fig. 2a). Concentrations of smaller vessels (e.g. less than 300 GT or ~20 m [65 feet] fishing activity in the western Bering Sea (Fig. 2b) in length) frequenting coastal areas, including por- are discussed more fully in Section 4.6. tions of our study area, transmit a weaker signal that is often missed by satellites (Taconet et al. 2019). The result is that some signals are dropped or are inter- 4.2.2. ENP mittent (Wu et al. 2017). Finer-scale analyses that in- clude coastal areas would likely benefit from incor- Extremely high-risk areas along the coast of North porating AIS data received by networks of land- America (Fig. 2c) are attributable mainly to large based stations, which are better suited to handle large commercial ships near major ports (e.g. Dransfield et volumes of transmitted data and are better situated al. 2014, Moore et al. 2018) (see Section 4.5 for more to receive the signals from smaller vessels. discussion on this topic). The small PCFG (about 250 A particular concern is that our analysis revealed a individuals) (Calambokidis et al. 2019) appears to be paucity of vessel data in some locations of interest, no- exposed to heavy traffic in the form of commercial tably the East China, South China, and Yellow Seas, ships (Lagerquist et al. 2019), coastal ferries, and and to a somewhat lesser extent, the Sea of Japan other vessels (Fig. 2c). These whales may also be at (data gaps are apparent in Fig. 1). We attribute this to risk of strikes by military vessels and in the future by a variety of factors, including the widespread use (es- vessels engaged in servicing renewable energy and pecially aboard fishing vessels) of ‘Class B’ AIS trans- other facilities near their feeding areas from northern mitters which have inherently lower transmitting power California to British Columbia (Ford et al. 2013, than ‘Class A’ systems (Taconet et al. 2019, DHS 2020) Lagerquist et al. 2019). thereby limiting detection by satellites. In addition, Risk also appeared to be very high near Kodiak not all small fishing vessels in the East China, South Island (Fig. 2c) and in surrounding waters. This was China, and Yellow Seas broadcast AIS signals (Grande likely related to coastal vessel traffic and fishing et al. 2019). Moreover, some vessels choose not to use activities. Scores of commercial and charter fishing their equipment in order to conceal their activities vessels home-ported at Kodiak and Dutch Harbor (Poling 2019, Weimerskirch et al. 2020). As noted ear- (Unalaska) and targeting Bering Sea species (With- lier, high transmission volumes can occur in some lo- erell et al. 2012) may account for much of the activity cations, such as the East China Sea, where multiple in this area. units in close proximity are transmitting simultane- ously, and this can result in incomplete data sets and create challenges in satellite-based processing which 4.2.3. Chukchi, East Siberian, and Beaufort Seas lead to a loss of data (Carson-Jackson 2012). However, given our interest in relative vessel-strike risk to The occurrence of gray whales in the Chukchi, East whales, we are confident that AIS data provide a rea- Siberian, and Beaufort Seas tends to be geographi-
Silber et al.: Gray whales and ship traffic                                 191

cally dispersed, and vessel traffic in these regions              volume container-ship traffic contributes consider-
appears light relative to other parts of the study area.          able risk along the west coast of North America, par-
Relatively high-risk areas in portions of the Chukchi             ticularly at major port entrances (Fig. 2f,j). For exam-
and western Beaufort Seas appear to be restricted pri-            ple, ports in southern California are among the
marily to small-port entrances and concentrations of              busiest in the world. Commercial fisheries, and pos-
coastal vessel traffic (Fig. 2b). Much of this traffic likely     sibly also vessels engaged in the transport of passen-
involves re-supply of communities (Huntington et al.              gers, goods, and supplies, apparently contribute to
2019), support for local industries (e.g. involving tugs;         high-risk zones off southeast Alaska and in the in-
Fletcher & Robertson 2016, Adams & Silber 2017),                  land waterways of British Columbia (Fig. 2f,j).
mining activities (e.g. the large Red Dog mine facility
north of Kotzebue, Alaska; Arctic Council 2009, Reeves
et al. 2014), and fishing or hunting excursions. High-                                   4.3.3. Bering Sea
latitude shipping routes, such as the Northwest Pas-
sage, the Northern Sea Route (e.g. Arctic Council                   International trade routes represent high-risk
2009, Aksenov et al. 2017), and the north−south lanes             areas in the southern Bering Sea and in the Gulf of
through the Bering Sea (IMO 2017, Huntington et al.               Alaska (Fig. 2d,h). The Unimak Pass in the Aleutian
2019), apparently pose relatively little risk to gray             Islands chain serves as a bottleneck for many vessels
whales during the feeding period under current eco-               using intercontinental routes (Schwehr & McGilli-
nomic and environmental conditions.                               vary 2007) and therefore it is also an area of high risk
                                                                  to migrating gray whales (Braham 1984, Silber &
                                                                  Adams 2019).
    4.3. Southbound and northbound migration

  Whale distribution is broadly similar in south- and                                   4.4. Wintering areas
northbound migration periods. Vessel-traffic distri-
bution and volume are also comparable (Fig. 1b,d).                                          4.4.1. WNP
Consequently, our assessment of relative risk is simi-
lar in these 2 periods. Gray whales appear to be at                  Range-wide vessel-strike risk was lowest in the
the greatest risk of vessel strike during migration,              wintering period. Some of the gray whales that feed
judging by the geographical extent and number of                  in summer near Sakhalin Island (probably
192 Endang Species Res 44: 177–201, 2021
of the refined salt is transported by barge, which may [ca. 6.1 m] equivalent container units, or TEUs), and
account for much of the risk at this location. along with Seattle, Tacoma, and Oakland/San
Areas used infrequently or in low numbers by gray Francisco comprise 5 of the 10 busiest US ports (www.
whales along the Mexican mainland (south of 20° N nglog.com/about-us/the_usas_busiest_ports) (Fig. 4).
latitude) and along the west coast of Baja California Waters in and around San Francisco Bay and the Los
have substantial vessel traffic, much of it traversing Angeles and Long Beach port entrances are among
the entire coastline of Central America (Fig. 2g). the areas with the highest risk of vessel strike for blue,
Within the Gulf of California, another area where fin, and humpback whales (Rockwood et al. 2017).
gray whales occur infrequently or in low numbers, Measures to reduce ship-strike mortality have
risk is associated with trips across the gulf to various been established on the California coast. Port-
ports (e.g. ferry and other routes joining La Paz, entrance Traffic Separation Schemes have been
Mazatlan, and Topolobampo). re-configured (Dransfield et al. 2014, Moore et al.
2018), and voluntary ship speed-reduction pro-
grams are in place (Freedman et al. 2017). These
4.5. Risk from commercial shipping measures, although not specifically aimed at pro-
tecting gray whales, likely have reduced the ves-
Fatal vessel strikes of baleen whales are most often sel-strike risk to them. In addition, in 2009, 2014,
attributed to large ships (Laist et al. 2001, Jensen & and 2015, California enacted new low-sulfur fuel
Silber 2003). Strikes for which the vessel type was standards for ships (Redfern et al. 2020); in the
known have usually involved freighters and other same period, the IMO established global and
large vessel types, including naval vessels (Scordino North American low-sulfur standards (https://www.
et al. 2020). Risk-modeling studies have illustrated imo.org/en/OurWork/Environment/Pages/Sulphur-
the vulnerability of whales (e.g. blue, fin, killer, and oxides-(SOx)-%E2 %80 %93-Regulation-14.aspx).
humpback whales) in port entrances with a high ship Vessels responded to the new requirements by
volume and in areas of substantial coastal (along- adopting routes farther from shore and traveling
shore) traffic (Williams & O’Hara 2010, Redfern et al. at significantly lower speeds (reduced speeds ap-
2013, 2020, Rockwood et al. 2017, Greig et al. 2020). pear to be a response to higher fuel prices) (Jensen
More than 10 000 transits per year were recorded at et al. 2015, Moore et al. 2018). These actions, in
the ports of Vancouver, Seattle, and Tacoma, com- turn, reduced the probability of vessel strikes for
bined (Nichol et al. 2017) where vessel strikes are a several whale species (Moore et al. 2018). Gray
clear risk to whales (Douglas et al. 2008) (Fig. 3). The whales, which occur near shore during the north-
ports of Los Angeles and Long Beach are the highest- and southbound phases of their annual migration
volume container ship ports in the Western Hemi- along the US and British Columbian coasts, have
sphere. Together, these 2 ports account for 25% of likely been exposed to less risk as a result of these
North American trade (as measured by twenty-foot changes in operating practices.
Fig. 3. An apparently healthy (uninjured) gray whale feed- Fig. 4. Vessel-struck gray whale. Injuries on the ventral sur-
ing off the Pacific coast of Vancouver Island, British Colum- face are from very large propeller blades. Intestines are par-
bia, Canada, 3 October 2015 shown here for contrast with tially extruded. 24 May 2007; San Francisco Bay, California,
the images of vessel-struck individuals. Photo credit: NOAA/ USA. Photo credit: The Marine Mammal Center (permit
NMFS Southwest Fisheries Science Center (permit 14097) 18786-02)Silber et al.: Gray whales and ship traffic 193
Our vessel data were limited for the East China, (Peel et al. 2018, Kelley et al. 2021, Scordino et al.
South China, and Yellow Seas. Nonetheless, it is rea- 2020). Strikes by fishing vessels and generally smaller
sonable to assume that the vulnerability to vessel craft might be glancing or result in propeller cuts or
strikes of the few individual gray whales that venture other types of injury that are not as often immedi-
into these seas is very high, particularly around high- ately fatal as are the blunt-trauma injuries caused
volume Asian commercial ports. According to the by large vessels (e.g. Neilson et al. 2012) (Fig. 5). Pro-
World Shipping Council, 9 of the world’s 10 highest- peller wounds from smaller vessels (Fig. 6) may ac-
volume commercial seaports (as measured in TEUs) count for up to a third of all recorded vessel strikes of
are situated in East Asia: Shanghai, Singapore, and large whales (Silber et al. 2010). Nonetheless, given
Hong Kong, among others (www.worldshipping. the number of vessels in the vast fishing fleets at sea
org/about-the-industry/global-trade/top-50-world- in areas of gray whale occurrence, our analysis sug-
container-ports). gests that strikes from this vessel class constitute a
Some of the vessels using these ports are engaged substantial threat.
in trans-oceanic voyages, employing primarily Great In coastal waters of Japan and southern Kamchatka,
Circle routes across the NP and in the Bering Sea in the Okhotsk Sea, in waters off Sakhalin Island,
(Schwehr & McGillivary 2007). These, too, represent and in the western Bering Sea (extending seaward to
avenues of high risk, primarily during the north- and
southbound migration periods and to a lesser or min-
imal extent during the feeding and wintering peri-
ods. Thousands of ships make international passages
along these routes each year (Burns & Poe 2014, Sil-
ber & Adams 2019).
In December 2018, the US Coast Guard imple-
mented routing measures in the Bering Strait and
Bering Sea to improve navigational safety and pro-
tect marine wildlife. Applying to ships 400 GT and
larger, the IMO-approved measures include desig-
nated routes for north- and southbound vessel traffic
on both sides (Russian and US) of the Diomede Is-
lands and 3 areas to be avoided in waters surround-
ing Nunivak, Saint Lawrence, and King Islands,
Fig. 5. Gray whale with partially healed wounds along the
Alaska (IMO 2017). These actions may have reduced back caused by large propeller blades. Orange coloration is
the risk of vessel strikes of gray whales during the from aggregations of ‘whale lice,’ small crustaceans in the
feeding and the north- and southbound migration family Cyamidae, that commonly infest areas with damaged
periods by concentrating generally dispersed vessel tissue. 26 June 2019; off Humboldt Bay, California, USA. Photo
credit: Jeff K. Jacobsen, VE Enterprises (permit 19091-01)
transits into designated shipping lanes. Compliance
with the measures reportedly was high in 2019
(Fletcher et al. 2020), and this is consistent with use
of these routes in the Bering Strait as they appear in
our heat maps of vessel traffic (Fig. 1a; summer).
4.6. Risk from commercial fisheries
Dense clusters of vessel activity, in contrast to the
point-to-point transits characteristic of established
shipping routes, often reflect the locations of intense
fishing activity (Natale et al. 2015). While typically
overshadowed by vessel strikes associated with large,
ocean-going container ships and tankers, strikes by
Fig. 6. Female gray whale with propeller marks from a small
fishing vessels (as well as small passenger vessels, boat. 29 March 2015; Laguna Guerrero Negro, Baja Califor-
pleasure craft, and whale-watching boats) are capa- nia, Mexico. Photo credit: Alisa Schulman-Janiger, Natural
ble of killing whales and other marine mammals History Museum of Los Angeles County194 Endang Species Res 44: 177–201, 2021 the limit of the Russian exclusive economic zone mentioned earlier, overall fishing effort is underre- (EEZ) and including the southern Gulf of Anadyr and ported because of diminished AIS capabilities in northern Kamchatka coast), the eastern Bering Sea some parts of the study area (Taconet et al. 2019), southeast of Nunivak Island, and perhaps parts of the therefore the risk of strikes by fishing vessels is northern Gulf of Alaska, gray whales appear to be likely even higher than indicated by this analysis of at particularly high risk of fishery-related strikes relative risk. during their feeding (Fig. 2b), southbound migration (Fig. 2d,e), and northbound migration (Fig. 2h,i) periods. 4.7. Risk from non-fishing industrial activities Gill nets and set-nets are used extensively in the coastal waters of Japan and the Russian Far East and High risk from industrial operations besides com- are known to be associated with gray whale entan- mercial fishing was evident in several areas. Notable glements (Lowry et al. 2018). Fleets of small motor- among these are the nearshore waters off Sakhalin ized watercraft usually support these types of fishery. Island, where oil and gas development activities, in- In addition, longline fisheries, principally for Pacific cluding platform and pipeline construction and geo- cod Gadus macrocephalus, Pacific halibut Hippoglos- physical seismic profiling, have been ongoing since sus stenolepis, Greenland turbot Reinhardtius hip- the mid-1990s (Weller et al. 2002, Reeves et al. 2005). poglossoides, and Kamchatka flounder Atheresthes Both non-renewable and renewable offshore energy evermanni, operate in these same waters at times infrastructure and operations require high levels of and in locations that correspond to areas identified in regular vessel support (e.g. Boehlert & Gill 2010, this study as having a high vessel-strike risk. Previ- Halvorsen-Weare et al. 2012); hundreds of vessel ous AIS studies have suggested that trawl fisheries trips may be needed every year to service these facil- for Alaska pollock Gadus chalcogrammus (FAO ities. In areas for which data are available, workboat 2017) and cod (Van Eynde 2017, Grande et al. 2019) vessel classes, including tugboats, logged more hours are also represented in the apparently high-risk than other vessel types in the Beaufort and Chukchi areas of the Okhotsk Sea, around the Kuril Islands, Seas (Silber & Adams 2019). The volume of vessel and within the Russian EEZ in the Bering Sea, as traffic in support of offshore energy operations is of may be purse-seine fisheries targeting small pelagic particular concern in regions where such operations species such as Japanese anchovy Engraulis japoni- are near to or overlap areas where gray whales ag- cus and chub mackerel Scomber japonicus (FAO gregate to feed (e.g. Sakhalin) or overwinter, or when 2017, NPFC 2018). The broad area of relatively high the operations intersect migratory routes. Notable risk that extends seaward to hundreds of kilometers efforts have been made by some companies to man- from the Kamchatka Krai and Chukotka coasts is age vessel routing and speed in their areas of opera- also likely linked to fishing operations (Fletcher & tion, explicitly to mitigate the risk of striking gray Robertson 2016), e.g. trawl and purse-seine fisheries whales (e.g. Exxon Neftegas Limited & Sakhalin (Grande et al. 2019). Bulk cargo-ship and tanker use Energy Investment Company Ltd 2018). of this area is also substantial (Fletcher & Robertson Although not captured in our vessel AIS data (for 2016). data-limitation reasons described above), vessel oper- Bering Sea fisheries are among the most produc- ations related to offshore oil and gas resources exist tive in the world. Fishing vessels made more trips in the East China Sea (e.g. Zhang et al. 2007, EIA (IMO 2017) and logged more hours than any other 2014) where gray whales may occur. Asia is expected vessel type in this sea (Silber & Adams 2019). Trawl to scale up its refinery capabilities through at least fisheries, mainly targeting pollock, that are active in 2050 (EIA 2019) to meet energy consumption de- the central and eastern Bering Sea and on the broad mands, which will require networks of large tankers Alaskan and narrow Canadian continental shelves moving raw and refined hydrocarbon materials. In are strongly represented in AIS studies (Iriondo et al. other areas, the transport of hydrocarbon products 2019). Longline and pot fisheries for cod and sable- contributes to the levels of ship traffic. This traffic fish (black cod Anoplopoma fimbria) are also active includes the movement of oil and natural gas (and in Alaskan waters, including important fishing other products) to refining and distribution centers grounds near Unimak Island (Witherell et al. 2012). using the Northern Sea Route across Eurasia (Bogoy- Gulf of Alaska trawl fleets target several groundfish avlensky 2013, Silber & Adams 2019). Tankers and species, including pollock, cod, rockfish Sebastes bulk carriers supporting projects in the Russian Arc- alutus, and Pacific halibut (Iriondo et al. 2019). As tic traverse various high-latitude routes that may be
Silber et al.: Gray whales and ship traffic                               195

important to whales and other marine mammals                   4.9. Potentially adverse effects of underwater noise
(Reeves et al. 2014, Huntington et al. 2019). Although
indistinct on the scale used for our maps, traces of             The focus of this study is not underwater noise.
portions of this high-latitude Northern Sea Route              However, maps of vessel activity can serve as coarse
along the Siberian coast are evident in Fig. 1a. Often         proxies for the extent of underwater ensonification
accompanied by icebreakers in Arctic waters (thereby           resulting from vessel movements (Redfern et al. 2017).
adding to the total number of ship transits), some of          Therefore, the risk maps provided here also reflect
these transport vessels are bound for Southeast Asian          levels and locations of gray whale exposure to vessel
ports (Bambulyak et al. 2015) along routes that ap-            noise. It appears that gray whales are exposed to ves-
parently contribute to comparatively high vessel-              sel noise nearly throughout their range, year-round.
strike risk (Fig. 2d,h).                                         Vessels engaged in routine passage introduce sub-
  Risk from energy transport vessels may increase in           stantial amounts of noise into the water column (Elli-
the future as global energy demands escalate. In-              son et al. 2012, McKenna et al. 2012). Population-
creased tanker traffic is expected in Puget Sound, the         level effects on baleen whales of chronic exposure to
Juan de Fuca Strait, and other inland waterways near           vessel noise are not well understood (Kight & Swad-
Vancouver and Seattle, where it will intersect impor-          dle 2011). However, it is documented that under-
tant feeding areas and the migratory corridor used by          water vessel noise can disrupt normal behavior (e.g.
gray whales.                                                   Blair et al. 2016), cause at least temporary habitat
                                                               avoidance (e.g. Castellote et al. 2012), alter intra-
                                                               population acoustic signaling behavior (Moore et al.
           4.8. Risk from military vessels                     2012, Erbe et al. 2019), and negatively affect repro-
                                                               duction (Villegas-Amtmann et al. 2015, 2017).
   Strikes of large whales by military vessels have              As is the case with other baleen whale populations,
been reported in US and Canadian waters fairly                 exposure of gray whales to underwater noise may
often relative to other vessel types (Jensen & Silber          result in displacement from prime habitat (Moore &
2003). The data are skewed relative to other vessel            Clarke 2002) or impaired communication among
types, however, because in the USA, military vessels           individuals, which may compromise vital social inter-
are required to report whale strikes as a condition of         actions (Burnham & Duffus 2019), including those
permitting certain naval exercises. Military vessels           essential for reproduction (Dahlheim & Castellote
accounted for a portion of gray whale fatalities (where        2016).
ship type was known) in records from US waters
(Scordino et al. 2020) and it is reasonable to assume
that strikes also occur in the EEZs of other nations.                    4.10. Population-level implications
   Large military installations exist in many locations
around the NP, including the Puget Sound Naval                   Annual compilations of records of gray whale
Shipyard (Washington) and Naval Base Ventura County            deaths and serious injuries in US waters (e.g. Car-
(California) (e.g. Lagerquist et al. 2019). On occasion,       retta et al. 2018, Scordino et al. 2020) generally in-
large-scale, multinational naval exercises are con-            clude multiple instances of known strikes each year.
ducted in the NP (www.military.com/daily-news/2014/            These records are minimum counts, however, as de-
05/08/23-nations-to-participate-in-maritime-exercise.          termined by detailed examination of beach-cast car-
html). Numerous Navy vessels engaged in training,              casses (in some cases, the cause of death could not be
testing, or transiting between locations travel rou-           determined) and, as such, underrepresent the true
tinely throughout the NP and in the waters of some             extent of strikes for the species. Nonetheless, of the
national jurisdictions (e.g. Poling 2019), although the        total number of gray whale deaths and serious in-
location and timing are not always revealed pub-               juries reported for US waters between 1924 and
licly. In addition, not all military vessels engage AIS        2018, 19.1% were attributed to vessel strikes (IWC
transponders for reasons of national security (Barco et        2018, Scordino et al. 2020).
al. 2012, Poling 2019).                                          It is reasonable to assume that most vessel-strike
   Therefore, while our assessment does not fully              deaths of whales go undetected or unreported (Red-
account for naval military operations, which may be            fern et al. 2013, Rockwood et al. 2017), although the
substantially underreported in the AIS records, mili-          degree of under-detection and under-reporting un-
tary activities at sea unquestionably represent some           doubtedly is subject to numerous variables such as
degree of vessel-strike risk to gray whales.                   inshore−offshore differences between species and
196 Endang Species Res 44: 177–201, 2021 aspects of body condition that determine whether a These risk maps alone cannot be expected to be carcass will sink or float (Moore et al. 2020). Carcass used directly for reducing the risk of ship strikes to recovery, examination, and reporting programs exist gray whales. However, it is hoped that they will con- to varying degrees in some regions (Korea, Japan, stitute a useful step toward understanding the scale China, Mexico, USA, Canada) within the range of and general geography of this risk basin-wide. Pre- gray whales, but such programs are virtually non- cautionary measures already in place in portions of existent in particularly remote and inaccessible areas the species’ range (e.g. off Sakhalin Island where such as the Russian Far East (IWC 2018) and portions some oil and gas companies have established traffic of Alaska (Scordino et al. 2020). corridors, imposed speed limits, and employed ob- Studies have estimated the number of actual servers on their vessels to prevent ship strikes on deaths of various baleen whale species (from all gray whales, SEIC 2020; vessel routing and speed causes) relative to the documented number (i.e. car- restrictions in waters off California, Freedman et al. casses recovered, or at least observed and reported). 2017, Moore et al. 2018, Rockwood et al. 2020) should Not surprisingly, the estimates of actual deaths have be considered in other areas of apparently strong always considerably exceeded the reported num- overlap between vessel and whale density. More- bers. For example, Punt & Wade (2010) reported a over, these maps can help guide decisions about carcass recovery level of 3.9−13.0% for eastern where to concentrate quantitative risk analyses for Pacific gray whales. use in designing targeted, empirically based risk Williams et al. (2011) estimated that only 3.4% of reduction and mitigation measures. the carcasses of sperm whales Physeter macro- cephalus that died during the Deepwater Horizon oil spill in the Gulf of Mexico were recovered. The esti- 5. CONCLUSIONS mated number of detected and reported deaths of North Atlantic right whales was only 17% of the Gray whales are exposed to the threat of vessel deaths that actually occurred in a 20 yr period, most strikes throughout their range and in all seasons. of the investigated deaths (where the cause of death Annual vessel-strike deaths may be in the tens, or was known) having been ascribed to vessel strikes the low hundreds. The risk appears greatest during (Kraus et al. 2005). Rockwood et al. (2017) estimated south- and northbound migration periods when that vessel-strike deaths of fin, blue, and humpback much of the population is moving through waters whales in waters along the US west coast were twice near shore. the number reported; and Carretta et al. (2019) esti- While tanker, container, and bulk-carrier ships on mated that the rate of detection and reporting of ves- long passages represent considerable risk to gray sel-strike deaths relative to the actual number of whales, the geographical extent of fishing fleets and deaths from vessel strikes ranged from 2 to 10% for the sheer numbers of fishing vessels on the water these 3 species. In a study of scarring on live gray mean that commercial fisheries could represent a whales near Sakhalin Island, Bradford et al. (2009) substantial risk, especially in Asia and the Bering Sea. inferred that at least 3 whales (or 2% of the study Pleasure craft, ferries, and whale-watching boats population) had survived at least 1 vessel strike. likely also pose some risk. Despite the threat of ves- In 2013−2018, an average of about 2 vessel strikes sel strikes to gray whales described here and else- of gray whales were documented each year in US where, the abundance of gray whales in both the waters alone (Scordino et al. 2020). Assuming vessel ENP and the WNP has increased over the last several strikes occurred at comparable rates throughout the decades. The amount of vessel traffic in the NP is species’ range, annual range-wide vessel strikes may generally projected to increase, and the vessel-strike be in the tens, or perhaps the low hundreds. These risk to gray whales can be expected to increase possible strike rates notwithstanding, the abundance accordingly. of gray whales in both the ENP and the WNP has Vessel-strike risk maps for gray whales serve as increased over the past several decades (Durban et proxies for vessel-strike risk to some other large al. 2017, Cooke et al. 2018). Gray whale populations whales in the NP to the extent that their distributions have grown despite general increases in vessel activ- overlap. Routing measures to reduce the likelihood ity in the NP (Tournadre 2014, UNCTAD 2020). of vessel strikes on other species in some locations Nonetheless, the maps presented here suggest that (e.g. blue whales off central California and bowhead vessel-strike risk is relatively high in numerous areas whales in the Bering Strait) may incidentally benefit throughout the species’ range. gray whales. Risk maps provided here also serve as
You can also read