Making the Most of Offshore Wind - STUDY Re-Evaluating the Potential of Offshore Wind in the German North Sea - Agora Energiewende
←
→
Page content transcription
If your browser does not render page correctly, please read the page content below
Making the Most of Offshore Wind
Re-Evaluating the Potential of Offshore Wind in the German North Sea

STUDY

                                                    Max Planck Institute
                                                      for Biogeochemistry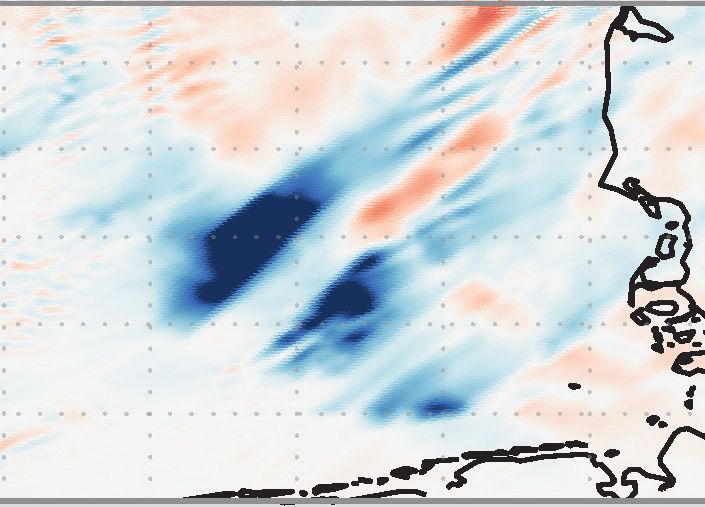
PUBLICATION DETAILS

Making the Most of Offshore Wind
Re-Evaluating the Potential of Offshore Wind in the German North Sea

COMMISSIONED BY                                        ACKNOWLEDGEMENTS
Agora Energiewende                                     We would like to thank Andreas Graf, Thorsten Lenck,
www.agora-energiewende.de                              Frank Peter, Christoph Podewils and Georg Thomassen
info@agora-energiewende.de                             (all Agora Energiewende) for their helpful comments.
                                                       We would also like to thank all those who participated
Agora Verkehrswende                                    in the expert workshops for their valuable input.
www.agora-verkehrswende.de
info@agora-verkehrswende.de                            The Technical University of Denmark and the
                                                       Max-Planck-Institute for Biogeochemistry are solely
Anna-Louisa-Karsch-Straße 2 | 10178 Berlin             responsible for the findings of this study. The conclu-
T +49 (0)30 700 14 35-000                              sions reflect the opinions of Agora Energiewende and
F +49 (0)30 700 14 35-129                              Agora Verkehrswende.

PROJECT MANAGEMENT
Matthias Deutsch, Agora Energiewende
matthias.deutsch@agora-energiewende.de

STUDY BY
Technical University of Denmark,
Department of Wind Energy
DTU Wind Energy | DTU Campus Risø
Frederiksborgvej 399 | DK- 4000 Roskilde
Jake Badger, Marc Imberger, Patrick Volker (formerly
DTU Wind Energy)

Max-Planck-Institute for Biogeochemistry,
Biospheric Theory and Modeling
Hans-Knöll-Str. 10 | 07745 Jena                                          This publication is available for
Axel Kleidon, Sonja Germer (formerly MPI-BGC),                           download under this QR code.
Jonathan Minz

                                                       Please cite as:
                                                       Agora Energiewende, Agora Verkehrswende, Techni-
                                                       cal University of Denmark and Max-Planck-Institute for
                                                       Biogeochemistry (2020): Making the Most of Offshore
Typesetting: Ada Rühring                               Wind: Re-Evaluating the Potential of Offshore Wind in the
Proofreading: WordSolid                                German North Sea.
Cover: Nicholas Free, iStockphoto
                                                       Conclusions and the main section should be cited as
176/01-S-2020/EN                                       indicated on page 7 and 29, respectively.
36-2020-EN
Version: 1.0, February 2020                            www.agora-energiewende.de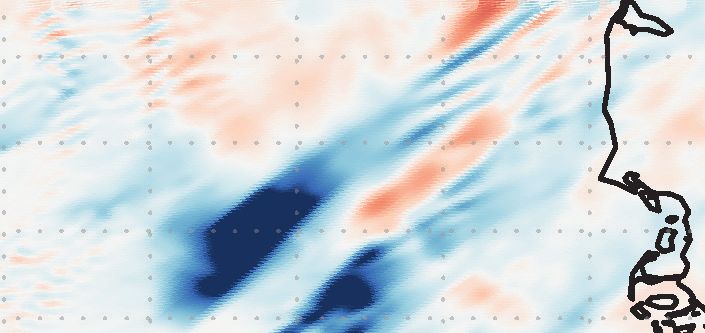
Preface

Dear reader,

as part of its European Green Deal, the European           for the German section of the North Sea with two
Commission has announced to present a strategy on          distinct modelling approaches. This study presents
offshore wind in 2020. Such a strategy is urgently         the findings, and it underscores the importance of the
needed as reaching a climate-neutral Europe will           role of the state in planning for a future with a lot
require a massive expansion of offshore wind energy.       more offshore wind energy.

This raises the question whether energy models used        We hope you find the study to be an inspiring and
today by wind farm planners and investors can              enjoyable read!
adequately capture the interaction effects between
turbines stemming from very large areas covered
with offshore wind farms at high installed capacity        Yours sincerely,
density. To better understand such effects, Agora
Energiewende and Agora Verkehrswende commis-               Patrick Graichen
sioned the Department of Wind Energy at the                Executive Director of Agora Energiewende
Technical University of Denmark as well as the
Max-Planck-Institute for Biogeochemistry to                Christian Hochfeld
simulate future offshore wind expansion scenarios          Executive Director of Agora Verkehrswende

 Key conclusions:
           Offshore wind energy with a potential installed capacity of up to 1,000 GW is a key pillar of the
           European energy transition. The net-zero compatible decarbonization scenarios in the European
    1      Commission’s Long-Term Strategy include around 400-450 GW of offshore wind capacity by 2050.
           Additional demand of up to 500 GW may be created by dedicating offshore farms to electrolysis for
           renewable hydrogen production.

           For Germany, scenarios approaching climate neutrality by 2050 assume an installed capacity of
           50 to 70 GW wind offshore, yielding 200 to 280 TWh electricity per year. Compared to the 8 GW
    2      installed today and the current plans of 20 GW by 2030, there needs to be a significant increase in
           spatial planning for offshore wind deployment. A slowing of onshore wind expansion could further
           enhance the role of offshore wind development in achieving net-zero.

           Offshore wind power needs sufficient space as otherwise the full load operating time may shrink
           from currently around 4,000 hours per year to between 3,000 to 3,300 hours. The more turbines
    3      are installed in a region, the less efficient offshore wind production becomes due to a lack of wind
           recovery. If Germany were to install 50 to 70 GW in the German Bight (Deutsche Bucht) only, full
           load hours of the wind offshore parks would decrease considerably.

           Countries neighbouring the North and the Baltic Sea should engage in a smart cooperation, so as to
           maximize wind yield and full-load hours of their offshore wind farms. In order to make best use of
           offshore wind energy, the planning and development of wind farms – as well as broader maritime
    4      spatial planning – should be smartly coordinated across national borders to maximize the efficiency
           and potential of offshore wind deployment. This is relevant for both the North Sea and the Baltic
           Sea. Floating offshore wind farms may contribute to integrating deep waters more creatively into
           the planning.

                                                                                                                  3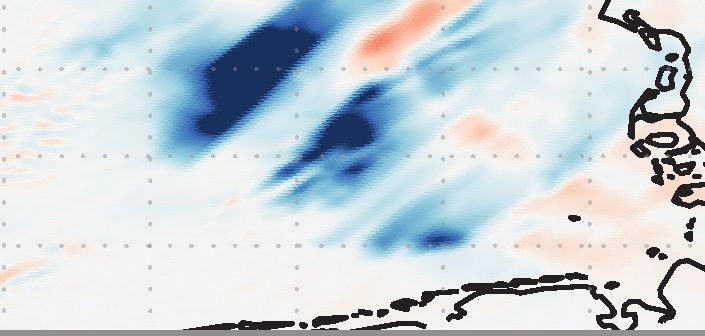
Agora Energiewende & Agora Verkehrswende | Making the Most of Offshore Wind

4
Content

Making the Most of Offshore Wind: Re-Evaluating the Potential of Offshore Wind
in the German North Sea
Conclusions drawn by Agora Energiewende and Agora Verkehrswende

1   Conclusions                                                                 9

2   References                                                                  23

Making the Most of Offshore Wind: Re-Evaluating the Potential of Offshore Wind
in the German North Sea
Technical University of Denmark and Max-Planck-Institute

1   Summary                                                                     31

2   Background: More than wakes                                                 35

3   Goals and offshore wind expansion scenarios                                 39
    3.1	Suitable areas for offshore wind energy                                40
    3.2 Assumed turbine technology                                              41
    3.3 Definition of scenarios                                                 41
    3.4	Typical wind climatology in the region                                 42

4   Methods                                                                     43
    4.1 Overview                                                                43
    4.2	KEBA: Kinetic Energy Budget of the Atmosphere                          44
    4.3	WRF: Weather Research and Forecasting Model                            45

5   Results                                                                     51
    5.1 Overview                                                                51
    5.2 KEBA results                                                            51
    5.3 WRF results                                                             55
    5.4 Comparison and interpretation                                           61

6   Conclusions                                                                 67

7   Recommendations                                                             69

8   References                                                                  71

9   Appendices                                                                  73
    9.1	Parameter values used for the KEBA method                              73
    9.2	Cross-sectional widths and downwind lengths used
         in the KEBA “directions” estimates                                     73
    9.3	Namelist for the WRF mesoscale model                                   77

                                                                                 5
Agora Energiewende & Agora Verkehrswende | Making the Most of Offshore Wind 6
Making the Most of
Offshore Wind:
Re-Evaluating the
Potential of Offshore
Wind in the German
North Sea
Conclusions drawn by
Agora Energiewende and
Agora Verkehrswende

Please cite as:
Agora Energiewende and Agora Verkehrswende (2020):
Making the Most of Offshore Wind: Re-Evaluating
the Potential of Offshore Wind in the German North
Sea. Conclusions drawn by Agora Energiewende and
Agora Verkehrswende. In: Agora Energiewende, Agora
Verkehrswende, Technical University of Denmark and
Max-Planck-Institute for Biogeochemistry (2020):
Making the Most of Offshore Wind: Re-Evaluating the
Potential of Offshore Wind in the German North Sea.
Agora Energiewende & Agora Verkehrswende | Making the Most of Offshore Wind

8
STUDY | Making the Most of Offshore Wind

Conclusions

               Offshore wind energy, which has an installed capacity potential of up to 1,000 GW, is a key pillar of
       1       the European energy transition.

Achieving the goals of the Paris Agreement will                onshore wind, including correspondingly lower
require Europe to move ever closer to a climate-neu-           forecast errors and balancing power requirements.2
tral energy system.1 In this transition toward very            Due to these features, offshore wind’s system value is
high shares of variable renewable energy sources               generally higher than that of onshore wind and more
like solar PV and wind, offshore wind will play a              stable over time than that of solar PV.3 Regarding
crucial role.                                                  system adequacy, offshore wind can contribute
                                                               around 30% of its installed capacity to the ability of
Offshore wind comes with desirable properties that             the power system to match generation with con-
onshore wind and solar PV cannot offer: high full-             sumption at all times, thereby reducing the need for
load hours, high operating hours, rather low variabil-         investment into dispatchable backup power plants. In
ity and – consequently – greater predictability than
                                                               2    Stiftung Offshore (2017)
1      EC (2018a)                                              3    IEA (2019)

    Achievable full-load hours for very good sites assumed in modelling commissioned by the
    European Commission                                                                                        Figure 1

                    Full-load hours
                    6000
                    5000
                    4000
                    3000

                    2000
                    1000

                       0
                                  Solar PV             Onshore wind              Offshore wind

    Note: Each band indicates an estimated range. Figures extend from 2020 to 2050.

    ASSET (2018)

                                                                                                                          9
Agora Energiewende & Agora Verkehrswende | Making the Most of Offshore Wind
the future, offshore wind could also provide flexibil- offshore wind is growing, thereby reducing financing
ity services.4 costs. New technological developments such as
floating foundations may further advance the
Whereas solar PV and onshore wind power genera- deployment of offshore wind energy in parts of
tion are assumed to reach up to 2,300 and Europe and abroad.7
3,700 full-load hours at very good sites, offshore wind
is believed to reach up to 5,200 full-load hours (i.e. a The net-zero decarbonization scenarios con-
capacity factor of 59%), as illustrated in Figure 1.5 tained in the European Commission’s Long-Term
Strategy assume some 400 to 450 GW of off-
While the levelized cost of electricity (LCOE) gener- shore wind capacity by 2050.
ated by offshore wind declined from about
0.15 USD/kWh to 0.13 USD/kWh between 2010 and With its Long-Term Strategy, the European Commis-
20186, strike prices in recent auctions in Europe have sion has explored several pathways to reduce green-
fallen to almost 0.05 USD/kWh for delivery in the house gas emissions, from scenarios that address the
mid-2020s, and the confidence of investors into well below 2°C target to those that pursue efforts to
limit temperature change to 1.5°C. The latter goal is
4 Stiftung Offshore (2017), IEA (2019) forecast in the 1.5LIFE and 1.5TECH scenarios, which
5 ASSET (2018). In 2018, the global weighted average foresees net-zero greenhouse gas emissions by 2050.
capacity factor for offshore wind amounted to 43%, i.e. Whereas 1.5LIFE assumes changing business and
nearly 3,800 full-load hours (IRENA 2019).
6 IRENA (2019) 7 IEA (2019), IRENA (2019)
Offshore wind capacity assumed in EU climate target scenarios for 2050 in GW Figure 2
GW
1200
1010 * specifically
1000 dedicated to
800 renewable
500* hydrogen
600 production
396 451
400
200 510
0
1.5LIFE 1.5TECH Optimized
Gas
Long-Term Strategy Gas for Climate
EC (2018c), Navigant (2019)
10STUDY | Making the Most of Offshore Wind
consumption patterns towards a more circular net-zero EU emissions in 2050. Half of this capacity
economy, 1.5TECH features a stronger role for is dedicated to green hydrogen production.12
biomass and carbon capture and storage. The total When producing green hydrogen, offshore wind will
power generation capacity in the two 1.5 scenarios compete with exceptionally inexpensive solar PV and
ranges from around 2,300 GW to 2,800 GW in 2050, onshore wind at very good sites around the globe.
with the share of renewables in gross electricity However, given the high transport costs associated
generation reaching more than 80% and – within with long-distance hydrogen shipping – whether as
renewables – wind representing the dominating liquid hydrogen, ammonia, or in liquid organic
renewable energy technology (>50%).8 hydrogen carriers – offshore wind located in Europe
might have a competitive advantage.13
Offshore wind reaches an installed capacity of
396 GW by 2050 in the 1.5LIFE scenario and of
451 GW in the 1.5TECH scenario (see Figure 2), up
from around 20 GW installed in the EU today.9
Deploying 450 GW of offshore wind in all over
Europe would require a considerable increase in the
annual installation rate, starting from around 3 GW
today to some 7 GW by the second half of the 2020s
and to over 20 GW per year by the mid 2030s.10
Additional demand of up to 500 GW may be cre-
ated by dedicating offshore farms to electrolysis
for renewable hydrogen production.
Electrolysers for hydrogen production are economi-
cally most efficient when operated on a continuous
basis. Efficient green hydrogen production thus
requires a renewable energy source that can deliver
many full-load hours, a requirement that is well
suited to offshore wind.11 As a result, offshore wind
deployment goes hand in hand with greater hydrogen
production in many scenarios. For example, the
“optimized gas scenario”, commissioned by the “Gas
for Climate” group, projects total installed offshore
wind capacity of 1010 GW in order to achieve 12 Navigant (2019). According to the authors, the “optimized
gas scenario” resembles the 1.5TECH scenario.
Electrolysis can be implemented onshore or offshore
(Tractebel 2019). The former requires a grid connection
8 EC (2018b) to an offshore wind park, the latter involves hydrogen
transport from the offshore farm to the mainland, which
9 IEA (2019)
could be realized through pipelines or specialized vessels
10 Wind Europe (2019) (Navigant 2019, E-Bridge 2018, IEA 2019).
11 Agora Verkehrswende, Agora Energiewende and Frontier 13 Agora Energiewende (2019), Agora Verkehrswende,
Economics (2018) Agora Energiewende and Frontier Economics (2018)
11Agora Energiewende & Agora Verkehrswende | Making the Most of Offshore Wind
1 Scenarios projecting near climate neutrality by 2050 assume an installed capacity of 50 to 70 GW of
2 offshore wind in Germany, generating some 200 to 280 TWh of electricity per year.
In recent years, a total of 8 GW of offshore wind demand from heating during the winter season.
capacity has been installed in the German section of Depending on a variety of assumptions, including
the North Sea (Figure 3). For 2050, climate target future hydrogen requirements and fuel imports, total
scenarios with a reduction in greenhouse gases of electricity generation from wind energy in 2050 is
95% relative to 1990 show installed offshore wind projected to range between 470 and 750 TWh per
capacity ranging between 50 and 70 GW. To reach year (Figure 4). Of this amount, 220 to 520 TWh could
such capacities by 2050, a gross capacity of about 1 potentially be generated by onshore wind, and 180 to
to 2 GW of offshore wind would need to be installed 280 TWh by offshore wind.14 These ranges show that
per year. within certain bounds, onshore wind can act as a
substitute for offshore wind, despite widely divergent
Whether onshore or offshore, wind power plays a transmission grid requirements. The expansion of
decisive role in the deep decarbonization scenarios
that have been developed for Germany, as the genera- 14 Acatech et al. (2017), Agora Energiewende (2020), BDI
tion profile of wind is especially well suited to cover (2018), BMU (2015), MWV (2018)
Installed offshore wind capacity for Germany‘s 95 % climate target scenarios in GW Figure 3
GW
80
70
MWV
BDI
60 Acatech
Stiftung Offshore
BMU
40 45
20
8
0
2019 2050
Note: Acatech models a greenhouse gas emission reduction of 90% relative to 1990 by 2050.
This diagram does not include installed capacities for 2050 of around 30 GW as shown in
Dena (2018), because those scenarios include an unusually high volume of imported renewable
hydrogen and e-fuels.
Acatech et al. (2017), Agora Energiewende (2020), BDI (2018), BMU (2015), MWV (2018), Stiftung Offshore (2017)
12STUDY | Making the Most of Offshore Wind
Ranges of necessary wind power generation by 2050 in 95% decarbonization scenarios
for Germany in TWh Figure 4
TWh
2019 2050
800
750
600
520
470
400
280
220
200 126 180
0
Wind Wind Onshore Offshore
onshore + onshore +
offshore offshore
Note: Figures are rounded; Acatech et al. models a 90% GHG emission reduction by 2050
Acatech et al. (2017), Agora Energiewende (2020), BDI (2018), BMU (2015), MWV (2018)
offshore wind will primarily take place in northern Given the 8 GW of installed capacity today and
Germany, thus augmenting the need for grid connec- current plans for 20 GW by 2030, the pace of
tions to the south. Onshore wind, on the other hand, spatial planning for offshore wind deployment
can be spread out more evenly across Germany. Due needs to pick up significantly.
to its very different seasonal profile, solar PV can only
partially act as a substitute for wind energy. From 2008 to 2019, Germany installed offshore wind
capacity at an average rate of 0.7 GW per year (Table 1).
Offshore wind growth in Germany: Past expansion and future requirements in GW Table 1
Installed capacity in GW Capacity addition in GW per year
2008 – 2019 – 2030 –
Scenario range 2050 2008 2019 2030 2050 2019 2030 2050
Lower end 45 1.3
0 8 20 0.7 1.1
Upper end 70 2.5
Agora Energiewende (2020), Bundesregierung (2019), BMU (2015), MWV (2018)
13Agora Energiewende & Agora Verkehrswende | Making the Most of Offshore Wind
Reaching the new target of 20 GW by 203015 implies nine months of 2019 saw the lowest onshore wind
an increase of this installation rate to around 1.1 GW installation rate in Germany of the last 20 years.20
per year. After 2030, annual deployment would only With onshore wind expansion in Germany currently
need to be slightly higher (1.3 GW/a) to reach 45 GW, falling short of long-term climate targets, some
the lower end of the scenario range for wind capacity policy-makers have argued that expanded deploy-
in 2050. By contrast, achieving the higher end of ment of offshore wind could act as a substitute for
70 GW would involve more than a doubling of annual onshore wind, and that the current “expansion
deployment to 2.5 GW per year from 2030 to 2050. corridor” should be adjusted correspondingly.21 While
both turbine types have similar generation profiles22,
The slowing of onshore wind development could there remains a major difference: Onshore wind
further enhance the importance of offshore wind turbines can be erected in close proximity to demand
in achieving net zero. centres all over Germany, whereas offshore wind
energy needs to be transported over considerable dis-
For years, a generally accepted assumption in tances, thus necessitating an offshore grid connec-
discussions about the German energy transition has tion and sufficient onshore transmission capacity.23
been that reserving 2 % of national territory for
onshore wind turbines is a realistic benchmark.16
However, this basic assumption is now being
challenged by policy-makers in Germany who
demand general minimum distances between wind
turbines and inhabited areas. Troublingly, increasing
the general minimum distance to 1000 m would
reduce the areas suitable for onshore wind develop-
ment by 20 to 50 per cent.17 Conversely, reducing
minimum distances to 600 m would allow onshore
wind energy to play a much larger role in the German
energy transition.18
In addition to land availability issues, onshore wind
expansion is being impaired by a lack of evi-
dence-based standards and procedures in the area of
nature conservation.19 As a consequence, the first
15 As announced by the German Federal Government in
its Climate Action Programme 2030 (Bundesregierung
2019). In addition, the heads of governments in northern
German states have recently demanded the construction
20 Fachagentur Wind (2019)
of 30 GW of offshore turbines by 2035 (Niedersächsische
Staatskanzlei 2019). 21 Stratmann (2019)
16 BWE (2012) 22 See page 9 for details on differences between onshore
and offshore wind.
17 UBA (2019)
23 The IEA (2019) underlines that “additional investment
18 IASS (2019)
in onshore transmission is key to making the most of off-
19 BDEW et al. 2019; BMWI 2019 shore wind”.
14STUDY | Making the Most of Offshore Wind
Offshore wind power needs sufficient space, as the full load operating time may otherwise shrink
3 from currently around 4,000 hours per year to between 3,000 and 3,300 hours.
Energy scenarios for the EU assume future genera- ment in the overall magnitude of yield reductions.
tion of 4,000 to 5,000 full-load hours at very good Figure 5 illustrates how the full-load hours achieva-
offshore wind sites.24 The analysis presented in this ble by offshore wind farms decrease as the area
publication, however, describes considerable reduc- covered by the turbines expands, ranging from a
tions in full load hours for the German section of the comparatively small to a large reduction.
North Sea. This finding is derived from using two
methods that differ substantially in complexity, with If Germany were to install 28 GW of wind turbines in
one (“KEBA”) being simple and fast, and the other an area of around 2,800 km² in the German Bight
(“WRF”) being highly detailed and requiring a com- only, the yield would fall to around 3,400 full-load
puter cluster to perform the simulations.25 Neverthe- hours, corresponding to nearly 100 TWh of electrici-
less, both methods show a remarkable level of agree- ty.26 Installing 72 GW of turbines in an area of about
7,200 km² exclusively in the German Bight would
24 See figure 1. further reduce full-load hours to about 3,000 hours
25 KEBA: Kinetic Energy Budget of the Atmosphere. WRF:
Weather Research and Forecast model. For details, see 26 The 2,800 km² refer to the near-shore coastal areas
part II of this publication. defined as O-NEP zones 1 to 3 (BSH 2019b).
Full-load hours achievable depending on area for offshore wind deployment in the North Sea
(and expected yield in TWh) Figure 5
Full-load
hours
5000 Area spread out across North Sea
through country cooperation yields
4000 more full-load hours
3000 More intensive use in German Bight
~100 TWh only leads to lower full-load hours
2000
~220 TWh
1000
0
0 2000 4000 6000 8000
Area used in km²
7,5 MW/km² (KEBA) 10 MW/km² (KEBA)
12,5 MW/km² (KEBA) 10 MW/km² (WRF)
Authors' figure, based on DTU and MPI-BGC (2020)
15Agora Energiewende & Agora Verkehrswende | Making the Most of Offshore Wind
per year, yielding approximately 220 TWh of elec- called “wakes”.28 By mixing with the surrounding air
tricity. As an alternative, the wind farms could be flow, depleted winds are replenished. In this way,
spread out over a larger area on the basis of coopera- wind farm planners and investors must necessarily
tion with other countries. This would considerably consider wake effects between individual turbines
augment the number of achievable full-load hours, and entire wind farms (see Figure 6). As the size of the
according to our estimations. region under consideration increases, it is also
important to take the overall reduction of kinetic
The more turbines are installed in a region, the energy of the regional air flow into account: The more
less efficient offshore wind production becomes
due to a lack of wind recovery.
28 Wakes recover mainly through atmospheric turbulence.
Over land, the heating of the earth’s surface by sunlight
Wind turbines convert kinetic energy from the as well as natural and man-made surface roughness
atmosphere into electricity, thereby reducing wind generate turbulence, leading to shorter wakes of a few
speeds.27 Mean wind speed reductions behind the kilometres in length at most. Over sea, heating by solar
turbine, together with increased turbulence levels, are radiation takes place below the surface, causing less
heating at the surface. Additionally, water surfaces are
less contoured, meaning less turbulence but considerably
longer wakes. Simulations predict wakes of up to 100 km,
27 In addition, they also lead to dissipation of kinetic energy and empirical measurements have shown wakes to reach
through friction. at least 45 km in length (Platis et al. 2018).
The yields of many wind turbines decline by different factors relative
to an individual turbine. Figure 6
Small vertical renewal rate from above
Typical value: ≈ 2 W m-2 per surface area
Wake Reduced
Large horizontal wind speeds
effects
kinetic energy
flux density
Typical value:
550 W m-2
per cross-
sectional area
Individual Wind Regional
turbine farm potentials
Typically under consideration This project
Note: Based on typical values for the annual means for the North Sea. Actual values show large variations due to varying
wind conditions.
MPI-BGC (2020)
16STUDY | Making the Most of Offshore Wind
the surrounding horizontal air flow is affected, the ence and the divergence in air flow stability
greater the reduction in downstream wind speeds, described above, onshore wind turbines in Germany
because additional kinetic energy can effectively only are less likely to experience relevant reductions in
come from higher atmospheric layers, and the vertical achievable full-load hours anytime soon.33 However,
renewal rate from above is limited.29 Accordingly, the given the long-run target of generating 220 to
analysis presented in this publication considers wake 520 TWh electricity from onshore wind in Ger-
effects, including large-scale wind flow impacts. many34, further research on this question is war-
ranted. Similarly, work should be conducted to
The impact of the kinetic energy removal increases in understand the potential effects of offshore wind
line with the size of the wind farm and spatial density farms on their downstream onshore counterparts.
of the turbines. This general phenomenon is more
relevant in the offshore setting than for onshore wind
due to divergence in surface roughness, surface
heating and the density of turbine capacity.
Over land, the natural and man-made surface rough-
ness caused by vegetation, mountains and buildings
leads to lower wind speeds than over the sea.30 At the
same time, surface obstacles produce stronger
turbulence and the mixing of air flows, which is
further enhanced by solar heating during the day,
implying shorter wake effects onshore than offshore.
Wind turbine capacity densities in Germany differ
considerably between onshore and offshore wind
power. While planned offshore densities are on the
order of 10 MW/km²,31 actual onshore densities in
2018 averaged below 0.5 MW/km² when looking at
individual German states.32 Given this large differ-
29 The typical values shown in Figure 6 are based on typical
annual means for the North Sea, but the actual values
show large variation due to varying wind conditions.
Note that the magnitude of the vertical renewal rate
is limited by the comparatively low generation rate of
kinetic energy generation rate of the atmosphere, which
is governed by the dynamics and thermodynamics of the
atmosphere.
30 Quaschning (2005)
31 BSH (2019b)
33 In fact, such reductions could not be detected in an anal-
32 Schleswig-Holstein had 0.4 MW/km²; other northern
ysis covering 2000–2014 (Germer und Kleidon 2019).
states around 0.3 MW/km²; southern states below 0.05
In addition, a countervailing effect may be the observed
MW/km². Yet when looking at individual postal code
reversal of global terrestrial stilling (Zeng et al. 2019).
areas, some capacity densities reach up to the 5 MW/km²
scale (Fh-IEE 2019). 34 See Figure 4 above.
17Agora Energiewende & Agora Verkehrswende | Making the Most of Offshore Wind If Germany were to install 50 to 70 GW solely in the German Bight, the number of full-load hours achieved by offshore wind farms would decrease considerably. Today, state planning for future offshore wind deployment in the German Bight is based on national maritime spatial planning and site development plans, implemented by the Federal Maritime and Hydrographic Agency (BSH). Its mandate ends at the borders of the German Exclusive Economic Zone. However, installing 50 to 70 GW solely in the German section of the North Sea would reduce full-load hours considerably and make offshore wind generation markedly more expensive than originally assumed. 18
STUDY | Making the Most of Offshore Wind

           Countries on the North and Baltic Seas should cooperate with a view to maximizing the wind yield
     4     and full-load hours of their offshore wind farms.

To date, spatial planning for offshore wind develop-     spatial plans by 2021, to coordinate those plans with
ment has generally had a national focus.35 The           each other, and to take other transnational issues into
analysis presented in this publication, however,         account.36 Despite this requirement for cooperation,
underscores the need for more coordination to            the cross-border removal of kinetic energy has yet to
efficiently exploit offshore wind resources in Europe    be systematically addressed. Such issues should be
as a whole. A key aspect of this analysis is its         incorporated into the envisaged offshore wind
extended notion of wakes to explicitly include the       strategy and regional cooperation as part of the
removal of kinetic energy from regional air flow. The    European Green Deal.37
findings indicate that offshore wind farm develop-
ment must consider regional wind dynamics. Specif-       Projects that are connected to more than one country
ically, due attention must be given to the reductions    via an offshore electricity interconnector could
in wind speeds and yields that occur when wind           represent a compelling opportunity within the scope
farms are constructed in close proximity to one          of offshore wind planning and development. Such
another. By extension, sufficiently large spaces         interconnections could serve as the springboard for
between wind farms should be preserved in order to       the development of an offshore meshed grid, and
ensure replenishment of wind speeds. These replen-       could take different forms, including combined grid
ishment areas could potentially be reserved for other    solutions or offshore hubs.38 The “hub-and-spoke”
purposes, such as shipping corridors or nature           model that has been proposed for North Sea Wind
conservation. The understanding of regional wind         Power Hub is one prominent example of a solution in
impacts presented in this publication is particularly    this area. This consortium has examined four loca-
relevant with a view to the cross-border effects of      tions,39 as shown in Figure 7: (1) the Dutch Exclusive
kinetic energy removal, given the potential for wind     Economic Zone (EEZ) on the Dogger Bank; (2) the
depletion beyond national boundaries.                    Dutch EEZ south of Dogger Bank; (3) the Danish EEZ

In order to maximize the efficiency and potential
of offshore wind, the planning and development
of wind farms – as well as broader maritime spa-         36   Directive 2014/89/EU. The European Union itself has no
tial planning – should be intelligently coordi-               general competence assigned within the field of spatial
nated across national borders.                                planning. However, it provides support, e.g. through the
                                                              European Maritime Spatial Planning Platform https://
                                                              www.msp-platform.eu (BSH 2019a).
In light of the foregoing discussion, broader maritime
                                                         37   EC (2019a, b)
spatial planning is an important part of large-scale
least-cost offshore wind development. Aside from the     38   Referred to as “hybrid projects“ by Wind Europe (2019:
                                                              44). Hybrid offshore wind farms do not exist so far,
kinetic energy removal effect, key cost factors
                                                              except for the Kriegers Flak project, which has been in
include the water depth and distance to shore. The EU         the making for 10 years (Wind Europe 2019).
Directive on Maritime Spatial Planning obliges
                                                         39   Those locations do not represent preferences for the loca-
coastal Member States to develop national maritime            tion of an initial project. Rather, they have been used to
                                                              test location-specific impacts on hub-and-spoke design
35   NSWPH (2019a)                                            (NSWPH 2019b).

                                                                                                                    19
Agora Energiewende & Agora Verkehrswende | Making the Most of Offshore Wind
Four illustrative areas for the development of offshore wind hubs in the North Sea Figure 7
4
3 DENMARK
1
2
Norfolk Sandbanks
East Anglia GERMANY
UNITED KINGDOM
= 24 GW (3750) km2
NETHERLANDS
Baseline up to 2030
Roll-out list after 2030
Search area
Nature habitats designated area
Nature habitats proposed area
BELGIUM EEZ Boundaries
Note: Those locations do not represent preferences for the location of an initial project. Rather, they have been used to test
location-specific impacts on hub-and-spoke design.
NSWPH (2019b)
west of Jutland; and (4) a location in the deeper part of Our findings are relevant to both the North and
the Danish EEZ and part of the Norwegian EEZ.40 Baltic Seas.
While the analysis presented in this publication is
only concerned with the German section of the North
Sea, it clearly has relevance for other waters as well,
including the Baltic Sea. With an estimated potential
40 The analysis includes the option of power-to-hydro- of more than 200 GW, the North Sea is the body of
gen conversion. It also finds significant increases in water with the largest offshore potential for Europe.
losses due to wake and blockage effects (NSWPH 2019b).
Nevertheless, the Baltic Sea’s potential is estimated at
Another example is Oersted’s recently unveiled plan for
a 5 GW offshore wind hub connecting several countries
more than 80 GW.41
in the Baltic Sea and including the option of hydrogen
production (Recharge 2019). 41 Wind Europe (2019)
20STUDY | Making the Most of Offshore Wind
Floating offshore wind farms could enable the
creative integration of deep waters into wind
farm planning.
Traditional fixed-bottom offshore wind installations
are typically installed in water depths of less than 50
to 60 meters due to the high costs associated with
increasing water depth, which can quickly make the
plants uneconomical.42 The relatively new technology
of floating offshore foundations promises to over-
come this limitation and open up new areas to
offshore wind development that would otherwise be
practically inaccessible.43 Indeed, the European
deployment scenario, which projects 450 GW of
installed offshore wind capacity by 2050, already
assumes 100 to 150 GW of floating offshore wind
capacity.44 Yet continued deployment at scale is
required to achieve further cost reductions and
enable floating foundations to play a meaningful role
in the future.45
42 IEA (2019)
43 It also holds the promise of greater ease of turbine set-up,
potentially lower future costs, and greater environmental
benefits due to less invasive activity on the seabed dur-
ing installation (IRENA 2019). Still, floating offshore wind
will also need to consider the impact of large scale wake
effects, including the overall reduction of kinetic energy
on the regional air flow, as described in this publication.
44 Wind Europe (2019)
45 Currently, the only successful operational large-scale
floating wind farm is the 30 MW Hywind project
in Scotland. A much larger project recently received
approval for installing 200 MW of floating turbines
off the coast of the Canary Islands. This would be the
world’s largest when starting operation in the mid-2020s
(IRENA 2019, IEA (2019).
21Agora Energiewende & Agora Verkehrswende | Making the Most of Offshore Wind 22
STUDY | Making the Most of Offshore Wind

References

Acatech et al. (2017): Acatech, Leopoldina, Akade-       ASSET (2019): Technology pathways in decarbonisa-
mienunion. ”Sektorkopplung“ – Untersuchungen und         tion scenarios, Advanced System Studies for Energy
Überlegungen zur Entwicklung eines integrierten          Transition, July 2018,
Energiesystems, Analyse, November 2017 (Schriften-       https://ec.europa.eu/energy/sites/ener/files/docu-
reihe Energiesysteme der Zukunft)                        ments/2018_06_27_technology_pathways_-_
https://energiesysteme-zukunft.de/fileadmin/user_        finalreportmain2.pdf
upload/Publikationen/PDFs/ESYS_Analyse_
Sektorkopplung.pdf                                       BDEW et al. (2019): 10 Punkte für den Ausbau der
                                                         Windenergie. Vorschläge zur Gewährleistung von
Agora Energiewende (2017): Wärmewende 2030.              Flächenverfügbarkeit, Handhabbarkeit naturschutz-
Schlüsseltechnologien zur Erreichung der mittel- und     rechtlicher Vorgaben und Stärkung vor Ort. Berlin, 3.
langfristigen Klimaschutzziele im Gebäudesektor.         September 2019.
Fh-IWES/IBP.                                             https://www.bdew.de/media/documents/
https://www.agora-energiewende.de/fileadmin2/            Stn_20190903_10-Punktefuer-Ausbau-
Projekte/2016/Sektoruebergreifende_EW/                   Windenergie-Verbaende.pdf
Waermewende-2030_WEB.pdf
                                                         BDI (2018): Klimapfade für Deutschland. BCG,
Agora Energiewende (2019): EU-wide innovation            Prognos, commissioned by Bundesverband der
support is key to the success of electrolysis manufac-   Deutschen Industrie (BDI),
turing in Europe. Background.                            https://bdi.eu/themenfelder/energie-und-klima/
https://www.agora-energiewende.de/fileadmin2/            klima2050/
Blog/2019/Electrolysis_manufacturing_Europe/
2019-11-08_Background_paper_Hydrogen_cost.pdf            BMU (2015): Klimaschutzszenario 2050. 2. Endbe-
                                                         richt, Öko-Institut, Fh-ISI, commissioned by Bun-
Agora Energiewende (2020): Die Energiewende im           desministerium für Umwelt (BMU).
Stromsektor: Stand der Dinge 2019. Rückblick auf die     www.oeko.de/oekodoc/2451/2015-608-de.pdf
wesentlichen Entwicklungen sowie Ausblick auf 2020.
https://www.agora-energiewende.de/fileadmin2/            BMWi (2019): Windenergie an Land. Aufgabenliste
Projekte/2019/Jahresauswertung_2019/171_A-EW_            zur Schaffung von Akzeptanz und Rechtssicherheit für
Jahresauswertung_2019_WEB.pdf                            die Windenergie an Land, Berlin, den 7. Oktober 2019,
                                                         https://www.bmwi.de/Redaktion/DE/Downloads/S-T/
Agora Verkehrswende, Agora Energiewende and              staerkung-des-ausbaus-der-windenergie-an-land.
Frontier Economics (2018): The Future Cost of            pdf?__blob=publicationFile&v=12
Electricity-Based Synthetic Fuels,
https://www.agora-energiewende.de/fileadmin2/            BSH (2019a): International spatial planning. The
Projekte/2017/SynKost_2050/Agora_SynKost_                importance of European cooperation in maritime
Study_EN_WEB.pdf                                         spatial planning, Bundesamt für Seeschifffahrt und
                                                         Hydrographie,
                                                         https://www.bsh.de/EN/TOPICS/Offshore/Maritime_
                                                         spatial_planning/International_spatial_planning/
                                                         international_spatial_planning_node.html

                                                                                                             23
Agora Energiewende & Agora Verkehrswende | Making the Most of Offshore Wind
BSH (2019b): Flächenentwicklungsplan 2019 für die EC (2018b): In-Depth Analysis in Support of the
deutsche Nord- und Ostsee. 28.06.2019, Bundesamt Commission Communication COM(2018) 773. A Clean
für Seeschifffahrt und Hydrographie, Planet for all. A European strategic long-term vision
https://www.bsh.de/DE/PUBLIKATIONEN/ for a prosperous, modern, competitive and climate
_Anlagen/Downloads/Offshore/FEP/ neutral economy. European Commission,
Flaechenentwicklungsplan_2019.pdf?__ https://ec.europa.eu/clima/sites/clima/files/docs/
blob=publicationFile&v=8 pages/com_2018_733_analysis_in_support_en_0.pdf
Bundesregierung (2019): Climate Action Programme EC (2018c): Supplementary information. In-Depth
2030. An overview. Analysis in Support of the Commission Communica-
https://www.bundesregierung.de/breg-en/issues/ tion COM(2018) 773. A Clean Planet for all. A Euro-
climate-action/klimaschutzprogramm-2030-1674080 pean strategic long-term vision for a prosperous,
modern, competitive and climate neutral economy.
BWE (2012): Potenzial der Windenergienutzung an European Commission
Land, Kurzfassung, Bundesverband Windenergie,
https://www.wind-energie.de/fileadmin/redaktion/ EC (2019a): Communication from the Commission
dokumente/publikationen-oeffentlich/themen/01- to the European Parliament, the European Council,
mensch-und-umwelt/03-naturschutz/bwe_ the Council, the European Economic and Social
potenzialstudie_kurzfassung_2012-03.pdf Committee and the Committee of the Regions.
The European Green Deal. European Commission.
Dena (2018): Dena-Leitstudie Integrierte Energie- COM (2019) 640 final.
wende. Impulse für die Gestaltung des Energiesystems
bis 2050, ewi Energy Research & Scenarios, commis- EC (2019b): Annex to the Communication from the
sioned by Deutsche Energie-Agentur (dena), Commission to the European Parliament, the Euro-
https://www.dena.de/fileadmin/dena/Dokumente/ pean Council, the Council, the European Economic
Pdf/9261_dena-Leitstudie_Integrierte_ and Social Committee and the Committee of the
Energiewende_lang.pdf Regions. The European Green Deal. European Com-
mission. COM (2019) 640 final.
E-Bridge (2018): Wasserstofferzeugung in Kombina-
tion mit Offshore-Windausbau. FA Wind (2019): Ausbausituation der Windenergie an
https://www.e-bridge.de/wp-content/ Land im Herbst 2019. Auswertung windenergiespezi-
uploads/2018/12/20181204_E-Bridge_H2_ fischer Daten im Marktstammdatenregister für den
OffshoreWind_final_Studie_gesamt-1.pdf Zeitraum Januar bis September 2019. Fachagentur
Wind (2019).
EC (2018a): Communication from the Commission to https://www.fachagentur-windenergie.de/fileadmin/
the European Parliament, the European Council, the files/Veroeffentlichungen/Analysen/FA_Wind_
Council, the European Economic and Social Commit- Zubauanalyse_Wind-an-Land_Herbst_2019.pdf
tee, the Committee of the Regions and the European
Investment Bank. A Clean Planet for all. A European Fh-IEE (2019): Windenergie Report Deutschland 2018,
strategic long-term vision for a prosperous, modern, Fraunhofer-Institut für Energiewirtschaft und
competitive and climate neutral economy. European Energiesystemtechnik (IEE),
Commission, COM(2018) 773 final, http://windmonitor.iee.fraunhofer.de/opencms/
https://eur-lex.europa.eu/legal-content/EN/ export/sites/windmonitor/img/Windmonitor-2018/
TXT/?uri=CELEX:52018DC0773 WERD_2018_barrierefrei.pdf
24STUDY | Making the Most of Offshore Wind
Germer, Sonja, und Axel Kleidon (2019): Have Wind Navigant (2019): Gas for Climate. The optimal role for
Turbines in Germany Generated Electricity as Would gas in a net-zero emissions energy system. Prepared
Be Expected from the Prevailing Wind Conditions in for Gas for Climate.
2000-2014? PLOS ONE 14 (2): e0211028. https://www.gasforclimate2050.eu/files/files/
https://doi.org/10.1371/journal.pone.0211028 Navigant_Gas_for_Climate_The_optimal_role_for_
gas_in_a_net_zero_emissions_energy_system_
IASS (2019): Ohne Windenergie keine Energiewende. March_2019.pdf
Die 1000 Meter-Abstandsregelung macht Windener-
gieausbau unmöglich und stellt damit den Kohleauss- Niedersächsische Staatskanzlei (2019): Wirklicher
tieg in Deutschland in Frage. Analyse und Ein- Klimaschutz nur mit Windenergie aus dem Norden, 29
schätzung der Konsequenzen für die Ausbauziele der November 2019,
Bundesregierung, Institute for Advanced Sustainabil- https://www.stk.niedersachsen.de/startseite/
ity Studies, presseinformationen/wirklicher-klimaschutz-nur-
https://www.iass-potsdam.de/sites/default/ mit-windenergie-aus-dem-norden-183105.html
files/2019-11/Discussion%20Paper_
MindestabstandWindkraftanlagen_ NSWPH (2019a): Requirements to build. Post-2030
published_22112019.pdf planning is needed now, North Sea Wind Power Hub,
https://northseawindpowerhub.eu/wp-content/
IEA (2019): Offshore Wind Outlook 2019. World uploads/2019/07/NSWPH-1903-Concept_Paper_6-
Energy Outlook Special Report, International Energy Build-v04.pdf
Agency,
https://www.iea.org/reports/offshore-wind- NSWPH (2019b): Modular hub-and-spoke:
outlook-2019 Specific solution options. North Sea Wind Power Hub.
June 2019.
IRENA (2019): Future of wind. Deployment, invest- https://northseawindpowerhub.eu/wp-content/
ment, technology, grid integration and socio-eco- uploads/2019/07/Concept_Paper_3-Specific-solu-
nomic aspects. A Global Energy Transformation paper. tion-options.pdf
https://www.irena.org/-/media/Files/IRENA/Agency/
Publication/2019/Oct/IRENA_Future_of_wind_ Quaschning (2005): Understanding Renewable
2019.pdf Energy Systems, Earthscan
MWV (2018): Status und Perspektiven flüssiger Recharge (2019): Orsted plans ‘world first’ 5GW
Energieträger in der Energiewende. Prognos AG, offshore wind energy island. 25 November 2019.
Fh-UMSICHT, DBFZ, commissioned by Mineralöl- https://www.rechargenews.com/wind/orsted-plans-
wirtschaftsverband e.V. (MWV), IWO, MEW, UNITI, world-first-5gw-offshore-wind-energy-island/
https://www.mwv.de/wp-content/uploads/2018/06/ 2-1-712332
Prognos-Endbericht_Fluessige_Energietraeger_
Web-final.pdf Stiftung Offshore (2017): Energiewirtschaftliche
Bedeutung der Offshore-Windenergie für die Ener-
giewende. Update 2017, Fh-IWES, commissioned by
Stiftung Offshore Windenergie
https://www.offshore-stiftung.de/sites/offshorelink.
de/files/documents/Studie_Energiewirtschaftliche%
20Bedeutung%20Offshore%20Wind.pdf
25Agora Energiewende & Agora Verkehrswende | Making the Most of Offshore Wind Stratmann (2019): Offshore-Windbranche will schneller wachsen. In: Handelsblatt Online, 09.08.2019, https://www.handelsblatt.com/politik/deutschland/ energiewende-offshore-windbranche-will- schneller-wachsen/24885448.html Tractebel (2019): Offshore-Wasserstoff-Produktion mit 400 MW in neuer Dimension. 1 October 2019. https://tractebel-engie.de/de/nachrichten/2019/ offshore-wasserstoff-produktion-mit-400-mw- in-neuer-dimension UBA (2019): Auswirkungen von Mindestabständen zwischen Windenergieanlagen und Siedlungen. Auswertung im Rahmen der UBA-Studie „Flächenan- alyse Windenergie an Land“. Umweltbundesamt. Position. März 2019, https://www.umweltbundesamt.de/sites/default/files/ medien/1410/publikationen/2019-03-20_pp_ mindestabstaende-windenergieanlagen.pdf Wind Europe (2019): Our energy, our future. How offshore wind will help Europe go carbon-neutral, https://windeurope.org/wp-content/uploads/files/ about-wind/reports/WindEurope-Our-Energy- Our-Future.pdf Zeng, Zhenzhong et al. (2019): A Reversal in Global Terrestrial Stilling and Its Implications for Wind Energy Production. Nature Climate Change 9 (12): 979–85. https://doi.org/10.1038/s41558-019-0622-6 26
STUDY | Making the Most of Offshore Wind

                                    27
Agora Energiewende & Agora Verkehrswende | Making the Most of Offshore Wind 28
Making the Most
of Offshore Wind:
Re-Evaluating
the Potential of
Offshore Wind in the
German North Sea

Please cite as:
Technical University of Denmark and Max-Planck-
Institute (2020): Making the Most of Offshore Wind:
Re-Evaluating the Potential of Offshore Wind in the
German North Sea. Study commissioned by Agora
Energiewende and Agora Verkehrswende.
In: Agora Energiewende, Agora Verkehrswende,
Technical University of Denmark and Max-Planck-Ins-
titute for Biogeochemistry (2020): Making the Most of
Offshore Wind: Re-Evaluating the Potential of Offshore
Wind in the German North Sea.

    Max Planck Institute
      for Biogeochemistry
Agora Energiewende & Agora Verkehrswende | Making the Most of Offshore Wind 30
STUDY | Making the Most of Offshore Wind

1      Summary

Introduction and background                                Goals and scenarios

Existing climate target scenarios for Germany to           This project evaluates a set of offshore scenarios with
reduce GHG emissions by 95 % by 2050 relative to           total installed capacities of offshore wind power
1990 include installed offshore wind capacities in the     ranging from 14 to 145 GW. We have focused these
range of 30 to 70 GW. Yet, the size of offshore regions    scenarios on the German section of the Exclusive
that Germany administers is relatively small. They         Economic Zone (EEZ) of the North Sea, as it contains
are located primarily in the North Sea, and in border      the majority of regions suitable for offshore wind
regions administered by neighbouring countries that        energy in Germany. We use the characteristics of a
also intend to develop offshore wind energy.               hypothetical 12 MW turbine (“BSH-200-P12”),
                                                           different densities of installed capacity, ranging from
Prior research suggests that when wind energy is           5 MW/km2 to 20 MW/km2, and different areas. This
used at larger scales, the efficiency of wind turbines     yields a range of total installed capacities from 14 GW
is reduced due to atmospheric effects, resulting in        to 145 GW, corresponding to a total of about 1,200 to
lower capacity factors and fewer full-load hours.          12,000 turbines with 12 MW each.
Current energy scenarios, however, typically assume
an increase in turbine efficiencies, as expressed by
capacity factor or full-load hours, due to technologi-     Methods
cal developments. Typically, modellers assume around
4,000 to 5,000 full-load hours for the future.             We use two methods to estimate wind speed reduc-
                                                           tions using descriptions of the atmospheric flow
The goal here is to evaluate the relevance of atmos-       surrounding the wind farm regions:
pheric effects in reducing yields in realistic scenarios
of offshore wind energy development in the North           KEBA: Kinetic Energy Budget of the Atmosphere.
Sea, using two methods that differ in their complex-       This method uses the kinetic energy budget of the
ity. The focus is to evaluate yields that go beyond the    atmosphere surrounding the wind farms to diagnose
typical wake effects that are observed and considered      wind speed reductions due to the removal by wind
in wind farms.                                             turbines and simultaneously estimates energy yields.

Wake effects are found behind the wind turbine             WRF: Weather Research and Forecast model. The
rotors and the depleted winds are replenished by the       WRF model is a numerical weather prediction model
surrounding flow. An incomplete replenishment              of the kind that is used by weather forecasting
results in a reduced yield of downwind turbines. This      centres and researcher all over the world. In this
effect is well studied and understood and regularly        model, the influence of wind turbines is represented
included in yield estimates for wind farms. Yet, it is     through Explicit Wake Parameterization.
assumed that the surrounding flow is not affected.
Our focus here is to include this effect on the sur-       The two methods differ substantially in complexity,
rounding flow, by evaluating the overall reduction of      with KEBA being simple and fast, and WRF being
kinetic energy of the regional air flow in regional        highly detailed and requiring a computer cluster to
scenarios of offshore wind energy use.                     perform the simulations.

                                                                                                                 31
Agora Energiewende & Agora Verkehrswende | Making the Most of Offshore Wind
Results more than 50 % (see Table 1 below). For example, in the
case of 72 GW installed with a density of 10 MW/km²,
Both methods show an increasing yield reduction the simulations yield around 3,000 full-load hours.
effect with larger installed capacities, ranging from a
comparatively small reduction to a large reduction by
Summary of results from the KEBA and WRF simulations Table 1
Formulation of scenarios Results
Included areas With wakes
Area 1 Area 2 caused by kinetic energy removal
Density Installed Yield Full-load hours Capacity factor*
(W/m2 or 2,767 4,473 capacity (GW) [h] [ %]
MW/km2) km2 km2 (GW) WRF KEBA WRF KEBA WRF KEBA
5 x 13.8 6.0 6.4 3,770 4,065 43 % 46 %
5 x 22.4 10.0 3,913 45 %
5 x x 36.2 15.3 15.4 3,693 3,729 42 % 43 %
7.5 x 20.8 8.8 3,713 42 %
7.5 x 33.5 13.5 3,530 40 %
7.5 x x 54.3 20.8 20.5 3,348 3,309 38 % 38 %
10 x 27.7 10.3 10.9 3,255 3,449 37 % 39 %
10 x 44.7 16.4 3,216 37 %
10 x x 72.4 25.1 24.5 3,040 2,966 35 % 34 %
12.5 x 34.6 12.6 3,190 36 %
12.5 x 55.9 18.8 2,949 34 %
12.5 x x 90.5 28.7 27.7 2,776 2,683 32 % 31 %
20 x 55.3 16.4 2,600 30 %
20 x 89.5 23.8 2,331 27 %
20 x x 144.8 36.0 34.2 2,179 2,070 25 % 24 %
* Other losses not included.
DTU and MPI-BGC (2020)
Interpretation the removal of kinetic energy through wind-turbine
operation, these estimates show that a very large-
Both methods show a remarkable level of agreement scale and dense deployment of wind turbines in the
regarding the overall magnitude of yield reductions North Sea region is likely to cause significant effects
caused by the wind turbines. As both models capture on the wind field within the region, resulting in
reduction effects on wind speeds that are caused by lower yields.
32STUDY | Making the Most of Offshore Wind
The reason for the yield reductions can be understood
by the atmospheric flows of kinetic energy. The
scenarios with greater installed capacities approach
levels that are similar in the magnitude by which the
atmosphere supplies kinetic energy to the wind farm
region. As these yield reduction effects relate to the
dynamics of the atmosphere, technological advances
in the turbines are unlikely to be able to compensate
for them, although one can minimize the detrimental
effects by specific planning of wind farm layouts
within the region.
Recommendations
This study suggests that in order to make better use of
offshore wind energy, wind farms should be planned
and developed with a coordinated long-term approach,
considering co-dependency of installed capacity
density and areal coverage, for efficient deployment.
Future research should continue to analyse the
possible impacts of extensive clusters of large and
very large wind farms. It should evaluate the limita-
tions and validate the models used here; it should
determine to what extent current practice with
engineering models fails to capture the removal of
kinetic energy demonstrated in our simulations; it
should assess the effects of offshore wind energy use
on coastal, onshore wind energy; and it should analyse
cross-border effects in neighbouring regions, such as
the Netherlands, the United Kingdom, or Denmark.
33Agora Energiewende & Agora Verkehrswende | Making the Most of Offshore Wind 34
STUDY | Making the Most of Offshore Wind

2          Background: More than wakes

Offshore wind energy is seen increasingly as an                               isters are relatively small. They are located primarily
important contributor for the transition to a car-                            in the North Sea, and in border regions administered
bon-free sustainable energy system in Germany, and                            by neighbouring countries that also intend to develop
in Europe. A number of recent energy scenarios that                           offshore wind energy. This raises the question of what
aim to reduce German CO2 emissions to 95 % or more                            will happen to wind energy yields when offshore
by 2050 envision that offshore wind energy can                                wind farms are expanded to unprecedented scales.
contribute substantially to this goal.
                                                                              Research over the past few years has evaluated how
The scenarios for offshore wind energy (Figure 1)                             much wind energy can be expected when used at a
project that the installed capacity of Germany’s                              very large scale. While such scenarios are hypotheti-
offshore areas (around 8 GW at the end of 2019)1 will                         cal, they highlight a critical effect: As more wind
increase by more than eight times to 45 to 70 GW2.                            turbines use more and more of the kinetic energy of
Yet, the size of offshore regions that Germany admin-                         the winds in the atmosphere, wind speeds decline,
                                                                              which results in lower yields. These wind speed
1      Deutsche WindGuard (2018)                                              reductions are a necessary consequence of the
2      Acatech et al. (2017), Agora Energiewende
                                                                              limited ability of the atmosphere to generate motion
       (2020), BDI (2018), BMU (2015), MWV (2018),                            set by thermodynamics, as has been known for a
       Stiftung Offshore (2017)

    Installed offshore wind capacity for Germany‘s 95% climate target scenarios in GW                                            Figure 1

                         GW
                           80
                                                                                              70
                                                                                                   MWV
                                                                                                   BDI
                           60                                                                      Acatech
                                                                                                   Stiftung Offshore
                                                                                                   BMU
                           40                                                                 45

                           20

                                                    8
                              0
                                                   2019                                     2050

    Acatech et al. (2017), Agora Energiewende (2020), BDI (2018), BMU (2015), MWV (2018), Stiftung Offshore (2017)

                                                                                                                                        35
Agora Energiewende & Agora Verkehrswende | Making the Most of Offshore Wind
while now3. It limits the supply rate of kinetic energy purpose of this report is to evaluate this critical effect
to the near-surface atmosphere at a global average of on wind energy yields in the scenarios for the
about 1 W m-2 of surface area. Although the supply German energy transition.
rate of kinetic energy to the near-surface atmosphere
varies from area to area, if wind energy use comes This interplay between larger wind energy use and
close to the supply rate at large scales, wind speeds lower wind speeds is clearly shown by the idealized
necessarily decline. If these wind speed reductions climate model simulations of Miller and Kleidon5
are not taken into account in large-scale wind energy (Figure 2 left). Considering wind turbines installed
potentials, as is common practice, estimates of over the whole planet at different installed capacities,
large-scale wind energy potential are too high and they showed that more wind energy use resulted in
become inconsistent with the limited ability of the lower wind speeds near the surface, which dispro-
atmosphere to generate kinetic energy4. The main portionally lowered the yields of wind turbines since
kinetic energy flux depends on wind speed to the
3 Lorenz (1955), Gustavson (1979), Kleidon (2010), Miller et power of 3. A reduction of wind speeds by 10%, for
al. (2011)
4 Gans et al. (2012), Miller and Kleidon (2016) 5 Miller and Kleidon (2016)
Recent modelling results suggest that yields decline when wind energy is used at large scales Figure 2
Wide
Intermediate
Narrow
0.8 8
Electricity generation Ocean 100
Land
Generation (We m-2)
Wind speeds (m s-1)
0.6 6 75
Efficiency (%)
0.4 4 50
0.2 2 25
Wind speeds
0
0 0
0 5 10 15 20 25 30 102 103 104 105
Installed capacity (Wi m-2) Wind farm area (km2)
Left: Simulated electricity generation and mean wind speeds in idealized scenarios of complete coverage of the world with
wind turbines of different installed capacities. The maximum generation results from reduced wind speeds at higher
installed capacities. (Note that the maximum over land is broader than over the ocean and is reached at a higher installed
capacity of 25 Wi m-2.)
Right: Simulated drop in efficiency, defined as the capacity factor of a wind farm relative to an isolated turbine, with a
greater wind farm area in an idealized scenario of offshore wind energy in the North Sea.
Left: Miller and Kleidon (2016); right: Volker et al. (2017)
36You can also read