A critical missing ingredient - The case for increased dietetic input in tier 1 health services - Dietitians NZ
←
→
Page content transcription
If your browser does not render page correctly, please read the page content below

A critical missing ingredient
The case for increased dietetic input in tier 1 health services
NZIER report to Dietitians New Zealand
21 April 2021
About NZIER

     NZIER is a specialist consulting firm that uses applied economic research and analysis to
     provide a wide range of strategic advice.
     We undertake and make freely available economic research aimed at promoting a better
     understanding of New Zealand’s important economic challenges.
     Our long-established Quarterly Survey of Business Opinion (QSBO) and Quarterly
     Predictions are available to members of NZIER.
     We pride ourselves on our reputation for independence and delivering quality analysis in
     the right form and at the right time. We ensure quality through teamwork on individual
     projects, critical review at internal seminars, and by peer review.
     NZIER was established in 1958.

Authorship

     This paper was prepared at NZIER by Sarah Hogan and Kevin Tuaño.
     It was quality approved by Todd Krieble.
     The assistance of Sarah Spring is gratefully acknowledged.

     Registered office: Level 13, Public Trust Tower, 22–28 Willeston St | PO Box 3479, Wellington 6140
     Auckland office: Ground Floor, 70 Shortland St, Auckland
     Tel 0800 220 090 or +64 4 472 1880 | econ@nzier.org.nz | www.nzier.org.nz

     © NZ Institute of Economic Research (Inc). Cover image © Dreamstime.com
     NZIER’s standard terms of engagement for contract research can be found at www.nzier.org.nz.

     While NZIER will use all reasonable endeavours in undertaking contract research and producing reports to ensure the information is as
     accurate as practicable, the Institute, its contributors, employees, and Board shall not be liable (whether in contract, tort (including
     negligence), equity or on any other basis) for any loss or damage sustained by any person relying on such work whatever the cause of
     such loss or damage.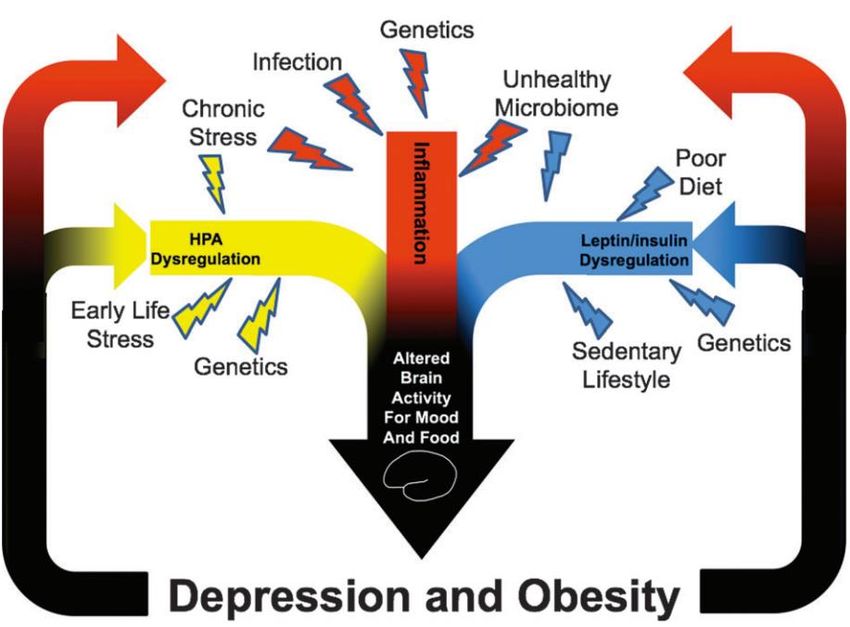
Te Tiriti Statement
Dietitians New Zealand is committed to the spirit of Te Tiriti o Waitangi and are working
towards a Te Tiriti Relationship Governance Model.
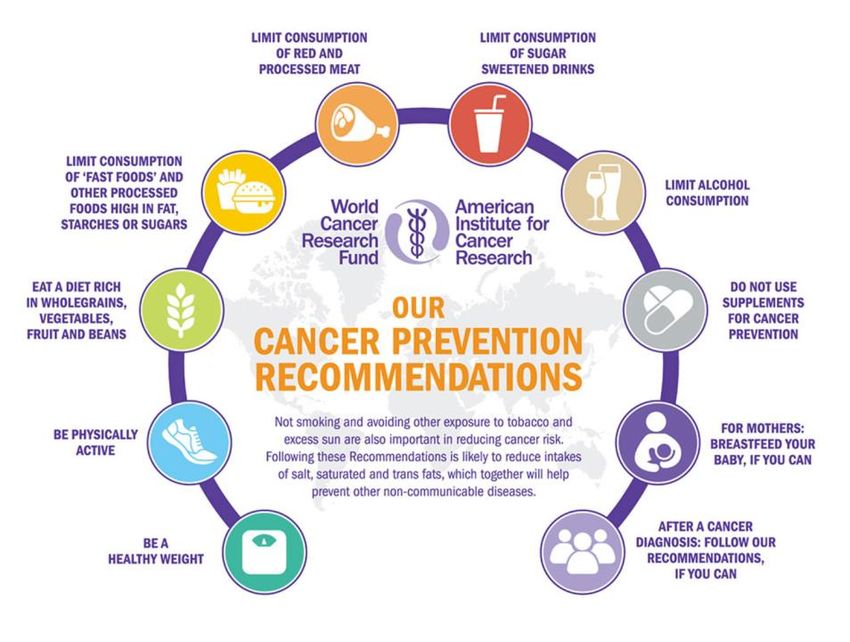
Key points
According to the 2019 Global Burden of Disease Study of 195 countries (IHME 2019), diet is
the single leading risk factor for death.
New Zealand registered dietitians are highly qualified practitioners regulated under the
Health Practitioners Competence Assurance (HPCA) Act (2003). Dietitians work with both
healthy and sick people to prevent illness and complications, reduce the impact of long-
term conditions on quality of life, and optimise health and well-being. They treat complex
clinical conditions such as diabetes, food allergy and intolerance, IBS syndrome, eating
disorders, chronic fatigue, malnutrition, kidney failure and bowel disorders. In a society full
of dietary and nutrition advice, registered dietitians provide the evidence-based care that
helps people navigate the complexities of their conditions, their treatment, and their
nutritional intake in a safe, practical and sustainable way to achieve optimal health
outcomes.
Cancer, diabetes and mental illness are high prevalence conditions within the New Zealand
population for which outcomes are optimised through best practice care including dietetic
support. Evidence suggests that for every dollar spent on dietetic support delivered by
dietitians in tier 1 settings, the health system receives a cost saving benefit of $5 to $6.40
from reduced hospitalisation and reduced medical treatment. But are people with these
conditions getting the care they need?
Is the supply sufficient to meet the demand?
This report focuses on the dietetic workforce and considers whether the current and
projected workforce is sufficient to meet the demand for dietetic services for specific
populations in specific contexts, by asking the following questions for three leading
conditions:
• Is the public-hospital-based dietetic workforce sufficient to provide best practice care
for people undergoing cancer treatment or still being followed-up under the care of
cancer specialists? If the oncology dietetic workforce is insufficient in hospital settings,
it will be no better placed to meet this demand as it shifts increasingly towards tier 1
settings.
• Is the publicly-funded primary and community dietetic workforce sufficient to provide
best practice care for people with a diagnosis of diabetes? The increasing prevalence
of diabetes and the significant equity implications of poor management of diabetes
demand a strong publicly-funded secondary prevention with dietetic support a critical
component.
iv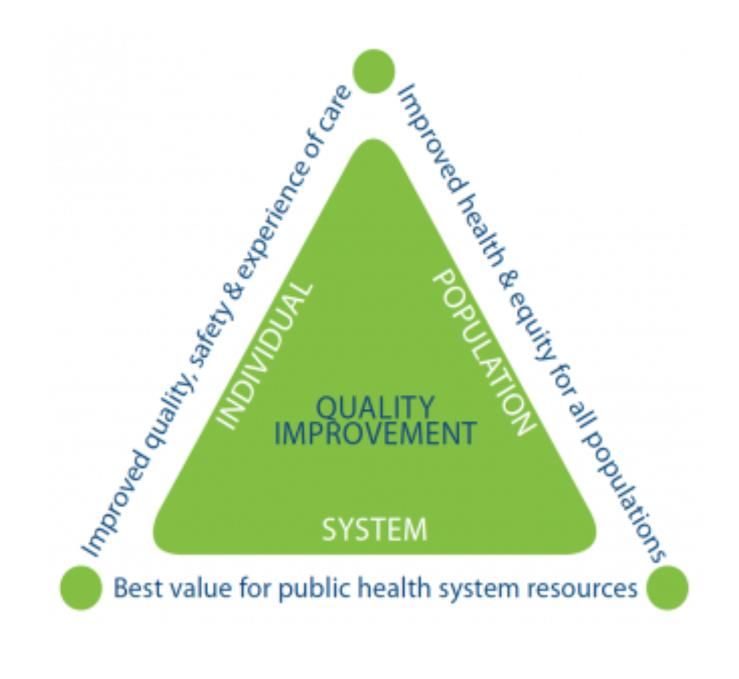
•      Is the publicly-funded primary and community dietetic workforce sufficient to provide
       nutrition assessment and support for people with mild to moderate mental illness?
       The role of nutrition and the high rates of obesity and comorbid conditions in this
       population demand a multi-disciplinary approach that has not traditionally been
       offered.
•      Is the current dietetic workforce sufficient to support the roll-out of a proactive
       primary prevention-focused model of care to high deprivation communities, based on
       the best practice diabetes ratio, to address the high prevalence of risk factors as well
       as multi-morbidity in these communities?

Supply and demand misalignment indicates significant unmet need
Our analysis, based on FTE dietitian to patient ratios from the published literature, indicates
that New Zealand has a significant shortage of dietitians in the relevant settings (see table
below).

Table 1 Summary of results for cancer, diabetes and mental health
    Condition          Current       Ratio of           Regional Range of FTE in   National Workforce
                       setting of    dietitian FTE to   relevant setting of care   shortage (FTE)
                       care          patients

    Cancer             Hospitals     1:1201             1:263 – 1:143              110
    Diabetes           Tier 1        1:3001             1:2190 – 1:4000            805
    Mental Health      Tier 1        1:5002             1:1645 – 1:2605            236
1
Best practice ratios indicated in published literature
2
Ratio tested in the absence of evidence of a best practice ratio

In addition to condition-specific ratios, we tested the capacity of the current primary and
community-based dietetic workforce to deliver:
•      A pro-active primary prevention approach to highly deprived communities.
•      A secondary prevention approach to all people with multi-morbidity in highly deprived
       communities.
Results for these broader community-based approaches indicate that a severe shortage of
dietitian FTEs prevents a pro-active primary prevention approach and that a secondary
prevention approach for people with multimorbidity would only be possible in the most
deprived decile.

Unmet need has previously been recognised and is expected to persist
These results are consistent with published reports that indicate New Zealand’s dietetic
workforce is lower in proportion to population than Australia’s or the UK’s, particularly in
primary care, where other health professionals have indicated a need for more dietetic
services to support patients with or at risk of long-term conditions.
Furthermore, based on population projections, prevalence rates, and Ministry of Health
workforce modelling, none of the calculated ratios are expected to improve significantly by
2030, indicating that existing unmet need and inequitable access to dietetic support will
continue without specific measures to address this.

                                                                                                        v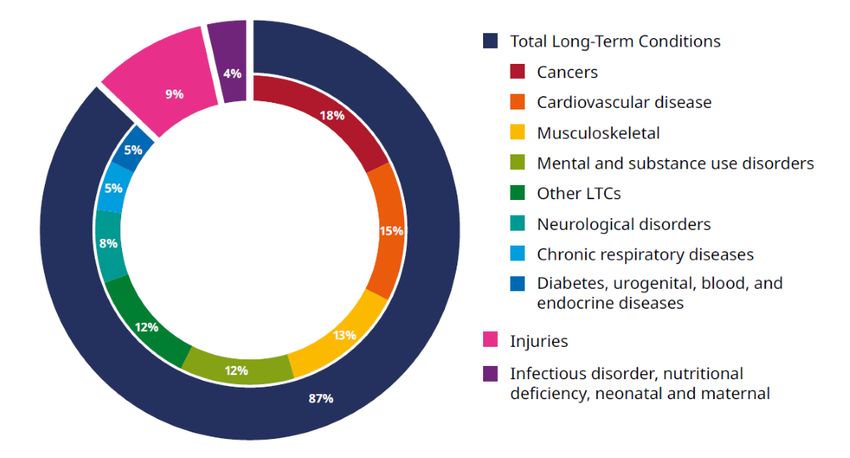
The Health and Disability System Transformation provides an opportunity to
address gaps
The health and disability system is facing a once in a generation redesign which will focus
heavily on more effective and efficient services with improved equity of access and
outcomes. The health workforce is a critical building block of a high quality, safe, equitable
and efficient health system. It needs to be able to support a shift to more pro-active,
person-centred, multi-disciplinary approaches, including better primary prevention and
more effective secondary prevention, as well as improved access to publicly-funded
services to close the equity gaps in both access and outcomes.
We recommend:
•   Investing to achieve best practice dietetic input through recruitment and training,
    especially of Māori and Pacific dietitians, to increase the supply of dietitians in New
    Zealand.
•   Developing and funding models of care with specific, recognised dietetic roles.
•   Reviewing the prescribing endorsement of dietitians to include more medications,
    especially those commonly used in the management of long term conditions.
•   Establishing national competency frameworks for Registered Nutritionists that support
    the work of Registered Dietitians.

                                                                                              vi
Contents

1        Background ......................................................................................................................... 1
         1.1 The registered dietetic workforce ............................................................................ 1
2        Our approach ...................................................................................................................... 4
         2.1 The principles ............................................................................................................ 4
         2.2 Data ........................................................................................................................... 5
         2.3 Disease group scenarios ........................................................................................... 5
         2.4 Dietitian to patient ratios ......................................................................................... 6
         2.5 Population scenarios................................................................................................. 7
3        The opportunity and the challenge ..................................................................................... 8
         3.1 The opportunity: Dietitians are key to addressing current demand drivers ............ 8
         3.2 The challenge: Dietitians are a scarce resource ..................................................... 11
4        Cancer ............................................................................................................................... 16
         4.1 Demand for dietitians in cancer care...................................................................... 16
         4.2 Dietitians’ potential contribution ........................................................................... 20
         4.3 Potential unmet need for dietitians in cancer care 2020-2030 .............................. 23
5        Diabetes ............................................................................................................................ 26
         5.1 Demand for dietitians in diabetes care .................................................................. 26
         5.2 Dietitians’ potential contribution to the solution................................................... 32
         5.3 Potential unmet need for dietitians in tier 1 diabetes care ................................... 34
6        Mental health .................................................................................................................... 40
         6.1 Demand for dietitians in mental health care .......................................................... 41
         6.2 Dietitians’ potential contribution to the solution................................................... 42
         6.3 Potential unmet need for dietitians in primary mental health services................. 44
7        Needs-based prevention in high deprivation communities.............................................. 46
8        Dietitians in future tier 1 services ..................................................................................... 49
         8.1 Publicly-funded tier 1 roles for dietitians ............................................................... 49
         Collaborative care including dietitians in tier 1 services would maximise the impact ..... 50
         8.2 Current system barriers to address ........................................................................ 51
         8.3 Unleashing the current potential of dietitians with updated regulation ............... 52
9        Recommendations ............................................................................................................ 54
10       References......................................................................................................................... 55

Figures
Figure 1 Percentage of health loss attributable to leading risk factors in New Zealand .............. 2
Figure 2 The triple aim .................................................................................................................. 4
Figure 3 Leading causes of health loss in the New Zealand population ....................................... 9
Figure 4 Dietitian to population ratio, projected 2020-2030 by region ...................................... 12
Figure 5 FTE dietitian to population ratio, projected 2020-2030 by region ............................... 13
Figure 6 Registered dietitians’ main workplace .......................................................................... 15
Figure 7 DHB-employed registered dietitians’ main workplace ................................................. 15
Figure 8 New cancer registrations by region – 2018 ................................................................... 17

                                                                                                                                                     vii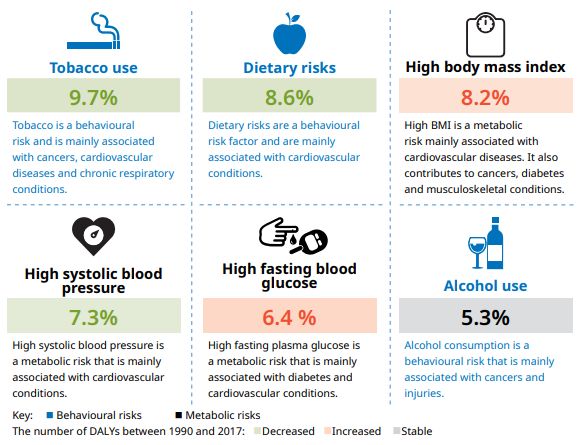
Figure 9 Projected new cancer registrations by region............................................................... 17
Figure 10 Unique patients having cancer-related outpatient follow-up appointments by region
– 2019/2020 ............................................................................................................. 18
Figure 11 Projected patients having cancer-related outpatient follow-up appointments by
region ....................................................................................................................... 19
Figure 12 Unique patients receiving inpatient (including day case) cancer treatment by region –
2019/2020 ................................................................................................................ 19
Figure 13 Projected patients receiving inpatient (including day case) cancer treatment by
region ....................................................................................................................... 20
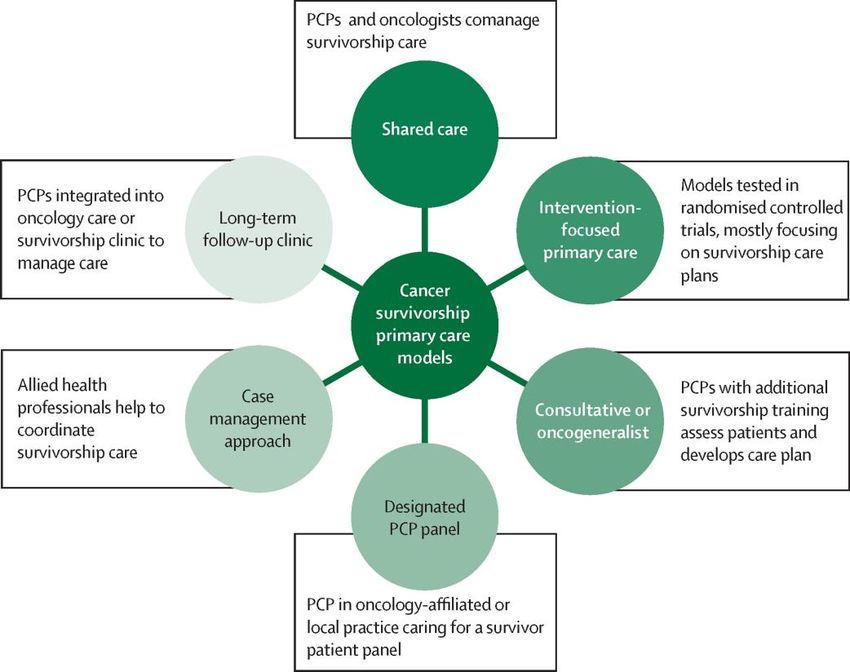
Figure 14 Models of cancer survivorship care ............................................................................ 22
Figure 15 Current ratio of individuals receiving inpatient and outpatient cancer treatment to
FTE DHB clinical tier 2 dietitians ............................................................................... 24
Figure 16 Projected ratio of individuals receiving inpatient and outpatient cancer treatment to
FTE dietitians working in a DHB clinical setting........................................................ 25
Figure 17 Unique individuals diagnosed with diabetes by region – 2020................................... 27
Figure 18 Projected individuals diagnosed with diabetes by region........................................... 27
Figure 19 Unique patients attending diabetes-related outpatient services or dialysis services by
region – 2019/2020 .................................................................................................. 28
Figure 20 Projected patients attending diabetes-related outpatient services or dialysis services
by region ................................................................................................................... 28
Figure 21 Unique patients with acute/arranged inpatient admission and primary diagnosis of
diabetes by region – 2019/2020 .............................................................................. 29
Figure 22 Projected patients with acute/arranged inpatient admission and primary diagnosis of
diabetes by region .................................................................................................... 29
Figure 23 Projected patients with acute/arranged inpatient admission and primary diagnosis of
diabetes: Northern Region DHBs ............................................................................. 30
Figure 24 Projected patients with acute/arranged inpatient admission and primary diagnosis of
diabetes: Midland Region DHBs ............................................................................... 30
Figure 25 Projected patients with acute/arranged inpatient admission and primary diagnosis of
diabetes: Central Region DHBs................................................................................. 31
Figure 26 Projected patients with acute/arranged inpatient admission and primary diagnosis of
diabetes: Southern Region DHBs ............................................................................. 31
Figure 27 National attribution of patients accessing outpatient and inpatient diabetes services
as a proportion of the VDR population .................................................................... 32
Figure 28 Percentage regional ethnic distribution of individuals diagnosed with diabetes ....... 34
Figure 29 Current ratio of individuals diagnosed with diabetes to FTE publicly-funded tier 1
dietitians ................................................................................................................... 36
Figure 30 Projected ratio of individuals diagnosed with diabetes to FTE tier 1 dietitians.......... 37
Figure 31 Current ratio of individuals attending diabetes-related outpatient services or dialysis
services to FTE publicly-funded tier 1 dietitians ...................................................... 38
Figure 32 Projected ratio of individuals attending diabetes-related outpatient services or
dialysis services to FTE tier 1 dietitians .................................................................... 39
Figure 33 Mood and anxiety disorders by age group, 2011-2019 .............................................. 40
Figure 34 Unique people accessing primary mental health services by region – 2017/2018 .... 42
Figure 35 Projected people accessing primary mental health services by region ...................... 42
Figure 36 Shared biological pathways influencing depression and obesity ................................ 43
Figure 37 Current ratio of people accessing primary mental health services to FTE publicly-
funded tier 1 dietitians ............................................................................................. 45
viiiFigure 38 Projected ratio of people accessing primary mental health services to FTE publicly-
funded tier 1 dietitians ............................................................................................. 46
Figure 39 Medication of people with diabetes in New Zealand, by age group .......................... 53
Tables
Table 1 Summary of results for cancer, diabetes and mental health ........................................... v
Table 2 Patient groupings for scenario analysis ............................................................................ 6
Table 3 Distribution of dietetic workforce by setting of work and region .................................. 13
Table 4 Distribution of FTE dietetic workforce by setting of work and region ........................... 13
Table 5 Ratio of FTE DHB clinical tier 2 dietitians to patients receiving inpatient and outpatient
cancer treatment...................................................................................................... 24
Table 6 Primary care workforce model for best practice diabetes care ..................................... 35
Table 7 Ratio of FTE publicly-funded tier 1 dietitians to individuals diagnosed with diabetes .. 36
Table 8 Ratio of FTE publicly-funded tier 1 dietitians to individuals attending diabetes-related
outpatient services or dialysis services .................................................................... 37
Table 9 Mental health workforce per 100,000 population ......................................................... 41
Table 10 Ratio of FTE publicly-funded tier 1 dietitians to patients accessing primary mental
health services .......................................................................................................... 45
Table 11 Dietitian FTE requirements for a primary prevention approach to multimorbidity in
highly deprived communities ................................................................................... 47
Table 12 Dietitian FTE requirements for a secondary prevention approach to multimorbidity in
highly deprived communities ................................................................................... 48
ix1 Background
Dietitians New Zealand commissioned NZIER to analyse the available data to estimate the
supply of and need for dietetic input in publicly-funded health services for people with
cancer, diabetes and mental illness, and to identify, in light of any identified unmet need,
what the optimal role would be for dietitians in the future health and disability system.
1.1 The registered dietetic workforce
1.1.1 Supporting optimal health and well-being
Dietitians are registered health practitioners who translate evidence about nutritional
intake into practical strategies for people to achieve and maintain health and wellness.
Dietitians in New Zealand work in partnership with individuals, whānau, communities and
populations, in various states of health and illness and across settings of care. In the health
and disability sector, dietitians’ workplaces include publicly funded health providers, health
centres, hospitals, rest/care homes, and private practices.
Dietitians’ work can include promoting and protecting public health, directing and
delivering medical nutrition therapy services, and managing food and health systems.
There is a wealth of evidence in the published literature to support the benefits of dietetic
services for a range of patient groups. Good health and wellbeing through dietetic support
is not an expensive luxury: Evidence suggests that for every dollar spent on dietetic support
in tier 1 settings, the health system receives a cost saving benefit of $5 to $6.40 from
reduced hospitalisation and reduced medical treatment (Howatson, Wall, and Turner-
Benny 2015).
In terms of the conditions and health needs managed by dietitians, across all employment
settings, the dominant conditions and health needs are older people and aged care,
diabetes, oncology, obesity, and mental health.
Amongst six leading risk factors identified by the Global Burden of Disease Study (IHME
2019), dietitians are uniquely trained to directly address three – dietary risks, high body
mass index, and high fasting blood glucose – and to contribute to addressing the others
(see figure below).
1Figure 1 Percentage of health loss attributable to leading risk factors in New
Zealand
In 2017, and 1990-2017
Source: Ministry of Health (2020a)
1.1.2 A highly educated and trained workforce
Dietitians are highly educated professionals, with 77 percent of New Zealand’s dietetic
workforce holding a postgraduate diploma, master’s degree or PhD (the remainder with
state exam or undergraduate qualifications) (Dietitians Board of New Zealand 2020).
Approximately 84 percent of dietitians in New Zealand also meet the requirements to
become non-medical prescribers (Dietitians Board statistics provided by Dietitians New
Zealand). These practitioners have either graduated from an accredited New Zealand
Dietetic Education Programme since 2014 or passed the ‘Dietitian Prescriber’ Training
Course. Dietitian Prescribers must have an approved prescribing supervisor, and, on an
annual basis, complete self-audits and peer reviews of their prescribing, and undertake
continuing professional development in prescribing. Prescribing is monitored through
quarterly reports on prescription transactions received from the Ministry of Health by the
Registrar, a dietitian auditor and the Board, to ensure that Special Foods and approved
nutrition related medicines are being prescribed appropriately and safe practice is being
undertaken (Dietitians Board of New Zealand 2020).
Dietitians’ high quality training leads to a higher level of effectiveness. For example, a meta-
analysis showed that dietitians achieve better weight loss than non-dietitians (Sun et al.
2017).
21.1.3 A regulated workforce assuring quality for all patients
Individuals wishing to practise dietetics in New Zealand (or be known as a dietitian) must,
by law be registered with the Dietitians Board of New Zealand (the Dietitians Board) and
hold a current Annual Practising Certificate (APC). This means dietitians are approved as
having the appropriate qualification and considered fit for registration and competent to
practise (as required under section 15 of the Act). Practicing certificates must be renewed
annually and practitioners need to assure the Dietitians Board they have maintained their
competence (and fitness to practise by meeting recertification requirements and making a
declaration (Dietitians Board of New Zealand 2020).
Dietitians are regulated practitioners under the Health Practitioners Competence Assurance
Act 2003 (HPCAA) which requires the Dietitians Board to ‘set standards of clinical
competence, cultural competence (including competencies that will enable effective and
respectful interaction with Māori), and ethical conduct to be observed by health
practitioners of the profession’. These are generally referred to by Regulatory Authorities as
professional standards and competencies.1
These standards were reviewed and updated in 2016 and 2017 culminating in the revised
Professional Standards & Competencies for Dietitians.
1.1.4 Critically different from nutritionists
As described above, dietitians are a well-defined group of highly trained and highly
accountable professionals. Although they may sometimes work in many of the same
settings as nutritionists, it is important to note that nutritionists may not present the same
opportunities for the health system. This is because the term ‘nutritionist’ can be used
freely by anyone because there isn’t a specific qualification or a legal registration process
for nutritionists. A nutritionist may be highly qualified in a specialty area of nutrition but
may equally be someone providing nutrition counselling services with no formal training at
all. This is the reason registered dietitians are often found working in multidisciplinary
secondary care teams while nutritionists typically are not.
In practice, these features mean that:
• Dietitians are equipped and accountable to deliver evidence-based care for more
complex patients.
• The dietitians’ standards and training provide a high level of assurance that they can
function well working with medical professionals in a collaborative team-based care
environment.
• Dietitians face severe consequences for malpractice, meaning high safety and
effectiveness standards are key strengths of dietitians that cannot be assured to the
same degree by nutritionists.
• Dietitians could be considered for extended scopes of practice with appropriate
safeguards in place.
Because of dietitians’ education and registration, the quality of their services is assured in
secondary care, working with demanding and/or complex environments and patients with
multiple challenges related to scientific, social, economic, cultural, and personal factors.
1 https://www.dietitiansboard.org.nz/practitioners/
32 Our approach
The objective of this report is to identify the value of dietetic input in publicly-funded
health services, the demand for dietitians in New Zealand across tier 1 and tier 2 services,
and the magnitude of unmet need. The focus is on dietetic services for people with cancer,
diabetes and mental illness.
We present a range of evidence indicating that a greater role for registered dietitians in tier
1 services would be aligned with the triple aim framework of equity, quality and value and
support greater sustainability of the system as a whole.
2.1 The principles
The principles we applied to assessing the evidence are the three components of the Triple
Aim: Quality, equity2 and efficiency. And, because system change requires more than a
framework designed for relatively minor health service quality improvement, we were also
guided by consideration of a fourth dimension: sustainability, for which provider experience
(workplace stress or enjoyment, workloads and professional relationships) and the
acknowledgement that the health budget may be able to grow over time, but should not
grow further relative to other important areas of government spending are important
considerations.
Figure 2 The triple aim
Source: Health Quality and Safety Commission
2 The HQSC definition of equity “means people receive the care they require – as distinct from health equality (where everyone receives
the same).” This means working towards eliminating “avoidable and unfair differences in health outcomes”. (HQSC. 2017. Health
Equity. https://www.hqsc.govt.nz/our-programmes/other-topics/new-projects/health-equity/) in ways that are consistent with the
Ministry of Health’s Te Tiriti o Waitangi (Te Tiriti) Framework (Ministry of Health. 2020. Te Tiriti o Waitangi Framework.
https://www.health.govt.nz/system/files/documents/pages/whakamaua-tiriti-o-waitangi-framework-a3-aug20.pdf)
42.2 Data
Our analysis of need is based on New Zealand data, including:
• The NMDS (national database of inpatient events, including day patients)
• The NNPAC (national database of outpatient events, including emergency department)
• PRIMHD (primary mental health data)
• The VDR (Virtual Diabetes Register)
• The registered dietetic workforce data and projections contained in Health Workforce
New Zealand’s dietetic workforce model
• Population projections used for the Population-Based Funding Formula at the DHB-
level with age and ethnicity detail.
Because this is a data-based analysis and the VDR does not distinguish between different
types of diabetes, we simply refer to diabetes in this report. People with type 1 diabetes
and people with type 2 diabetes would benefit from dietetic services.
2.3 Disease group scenarios
To establish the need for dietetic input in tier 1 services, we defined patient groups that are
likely to benefit from dietetic support in tier 2 or tier 1 settings (see Table 2 below) and
which could be identified and quantified using the available data. We then considered what
evidence existed by which dietitian to patient ratios could be calculated and benchmarked.
For each selected scenario, we identified the number of people per year who could benefit
from dietetic input, calculated the number of dietitian full-time equivalents (FTEs) that
would be required to provide best practice care, and identified the gap relative to the
maximum possible dietetic input that the relevant population could receive.
5Table 2 Patient groupings for scenario analysis
Service intensity
Least intense Most intense
Setting of
Tier 1 Tier 1 Tier 1 and/or Tier 2
care
Cancer People who have had cancer People who have had cancer People with cancer receiving
treatment and have fully treatment and are being hospital-based care. This is
recovered may benefit from followed up through outpatient increasingly delivered on an
dietetic support to maintain a services. may benefit from outpatient or day patient
healthy lifestyle and prevent dietetic support to help recover basis.1
recurrence. from cancer and the effects of
treatment.1
Diabetes People with a diabetes People with a diabetes People with a diabetes
diagnosis. All people with a diagnosis who are using diagnosis who have had at least
diabetes diagnosis should get outpatient services (specialist one acute inpatient admission
some level of dietetic support care and/or dialysis). These with a primary diagnosis of
and this should be in a tier 1 people are likely to be diabetes within the year.
setting. experiencing complications of Avoiding this outcome is the
diabetes. goal of better primary care.
Mental People using primary mental People using primary mental People with at least one
illness health services may benefit health services who have admission to an inpatient
from a dietetic assessment in physical health comorbidities mental health facility are likely
a tier 1 setting. A sub-group where diet is a factor. These to have severe mental illness.
will require additional people would benefit from Dietetic support may be
dietetic support for lifestyle dietetic support within a required within inpatient
changes. multidisciplinary tier 1 team. facilities. Post-discharge
support could also be
beneficial.
1These groups cannot be separately identified in the data due to treatment being increasingly provided in an
ambulatory model, including through outpatient services. Outpatient data identifies health speciality but not
procedures.
Groups shaded blue and outlined provided scenarios for analysis.
Source: NZIER
2.4 Dietitian to patient ratios
A literature scan identified best practice dietitian FTE to patient ratios for cancer care and
diabetes care, as well as dietitian FTE to patient ratios observed overseas in diabetes care3.
For mental health, no best practice ratio was identified in the literature, so a ratio was
tested to reflect a need for nutritional assessment for all mental health patients and a high
likelihood of need for ongoing dietetic input, given the high prevalence of multi-morbidity
in mental health patients.
As a result of the scenario-building process, the scenarios analysed for demand, supply and
unmet need are:
• Dietetic care for people receiving publicly-funded cancer treatment through either
inpatient or outpatient services or follow-up care through outpatient services. Care is
assumed to be provided by the current workforce of publicly-funded District Health
Board (DHB)-employed dietitians in non-community clinical roles (e.g. through
3
Published ratios are for type 2 diabetes but these ratios are applied to all people with a diabetes diagnosis in this analysis. It is likely that
people with a type 1 diabetes, who represent approximately 10 percent of the VDR population, would benefit from a similar ratio.
6outpatient services). A published ratio of dietitians to patients in the context of cancer
care provides a benchmark.
• Dietetic care for people with a diabetes diagnosis. Care is assumed to be provided by
the current workforce of publicly-funded primary care and community dietitians.
Published ratios of dietitians to patients provide benchmarks.
• Dietetic care for people with a diabetes diagnosis who are using outpatient diabetes
services (e.g. specialist visits and/or dialysis and home dialysis support). Care is
assumed to be provided by the current workforce of publicly-funded primary care and
community dietitians. In effect this scenario assumes that primary care and community
dietitians prioritise diabetes patients who have developed or are at risk of developing
complications. Published ratios of dietitians to patients provide benchmarks.
• Dietetic care for people with mild to moderate mental illness. Care is assumed to be
provided by publicly-funded primary and community dietitians. A ratio of dietitians to
patients is assumed based on non-mental health ratios of dietetic care.
The analysis compares the observed ratios of dietitians to patients for each scenario to the
benchmark ratio(s) and then calculates the resulting unmet need for dietitian FTEs. The
analysis is conservative because in each case, the implicit assumption is that the relevant
dietetic workforce (DHB hospital dietitians for cancer, and publicly-funded primary and
community dietitians for diabetes and mental health) is entirely dedicated to that patient
group.
2.5 Population scenarios
Finally, we consider how many dietitians would be needed if a patient-centred medical
home model of tier 1 care were available to:
• the most socio-economically deprived decile of the New Zealand population
• the most socio-economically deprived quintile of the New Zealand population.
In these scenarios we consider evidence that areas of high socioeconomic deprivation see
high rates of long-term conditions, multimorbidity, and a high prevalence of risk factors.
We apply a ratio from a staffing model with a focus on diabetes care, assuming that a
similar ratio is needed for the high rates of other conditions and risk factors amenable to
dietary intervention, and calculate the shortfall in the current dietitian supply to deliver:
• an aggressive primary prevention approach for all people living in socioeconomically
deprived communities.
• a secondary prevention approach for the 31 percent of the population living in
socioeconomically deprived areas estimated to be living with multimorbidity.
73 The opportunity and the challenge
New Zealand’s health and disability system is about to undergo a once in a generation
redesign.
The challenges facing the health and disability system and in particular tier 1 services
include:
• Increasing and rapidly ageing population
• Significant unmet need for primary care
• Increasing numbers of complex patients with multiple long term conditions
• Growing inequities for Māori and Pacific people
• A need for health care providers to spend more time with patients to take a holistic
approach to complex multi-morbidity and support patient self-management
• Progressive shifting of health services currently provided in a hospital setting out into
the community
• A need to provide care closer to patients’ homes
• An ageing GP workforce
• Poor coordination between general practice, community health and hospitals.
A major focus of the redesign will be strengthening primary care and tier 1 services to
provide improved access, support a shift of services from secondary care into tier 1
settings, improve preventive care, and in so doing, improve equity of access and outcomes
across the system.
DHBs are already asking GPs to take on more responsibility for services that have
traditionally been provided in tier 2 settings. Increased investment in preventive care will
demand even more of primary care teams.
But the current capacity of primary care is constrained. Both GP and nurse workforces are
ageing. Existing workloads are already considered high and unsustainable.
The direction of travel presents an opportunity for greater primary prevention to change
the mix of services and improve outcomes for all populations. Solutions that can enable this
shift of services from secondary care to tier 1 settings and also strengthen the ability of tier
1 settings to meet the demand for those services while also providing better access and
more equitable and preventive care are desperately needed.
3.1 The opportunity: Dietitians are key to addressing current demand drivers
Identifying the appropriate solution requires an understanding of the drivers of the
problem. The high and increasing burden of health loss attributable to long term conditions
is at the heart of the pressure across tier 1 and tier 2 services.
8Figure 3 Leading causes of health loss in the New Zealand population
Source: (Ministry of Health (2018)
Much of this burden is attributable to poor diet and the increase in obesity across all age
groups (Howatson, Wall, and Turner-Benny 2015). Poor diet has been estimated to be
responsible for 18.2 percent of the total health system cost of cardiovascular disease and
diabetes (Jardim et al. 2019).
The impact of non-communicable disease can be devastating for individuals, families and
communities, from quality of life impacts, productivity and income loss, and premature
death. These impacts are largely preventable through interventions that reduce tobacco
use, harmful alcohol use, inadequate physical activity and unhealthy diets (Howatson, Wall,
and Turner-Benny 2015).
Other nutritional risks add to the pressure, especially with population ageing. Older people
are at high risk of malnutrition and have an increased risk of developing health issues as
result of inadequate nutritional intake (North et al. 2018). A 51 percent greater risk of
hospitalisation and 54 percent greater risk of mortality were associated with nutritional risk
in the Birmingham Study of Ageing (Buys et al. 2014).
But improvement in the nutritional status of individuals through education and better
access to healthy food can have a significant impact on well-being (Howatson, Wall, and
Turner-Benny 2015).
The evidence in favour of increasing dietetic input in tier 1 services is strong and this report
presents only a sample to illustrate the direct impact on all three dimensions of the Triple
Aim and beyond. Although the focus of this report is on dietetic services for cancer,
diabetes and mental illness, it is important not to ignore the additional benefits of dietitian
presence in collaborative team-based tier 1 services as to do so would understate the
return on investment that may be achieved.
9Impacts on effectiveness of dietetic interventions
A major question that arises in the context of tier 1 services is likely to be why dietetic
interventions should be delivered by dietitians and not by nurses, GPs or other
professionals, such as nutritionists.
New Zealand-based studies have identified that GPs and practice nurses lack adequate
nutrition knowledge to effectively support patients to achieve better outcomes through
dietary changes; lack the time required to educate and counsel patients on dietary change;
and lack confidence in the effectiveness of dietetic interventions. As a result, dietetic
interventions by GPs and practice nurses tend to be inconsistent (Claridge et al., 2014;
Parry Strong et al., 2014; Crowley et al., 2015; Ball et al., 2014. As cited in Beckingsale,
Fairbairn, and Morris (2016)). With specific expertise in nutrition, counselling for behaviour
change, and health promotion, registered dietitians are able to provide more effective
dietetic interventions, and because dietitians are a lower cost input than GPs as well, these
interventions are highly likely to be more cost-effective.
Dietitians working with GPs and practice nurses in a collaborative tier 1 team can share
knowledge and expertise to improve the effectiveness of nutrition-related advice across the
team: A study of registered dietitian integration in primary care (Kolasa et al., 2010) noted
that the presence of a registered dietitian in a primary care setting increased physicians’
comfort and confidence that their practice had the capacity to address childhood obesity.
Impacts on GP workload and access to services
Increased use of dietetic services can significantly reduce GP workloads. Nutrition needs are
common in general practice, being a feature of 16 percent to 24 percent of all GP visits
(MacDonald Werstuck and Buccino 2018).
Patients with conditions that are treatable or manageable with dietary interventions see
GPs more than average. Irritable bowel syndrome (IBS) is one of the top ten reasons for
visiting a GP in New Zealand (BPJ 2014).
A new IBS pathway for a dietitian-led gastro clinic showed that dietitians can reduce
symptoms (and therefore reasons to see the GP): 63 percent of patients achieved
satisfactory control of IBS after receiving specialist dietetic support and 74 percent had
improved quality of life (Williams et al. 2016).
Impact on equity
Inequities in health disadvantage Māori, resulting in poorer health outcomes. Early dietetic
intervention can potentially improve health outcomes for Māori suffering from diabetes,
cancer, cardiovascular disease and other long-term conditions.
The literature on equity dimensions of dietary needs reveals that the cost of healthy eating
is equivalent to roughly 44 percent of the disposable income of welfare-dependant families,
compared with 18 percent of the income of average-wage families (see for example
Kettings, Sinclair, and Voevodin 2009). This means that receiving instructions to eat
healthily is often not enough and delivering dietary advice in this way can increase equity
gaps rather than close them.
Dietitians work with people to identify budget-friendly solutions and provide food
budgeting education as well as acting as powerful advocates in interactions with social
services to secure much-needed resources for adequate nutrition where there are
recognised health needs.
10Return on investment
A scan of the literature on the cost-effectiveness of dietetic interventions revealed
significant untapped potential. For example:
• A healthy diet could save the health system an average of approximately NZ$420 per
person per year (Jardim et al. 2019), with higher than average savings for ethnic
minorities, older people, and people of lower socioeconomic status. If just ten percent
of the New Zealand population could improve its diet, the health system could expect
to save $210 million per year just in cardiovascular disease and diabetes care. But in
reality, the savings resulting from improved diets would likely extend far beyond these
two conditions: Savings on treatment of dyslipidemia, stroke, osteoarthritis, cancer,
osteoarthritis, low back pain, sleep apnoea, asthma, gallbladder disease, dementia and
Alzheimer’s disease, depression and anxiety, digestive issues and tooth decay could be
expected.
• The inclusion of registered dietitians in primary care teams has been shown to be
effective and cost-saving in improving both health and economic outcomes. Savings of
NZ$5 to NZ$99 per dollar spent on nutrition interventions indicate a high return on
investment (MacDonald Werstuck and Buccino, 2018).
• A primary care dietitian-led clinic for patients with IBS (described above in terms of
improved outcomes) also generated reduced health system costs through 36 percent
fewer referrals to specialist care, resulting in a 25 percent cost reduction (Williams et
al. 2016).
• The appropriate treatment of malnutrition in primary care results in reduced GP visits
by patients and therefore has the potential to release GP time (Gandy 2014) as well as
reduced hospital admission (Nash 2017), taking pressure of hospitals which have been
facing mounting pressure from acute demand. Reducing the risk of malnutrition should
be a focus area for preventing hospital admissions and dietitians should play an
important role in admissions prevention strategies.
But the literature scan also identified two important issues:
• Identifying the return on investment from early and preventive interventions,
particularly those delivered within multidisciplinary teams, or to people receiving
multiple interventions, is extremely challenging and often impossible.
• Cost-effective interventions do not always result in health system savings. Increasing
access to services may at least in the short term result in increased costs, but
appropriate service design should ensure that greater value in the form of improved
health and quality of life are achieved. Closing the access and outcomes gap for
underserved requires additional health spending.
3.2 The challenge: Dietitians are a scarce resource
Currently, most dietary interventions by dietitians are limited to patients who are already
very unwell. Within DHBs, strict criteria exist to triage patients for access to dietetic
support. The vast majority of patients who could benefit from these services do not have
access unless they seek private dietetic services.
At the same time, GPs see many patients who need dietary interventions. Although GPs are
available to people at a lower cost than private dietitians (due to the current primary care
11business model which sees capitation and other primary care payments being directed
primarily to subsidise GP services), GPs will not typically provide dietetic input to the same
level of effectiveness as a registered dietitian:
• Patients frequently seek doctors’ advice on diet, but doctors rate their nutrition
knowledge and skills as inadequate (Darer et al. 2004).
• More than one-half of graduating medical students report that the time dedicated to
nutrition instruction is inadequate (Association of American Medical Colleges 2004).
3.2.1 The dietetic workforce
The most recent data (as of 31 March 2020) indicates there are approximately 748
dietitians working in New Zealand (according to Ministry of Health dietitian workforce
modelling shared with NZIER by Dietitians New Zealand). This number is projected to
increase to 878 by 2030, based on continued rates of workforce entry and exit.
The current and projected regional distribution of dietitians provides for a ratio of 15.0 per
100,000 population nationally, with a range of 10.4 to 17.7 regionally. The ratio of dietitians
to population is highest in the Southern Region (17.7 per 100,000 population). And
concerningly, the projected ratio of dietitians to population is expected to rise then fall
slightly in the Northern Region (from 16.3 in 2020 to 17.0 in 2025 and 16.5 by 2030). The
Midland Region is and is expected to continue to be the region with the lowest ratio of
dietitians to population.
Many dietitians work part-time. As a result, the ratio of FTEs in New Zealand is considerably
less than the headcount ratio (9.6 FTEs in 2020, compared with 15.0 headcount ratio). This
number is projected to increase to 10.3 FTEs by 2030 based on continued trends of
workforce entry and exit.
Figure 4 Dietitian to population ratio, projected 2020-2030 by region
Northern Region Midland Region Central Region Southern Region National
25
Dietitian to population ratio, projected
2020-2030 (per 100,000 population)
20
15
10
5
0
2020 2021 2022 2023 2024 2025 2026 2027 2028 2029 2030
Year
Source: NZIER, Ministry of Health
12Figure 5 FTE dietitian to population ratio, projected 2020-2030 by region
Northern Region Midland Region Central Region Southern Region National
projected 2020-2030 (per 100,000 12
FTE Dietitian to population ratio,
10
8
population)
6
4
2
0
2020 2021 2022 2023 2024 2025 2026 2027 2028 2029 2030
Year
Source: NZIER, Ministry of Health
Table 3 Distribution of dietetic workforce by setting of work and region
Based on 2020 Dietitian headcount workforce projections
Publicly funded tier 1 DHB clinical tier 2 Other*
Region
headcount headcount headcount
Northern Region 59.4 134.4 112.2
Midland Region 19.8 44.8 37.4
Central Region 24.1 54.5 45.5
Southern Region 40.2 90.9 75.9
National 145.3 328.5 274.2
* “Other” means dietitians working in roles that are not publicly-funded tier 1 or DHB clinical tier 2. These may
be roles in education, administration, or private sector roles including industry and private practice.
Source: NZIER, MOH, Dietitians Board of New Zealand (2019)
Table 4 Distribution of FTE dietetic workforce by setting of work and region
Based on 2020 FTE Dietitian workforce projections
Publicly funded tier 1 DHB clinical tier 2 Other*
Region
FTE FTE FTE
Northern Region 39.09 88.41 73.80
Midland Region 13.30 30.09 25.12
Central Region 15.75 35.62 29.73
Southern Region 23.58 53.32 44.50
National 92.83 209.94 175.23
* “Other” means dietitians working in roles that are not publicly-funded tier 1 or DHB clinical tier 2. These may
be roles in education, administration, or private sector roles including industry and private practice.
Source: Source: NZIER, MOH, Dietitians Board of New Zealand (2019)
13According to the Dietitians Board of New Zealand (2019), approximately 43.9 percent of the
dietetic workforce currently work in a DHB clinical, non-community setting. These are likely
to be hospital-based dietitians, including those in outpatient and inpatient settings.
Nationally, this amounts to 328 dietitians and 209.9 FTE. Assuming the same proportion
applies regionally, there would be between 45 and 88 dietitians working in DHB clinical,
non-community settings across the regions.
Also, according to the Dietitians Board of New Zealand (2019), approximately 13.4 percent
of dietitians work in DHB community settings and 6 percent of dietitians work in primary
care. These represent the current dietetic workforce employed in publicly-funded tier 1
settings. Nationally, this amounts to 145 dietitians and 92.8 FTE. Assuming the same
proportion applies regionally, there would be between 20 and 59 dietitians working in tier 1
settings across the regions.
3.2.2 Benchmarking the supply of dietitians in New Zealand
No definitive ratio of dietitians to population exists that would inform how adequate or
inadequate the current dietetic workforce is. However, a range of international figures do
provide some potential for benchmarking:
• In 1986 the benchmark figure of 14 dietitians per 100,000 population was obtained
from Canadian and US data (Siopis, Jones, and Allman‐Farinelli 2020).
• Australia’s national average ratio of dietitians to population was 15 per 100,000 in
2017 (Siopis, Jones, and Allman‐Farinelli 2020).
These ratios are based on actual workforce data, not on best practice. It is important to
note that other countries are facing the same issues as New Zealand, in having under-
invested in primary prevention for decades and experiencing a growing burden of demand
due to increasing prevalence of long-term conditions.
New Zealand’s current practising dietetic workforce of 478 (FTE) and population provides
for a ratio of only 9.6 dietitian FTEs per 100,000 population. This ratio is expected to
increase slightly to 10.3 respectively by 2030.
3.2.3 Scarcity of dietitians in publicly-funded tier 1 settings
According to the 2018/19 Annual Report of the Dietitians Board of New Zealand (Dietitians
Board of New Zealand 2019), over 60 percent of dietitians are on a DHB payroll, while only
six percent work in primary care. Of those on the DHB payroll, only 22 percent are in
community settings, meaning a total of less than 20 percent of dietitians currently work in
tier 1 settings while 44 percent of dietitians work in clinical roles in tier 2 settings (DHB,
non-community clinical).
14Figure 6 Registered dietitians’ main workplace
1% 1% DHB
2%
1%
Private practice
4% Education
6%
Primary health
6%
care
Industry
18% 61%
Government
Sport
NGO
Other*
Source: NZIER, Dietitians Board of New Zealand (2019)
Figure 7 DHB-employed registered dietitians’ main workplace
2%
4%
Clinical
22%
Community
Food service
72% Management
Source: NZIER, Dietitians Board of New Zealand (2019)
There are two fundamental problems with the relative scarcity of dietitians in tier 1
settings:
• The apparent lack of investment in dietetic services in tier 1 settings is inconsistent
with the shift that health system decision-makers have been attempting to execute to
enable better care, closer to home for New Zealanders.
• Dietitians are skilled at primary prevention interventions and addressing risk factors
for a range of long-term conditions, making tier 1 settings the most appropriate setting
of care for the majority of dietitians. The scarcity of dietitians in these settings means
the health and disability system is failing to obtain the full benefits that the dietetic
workforce can offer.
154 Cancer
Cancer is the leading cause of death in New Zealand. The number of people diagnosed with
cancer is projected to increase by 50 percent over the next 15 years (Ferlay et al. 2019). An
ageing population, earlier cancer diagnosis and improvements in treatment are
contributing to an increasing number of cancer patients and cancer survivors.
One in three people who get cancer can be cured if their disease is found and treated in
time (Kim et al. 2020).This means more people living as cancer survivors or with cancer as a
long term condition, which may mean multiple episodes of treatment with periods of
wellness in between.
The pressure on secondary care that has resulted from the expanding population of cancer
patients, along with developments in cancer care, has led to cancer care being provided on
an increasingly ambulatory basis (through outpatient or day patient services, avoiding
overnight stays in hospital) and to an expectation that tier 1 services will begin to play a
greater role in cancer services.
Published studies indicate that adults with cancer were more likely than those with other
long-term health conditions to be very high (20+ visits per year) or frequent (10-19 visits
per year) GP attenders and that one in three adults with cancer were either very high or
frequent GP attenders (see for example, National Health Performance Authority (2015).
These findings indicate that the trend towards increased cancer survival will place
significant pressures on GPs and that tier 1 services must be configured to cater for the
needs of this population.
But the type of care offered to cancer patients and survivors should be tailored to their
needs. A New Zealand based study identified that at any given time over 40 percent of
patients with cancer are receiving only ‘usual care’ from their GP and that comorbidities are
common, with nearly 40 percent having hypertension, 30 percent having gastrointestinal
disorders and 24 percent having mood disorders (Kim et al. 2020)– all of these being
amenable to dietetic intervention.
New models of care in general practice are needed to ensure that cancer patients have the
best possible quality of life and chance of survival. Overseas, comprehensive survivorship
care is increasingly provided by an interdisciplinary primary care team including social
services, psychology, nutrition, and other allied health professionals (Chaput and Sussman
2019).
Two critical points to note are that cancer incidence and survival are worse for Māori. It is
unclear to what extent this is associated with Māori being less likely to be under follow-up
care from their GP during and after cancer treatment (RNZCGP 2020). From an equity point
of view, it will be important to strengthen links between tier 1 and tier 2 services.
4.1 Demand for dietitians in cancer care
New cancer registrations are a driver of demand for cancer care and for dietetic services.
The New Zealand Cancer Registry (NZCR) shows that in 2018 (the last year available), there
were 26,110 new cancer registrations in New Zealand, with the Northern Region
experiencing the largest share and the Central Region the smallest share (see Figure 8
below).
16You can also read