Oregon Integrated HIV Prevention and Care Plan, 2017 2021 - September 2016
←
→
Page content transcription
If your browser does not render page correctly, please read the page content below
Oregon
Integrated HIV Prevention and Care
Plan, 2017 - 2021

September 2016
Table of Contents
Introduction:............................................................................................................................................... 4

    Background: ........................................................................................................................................... 4

    Oregon’s Integrated HIV Planning: ........................................................................................................ 4

        IPG Vision .......................................................................................................................................... 5

        IPG Mission ....................................................................................................................................... 5

        IPG Values ......................................................................................................................................... 5

        IPG Structure ..................................................................................................................................... 5

        IPG Membership ............................................................................................................................... 5

        Planning Process for 2017-2021 Integrated Plan ............................................................................. 6

        Coordination with Oregon’s State Health Improvement Plan ........................................................ 7

        How Comprehensive HIV Planning Aligns with Public Health Modernization ............................... 7

Statewide Coordinated Statement of Need ............................................................................................... 8

    Epidemiologic Overview ........................................................................................................................ 8

        Oregon HIV Facts at a Glance ........................................................................................................... 8

        Prevalence of HIV/AIDS in Oregon ................................................................................................... 8

        Characteristics of PLWH in Oregon .................................................................................................. 9

        Geographic Distribution of HIV Cases ............................................................................................ 10

        Characteristics of PLWH with Delayed Diagnosis .......................................................................... 11

        PLWH with Co-Morbidities ............................................................................................................. 11

        HIV Mortality .................................................................................................................................. 13

        HIV Risk Behaviors in Oregon ......................................................................................................... 13

    HIV Care Continuum ............................................................................................................................ 17

    Financial and Human Resources Inventory.......................................................................................... 20

        Financial Resources ........................................................................................................................ 20

        Human Resources and Workforce Capacity................................................................................... 23

        Interaction of Funding Sources ...................................................................................................... 23

        Resource Gaps and Oregon’s Plan to Fill Them ............................................................................. 24
                                                   2
Assessing Oregon’s Needs, Gaps, and Barriers Related to HIV Care and Prevention Services ............ 25
Needs Assessment Process............................................................................................................. 25
Prevention and Care Service Needs, Gaps, and Barriers for PLWH and Persons at High Risk for
HIV Infection ................................................................................................................................... 26
Data: Access, Sources, and Systems ................................................................................................... 35
Main Sources of Data Used for Oregon Needs Assessment & Care Continuum .......................... 36
Local Data Policies .......................................................................................................................... 37
Data We Dream About ................................................................................................................... 38
Oregon’s Integrated HIV Prevention and Care Plan ................................................................................. 40
Oregon’s Goals, Objectives, Strategies, and Activities ........................................................................ 40
Resources Needed .......................................................................................................................... 58
Challenges and/or Barriers to Consider and Overcome ................................................................ 58
Collaborations, Partnerships, and Stakeholder Involvement .............................................................. 59
Stakeholder & Partner Contributions ............................................................................................ 59
New Stakeholders & Partners to Engage in 2017-2021 ................................................................. 59
Letter of Concurrence ..................................................................................................................... 59
People Living With HIV (PLWH) and Community Engagement ............................................................ 60
Representation of PLWH and People at Risk ................................................................................. 60
How PLWH Contributed to Plan Development .............................................................................. 60
Community Engagement Strategies ............................................................................................... 60
Monitoring and Improvement.................................................................................................................. 61
Oregon’s Monitoring and Improvement Plan ...................................................................................... 61
Process for Updating the IPG, Other Planning Bodies, and Community Stakeholders ................ 61
Plan to Monitor & Evaluate Implementation of Oregon’s Goals and Objectives......................... 61
Strategy for Assessing and Improving Health Outcomes along the HIV Care Continuum ........... 62
3Introduction:
Background:
The Centers for Disease Control and Prevention (CDC) and the Health Resources and
Services Administration (HRSA) require jurisdictions who receive federal funding to
engage in a collaborative planning process to develop local strategies to accelerate
progress toward reaching the goals of the National HIV/AIDS Strategy. The ultimate goals
are to prevent new HIV infections, increase access to care and improve health outcomes,
and reduce HIV-related health disparities.
Oregon’s Integrated HIV Planning:
The Oregon Health Authority Public Health Division is committed to lifelong health for all
people in Oregon. The Public Health Division’s (PHD) mission is to promote health and
prevent the leading causes of death, disease and injury in Oregon, including HIV, Viral
Hepatitis (VH), and other sexually transmitted diseases (STD).
In 2012, the HIV/STD/TB Section of the Oregon Health Authority, the HIV Prevention and
Part B grantee, convened a statewide planning group to promote and support a
comprehensive and integrated approach to:
1) Prevent HIV infection and co-infections with VH and STD, and
2) Provide quality care for those who are infected with HIV and co-occurring VH
and/or STD.
This planning group, called the Integrated HIV/VH/STD Planning Group (IPG) represents a
departure from past planning efforts, in which responsibility for planning HIV prevention,
HIV care services, STD prevention and care, and VH prevention and care activities was
held by separate entities. The IPG aims to identify the knowledge, create tools, and
promote networks that people and communities in Oregon need to protect their health
from all of these related infections. The Portland Transitional Grant Area (TGA) Planning
Council remains a separate body from the IPG but has strong participation and
coordination with the IPG.
4IPG Vision
We envision an Oregon where, through prevention, new HIV infections are rare and
viral hepatitis and sexually transmitted co-infections are prevented and addressed
effectively. When new HIV infections do occur, every person will have access to high
quality care, free from stigma and discrimination.
IPG Mission
The mission of the IPG is to regularly identify strengths, needs, gaps, and service priorities,
resulting in a comprehensive plan that will support people in Oregon living with, affected
by, or at risk for HIV/VH/STD to live healthy lives.
IPG Values
IPG meetings and decisions seek to be:
1) Inclusive of all Oregonians, including those living with and at risk for HIV from both
urban and rural areas
2) High quality, promoting services that are evidence-based and user-friendly
3) Compassionate to the diverse populations we serve
4) Community-focused, so that recommendations are useful and accessible to the
communities we serve
IPG Structure
The IPG meets three to four times annually. In addition, each IPG member has
opportunities to participate in topic-specific committees each year.
IPG Membership
As of 2016, the IPG includes 36 individuals representing people living with HIV and at risk
of HIV infection, HIV prevention, all parts of the Ryan White Care continuum, Coordinated
Care Organizationsi, corrections, alcohol and drug prevention and treatment, higher
education, and hospice. People living with HIV (PLWH) comprise about 40% of the current
IPG membership. About half of the IPG membership are from the Portland metropolitan
area and half come from a broad representation of our large and diverse state, including
i
A Coordinated Care Organization (CCO) is a network of all types of health care providers (including physical,
behavioral, and dental health) who have agreed to work together in their local communities to serve people
receiving health care coverage from the Oregon Health Plan (Medicaid). As of this writing, there are 16 CCOs
operating in communities around Oregon.
5the Willamette Valley, and Eastern, Central, Southern, and Coastal Oregon. A full
membership table is included as Appendix A.
Planning Process for 2017-2021 Integrated Plan
The IPG has primary responsibility for creating Oregon’s Integrated HIV Prevention and
Care Plan for 2017-2021. The Integrated HIV Plan is inclusive of information previously
published as separate documents: the CDC Jurisdictional and Comprehensive HIV
Prevention Plan, the HRSA Statewide Coordinated Statement of Need (SCSN), and the
HRSA Comprehensive Plans for both Ryan White Part A and Part B. This living document is
intended as a roadmap to guide Oregon’s HIV prevention and care planning on an ongoing
basis.
Oregon submitted one integrated state HIV prevention and care plan to CDC and HRSA in
September 2016.
The IPG’s collaborative planning process included 6 meetings in 2015-2016 which
convened partners across the Ryan White continuum of care to review data, identify
needs and gaps, and develop strategies for addressing Oregon’s shared HIV prevention
and care goals. The meetings included a geographically representative group of people
living with HIV, and key partners representing prevention and the entirety of the Ryan
White continuum of care. Stakeholder feedback was collected in six key ways:
Needs assessment data via the HIV Medical Monitoring Project, surveys of the
CAREAssist/AIDS Drug Assistance Program clientele, and additional ad hoc
assessments of clients and providers.
Three in-person meetings with the IPG in 2015, during which members reviewed
needs assessment data, developed content for the Integrated Plan, and begin to
identify gaps, barriers, and strategies for addressing Oregon’s goals.
Three in-person meetings with the IPG in 2016 to develop and refine the
prevention, care, and health equity strategies that were identified in 2015.
On-line feedback from the IPG membership and other community stakeholders to
approve a list of activities, synthesized from the many ideas generated at IPG
meetings.
IPG member review and feedback on all documents generated from June-Aug
2016, ultimately resulting in a Letter of Concurrence at the end of the process.
Additional meetings with key stakeholders who are under-represented at IPG.
A Webinar with live feedback/discussion options.
6 A public comment period and widely-distributed invitation for feedback.
Of special note: although Part A is represented on the IPG, we invited additional Part A
Planning Council members to join regular IPG meetings in 2016, in order to ensure full
collaboration in the Comprehensive Planning Process. These members participated in all
discussions, had opportunities to review all documents, and served as liaisons between
the Part A Planning Council and the IPG. Several applied for IPG membership and became
full IPG members during the course of the year.
Coordination with Oregon’s State Health Improvement Plan
Oregon’s State Health Improvement Plan (SHIP) identifies seven key priorities for the
state, including “protecting the population from communicable disease.” The 2017-2021
Integrated HIV Prevention and Care Plan addresses this goal, with the specific aim of
reducing forward transmission of HIV, and co-occurring HCV, STD, and TB, through
implementation of evidence-based public health interventions, including primary
prevention and secondary prevention through provision of medical and supportive
services that promote viral load suppression.
How Comprehensive HIV Planning Aligns with Public Health Modernization
Since 2013, Oregon has been working to modernize its public health system so that a
common set of core public health capabilities and programs are present in all
communities in the state. The goals of Oregon’s modern public health system include:
1) Achieving sustainable and measurable improvements in population health;
2) Protecting individuals from injury and disease; and
3) Being fully prepared to respond to any public health threats that may occur.
Communicable disease control, prevention and health promotion, and access to clinical
preventive services are three of the four foundational programs in Oregon’s modernized
public health system—all of which are germane to HIV prevention and care. An
assessment of the current implementation of the modernization framework by Oregon’s
local public health authorities indicates that there are gaps in the current system that will
require innovative solutions to breach. This plan identifies some of those innovative ideas
for future service delivery and builds on Oregon’s history of delivering HIV services
through regional models, by sharing resources across local public health authorities, and
through public-private partnerships.
7Statewide Coordinated Statement of Need
Oregon’s Statewide Coordinated Statement of Need (SCSN) is designed to describe the
needs of persons at risk for HIV infection and people living with HIV (both those receiving
care and those not receiving care), current resources available to meet those needs, and
gaps in HIV prevention and care services.
Epidemiologic Overview
Oregon HIV Facts at a Glance
As of Dec. 31, 2014:
• 6,605 people were estimated to be living with HIV/AIDS in Oregon, including
people who moved to Oregon after their HIV diagnosis. Fifty percent (3,279/6,605)
of those living with HIV/AIDS in Oregon resided in Multnomah County at the end
of 2014.
• From 2010 to 2014, approximately 240 people were diagnosed with HIV infection
annually in Oregon (about 170 diagnosed in TGA counties and about 70 in the
Balance of State).
• From 1981 to 2014, 9,692 Oregon residents were diagnosed with HIV infection;
42% (4,070/9,692) died.
• During the past decade, an average of 93 persons with HIV died in Oregon each
year, some from other primary causes of death.
Prevalence of HIV/AIDS in Oregon
HIV/AIDS remains an important public health problem in Oregon. From 1981 through
2014, 9,692 HIV infections were diagnosed in Oregon residents; as of the end of 2014,
approximately 42% (4,070/9,692) had died (Figure 1). From 1995-2014, an average of 256
new cases were reported each year. This average is declining, with approximately 240
new diagnoses reported each year, on average, in Oregon between 2010 and 2014.
The Oregon Health Authority estimates that 6,605 people with diagnosed HIV infection
were living in Oregon at the end of 2014. This total includes approximately 2,026 people
who lived outside of Oregon at the time of their diagnosis.
8Figure 1. HIV diagnoses and deaths in Oregon, 1981–2014
600
500
400
300
200
100
0
Oregon diagnoses Deaths among Oregon diagnoses
Characteristics of PLWH in Oregon
Eighty-eight percent (5,803/6,605) of Oregon residents living with HIV/AIDS were male,
77% (5,050/6,605) were white, and the average age was 48 years. Men who have sex with
men (MSM) and MSM who injected drugs (MSM/IDU) accounted for 84% (4,883/5,803) of
male residents living with HIV/AIDS.
Among males, MSM accounted for 70% of cases diagnosed during 2005–2014
(1,580/2,253). Other transmission categories included men who use injection drugs (5%),
MSM who also use injection drugs (10%), and men who likely or possiblyii acquired their
infection from heterosexual transmission (4%). Approximately 10% of recent male
diagnoses lacked sufficient information to assign a transmission category.
Among females, IDU accounted for 22% of cases and women who likely or possiblyiii
acquired their infection by heterosexual transmission accounted for 77% of cases. The
remainder included cases that lacked sufficient information for classification.
iiIncludes men who affirmed having sex with women and denied injection drug use, transfusions or
transplants during the time the blood supply was not being adequately screened for HIV.
iii
Includes women who affirmed sex with men and denied injection drug use, sex with men or transfusions
or transplants during the time the blood supply was not being adequately screened for HIV.
9Recent demographic trends, among cases diagnosed from 2005-2014, include the
following:
Statewide, men were approximately seven times more likely than women (12.0 vs.
1.6 per 100,000) to be diagnosed with HIV. The average age at diagnosis was 37.7
years for males and 36.8 years for females.
New diagnosis rates were nearly five times higher among Blacks and African
Americans than whites (27.4 vs. 5.9 per 100,000).
The rate of new diagnoses for Latinos was 1.8 times higher than for white non-
Latinos (10.7 vs. 5.9 per 100,000).
Other races and ethnicities accounted for roughly 6% of all diagnoses.
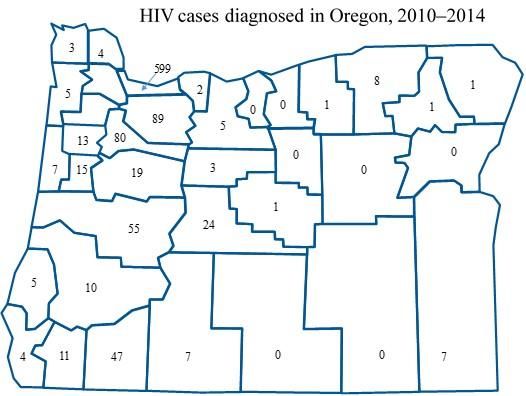
Geographic Distribution of HIV Cases
Of the 1,202 recent HIV diagnoses (2010 to 2014), 50% (n=599) were diagnosed in one
county, Multnomah (Figure 2).
Figure 2:
155
20
Oregon’s HIV service delivery area is divided geographically into Part A, which includes five
counties in and around the Portland metropolitan area (Clackamas, Columbia, Multnomah,
Washington and Yamhill), and Part B (the Balance of State), which includes the remaining 31
Oregon counties stretching to the Washington, California, Idaho, and Nevada borders. Part A’s
service area also includes Clark County in Washington State. Although Clark County service
needs are not included in this statewide Oregon plan, we are mindful that Clark County clients
do receive Part A services on both sides of the Oregon/Washington border.
10Although Oregon is a large, primarily rural state, a majority of PLWH were diagnosed in and/or
receive Ryan White-funded services in the counties located along the I-5 corridor, which runs
through the major metropolitan areas along the western coast of the state.
Characteristics of PLWH with Delayed Diagnosis
Many Oregonians continue to be diagnosed with HIV infection at a late stage of disease
(Figure 3). Approximately 39% of cases (466/1,202) diagnosed during 2010 to 2014 either
had AIDS at the time of their initial HIV diagnosis or progressed to AIDS within 12 months
of initial HIV diagnosis. Late diagnosis was more common among some groups, including:
Latinos (compared to non-Latino whites): 47% of newly diagnosed Latinos
had delayed diagnosis compared to 39% of white, non-Latinos
People who inject drugs (PWID): 43% of PWID had delayed diagnosis
compared to 35% of MSM
Figure 3. HIV to AIDS in 12 months, Oregon 1981–
2014
120%
100%
80%
60%
40%
20%
0%
PLWH with Co-Morbidities
Hepatitis C (HCV) and hepatitis B (HBV) are common infections among people also
infected with HIV. HIV infection accelerates progression to cirrhosis, end-stage liver
disease and hepatocellular carcinoma caused by viral hepatitis. People who are co-
infected with viral hepatitis and HIV can also have fewer HIV treatment options.
Here are some key Oregon HIV and viral hepatitis facts at a glance:
11 At least 5% of deaths in people with HIV were liver-related (between 2006 and
2012). Most of these were from chronic hepatitis C.
19% of Oregonians with HIV reported ever having HCV; 20% reported ever having
HBV (based on MMP 2011-2014 data)
People who inject drugs are more likely to be HIV-HCV co-infected: Among
diagnosed HIV/AIDS cases in Oregon during 2004–2013 with history of reported
IDU, 33% of men (110/330) and 49% of women (34/70) also had chronic hepatitis
C by the end of 2013.
Viral hepatitis prevalence among Oregonians with HIV may be higher because of
underreporting.
Chronic HCV is a more severe infection in people with HIV than in people who are
not HIV-infected.
Sexually transmitted diseases (STDs) are indicators of ongoing high-risk sexual behavior,
such as multiple concurrent partners and inconsistent condom use, which could transmit
HIV. Having a concurrent STD may also increase the likelihood that PLWH can transmit HIV
to uninfected partners.
Here are some key Oregon HIV-STD facts at a glance:
During 2008–2013, the average annual rate of syphilis was 272 times higher
among people with HIV than among the general population (1,196 per 100,000 vs.
4.4 per 100,000).
During 2008–2013, the average annual rate of gonorrhea was 45 times higher
among people with HIV than among the general population (1,792 per 100,000 vs.
40 per 100,000).
Some people with HIV are more likely to have acquired another STD in the past 5
years (among people living with HIV as of Dec. 31, 2013): people < age 26, MSM,
men who have never progressed to AIDS, and urban dwellers.
Syphilis and HIV often occur together: During 2014, people with HIV accounted for
42% of Oregon’s new early syphilis cases.
12HIV Mortality Of 9,692 cumulative cases of HIV infection diagnosed in Oregon from 1981 to 2014, 4,195 (43%) had died by Dec. 31, 2014. The advent of antiretroviral medications in the mid- 1990s dramatically improved treatment outcomes. The probability of surviving five years after diagnosis was approximately 42% among people diagnosed in 1990, whereas for people diagnosed with HIV in Oregon from 2004 to 2013, the probability of surviving 10 years after diagnosis was 88%. The number of deaths among people with HIV declined from 354 deaths during 1995 to 70 cases during 2014. However, disparities exist. Some people have a lower probability of surviving 10 years after diagnosis compared to others. These include: American Indians or Alaska Natives (compared to white non-Latinos) People aged >36 years at diagnosis relative to people in younger age groups; People with CD4 counts
at risk based on local data. The HIV Prevention Program’s 2014-2015 needs assessment
identified three priority populations for HIV prevention activities in Oregon:
PLWH and their sex and needle sharing partners
Men who have sex with men (MSM) whose HIV status is unknown or was negative
at last test
People who inject drugs (PWID) whose HIV status is unknown or was negative at
last test.
PLWH and their sex and needle sharing partners:
Oregon is an HIV Medical Monitoring Project (MMP) site, collecting data annually from
PLWH receiving medical care in Oregon. According to MMP data collected from 2011-
2013 (N=776), one in eight (12%) people receiving HIV care in Oregon have had
unprotected vaginal or anal sex with a partner of negative or unknown HIV status in the
past 12 months (9% among men, 17% among women). One in five (20%) MMP
participants reported unprotected sex only with HIV-positive partners, which warrants
concern about STD transmission.
Six percent of MMP participants reported injecting drugs in the preceding 12 months;
MMP does not collect data about needle sharing.
In addition, high rates of STD among PLWH indicate high rates of unprotected sex. As
noted previously, HIV positive MSM accounted for 41% of the syphilis cases reported in
Oregon from 2008-2013. Rates of syphilis among PLWH are 272 times higher than among
the general population, and gonorrhea rates are 45 times higher.
During a one-week rapid ethnographic assessment in 2014, trained interviewers
conducted semi-structured qualitative interviews with community members, health care
providers, and persons representing agencies and businesses serving MSM to discuss
community awareness of syphilis, perceived reasons underlying syphilis increases, and
recommendations for improving prevention efforts. Syphilis increases were attributed to
lack of awareness and knowledge of syphilis symptoms, sequelae, and transmission routes
among both patients and providers.
In addition, the data indicate that many MSM consider syphilis “treatable,” and not a
major concern, condom use has declined, and serosorting by HIV status is
common. Connecting with anonymous sex partners via social media sites and
methamphetamine use were also considered contributing factors. A case-control study
14conducted in Multnomah County in 2014 confirmed that early syphilis was associated
with meeting partners on-line, an association explained by significantly higher numbers of
sex partners among cases (median: 5, range 1-70) than controls (median 2: range 1-50).
MSM:
Data collected among MSM in 2004 and 2005 through rapid HIV behavioral assessments
at Gay Pride indicated that about 1 in 10 MSM in the Portland metropolitan area engaged
in sexual activity that might facilitate transmission of HIV (e.g., unprotected anal
intercourse with someone of discordant or unknown HIV status). A follow-up qualitative
study conducted in 2006-2007 with Portland-area MSM who self-reported unprotected
anal intercourse with someone of discordant or unknown HIV status, identified the
following themes related to these behaviors:
Serosorting (unprotected sex with partners of the same HIV status) was common
among people based on assumptions of HIV status rather than fact (e.g.,
seroguessing: “if he was HIV positive, he would have told me” or “If he was
worried about HIV, he would have said so, so he must be positive”).
Seropositioning (an HIV-positive partner takes the receptive role in anal sex with a
partner of HIV-negative or unknown status), and engaging in unprotected sex with
HIV-negative partners when one’s viral load is undetectable were also common,
albeit imperfect, risk reduction behaviors reported by MSM.
Methamphetamine use, anonymous sex in public sex environments, hook-ups via
social media sites, and higher numbers of partners (e.g., more than 10/year, and
often many more) were also identified as behaviors placing MSM at increased risk
for acquiring and transmitting HIV.
People who inject drugs:
During 2004-2013, 15% (400/2,595) of cases diagnosed with HIV in Oregon acknowledged
past injection drug use. This includes male and female PWID, as well as MSM/IDU. An
additional 1% of male cases and 11% of female cases reported heterosexual contact with
a sex partner who used injection drugs.
Oregon has collected information about HCV behavior risk (which often corresponds to
HIV behavior risk, as well) among persons tested for HCV through the state’s High Risk
Adult HCV Screening Project. Between 2007 and 2013, the screening project performed
154,027 HCV tests among persons who reported risk factors for HCV. Twenty local health
departments and four syringe exchange programs participated in the screening.
Overall, 16% of the persons screened and 21% of persons who reported IDU were positive
for HCV. The prevalence of HCV increased with age, ranging from 6% in persons less than
20 years of age to 39% in persons aged 50–54. The prevalence of HCV did not vary by sex
or by race in this population. Since the screening program targets persons at highest risk
for HCV, the majority tested (72%) reported IDU at some point in their lives. Those with
injection drug use risk reported methamphetamine and heroin as the primary drug
injected (74% and 21% respectively). HCV prevalence between users of these two drugs
did not vary. Of the 2,467 who reported IDU and responded to a question about their
most recent drug use, 85% said they had injected within the past three years. This sub-
group of recent injectors was young: 52% were under age 30. Half reported sharing
needles with someone who had HCV, 54% lived with someone with HCV, and 46%
reported having sex with someone with HCV. The prevalence of HCV antibodies in this
group of recent injectors under the age of 30 was only 11%. This suggests that
intervention in this age group could be effective in preventing further transmission of
HCV.
Emerging Populations: High-Risk Heterosexuals
In 2015, Oregon became a new National HIV Behavioral Surveillance (NHBS) site. Chime
In, as Oregon calls the NHBS survey project, is surveying high-risk heterosexuals in its first
year of data collection. Four percent of new HIV diagnoses among men in Oregon are
attributed to heterosexual contact, and another 10% had no identifiable risk; 77% of
women diagnosed with HIV are attributed to heterosexual contact.
A 2010 cross-sectional study of 208 young (18–25 years of age) homeless adults in
Portland yielded a sample of both heterosexual (64%) and sexual minority participants
(36%). The researchers found a high rate of sex without barrier protection in the past 30
days (52% among heterosexual participants), as well as myths about effective HIV
prevention methods (e.g., oral contraceptive pills can prevent HIV). Six participants tested
positive for HIV, none of whom identified as heterosexual.iv As this study found, we expect
many sub-populations of heterosexuals in the Portland Metropolitan Statistical Area
iv
Logan JL, et al. Correlates of HIV risk behaviors among homeless and unstably housed young adults. Public Health Rep. 2013 May-Jun;
128(3): 153-160. Available at http://www.ncbi.nlm.nih.gov/pmc/articles/PMC3610067/
16(MSA) might have high frequency of HIV-related risk behaviors, but low rates of HIV
infection. National NHBS findings suggest heterosexual subpopulations more likely to test
positive for HIV include those who are black, are unemployed or disabled, have less
income, have never previously tested for HIV, have engaged in exchange sex, or have used
crack cocaine in the past 12 months.v
HIV Care Continuum
The HIV Care Continuum is a model that is used by federal, state, and local agencies to
identify issues and opportunities related to improving the delivery of services to PLWH
across the entire HIV Continuum of Care. The HIV Care Continuum has five main “steps”
or stages including: HIV diagnosis, linkage to care, retention in care, antiretroviral use, and
viral suppression.
The HIV Care Continuum provides a framework that depicts the series of stages a person
with HIV engages in from initial diagnosis through their successful treatment with HIV
medication. It shows the proportion of individuals living with HIV who are engaged at
each stage. The HIV Care Continuum allows grantees and planning groups to measure
progress and to direct HIV resources most effectively.
Oregon’s Care Continuum is based on the following definitions:
Infected: persons diagnosed with HIV and those unaware of being diagnosed with
HIV
Diagnosed: persons diagnosed and confirmed by the Oregon HIV Surveillance
Program as cases
Linked to care: persons with a lab result used to monitor HIV collected within 90
days of first diagnosis
In care: persons with an HIV-related lab result collected in 2014
On treatment: persons prescribed ART
Suppressed: persons whose last reported HIV viral load in 2014 was < 200
copies/mL
v
CDC MMWR. HIV Infection among Heterosexuals at Increased Risk – United States, 2010. Available at
http://www.cdc.gov/mmwr/preview/mmwrhtml/mm6210a2.htm
17The Oregon HIV Care Continuum gives us a picture of the HIV epidemic in Oregon at the
end of 2014 (Figure 4):
An estimated 6,605 residents of Oregon had diagnosed HIV infection.
Approximately 987 Oregonians were infected with HIV, but remained undiagnosed
(and presumably do not know their status)
85% (1,023/1,202) of new diagnoses in Oregon (2010-2014) were linked to care
within 90 days, and 94% were linked within 1 year (1 year data not shown in Figure
4).
Approximately 837 residents diagnosed with HIV were not in medical care in 2014.
97% (5,595/5,768) of those in HIV medical care were on ART. (Oregon Medical
Monitoring Project, 2009-2013 chart abstraction data)
Viral load suppression was achieved among more than 68% (4,502/6,605) of those
living with diagnosed HIV, and may be as high as 79% if we take into account
people who left Oregon and whose viral loads did not get reported to the Oregon
HIV Program.
Figure 4. Oregon HIV Care Continuum*
8,000
7,000
6,000 7,592
6,605
5,000 5,768 5,595
4,000
4,502
3,000
2,000
1,000
0
Infected Diagnosed In care On treatment Suppressed
*The difference between “Infected” and “Diagnosed” is an estimate from the CDC (13% of infected are not
diagnosed). The “On treatment” estimate is based on Oregon HIV Medical Monitoring Project data, which
observed 97% of people “in care” were prescribed ART. All other numbers are from Oregon’s HIV
surveillance system, Orpheus.
18A Note on Viral Suppression:
In 2013, the CDC estimated that 30% of all people infected with HIV in the U.S. were
virally suppressed.vi This estimate included people with undiagnosed HIV and did not
control for migration. If suppression were calculated the same way for Oregon, the
estimate of suppression would be 59% (4,502/7,592). The difference between the
national and Oregon estimates may be due to Oregon’s more complete viral load
reporting, more up-to-date residence information, or better access to care.
Some groups in Oregon were less likely to be virally suppressed than others. American
Indian/Alaska Natives and Black/African Americans were less likely to be virally
suppressed than Whites (25% and 20% non-suppressed, respectively vs. 9%). Men who
have sex with men and have injected drugs (MSM/IDU) were less likely to be suppressed
than MSM (17% non-suppressed vs. 9%). Other groups took longer after diagnosis to
become suppressed: 20-24 year olds, males reporting heterosexual risk (partner’s risk
unknown) and females with heterosexual risk (partner’s risk unknown).
vi
Linkage to and Retention in HIV Medical Care, Centers for Disease Control and Prevention,
www.cdc.gov/hiv/prevention/programs/pwp/linkage.html_www.cdc.gov/hiv/pdf/dhap_continuum.pdf
19Financial and Human Resources Inventory
Financial Resources
This section describes the CDC-funded high impact prevention services and the HRSA-
funded core medical and support services. We also describe other funding sources that
are allocated in FY 16 (State Fiscal Year, July 2015-June 2016) to PLWH and people at risk
for HIV in Oregon.
Table 3a. Financial Resources Available to Support HIV Prevention & Care in Oregon, 2016
Funding Source Amount (% of Funded Agencies & Services Point of Care
total available Continuum
FY 16 funds) Impacted
CDC HIV Prevention $1,501,702 OHA and Clackamas, Deschutes, Jackson, Infected, Diagnosed
Lane, Marion, Multnomah & Washington
Counties (HIV testing & prevention with
positives)
CDC HIV Prevention $350,000 Cascade AIDS Project (CAP) (high –impact Infected, Diagnosed
prevention)
CDC HIV $355,744 OHA (for HIV, STD, HCV surveillance All points of Care
Surveillance activities) Continuum
CDC HIV Medical $662,792 OHA (special surveillance project) In care, On
Monitoring Project treatment,
Suppressed
CDC National HIV $756,346 OHA and Portland State University (special Diagnosed, In care,
Behavioral surveillance project) On treatment,
Surveillance
Suppressed
CDC STD Prevention $891,454 OHA (STD medications, labs, data, Infected, Diagnosed,
condoms, TA, training, consultation) In care
Ryan White Part A $2,949,625 Multnomah County Health Department Diagnosed, In care,
(MCHD), CAP, Clark Co (WA) Health On treatment,
Department, Ecumenical Ministries of
Oregon, OHSU Partnership Project, Quest Suppressed
Integrative Health Center, OHSU Russell St
Dental Clinic, Washington Co. Health Dept.
(Core medical and supportive services)
20Funding Source Amount (% of Funded Agencies & Services Point of Care
total available Continuum
FY 16 funds) Impacted
Ryan White Part A $446,296 MCHD HIV Health Services Center (HHSC) Diagnosed, In care,
(Medical Case Management) On treatment,
Suppressed
Ryan White Part A $599,873 MCHD HIV Health Services Center (HHSC) Diagnosed, In care,
(Ambulatory medical services for adults) On treatment,
Suppressed
Ryan White Part B $6,491,091 OHA (insurance, co-pay, deductible In care, On
payments); HIV Alliance and 6 LPHAs (full treatment,
range of case management and supportive
services); HIV Alliance (pharmacist Suppressed
treatment adherence and engagement
advocate services through competitive
supplemental funds)
Ryan White Part C $846,805 MCHD HHSC (Ambulatory medical services Diagnosed, In care,
for adults) On treatment,
Suppressed
Ryan White Part D $342,449 MCHD HHSC (Medical, Medical Case Diagnosed, In care,
Management, and Mental Health Services On treatment,
for Women and young adults (Funding Source Amount (% of Funded Agencies & Services Point of Care
total available Continuum
FY 16 funds) Impacted
Program Income, $270,000 OHSU Partnership Project (medical case Diagnosed, In care,
Partnership Project management and supportive services On treatment,
Billing/Health Care Suppressed
Contributions
HOPWA- Formula $378,910 OHA Oregon Housing Opportunities in In care, On
Partnership (OHOP) (rental assistance, treatment,
Support Services, Housing Information) Suppressed
HOPWA OSSCR $454,601 OHA OHOP and CAP (rental assistance, In care, On
support services) treatment,
Suppressed
HOPWA OHBHI $405,355 OHA OHOP, CAP (rental assistance, support In care, On
services); Cascadia Behavioral Healthcare treatment,
(Support Services) Suppressed
HOPWA funds via $1,016,339 CAP and Central City Concern (rental In care, On
City of Portland assistance, support services) treatment,
Suppressed
Low Income Energy $70,000 OHA OHOP (Utilities) In care, On
Assistance Program treatment,
(LIHEAP) Suppressed
Rural Oregon $68,014 OHA OHOP (rental assistance) In care, On
Continuum of Care treatment,
Suppressed
City of Salem $79,800 OHA OHOP (rental assistance) In care, On
treatment,
Suppressed
Ryan White Part B $13,002,700 OHA (insurance, co-pay, deductible In care, On
Program Income payments, pharmacy payments, dental, treatment,
adherence services, smoking cessation, Suppressed
health insurance enrollment); CAP
(transitional housing) ); 2 LPHA (case
management and support services)
340B Rebates $4,380,000 OHA and Ramsell (pharmacy benefits In care, On
(ADAP) manager, pharmacy services & payments) treatment,
Suppressed
Supplemental $119,800 OHA (housing and employment services) In care, On
Rebates (NASTAD) treatment,
Suppressed
22Human Resources and Workforce Capacity
Oregon ensures that PLWH and people at risk of HIV receive services through a
combination of public and private sources.
Most PLWH outside of the metropolitan area receive medical care through private
providers and/or Coordinated Care Organizations. PLWH in the Portland area have a range
of options for HIV care, including Oregon’s only Parts C and D clinic, Multnomah County
Health Department’s HIV Health Services Center (HHSC). HHSC is a FQHC, a member of
two CCOs in the metropolitan area, and also provides care to privately insured and
uninsured clients. HHSC employs 36.7 FTE, including medical providers (3.8 FTE), medical
case managers (4.8 FTE), nurses (4 FTE), patient navigators (4 FTE), mental health
providers (1.2 FTE), and a range of other medical and administrative professionals. HHSC
has been a Ryan White provider since 1990 and an AETC clinical training site for a five-
state region since 1999. HHSC serves an estimated 1 in 4 PLWH living in the Portland
metropolitan area.
Medical case management services are provided by multiple agencies in the Portland
Metro Area, depending on where the client lives and/or receives medical care. These
include Kaiser Permanente’s Immune Deficiency Clinic, HHSC, and through the HIV
Partnership Project (at OHSU, Legacy Emanuel, Good Samaritan, Providence St. Vincent,
Providence Portland and Veteran's Affairs).
Outside of the Portland metropolitan area, case management is provided to PLWH
residing in 31 Oregon counties by seven local public health departments and two
contracted agencies, HIV Alliance and/or Eastern Oregon Center for Independent Living,
depending where an individual lives.
Interaction of Funding Sources
CDC, HRSA, and HUD-funded entities in Oregon work with each other and with community
partners to ensure that PLWH and those at risk of HIV receive high-quality, accessible HIV
prevention and care services. The Oregon Health Authority (Part B grantee) and
Multnomah County Health Department (Part A grantee) directly administer HIV care and
treatment services, as well as pass funds through to contracted community-based
agencies. CDC prevention funds are distributed by OHA’s HIV Prevention Program to
seven Oregon counties. Cascade AIDS project also is a direct CDC Prevention grantee.
HOPWA funds are administered by OHA and Multnomah County’s A Home for Everyone
Program, and are distributed to contracted agencies throughout the state.
23The Oregon HIV Program is modernizing the way it delivers HIV services in Oregon, aiming
to work across funding streams, to the extent allowable by funders, in order to enhance
its coordinated approach to prevention and care services. The Oregon Program is
developing a matrix management model that builds cross-departmental work teams, in
order to implement the integrated approaches to HIV care and prevention that were
identified in this five-year plan.
Resource Gaps and Oregon’s Plan to Fill Them
A 2016 assessment of Oregon’s governmental public health system found meaningful
gaps across all local public health agencies. These gaps were not uniform, but none of the
34 local public health authorities (LPHA) had fully implemented the foundational
programs or capabilities yet.
For a few examples specific to this plan:
1 in 5 LPHAs report limited capacity to assure the availability of partner
notification services for newly diagnosed cases of syphilis, gonorrhea, and HIV,
This represents a potential service gap for about 15% of Oregon’s population.
1 in 4 LPHAs report limited capacity to assure access to treatment for STD, either
as a component of primary care or as specialty care. This represents a potential
service gap for about 37% of the population.
1 in 3 LPHAs report limited capacity to provide appropriate screening and
treatment for HIV, STD, and TB cases, including pre- and post-exposure prophylaxis
for HIV. This represents a potential service gap for about 33% of Oregon’s
population.
Only seven Oregon counties currently receive HIV prevention funding. Although HIV case
management is available in all counties—delivered via LPHA or community-based
organization, depending on one’s county of residence—some PLWH live several hours
from their medical providers and case managers and must communicate primarily by
phone.
There are about 70 “HIV medical providers” around the state (based on MMP data): the
Portland metro areas and central Oregon are well-represented, but some other parts of
the state (notably, the Coast and Eastern Oregon) have a shortage of HIV specialists. The
AETC is working to fill these gaps through training, provision of clinical preceptorships,
and telemedicine projects.
24In general, Oregon’s approach to modernizing public health services, including HIV
prevention and care, is to promote the most effective, evidence-based service delivery
model and to support and promote resource-sharing relationships, where appropriate.
Assessing Oregon’s Needs, Gaps, and Barriers Related to HIV
Care and Prevention Services
Needs Assessment Process
Oregon’s HIV Prevention and Care Programs identify HIV care and prevention service
priorities through multiple means, including needs assessments and gap analyses. These
are conducted both formally and informally, using existing data and by conducting special
studies. Specifically, we use ongoing surveillance data, epidemiologic investigations,
surveys, special studies, program assessments, community meetings and input, contract
monitoring, and feedback from service providers and consumers.
The Integrated Planning Group (IPG) plays a central role in identifying HIV prevention and
care service needs of PLWH and people at higher risk for HIV. As of June 2016, the IPG
includes 36 individuals representing people living with HIV and at risk, HIV prevention, all
parts of the Ryan White Care continuum, Coordinated Care Organizationsvii, corrections,
alcohol and drug prevention and treatment, higher education, and hospice. PLWH
comprise about 40% of the current IPG membership. About half of the IPG membership
are from the Portland metropolitan area and half come from a broad representation of
our large and diverse state, including the Willamette Valley, and Eastern, Central,
Southern, and Coastal Oregon.
The IPG continues to seek representation from a broader base of constituents. Identified
gaps include demographic groups (especially transgender and Latino stakeholders),
geographic areas (particularly Region 2, which are lower-incidence counties with 50-70
PLWH), and service provider groups (specifically, Veterans, education, and faith-based).
The Membership Committee continues to work on recruitment, and the Oregon HST
Program has begun discussions with community stakeholders to address these gaps and
to conduct assessments in communities of color that face HIV-related disparities.
vii
A Coordinated Care Organization (CCO) is a network of all types of health care providers (including
physical, behavioral, and dental health) who have agreed to work together in their local communities to
serve people receiving health care coverage from the Oregon Health Plan (Medicaid). As of this writing,
there are 16 CCOs operating in communities around Oregon.
25A full table of data sources used for needs assessment activities can be found on page 36
in the data sources section.
Prevention and Care Service Needs, Gaps, and Barriers for PLWH and
Persons at High Risk for HIV Infection
The Oregon HIV program, under guidance from the IPG and based on the needs
assessment data listed above, identified the following high-level service needs and gaps
facing PLWH and persons at risk in Oregon, presented in alphabetical order:
Accessible, Culturally-Competent Medical Care:
Most data related to medical care for PLWH in Oregon come from the HIV Medical
Monitoring Project (MMP).viii MMP data from 2011-2014 indicate that nearly all PLWH in
care (99%) have health insurance, but 1 in 10 reported some kind of insurance gap in the
past 12 months. All participants reported having a “usual place for HIV medical care in the
past 12 months,” and yet, 12% also reported using an emergency room, urgent care, or
hospital for HIV care in the past 12 months, which may indicate gaps in service or some
difficulty accessing usual sources of care.
Most participants (63%) report one-way travel times to HIV medical care of 30 minutes or
less; about 5% report one-way travel times of 90 minutes or more.
Data from the 2013 CAREAssist survey indicate that PLWH have many comorbid
conditions that need ongoing medical management, and may require coordination
between HIV specialists, primary care providers, and other medical specialists: 81% of
CAREAssist clients have one or more chronic medical conditions in addition to HIV; 38%
have three or more co-morbid conditions.
Inclusion of HIV medications on formularies for Medicaid-funded CCOs has proved
challenging in some areas of Oregon. The HIV Pharmacist at HIV Alliance has worked
directly with the Formulary Managers and the Clinical Pharmacists within Coordinated
Care Organizations to improve prior authorization processes and medication access. As an
example, one CCO in Southern Oregon sought consultation from the HIV Pharmacist
regarding changes to their 2015 formulary, discussing health and cost benefit of including
viii
The MMP data cited were based on a clinic-based sampling. In 2016, the sampling methodology will
change to a random sample of all PLWH in the HIV surveillance data base, allowing for a more
representative sample of clients in and out of HIV care.
26certain drug therapies. As a result of this interaction, the CCO modified its formulary to be
more inclusive of the therapies clients were reporting difficulty accessing.
Although Medicaid expansion reduced the rates of uninsured people in Oregon,
disparities still exist: 21% of Latinos, 21% of AI/AN, and 18% of Hawaiian/Pacific Islanders
are still uninsured. Undocumented people in Oregon, most of whom are Latino, still face
perceived and actual barriers to accessing medical care. Although CAREAssist, Oregon’s
AIDS Drug Assistance Program, does not request information on citizenship, many
undocumented individuals may be unaware of their eligibility for CAREAssist. CAREAssist
has used social networking strategies among Latinos to share program information to
those who may need it, but further need exists to promote program services.
In addition, the care that is available may create barriers to access for some clients. A
recent study from Oregon State University indicated that about 1 in 4 young Latinos in
rural Oregon are dissatisfied with medical care; mistrust and perceived discrimination
were identified as reasons.ix Clients of Cascade AIDS Project’s MAI-funded Latino patient
navigation program report to program staff similar concerns about lack of access to
culturally- competent services. PLWH and service providers on Oregon’s planning group
report that culturally competent care for lesbian, gay, bisexual, and transgender (LGBT)
individuals may also be lacking, particularly in more rural parts of the state. This includes
appropriate screening for STDs, including “extra-genital” (anal and oral) screening.
Adherence Support to Achieve and Maintain Viral Load Suppression:
Adherence to HIV medications is critical for obtaining viral load suppression. Most MMP
participants report taking antiretroviral therapies (ARTs) (96%) and 86% say they always
follow their regular schedule. Still, 12% report taking a drug holiday in the past year and
about 4 in 10 (43%) report missing doses in the past 3 months. The leading reasons given
for missing doses were having a change in routine or simply forgetting.
From lab-based surveillance data, we know that some PLWH in Oregon are less likely to
achieve viral load suppression than others: American Indian/Alaska Natives, Black/African
Americans, and MSM/IDU. Other groups took longer after diagnosis to become
ix
Lopez-Cevallos DF, Harvey SM, & Warren JT. (2014). Medical mistrust, perceived discrimination, and
satisfaction with health care among young-adult rural Latinos. The Journal of Rural Health: Official Journal of
the American Rural Health Association and the National Rural Health Care Association. 30(4), 344-51.
27suppressed: 20-24 year olds, males reporting heterosexual risk (partner’s risk unknown)
and females with heterosexual risk (partner’s risk unknown). These individuals may need
additional support after diagnosis to maintain medical care and stay adherent.
Mental health issues and substance abuse may also adversely affect adherence. For
example, among the 15% of Part B clients who have yet to achieve viral load suppression,
mental illness and addictions are common. Of Part B clients with a high acuity in mental
health or addictions, 27% and 20%, respectively, had an unsuppressed viral load.
Oregon Reminders is a mobile health service that offers text, email and voice messages to
support the health of people at risk for or living with HIV, including medication adherence
reminders for PLWH. Oregon Reminders had 1,812 active users through July 2015.
Periodic surveys are conducted with active users of the system to assess the efficacy of
Oregon Reminders and user satisfaction. As of August 2015, of the respondents receiving
HIV medication or prescription refill reminders, nearly three-fourths reported that Oregon
Reminders helps them remember to take their medication (72%) and that they miss doses
of their medication less frequently since signing up (70%).
Alcohol & Drug Treatment Services:
MMP participants reported substantial rates of alcohol and drug use: 28% reported past-
year non-injection drug use and 6% past-year injection drug use. Among current users of
alcohol (61%), 30% reported binge drinking at least once in the past month. In addition,
39% reported current tobacco use, a rate more than twice that of Oregon adults overall.
The 2013 National Survey on Drug Use and Health reported that among all states in the
country, Oregon had the highest rates of nonmedical use of prescription pain relievers
(6% compared to 3% nationally), and the rate of illicit drug use (other than marijuana) in
the past 30 days (among Oregon adults aged 26 and older) increased by 20% between
2002 and 2009, compared to a decrease of 3% nationally.
A very high proportion of PLWH report chronic pain: 58% of MMP participants and 41% of
CAREAssist clients responding to the 2013 survey. About 1 in 3 MMP respondents (36%)
reported taking prescription medication for chronic pain, and chronic pain was associated
with ‘poor overall health’ among CAREAssist clients. This may put them at risk of chronic
opioid use and/or misuse.
28There are 141 substance abuse treatment centers within 30 miles of Portland, which is
notably higher than most, but not all cities with a similar population size (Las Vegas: 47;
Nashville: 72; Oklahoma City: 74; Baltimore: 349).x Per the Affordable Care Act, all health
insurance sold on Health Insurance Exchanges or provided by Medicaid to certain newly
eligible adults must include services for substance use disorders.xi However, like most of
the country, Oregon is experiencing a shortage of behavioral health specialists that can
treat substance abuse disorders. Nationally, the average is 32 behavioral health specialists
for every 1,000 people afflicted with substance abuse disorder. Oregon falls slightly below
the national average, with 28 provider/1,000 potential clients.xii
PLWH consistently identify a gap in substance abuse treatment services. About 3% of
MMP clients between 2011 and 2013 (2014 data not available on this item) used inpatient
alcohol and drug treatment in the past 12 months. Rates of unmet need for drug and
alcohol counseling or treatment among MMP participants ranged from 15% - 47% across
the four years (2011-2014), although the numbers of individuals reporting needing the
service were low (about 30 per year). Barriers likely include lack of available treatment
facilities, lack of readiness, stigma, transportation challenges, and lack of culturally
competent treatment services.
Dental Care:
Sixty-two percent of MMP participants reported a dental visit in the past 12 months, and
28% reported needing, but not receiving dental care. The most common reason for not
receiving care, reported by more than half of those with a service gap, was cost or lack of
insurance that covered dental care.
Health Disparities:
HIV-related health disparities exist all along the HIV care continuum. Disparities related to
testing, viral suppression, and death rates might reflect differences in access to and use of
health care and treatment. In Oregon, we see differences in HIV-related health outcome
by race, ethnicity, sexual orientation, and risk factor (injection drug use), which have been
described in more detail elsewhere. Stigma, discrimination, poverty, and other structural
factors contribute to these disparities.
x
SAMHSA. Behavioral Health Treatment Services Locator. Available at https://findtreatment.samhsa.gov/
xi
Office of National Drug Control Policy. Substance Abuse and the Affordable Care Act. Available at
https://www.whitehouse.gov/ondcp/healthcare
xiihttp://www.pewtrusts.org/en/research-and-analysis/blogs/stateline/2015/4/01/how-severe-is-the-shortage-of-
substance-abuse-specialists
29You can also read