2018 A Window on the Quality of New Zealand's Health Care

Page created by Willie Salazar
 
CONTINUE READING
2018 A Window on the Quality of New Zealand's Health Care
A Window on the
Quality of New Zealand’s
      Health Care

        2018
2018 A Window on the Quality of New Zealand's Health Care
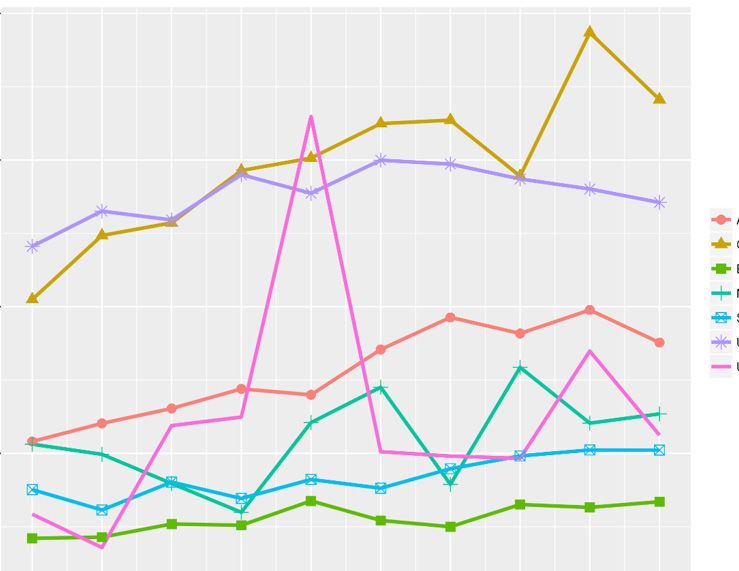
© Health Quality & Safety Commission 2018
Prepared for publication in May 2018 by the Health Quality & Safety
   Commission, PO Box 25496, Wellington 6146, New Zealand.
                ISBN 978-0-908345-68-7 (print)
                ISBN 978-0-908345-69-4 (online)
      This document is available online at www.hqsc.govt.nz
Contents

Executive summary                                                                                      5

Introduction                                                                                           7

1   Where are we now?                                                                                  8

        A high-level view – outcomes and value for money                                               8

        Equity                                                                                        14

        Safety                                                                                        18

        Patient experience                                                                           23

        Effectiveness                                                                                28

2   Future safety of the system                                                                      37

        How do we look to the future?                                                                37

        What are the possible ‘early warning signals’ that raise concern?                            38

        Where to next?                                                                               46

3 Where to from here?                                                                                47

        Building on existing approaches to encourage focused monitoring of quality                   47

        Developing a mechanism for identifying and addressing potential problems early               50

                                                             A Window on the Quality of New Zealand’s Health Care 2018   1
Figures
       Figure 1: Mortality from conditions amenable to health care per 100,000 population aged 0–74,
       New Zealand, 2000–15                                                                                             8

       Figure 2: Age-standardised disabilty-adjusted life years (DALYs) lost per 1,000 population, high income
       countries, 2016                                                                                                  9

       Figure 3: Change in age-standardised disability-adjusted life years (DALYs) per 1,000 population,
       high-income countries, 2000–16                                                                                   9

       Figure 4: Life expectancy at 65, by OECD country, 2015                                                          10

       Figure 5: Change in life expectancy at 65, by OECD country, 1970–2015                                           10

       Figure 6: Expenditure on health care per head, US$ purchasing power parity (PPP), by OECD country, 2016         11

       Figure 7: Annual average growth rate in per-capita health expenditure, real terms, by OECD country,
       2003–16 (or nearest year)                                                                                       11

       Figure 8: Expenditure on health care per head, US$ purchasing power parity (PPP), 2016, versus age-
       standardised disability-adjusted life years (DALYS) lost per 1,000 population, 2016, high-income countries      12

       Figure 9: Mortality from conditions amenable to health care per 100,000 population aged 0–74
       by ethnic group, New Zealand, 2009–15                                                                           13

       Figure 10: Mortality from conditions amenable to health care per 100,000 population aged 0–74, by DHB,
       New Zealand, 2010–14, compared with NZDep 2013, by DHB                                                          13

       Figure 11: Adjusted rate ratio of respondents identifying cost barriers to accessing primary care
       (second mentioned group = 1.0), New Zealand, 2011–15 and 2016/17                                                14

       Figure 12: Percentage of respondents reporting cost barriers to access in the primary care patient experience
       survey, by ethnic group, New Zealand, November 2017                                                             15

       Figure 13: Percentage of respondents reporting cost barriers to access in the primary care patient experience
       survey, by age group, New Zealand, November 2017                                                                15

       Figure 14: Disparity in access to care between above and below average income respondents, 2016                 16

       Figure 15: In-hospital falls leading to a fractured neck of femur in people aged 15 and over, by month,
       New Zealand, 2012−17                                                                                            18

       Figure 16: Hip and knee operations where good practice in antibiotic prophylaxis and skin preparation was
       followed, by quarter, New Zealand, 2013–17                                                                      18

       Figure 17: SSIs for hip and knee operations, by month, New Zealand, 2013–17                                     18

       Figure 18: Postoperative DVT/PE, actual and predicted based on underlying patient risk, by quarter,
       New Zealand, 2008–17                                                                                            19

       Figure 19: Postoperative DVT/PE, by OECD country, 2015                                                          19

       Figure 20: Postoperative sepsis, by OECD country, 2015                                                          20

       Figure 21: Postoperative sepsis, actual and predicted based on underlying patient risk, by quarter,
       New Zealand, 2009–17                                                                                            20

       Figure 22: Staphylococcus aureus bacteraemia rate per 1,000 bed-days, by month, New Zealand, 2012–17            21

       Figure 23: Hospital hand hygiene compliance rate (%), New Zealand, 2012–17                                      21

       Figure 24: Total opioid consumption (morphine equivalence mg/capita), 2006–15                                   22

       Figure 25: People dispensed a strong opioid per 1,000 population, highest and lowest DHBs, New Zealand,
       2011–16                                                                                                         22

       Figure 26: Number of DHBs where more than 20 people per 1,000 were dispensed a strong opioid,
       New Zealand, 2011–16                                                                                            23

2   A Window on the Quality of New Zealand’s Health Care 2018
Figure 27: Dispensing of strong opioids by site of residence, New Zealand, 2012–16                             23

Figure 28: Variation in proportion of respondents giving the most positive response over time, inpatient
experience survey, New Zealand, August 2014 to November 2017                                                   24

Figure 29: Variation in proportion of respondents giving the most positive response between DHBs,
inpatient experience survey, New Zealand, average August 2014 to November 2017                                 25

Figure 30: Average score out of 10 for questions about care in the GP practice, primary care patient
experience survey, New Zealand, November 2016 to August 2017 compared with November 2017                       27

Figure 31: Average score out of 10 for questions about medication, primary care patient experience survey,
New Zealand, November 2016 to August 2017 compared with November 2017                                          28

Figure 32: GP responses to queries about coordination of patient care across 11 countries, 2015
(percentage answering question with most positive answer)                                                      29

Figure 33: Average score out of 10 for questions about interactions with other parts of the health system,
primary care patient experience survey, New Zealand, November 2016 to August 2017 compared
with November 2017                                                                                             30

Figure 34: Acute hospital bed-days per 1,000 population, New Zealand and highest and lowest DHBs,
2015–17                                                                                                        31

Figure 35: Acute hospital bed-days per 1,000 population aged 75 and over, New Zealand, 2015–17                 31

Figure 36: Occupied bed-days associated with those aged 75 and over admitted twice or more as
an emergency per 1,000 population, New Zealand and highest and lowest DHBs, 2008/09–2015/16                    32

Figure 37: Hospital admissions for asthma and COPD per 100,000 population admission, 2015                      32

Figure 38: Hospital admissions for congestive heart failure, per 100,000 population, OECD average
and selected countries, 2015                                                                                   33

Figure 39: Hospital admissions for diabetes per 100,000 population, and per 100,000 population
with diabetes, OECD average and selected countries, 2015                                                       33

Figure 40: Percentage of people with hip fracture operated on, on the day of admission or the day following,
New Zealand, 2012–16                                                                                           34

Figure 41: Percentage of people with hip fracture operated on within 0–2 days of admission, by
OECD country, 2005–15                                                                                          35

Figure 42: Inter-DHB ranges in the percentage of people with a diagnosis of bowel cancer by diagnosis
location and extent and outcomes, New Zealand, 2009–13                                                         35

Figure 43: Colon and rectal cancer five-year net survival, OECD average and selected countries, 2010–14        36

Figure 44: Per-capita government expenditure on health US$PPP, 2010 constant prices                            38

Figure 45: Combined DHB deficits 2008/09–2016/17                                                               39

Figure 46: Average annualised sick leave hours per FTE for workforce occupational groups in New Zealand,
for the years to 31 December 2016 and 2017                                                                     42

Figure 47: Health and Disability Commissioner complaints by category, New Zealand, 2016/17                     45

Figure 48: Example of a redesigned target for improving patient experience of care                             49

                                                             A Window on the Quality of New Zealand’s Health Care 2018   3
Tables
        Table 1: Number of questions where respondents from Asian, Māori, Other and Pacific peoples ethnic
        groups gave significantly different responses about coordination of care than respondents from the
        European ethnic group, primary care patient experience survey, New Zealand, November 2017              16

        Table 2: Number of questions where different age groups gave significantly more or less positive
        responses about coordination of care than the overall rate, primary care patient experience survey,
        New Zealand, November 2017                                                                             17

        Table 3: Number of questions where respondents from the Asian, Māori, Other and Pacific peoples
        ethnic groups gave significantly different responses about experience of care than respondents from
        the European ethnic group, primary care patient experience survey, New Zealand, November 2017          17

        Table 4: Number of questions where different age groups gave more or less positive responses
        about experience of care than the overall rate, primary care patient experience survey, New Zealand,
        November 2017                                                                                          17

        Abbreviations
        ACC               Accident Compensation Corporation
        ANZCA             Australian and New Zealand College of Anaesthetists
        BDSH              bullying, discrimination and sexual harassment
        COPD              chronic obstructive pulmonary disease
        DALYs             disability-adjusted life years
        DHB               district health boards
        DVT/PE            deep vein thrombosis leading to pulmonary embolism
        FTEs              full-time equivalents
        GDP               gross domestic product
        GP                general practitioner
        NZDep2013         New Zealand index of deprivation
        OECD              Organisation for Economic Co-operation and Development
        PDSA              plan–do–study–act
        PPP               purchasing power parity
        RACS              Royal Australasian College of Surgeons
        SAB               Staphylococcus aureus bacteraemia
        SLMF              System Level Measures Framework
        SSIs              surgical site infections
        TAS               Technical Advisory Services

4   A Window on the Quality of New Zealand’s Health Care 2018
Executive summary
New Zealand’s health system achieves remarkable things every day. Ultimate outcomes supported by health
care – reduced death and disability – are continuing to improve at a rate comparable to similar countries,
even though New Zealand has been spending increasingly less than many other countries on health care.
This year’s edition of the Health Quality & Safety Commission’s A Window on the Quality of New Zealand’s
Health Care (Window) ‘shines the light’ beyond ultimate outcomes to look at where the system is performing
less well and where possible system weaknesses may put future performance at risk. ‘Shining the light’ aims
to start the thinking and discussion needed to lead to change.
Chapter 1 considers measures of equity, safety, patient experience and effectiveness.
Equity
• Disparity and inequality in the health status of patient groups in New Zealand can be compounded by
  poor health care or, alternatively, countered by high-quality care that effectively meets specific needs.
• This year’s Window highlights inequities across ethnic, age and socioeconomic groups in terms of
  treatments, patient experience, access to services, and outcomes. The findings suggest New Zealand’s
  health care system needs to perform better at each stage of the patient journey, to deliver more equitable
  health outcomes.
Safety
• With regard to safety, this Window shows New Zealand is performing well internationally in areas of
  specific harm. Continued improvements are evident in safe practice and patient outcomes, through quality
  improvement approaches, in most areas where the Commission focuses its efforts (ie, falls prevention,
  surgical site infections for hip and knee operations, deep vein thrombosis and pulmonary embolism).
• Many more issues of patient harm remain to be tackled, most notably, those related to delays and clinical
  management processes.
Patient experience
• Patient experience is an important component of high-quality care. Both the Commission’s inpatient
  experience and primary care patient experience surveys show generally positive, consistent results over
  time.
• However, inequities across groups can be seen, and more work is needed on providing patients with
  information on their medication, particularly in relation to side effects.
• The picture is mixed for interactions with other parts of the health care system, suggesting system
  integration and the patient journey need more focus. Variation exists across different providers,
  suggesting room for improvement.
Effectiveness
• A high-quality system will provide the most effective treatment at the right time and in the right place,
  organised around the patient and their condition.
• While New Zealand compares well internationally for measures of effectiveness, variation exists across
  the country, suggesting effective treatment and coordination are not universal. No single district health
  board provides the best or worst care across all conditions and patient groups.
Chapter 2 highlights the need for further development in our approach to anticipating emerging issues
within the health care system, so we can act more quickly to prevent potential harm.
The importance of social determinants of health mean that poverty, social inequity, poor housing and other
challenges beyond the immediate control of health systems affect the services we need to provide. Similarly,
the wellbeing of the health workforce is itself important for ensuring a high-performing system.

                                                              A Window on the Quality of New Zealand’s Health Care 2018   5
Chapter 2 considers ‘soft’ intelligence alongside hard data, and highlights the need to sift through various
    signals that may be ‘just noise’ to identify those that matter. Financial pressures, the health and wellbeing of
    the workforce, and changing patterns of adverse events and consumer complaints are covered.
    Financial
    • The increasing gap between expenditure on the New Zealand health care system and those of similar
      countries is highlighted. Continuing district health board deficits are also raised.
    • Too much focus on delivering specific results can inadvertently cause the deprioritisation of other
      important work or investment required to strengthen the system or improve the patient journey.
    Workforce
    • The health and wellbeing of the health workforce is discussed. Even though the health workforce is
      increasing over time, staff shortages and wellbeing concerns are being raised within the sector. Sickness
      absenteeism and, the opposite, presenteeism (working through illness) are considered.
    • Of particular concern is the evidence that bullying is widespread in the New Zealand health care system.
      This is not unique to health care, but bullying is destructive to culture and affects both the physical and
      psychological wellbeing of staff and their ability to provide high-quality and safe patient care.
    Safety
    • Increasing numbers of adverse events reports and consumer complaints about harm relating to complex
      cross-organisational boundary and system issues (ie, clinical management processes and delays) are
      discussed. These challenges will require different approaches to resolve them.
    The overall impression from these two chapters is of a system adept at responding to individual quality
    issues with effective, focused initiatives. Yet, as a system, it has made less progress in tackling long-
    standing ‘wicked’ or complex problems, such as continuing inequity in access, treatment and outcomes, and
    unwarranted variation in treatment. The system’s inability to address these issues matters. We cannot
    continue with our current approaches and ignore our lack of progress in these important areas.
    Some of the challenges outlined in chapter 2 were not so visible four years ago. We are now seeing issues
    that do not lend themselves to the sort of targeted methods and single-organisation approaches widely
    used in recent years. New approaches are needed, grounded in co-design with consumers and the health
    workforce.
    As well as continuing quality improvement and further strengthening safety culture, chapter 3 suggests two
    new approaches that may help address emerging challenges while also improving the overall quality of
    services and our system. These are:
    • building on existing approaches to encourage focused monitoring of service quality
    • developing a mechanism for spotting and addressing potential problems early.
    If we are truly to achieve equitable and excellent health outcomes for all New Zealanders, it is essential that
    a whole-of-system approach is adopted.

6   A Window on the Quality of New Zealand’s Health Care 2018
Introduction
Welcome to the fourth edition of the Health Quality & Safety Commission’s (the Commission’s) report
A Window on the Quality of New Zealand’s Health Care (Window).
This Window focuses mostly on the quality of health services delivered rather than population health,
broader measures of system capability, sustainability, workforce or productivity. Health outcomes depend
on all of these issues, including factors such as poverty, housing, employment and education, just as much
as they do on ensuring all New Zealanders have timely access to effective and safe health services. As our
approach to reporting on the quality and safety of health care evolves, the Window is necessarily expanding
to consider wider issues, opportunities and flags for deeper analysis and attention.
As in previous editions, chapter 1 uses a modification of the US Institute of Medicine’s (now the National
Academy of Medicine’s) dimensions of quality. The chapter concentrates on the value, equity, safety, patient
experience and effectiveness of delivered health services to provide structure.
Chapter 2 draws on the wider work of Charles Vincent and others who are encouraging a broader approach
to the measurement and monitoring of safety in health care. We focus on ‘anticipating’ early warnings for
system safety and sustainability in New Zealand.
Chapter 3 suggests two new approaches that may help address the ongoing and emerging challenges
highlighted in this Window, while improving relationships, the overall quality of services and our system.
These are:
• building on existing approaches to encourage focused monitoring of service quality
• developing a mechanism for spotting and addressing potential problems early.

(Unless otherwise stated, the source for figures and tables in this Window is the Health Quality &
Safety Commission.)

                                                              A Window on the Quality of New Zealand’s Health Care 2018   7
1 Where are we now?

    A high-level view – outcomes and value for money
    Measures of the ultimate outcomes of care, such as deaths from treatable conditions, life expectancy and
    loss of quality of life, continue to show improvement in New Zealand at rates in line with other similar
    countries.
    Deaths from conditions that can be improved by health care continue to reduce for all parts of the country
    (see Figure 1). However, a two-fold variation exists between the district health boards (DHBs) with the
    highest and lowest rates of these premature deaths.

    Figure 1: Mortality from conditions amenable to health care per 100,000 population aged 0–74, New Zealand,
    2000–15 (source: Ministry of Health)

                                                300
    Amenable mortality per 100,000 population

                                                250

                                                200

                                                150

                                                100

                                                 50

                                                  0
                                                      2000 2001 2002 2003 2004 2005 2006 2007 2008 2009 2010 2011 2012 2013 2014 2015

                                                                         New Zealand          Highest DHB         Lowest DHB

                                                Box 1: Measuring ultimate outcomes of care
                                                Amenable mortality measures the number of premature deaths from diseases that effective and
                                                timely health care might have prevented.
                                                Disability-adjusted life years (DALYs) measure the gap between a population’s current state of
                                                health and that of an ideal population where everyone experiences long lives free of illness or
                                                disability. DALYs provide a means of considering quality of life, as well as length. A DALY lost is a
                                                year of healthy life lost to New Zealanders. Therefore a reduction in DALYs lost represents an
                                                improvement in outcome.

    Ultimate outcomes of care in New Zealand are similar to those in other developed nations and are improving
    at a similar, if not faster, rate. Figure 2 shows that DALYs lost in New Zealand are very similar to most other
    developed countries. Figure 2 compares New Zealand with 30 high-income (Organisation for Economic
    Co-operation and Development (OECD)) countries. International comparisons after this graph, unless
    otherwise stated, use a smaller group of comparable countries (Australia, Canada, Ireland, Sweden, United
    Kingdom and United States of America).

8   A Window on the Quality of New Zealand’s Health Care 2018
Figure 2: Age-standardised disabilty-adjusted life years (DALYs) lost per 1,000 population, high-income
                                       countries, 2016 (source: University of Washington)

                                       300

                                       250
        DALYs per 1,000 populatoin

                                       200

                                       150

                                       100

                                        50

                                         0
                                             Singapore
                                                         Japan
                                                                 Spain
                                                                         Switzerland
                                                                                       Italy
                                                                                               Norway
                                                                                                             Iceland
                                                                                                                       Israel
                                                                                                                                France
                                                                                                                                          Australia
                                                                                                                                                      Luxembourg
                                                                                                                                                                   Sweden
                                                                                                                                                                            Austria
                                                                                                                                                                                             Netherlands
                                                                                                                                                                                                           South Korea
                                                                                                                                                                                                                         Canada
                                                                                                                                                                                                                                  Finland
                                                                                                                                                                                                                                            Greece
                                                                                                                                                                                                                                                     Portugal
                                                                                                                                                                                                                                                                Ireland
                                                                                                                                                                                                                                                                                New Zealand
                                                                                                                                                                                                                                                                                              Germany
                                                                                                                                                                                                                                                                                                        Belgium
                                                                                                                                                                                                                                                                                                                  Denmark
                                                                                                                                                                                                                                                                                                                            United Kingdom
                                                                                                                                                                                                                                                                                                                                             Czech Republic
                                                                                                                                                                                                                                                                                                                                                                Poland
                                                                                                                                                                                                                                                                                                                                                                                             United States
                                                                                                                                                                                                                                                                                                                                                                                                             Estonia
                                                                                                                                                                                                                                                                                                                                                                                                                       Slovakia
                                                                                                                DALY                              Lower bound                                                 Upper bound                                              High income

                                       Since 2000, the rate of per-capita DALYs lost has fallen slightly more in New Zealand than in the average of
                                       the high-income countries, in line with the trend observed in previous Windows (Figure 3).

                                       Figure 3: Change in age-standardised disability-adjusted life years (DALYs) per 1,000 population, high-income
                                       countries, 2000–16 (source: University of Washington)

                                        0
Change in DALYs per 1,000 population

                                        -5

                                       -10

                                       -15

                                       -20

                                       -25

                                       -30

                                       -35

                                       -40
                                                            Ireland

                                                                                               New Zealand

                                                                                                                                    Australia

                                                                                                                                                                            United Kingdom

                                                                                                                                                                                                                             Canada

                                                                                                                                                                                                                                                                United States

                                                                                                                                                                                                                                                                                                             Sweden

                                                                                                                                                                                                                                                                                                                                                              Ave 30 high-income countries

                                       New Zealanders aged 65 can expect to live 20 more years. Again, this puts New Zealand close to comparable
                                       high-income countries and very close to the average of the 35 countries in the OECD (Figure 4).

                                                                                                                                                                                                                             A Window on the Quality of New Zealand’s Health Care 2018                                                                                                                                            9
Figure 4: Life expectancy at 65, by OECD country, 2015 (source: OECD)

                                                   25

                                                   20
     Expected years of life at 65

                                                   15

                                                   10

                                                       5

                                                    0
                                                             Australia      New Zealand        Canada             Sweden   United Kingdom   Ireland    United States   OECD35

                                                   Life expectancy at 65 has improved by just over six years since 1970, slightly above the average
                                                   improvement of the OECD nations (Figure 5).

                                                   Figure 5: Change in life expectancy at 65, by OECD country, 1970–2015 (source: OECD)

                                                   8

                                                   7
     Additional years life expectancy since 1970

                                                   6

                                                   5

                                                   4

                                                   3

                                                   2

                                                   1

                                                   0
                                                           Australia     New Zealand      Ireland        United       OECD35      Canada      Sweden       United
                                                                                                        Kingdom                                            States

                                                   New Zealand has had lower expenditure on its health care system than most comparable countries for many
                                                   years, both as total expenditure per person and as a percentage of gross domestic product (GDP). Figure 6
                                                   presents the most recent data (expenditure per head in bars, percentage GDP as a line) for 30 high-income
                                                   countries. The comparator group is coloured green in this graph. New Zealand consistently has not only lower
                                                   per-head expenditure, but also a smaller share of national income spent on health care than similar countries.
                                                   This is potentially important. For example, matching the Australian share of national income spent on health
                                                   would add US$700 million to New Zealand’s health expenditure.

10                                                 A Window on the Quality of New Zealand’s Health Care 2018
Figure 6: Expenditure on health care per head, US$ purchasing power parity (PPP), by OECD country, 2016
                                                          (source: OECD)

                                                                                                                                                                                                                       US$PPP                                 % GDP
                                                          10,000                                                                                                                                                                                                                                                                                                                                                                                   20
                                                              9,000                                                                                                                                                                                                                                                                                                                                                                                18

                                                                                                                                                                                                                                                                                                                                                                                                                                                        Expenditure on health as % of GDP
                       Expenditure per capita on health

                                                          8,000                                                                                                                                                                                                                                                                                                                                                                                    16
                                                              7,000                                                                                                                                                                                                                                                                                                                                                                                14
                                                          6,000                                                                                                                                                                                                                                                                                                                                                                                    12
                                                              5,000                                                                                                                                                                                                                                                                                                                                                                                10
                                                          4,000                                                                                                                                                                                                                                                                                                                                                                                    8
                                                              3,000                                                                                                                                                                                                                                                                                                                                                                                6
                                                              2,000                                                                                                                                                                                                                                                                                                                                                                                4
                                                              1,000                                                                                                                                                                                                                                                                                                                                                                                2
                                                                    0                                                                                                                                                                                                                                                                                                                                                                              0
                                                                        Estonia
                                                                                  Hungary
                                                                                            Slovak Republic
                                                                                                              Greece
                                                                                                                       Czech Republic
                                                                                                                                        Korea
                                                                                                                                                Portugal
                                                                                                                                                           Israel
                                                                                                                                                                    Slovenia
                                                                                                                                                                               Spain
                                                                                                                                                                                       Italy
                                                                                                                                                                                               New Zealand
                                                                                                                                                                                                             Finland
                                                                                                                                                                                                                       United Kingdom
                                                                                                                                                                                                                                        Iceland
                                                                                                                                                                                                                                                  Japan
                                                                                                                                                                                                                                                          France
                                                                                                                                                                                                                                                                   Australia
                                                                                                                                                                                                                                                                               Canada
                                                                                                                                                                                                                                                                                        Belgium
                                                                                                                                                                                                                                                                                                  Denmark
                                                                                                                                                                                                                                                                                                            Austria
                                                                                                                                                                                                                                                                                                                      Netherlands
                                                                                                                                                                                                                                                                                                                                    Sweden
                                                                                                                                                                                                                                                                                                                                             Ireland
                                                                                                                                                                                                                                                                                                                                                       Germany
                                                                                                                                                                                                                                                                                                                                                                 Norway
                                                                                                                                                                                                                                                                                                                                                                          Luxembourg
                                                                                                                                                                                                                                                                                                                                                                                       Switzerland
                                                                                                                                                                                                                                                                                                                                                                                                     United States
                                                                                                                                                                                                                                                                                                                                                                                                                     Median of 30 OECD countries
                                                          Since 2009, the growth in New Zealand’s expenditure on health care has slowed notably, both in
                                                          comparison with 2003–09 and with similar countries (Figure 7).

                                                          Figure 7: Annual average growth rate in per-capita health expenditure, real terms, by OECD country, 2003–09
                                                          and 2009–16 (or nearest year) (source: OECD)
                                                          8.0

                                                          7.0
Average real growth rate in health

                                                          6.0
  care expenditure per capita

                                                          5.0

                                                          4.0

                                                          3.0

                                                          2.0

                                                          1.0

                                                              0
                                                                        Ireland                               New Zealand                                     United                             Sweden                                           Canada                                United                            Australia
                                                                                                                                                             Kingdom                                                                                                                    States

                                                                                                                                                                               2003–09                                  2009–16

                                                          So, New Zealand (the orange dot in Figure 8) remains in the low-cost, low-DALY loss quadrant of 30 high-
                                                          income countries. This result is slightly ambiguous. It can be taken to mean that New Zealand is performing
                                                          as well as similar nations, despite spending less money, or that it is failing to achieve some of the best health
                                                          outcomes in the world by not spending relatively small amounts more on its health services.1 Regardless, the
                                                          potential effect of long periods of flat expenditure in the face of a population with increasing health needs
                                                          warrants further consideration, which is given in chapter 2.
                                                          1       The value to New Zealand’s society of this investment is potentially substantial. The Accident Compensation Corporation (ACC) has
                                                                  estimated the value of an avoided DALY using a method that, for 2015 prices, would give a value of around $180,000. Were New Zealand
                                                                  to reduce its DALY per-capita rate to that of Australia (that is, a reduction of around 10 DALYs per 1,000 population), New Zealand would
                                                                  have roughly a further 47,000 years of healthy life each year, worth around $8.5 billion under the ACC estimation.

                                                                                                                                                                                                                                                                    A Window on the Quality of New Zealand’s Health Care 2018                                                                                                                                                               11
Figure 8: Expenditure on health care per head, US$ purchasing power parity (PPP), 2016, versus age-
                                             standardised disability-adjusted life years (DALYs) lost per 1,000 population, 2016, high-income countries
                                             (sources: OECD; University of Washington)

                                       300

                                       250
                                                                                                                                                  US

                                                                                           UK
                                       200
     DALYs lost per 1,000 population

                                                                                    NZ             CAN
                                                                                                               SWE
                                                                                                 AUS

                                       150

                                       100

                                        50

                                        0
                                             0                   2,000                   4,000                   6,000                 8,000   10,000           12,000
                                                                                            Health care expenditure per capita (US $PPP)
                                                                                                         (Each dot is a country.)

                                             All of the measures reported in chapter 1 (and in previous editions of the Window) cover what has occurred
                                             in the past. At best, the data is six months to a year old. A lot can change in that time, and pressures on a
                                             system can take several years to show up in results. While these ‘lagging’ indicators are useful and
                                             important, we need to do two things to understand the current position. First, we need to examine these
                                             indicators in greater depth. We do this in the rest of chapter 1. Second, we need to supplement them with
                                             more prospective measures (‘leading indicators’) to see where the system might be heading. This is
                                             discussed in chapter 2.
                                             The first ‘lagging indicator’ is health outcomes for different groups of people. As shown in Figure 1, mortality
                                             from conditions we can treat varies around the country. Figure 9 shows, for different ethnic groups, this
                                             distinction is even more stark.

12                                           A Window on the Quality of New Zealand’s Health Care 2018
Figure 9: Mortality from conditions amenable to health care per 100,000 population aged 0–74, by ethnic
                                                                  group, New Zealand, 2009–15 (source: Ministry of Health)

                                                                  300
      Amenable mortality per 100,000 population age

                                                                              250
                                                                  250
                                                                              211
                                                                  200
                                                                                                                                                                              189
                                                                                                                                                                              180
                                                                  150

                                                                  100
                                                                              87                                                                                              75
                                                                   50

                                                                    0
                                                                            2009            2010             2011             2012          2013           2014         2015

                                                                                                     Māori          Pacific          Non Māori, non-Pacific

                                                                  Similarly, Figure 10 shows that a strong relationship exists between the mortality rate for these conditions in
                                                                  individual DHBs and the local levels of deprivation (r2= .68). In broad terms, for every 10 points that
                                                                  deprivation increases on the NZDep2013 index of deprivation scale, a further five people per 100,000
                                                                  population die from treatable diseases.

                                                                  Figure 10: Mortality from conditions amenable to health care per 100,000 population aged 0–74, by DHB, New
                                                                  Zealand, 2010–14 (source: Ministry of Health), compared with NZDep20132 by DHB (source: University of Otago)

                                                                  160
Age standardised amenable mortality rate per 100,000 population

                                                                  140

                                                                  120

                                                                  100

                                                                   80

                                                                   60

                                                                   40

                                                                   20

                                                                    0
                                                                    940              960              980            1,000              1,020           1,040         1,060           1,080            1,100
                                                                                           Less deprived                              NZDep13                     More deprived
                                                                                                                                 (Each dot is a DHB.)
                                                                  2 NZDep2013, calculated by the School of Public Health at the University of Otago, is an index of deprivation of local areas that includes:
                                                                    people aged below 65 with no access to the internet at home; people aged 18–64 receiving a means-tested benefit; people living in
                                                                    equivalised households with income below an income threshold; people aged 18–64 unemployed; people aged 18–64 without any
                                                                    qualifications; people not living in their own home; people aged over 65 living in a single parent family; people living in equivalised
                                                                    households below a bedroom occupancy threshold; and people with no access to a car. For the purposes of Figure 10, the weighted mean
                                                                    of NZDep2013 scores for area units within each DHB are used. Further details of the NZDep2013 scores are available from www.otago.
                                                                    ac.nz/wellington/otago069929.pdf (accessed 14 May 2018).
                                                                                                                                                   A Window on the Quality of New Zealand’s Health Care 2018    13
The pattern of worse outcomes and experiences for deprived populations is especially notable for children.
                           The recent report of the Child and Youth Mortality Review Committee notes that children living in deprived
                           areas are three times more likely to die than those in the most affluent areas. 3 Similarly, the New Zealand
                           Child and Youth Epidemiology Service shows that children living in areas in the most deprived quintile are
                           three times as likely to be admitted to hospital for respiratory and infectious diseases.4
                           Every previous Window has noted that New Zealand’s health care system struggles to provide high-quality
                           services to all New Zealanders, and that outcomes for some groups of people are not as good as for others.
                           The effects of deprivation are clear, but the solutions will require measures beyond those that involve direct
                           investment in health services.

                           Equity
                           The pattern of worse outcomes for some groups is reflective of inequity for Māori and Pacific peoples and
                           those living with greater socioeconomic deprivation. These groups are more likely to have greater health
                           needs and to find it difficult to access care. They are less likely to get the best care, even when they do access
                           it, and are less likely to find care a positive experience.

                           Previous Windows have highlighted issues of ethnic inequity. Inequity can also be seen across
                           socioeconomic status, age, gender and rurality. This section considers types of inequity among different
                           population groups. Concerning examples are evident for all groups.

                           Inequity of access
                           Cost barriers to accessing primary care affect Māori, younger and more deprived populations
                           disproportionately and have done so consistently for the past five years, despite changes in public health
                           funding to reduce these barriers (Figure 11). For example, the figure shows that Māori are 1.4 times more
                           likely than non-Māori to identify cost barriers to accessing primary health care.

                           Figure 11: Adjusted rate ratio of respondents identifying cost barriers to accessing primary care (second
                           mentioned group = 1.0), New Zealand, 2011–15 and 2016/17 (source: Ministry of Health health survey)
                           1.8

                           1.6

                           1.4

                           1.2
     Adjusted rate ratio

                             1

                           0.8

                           0.6

                           0.4

                           0.2

                            0
                                  Men vs women        Māori vs non-Māori Pacific vs non-Pacific     Asian vs non-Asian     Most deprived vs
                                                                                                                            least deprived

                                                                              2011–15    2016/17

                           3 Health Quality & Safety Commission. 2018. Child and Youth Mortality Review Committee 13th data report 2012–2016, figure 1.5. Wellington:
                             Health Quality & Safety Commission. URL: www.hqsc.govt.nz/assets/CYMRC/Publications/CYMRC-13th-data-report-FINAL-Apr-2018.pdf
                             (accessed 14 May 2018).
                           4 New Zealand Child and Youth Epidemiology Service. 2017. Child Poverty Monitor: Technical Report, figure 39. Dunedin: New Zealand Child
                             and Youth Epidemiology Service. URL: http://nzchildren.co.nz/#Hospitalisations (accessed 14 May 2018).

14                         A Window on the Quality of New Zealand’s Health Care 2018
Even if we restrict this question to people who have at some point been able to access services, the pattern
                                                        holds for ethnic groups (Figure 12) and can also be seen, even more starkly, for age groups (Figure 13).
                                                        Younger people in need of health care are much more likely to experience cost barriers to accessing care.
                                                        For Figures 12 and 13, lower percentages reflect lower reported access barriers due to cost. Therefore, lower
                                                        percentages are better.

                                                        Figure 12: Percentage of respondents reporting cost barriers to access in the primary care patient experience
                                                        survey, by ethnic group, New Zealand, November 2017
                                                        35
Percentage of respondents experiencing a cost barrier

                                                        30

                                                        25

                                                        20

                                                        15

                                                        10

                                                         5

                                                        0
                                                             In the last 12 months was there         Has cost stopped                 Has cost stopped you           Has cost stopped you
                                                             a time when you did not visit a       you from picking up a            from seeing a health care       from seeing a specialist
                                                              GP or nurse because of cost?             prescription?                      professional?                    doctor?

                                                                                                       Asian     European   Māori      Other     Pacific

                                                        Figure 13: Percentage of respondents reporting cost barriers to access in the primary care patient experience
                                                        survey, by age group, New Zealand, November 2017

                                                        50

                                                        45
Percentage of respondents experiencing a cost barrier

                                                        40

                                                        35

                                                        30

                                                        25

                                                        20

                                                        15

                                                        10

                                                         5

                                                         0
                                                             In the last 12 months was there      Has cost stopped you from              Has cost stopped you        Has cost stopped you from
                                                             a time when you did not visit a      picking up a prescription?           from seeing a health care     seeing a specialist doctor?
                                                              GP or nurse because of cost?                                                   professional?
                                                                                               15–24     25–44      45–64      65–74     75-84      85+
                                                                                                                        Age

                                                                                                                                       A Window on the Quality of New Zealand’s Health Care 2018   15
Cost barriers are also related to socioeconomic status. Figure 14, reproduced from the Commonwealth Fund’s
                                               biennial review of developed world health systems, shows that people with lower incomes are typically
                                               10–20 percent more likely to report cost barriers to accessing care in New Zealand. For obtaining out-of-hours
                                               care or long waits for specialist appointments, New Zealand’s results show the greatest disparity among all 11
                                               countries reported on.5 In Figure 14, lower scores reflect less inequity.

                                               Figure 14: Disparity in access to care between above and below average income respondents, 2016
                                               (source: Commonwealth Fund, Mirror, Mirror)
                                               50

                                               40
     Percentage difference between above and
        below average income respondents

                                               30

                                               20

                                                10

                                                0

                                               -10

                                               -20
                                                     Had any cost-related     Skipped dental care or        Had serious             Somewhat or very           Waited two months
                                                       access problem        check up because of cost    problems paying or      difficult to obtain after-   or longer for specialist
                                                                                 in the past year        was unable to pay              hours care                 appointment
                                                                                                            medical bills

                                                                                           New Zealand     Minimum     Maximum     Median

                                               Inequity of treatment
                                               Thirteen questions in the primary care patient experience survey relate to operation of the health care
                                               system in treating people, ensuring different parts of the system work well together to coordinate care for a
                                               patient. Results for different ethnic and age groups are telling. When compared with European respondents,
                                               both Māori and ‘Other’ respondents reported a worse experience of coordination of care on a range of
                                               dimensions (Table 1).

                                               Table 1: Number of questions where respondents from Asian, Māori, Other and Pacific peoples ethnic groups
                                               gave significantly different responses about coordination of care than respondents from the European ethnic
                                               group, primary care patient experience survey, New Zealand, November 2017

                                                Ethnic group                                                          More positive                                 Less positive
                                                Asian                                                                            0/13                                          0/13
                                                Māori                                                                            0/13                                           3/13
                                                Other                                                                            0/13                                           7/13
                                                Pacific peoples                                                                   1/13                                          1/13

                                               This disparity is even more pronounced for age groups (Table 2). People below 65 years of age reported
                                               poorer coordination of care than those aged 65 and over.

                                               5 The group comprises: Australia, Canada, France, Germany, Netherlands, New Zealand, Norway, Sweden, Switzerland, United Kingdom
                                                 and United States of America.

16                                             A Window on the Quality of New Zealand’s Health Care 2018
Table 2: Number of questions where different age groups gave significantly more or less positive responses
about coordination of care than the overall rate, primary care patient experience survey, New Zealand,
November 2017

 Age group (years)                                          More positive                          Less positive
 15–24                                                                0/13                                   8/13
 25–44                                                                0/13                                  13/13
 45–64                                                                0/13                                   5/13
 65–74                                                               12/13                                   0/13
 75–84                                                               10/13                                   0/13
 85+                                                                   7/13                                  0/13

Inequity of experience
The primary care patient experience survey provides a similar picture for questions about experience of
care, which concentrate on quality of communication and meeting of physical and emotional needs
(Table 3). We noted in last year’s Window that the hospital inpatient survey showed questions about
experience of care were reported more negatively by Māori. The same result holds for the primary care
patient experience survey.

Table 3: Number of questions where respondents from the Asian, Māori, Other and Pacific peoples ethnic
groups gave significantly different responses about experience of care than respondents from the European
ethnic group, primary care patient experience survey, New Zealand, November 2017

 Ethnic group                                               More positive                          Less positive
 Asian                                                               0/20                                    5/20
 Māori                                                               0/20                                   8/20
 Other                                                               0/20                                    5/20
 Pacific peoples                                                      1/20                                   5/20

Again, a pattern is evident of younger people reporting less positive experiences than older people, with
65 years marking a clear cut-off point (Table 4).

Table 4: Number of questions where different age groups gave more or less positive responses about
experience of care than the overall rate, primary care patient experience survey, New Zealand, November 2017

 Age group (years)                                          More positive                          Less positive
 15–24                                                               0/20                                   15/20
 25–44                                                               0/20                                   17/20
 45–64                                                               0/20                                   4/20
 65–74                                                               18/20                                  0/20
 75–84                                                               14/20                                   1/20
 85+                                                                  8/20                                  0/20

                                                              A Window on the Quality of New Zealand’s Health Care 2018   17
Safety
                                               The Commission has worked with the sector to introduce national quality improvement programmes that
                                               address identified areas of patient harm where improvement is needed. When a national quality
                                               improvement programme is under way, we generally see patterns of reduced patient harm that have
                                               persisted, suggesting good – and effective – practice has become embedded.
                                               Since the introduction of the Commission’s reducing harm from falls programme in 2012, rates for falls in
                                               hospital resulting in a fractured hip (known as a fractured neck of femur) reduced by 30–40 percent in 2014
                                               and have stayed down (Figure 15).6, 7
                                               Figure 15: In-hospital falls leading to a fractured neck of femur in people aged 15 and over, by month,
                                               New Zealand, 2012−17
                                               20

                                               18
     Percentage difference between above and

                                               16
        below average income respondents

                                               14

                                               12

                                               10

                                                8

                                                6

                                               4

                                                2

                                               0
                                                     Jul 2012

                                                                   Oct 2012

                                                                                    Jan 2013

                                                                                                          Apr 2013

                                                                                                                           Jul 2013

                                                                                                                                          Oct 2013

                                                                                                                                                           Jan 2014

                                                                                                                                                                                 Apr 2014

                                                                                                                                                                                                  Jul 2014

                                                                                                                                                                                                                Oct 2014

                                                                                                                                                                                                                           Jan 2015

                                                                                                                                                                                                                                                                Apr 2015

                                                                                                                                                                                                                                                                                  Jul 2015

                                                                                                                                                                                                                                                                                                  Oct 2015

                                                                                                                                                                                                                                                                                                                 Jan 2016

                                                                                                                                                                                                                                                                                                                                Apr 2016

                                                                                                                                                                                                                                                                                                                                            Jul 2016

                                                                                                                                                                                                                                                                                                                                                       Oct 2016

                                                                                                                                                                                                                                                                                                                                                                    Jan 2017

                                                                                                                                                                                                                                                                                                                                                                                  Apr 2017

                                                                                                                                                                                                                                                                                                                                                                                                 Jul 2017
                                                                                                                                                                                             Falls per 100,000 admissions                                                                                    Median

                                               Thanks to the spread of good practice in avoiding                                                                                                                                                               … rates for surgical site infections (SSIs) reduced
                                               wound infections after hip and knee operations                                                                                                                                                                  in 2015 and have stayed down.
                                               since 2014…
                                               Figure 16: Hip and knee operations where good practice                                                                                                                                                          Figure 17: SSIs for hip and knee operations, by
                                               in antibiotic prophylaxis and skin preparation was                                                                                                                                                              month, New Zealand, 2013–17
                                               followed, by quarter, New Zealand, 2013–17
                                               100                                                                                                                                                                                                             2.5
                                                90
     Percentage of hip and knee

                                                80
                                                                                                                                                                                                                             Infections per 1,000 operations

                                                                                                                                                                                                                                                                  2
                                                70
           arthroplasties

                                                60                                                                                                                                                                                                             1.5
                                                50
                                                40                                                                                                                                                                                                                 1
                                                30
                                                                                                                                                                                                                                                               0.5
                                                20
                                                10
                                                                                                                                                                                                                                                                  0
                                                 0
                                                                                                                                                                                                                                                                       Jul 2013

                                                                                                                                                                                                                                                                                       Dec 2013

                                                                                                                                                                                                                                                                                                      Jan 2014

                                                                                                                                                                                                                                                                                                                    May 2014

                                                                                                                                                                                                                                                                                                                                 Oct 2014

                                                                                                                                                                                                                                                                                                                                            Mar 2015

                                                                                                                                                                                                                                                                                                                                                       Aug 2015

                                                                                                                                                                                                                                                                                                                                                                  Jan 2016

                                                                                                                                                                                                                                                                                                                                                                               Jun 2016

                                                                                                                                                                                                                                                                                                                                                                                             Nov 2016

                                                                                                                                                                                                                                                                                                                                                                                                            Apr 2017
                                                       Jul 2013

                                                                  Nov 2013

                                                                              Mar 2014

                                                                                               Jul 2014

                                                                                                                Nov 2014

                                                                                                                             Mar 2015

                                                                                                                                        Jul 2015

                                                                                                                                                     Nov 2015

                                                                                                                                                                      Mar 2016

                                                                                                                                                                                       Jul 2016

                                                                                                                                                                                                   Nov 2016

                                                                                                                                                                                                              Mar 2017

                                                                                    Timely antibiotics                                                     ≥ 2 g cefazolin                                                                                                                                                     SSI rate                    Median
                                                                                               Appropriate skin preparation

                                               6      Jones S, Blake S, Hamblin R, et al. 2016. Reducing harm from falls. New Zealand Medical Journal 129(1446): 89–103.
                                               7      Healey F. 2016. Falls prevention as everyday heroism. New Zealand Medical Journal 129(1446): 14–16.

18                                             A Window on the Quality of New Zealand’s Health Care 2018
Postoperative deep vein thrombosis leading to pulmonary embolism (DVT/PE) is an avoidable and often fatal
                                complication following surgery. Since 2013, rates for DVT/PE have remained statistically significantly lower
                                than we would have predicted, with 16 out of 18 quarters having had fewer postoperative DVT/PEs, based on
                                historic rates. This is shown by the blue line being consistently lower than the orange line in Figure 18.
                                Figure 18: Postoperative DVT/PE, actual and predicted based on underlying patient risk, by quarter,
                                New Zealand, 2008–17

                                250

                                200
DVT/PE per quarter

                                150

                                100

                                 50

                                  0
                                      2008 Q1

                                                 2008 Q3

                                                           2009 Q1

                                                                      2009 Q3

                                                                                  2010 Q1

                                                                                            2010 Q3

                                                                                                      2011 Q1

                                                                                                                2011 Q3

                                                                                                                          2012 Q1

                                                                                                                                    2012 Q3

                                                                                                                                                2013 Q1

                                                                                                                                                          2013 Q3

                                                                                                                                                                    2014 Q1

                                                                                                                                                                               2014 Q3

                                                                                                                                                                                         2015 Q1

                                                                                                                                                                                                   2015 Q3

                                                                                                                                                                                                               2016 Q1

                                                                                                                                                                                                                         2016 Q3

                                                                                                                                                                                                                                   2017 Q1

                                                                                                                                                                                                                                             2017 Q3
                                                                                                DVT/PE cases                                  Predicted DVT/PE cases

                                … and New Zealand’s rates of DVT/PE appear to be low by international standards (Figure 19).

                                Figure 19: Postoperative DVT/PE, hip and knee surgeries, by OECD country, 2015 (source: OECD)8

                                1,800

                                1,600
DVT/PE per 100,000 admissions

                                1,400

                                1,200

                                1,000

                                 800

                                 600

                                 400

                                 200

                                    0
                                                Sweden               United             United             Ireland        OECD14 Australia                                                                    New    Sweden                   OECD9    Canada
                                                                     States            Kingdom                                                                                                               Zealand

                                                                                Surgical admission method                                                  DVT                PE                                         All-admission method

                                8 Reflecting the differences in the way that countries collect data, the OECD provides two methods for calculating the postoperative
                                  complications shown in Figures 19 and 20, which are not comparable to each other. The all-admission method is considered more
                                  accurate, because it allows re-admissions with the complication to be included in the numerator. Sweden calculates using both methods,
                                  which provides very different results. Full details can be found in the OECD Health at Glance 2017. URL: https://read.oecd-ilibrary.org/
                                  social-issues-migration-health/health-at-a-glance-2017_health_glance-2017-en#page118 (accessed 14 May 2018).

                                                                                                                                                                               A Window on the Quality of New Zealand’s Health Care 2018                        19
Instances of postoperative sepsis in New Zealand are also low by international standards…

                                              Figure 20: Postoperative sepsis, abdominal surgeries, by OECD country, 2015 (source: OECD)

                                              4,000

                                              3,500
     Sepsis per 100,000 surgical admissions

                                              3,000

                                              2,500

                                              2,000

                                              1,500

                                              1,000

                                               500

                                                    0
                                                                  Sweden                        OECD14                         United                        United                       Australia                      Ireland                                                           New                              Sweden                     OECD11                            Canada
                                                                                                                               States                       Kingdom                                                                                                                       Zealand

                                                                                                                              Surgical admission method                                                                                                                                                                All-admission method

                                              … although with postoperative sepsis, we do not see the same lower trend of observed versus predicted
                                              instances as with DVT/PE (in Figure 18) (Figure 21).

                                              Figure 21: Postoperative sepsis, actual and predicted based on underlying patient risk, by quarter, New Zealand,
                                              2009–17

                                              200

                                              180

                                              160

                                              140
     Sepsis per quarter

                                              120

                                              100

                                               80

                                               60

                                               40

                                               20

                                                0
                                                        2009 Q1
                                                                  2009 Q2

                                                                            2009 Q3

                                                                                      2009 Q4

                                                                                                2010 Q1
                                                                                                          2010 Q2

                                                                                                                    2010 Q3

                                                                                                                              2010 Q4

                                                                                                                                        2011 Q1
                                                                                                                                                  2011 Q2

                                                                                                                                                            2011 Q3

                                                                                                                                                                      2011 Q4

                                                                                                                                                                                2012 Q1
                                                                                                                                                                                          2012 Q2

                                                                                                                                                                                                    2012 Q3

                                                                                                                                                                                                              2012 Q4

                                                                                                                                                                                                                        2013 Q1
                                                                                                                                                                                                                                  2013 Q2

                                                                                                                                                                                                                                            2013 Q3

                                                                                                                                                                                                                                                      2013 Q4

                                                                                                                                                                                                                                                                2014 Q1
                                                                                                                                                                                                                                                                          2014 Q2

                                                                                                                                                                                                                                                                                    2014 Q3

                                                                                                                                                                                                                                                                                              2014 Q4

                                                                                                                                                                                                                                                                                                        2015 Q1
                                                                                                                                                                                                                                                                                                                  2015 Q2

                                                                                                                                                                                                                                                                                                                             2015 Q3

                                                                                                                                                                                                                                                                                                                                       2015 Q4

                                                                                                                                                                                                                                                                                                                                                 2016 Q1
                                                                                                                                                                                                                                                                                                                                                           2016 Q2

                                                                                                                                                                                                                                                                                                                                                                     2016 Q3

                                                                                                                                                                                                                                                                                                                                                                               2016 Q4

                                                                                                                                                                                                                                                                                                                                                                                         2017 Q1
                                                                                                                                                                                                                                                                                                                                                                                                   2017 Q2

                                                                                                                                                                                                                                                                                                                                                                                                             2017 Q3

                                                                                                                                                                      Sepsis cases                                                Predicted sepsis cases

20                                            A Window on the Quality of New Zealand’s Health Care 2018
Similarly, no reduction has occurred in healthcare-                                                                                                                   …despite five years of ever-increasing compliance,
                            associated Staphylococcus aureus infections in                                                                                                                        with good hand hygiene practice being recorded
                            New Zealand…                                                                                                                                                          in audits.
                            Figure 22: Staphylococcus aureus bacteraemia rate                                                                                                                     Figure 23: Hospital hand hygiene compliance rate
                            per 1,000 bed-days, by month, New Zealand, 2012–17                                                                                                                    (%), New Zealand, 2012–17
                            0.18
S. aureus bacteraemia per

                                                                                                                                                                                                  90
                            0.16
                                                                                                                                                                                                  80
     1,000 bed-days

                            0.14

                                                                                                                                                                        hand hygiene ‘moments’
                                                                                                                                                                        Percentage of compliant
                            0.12                                                                                                                                                                  70
                            0.10
                                                                                                                                                                                                  60
                            0.08
                            0.06                                                                                                                                                                  50
                            0.04                                                                                                                                                                  40
                            0.02
                               0                                                                                                                                                                  30
                                   Jan 2012

                                              Jul 2012

                                                         Jan 2013

                                                                     Jul 2013

                                                                                Jan 2014

                                                                                           Jul 2014

                                                                                                      Jan 2015

                                                                                                                 Jul 2015

                                                                                                                            Jan 2016

                                                                                                                                       Jul 2016

                                                                                                                                                  Jan 2017

                                                                                                                                                             Jul 2017
                                                                                                                                                                                                  20
                                                                                                                                                                                                  10
                                                                    S. aureus bacteraemia                                       Median                                                            0

                                                                                                                                                                                            Ja 12

                                                                                                                                                                                             Ju 3

                                                                                                                                                                                            Ja 13

                                                                                                                                                                                             Ju 4

                                                                                                                                                                                            Ja 14

                                                                                                                                                                                             Ju 5
                                                                                                                                                                                                      5

                                                                                                                                                                                             Ju 6

                                                                                                                                                                                            Ja 16

                                                                                                                                                                                             Ju 7
                                                                                                                                                                                                      7
                                                                                                                                                                                                    1

                                                                                                                                                                                                    1
                                                                                                                                                                                                   01

                                                                                                                                                                                                    1
                                                                                                                                                                                                    1
                                                                                                                                                                                                 20

                                                                                                                                                                                                   0
                                                                                                                                                                                                   0

                                                                                                                                                                                                 20
                                                                                                                                                                                                 20

                                                                                                                                                                                                 20

                                                                                                                                                                                                  0
                                                                                                                                                                                                l2
                                                                                                                                                                                                l2

                                                                                                                                                                                                l2
                                                                                                                                                                                                l2

                                                                                                                                                                                                l2
                                                                                                                                                                                               l2
                                                                                                                                                                                               n

                                                                                                                                                                                               n
                                                                                                                                                                                               n

                                                                                                                                                                                              n
                                                                                                                                                                                              n
                                                                                                                                                                                             Ju

                                                                                                                                                                                            Ja
                                   Recent research has questioned the extent to which good hand hygiene affects rates of Staphylococcus
                                   aureus bacteraemia (SAB).
                                   The drivers of SAB rates are complex and similar to those of S. aureus disease in general. These drivers
                                   are established in the community and relate to the social, environmental and economic determinants
                                   of health (relative deprivation, overcrowding, poor nutrition, diabetes and obesity, for example).
                                   Limitations exist in the rigour of studies that have evaluated whether hand hygiene correlates directly
                                   with SAB reduction. Confounding factors, such as infection prevention interventions introduced at the
                                   same time as a hand hygiene initiative, may make it difficult to determine how much impact was due
                                   to improvement in practice. A randomised controlled trial would provide the most robust study design
                                   to determine cause and effect. However, it would be problematic to carry out this type of study
                                   because of methodological and ethical concerns. Similarly, hand hygiene data based on observational
                                   audits may be subject to confounding factors.
                                   The Commission is reviewing options for future approaches to achieving reductions in rates of SAB.

                            In addition to specific quality improvement programmes, the Commission monitors numerous aspects of
                            patient safety through its Atlas of Healthcare Variation. One aspect of recent concern is the use of opioids.
                            Opioids are an important part of managing many types of pain, but overprescribing is associated with many
                            direct and indirect problems. New Zealand’s opioid consumption, though increasing since around 2009, is
                            lower than similar countries but greater than the European average (Figure 24).

                                                                                                                                                                                                       A Window on the Quality of New Zealand’s Health Care 2018   21
Figure 24: Total opioid consumption (morphine equivalence mg/capita), 2006–15 (sources: Pain & Policy
             Studies Group, University of Wisconsin; International Narcotics Control Board; World Health Organization)

                                                             1,000

                                                              750

                                                                                                                                                        Australia
     Consumption (mg/capita)

                                                                                                                                                        Canada
                                                                                                                                                        Europe (EURO)
                                                                                                                                                        New Zealand
                                                              500
                                                                                                                                                        Sweden
                                                                                                                                                        USA
                                                                                                                                                        United Kingdom

                                                              250

                                                                0
                                                                       06

                                                                                 07

                                                                                        08

                                                                                                09

                                                                                                       10

                                                                                                               11

                                                                                                                          12

                                                                                                                                  13

                                                                                                                                            14

                                                                                                                                                   15
                                                                                                             20

                                                                                                                                20
                                                                                                                        20

                                                                                                                                                 20
                                                                                                                                          20
                                                                                                     20
                                                                               20
                                                                     20

                                                                                      20

                                                                                              20

             Although the number of New Zealanders being dispensed a strong opioid continues to increase, the
             highest rates in the country have reduced a little (as the orange line on Figure 25 shows)…

             Figure 25: People dispensed a strong opioid per 1,000 population, highest and lowest DHBs,
             New Zealand, 2011–16
     People dispensed a strong opioid per 1,000 population

                                                              35

                                                              30

                                                              25

                                                              20

                                                               15

                                                              10

                                                               5

                                                               0
                                                                        2011           2012          2013           2014           2015          2016
                                                                                               New Zealand    Highest          Lowest

             … but more DHBs have high dispensing rates. They are no longer outliers, because the number of DHBs
             with more than 20 people per 1,000 dispensed a strong opioid has nearly quadrupled in five years (see
             Figure 26)…

22           A Window on the Quality of New Zealand’s Health Care 2018
Figure 26: Number of DHBs where more than 20 people per 1,000 were dispensed a strong opioid, New Zealand,
     2011–16
 Number of DHBs where more than 20 people per

                                                8
     1,000 were dispensed a strong opioid

                                                7

                                                6

                                                5

                                                4

                                                3

                                                2

                                                1

                                                0

                                                     2011     2012          2013          2014           2015            2016

     … and different patterns of dispensing seem to be emerging, including increased prescribing of morphine
     and fentanyl in rest homes (see Figure 27).

   Figure 27: Dispensing of strong opioids by site of residence, New Zealand, 2012–16
                               20
                                   18
Percentage of population

                                   16
                                   14                                                                              Morphine rest home
                                    12                                                                             Oxycodone rest home
                                  10                                                                               Fentanyl rest home
                                          8                                                                        Morphine community
                                          6                                                                        Oxycodone community
                                                                                                                   Fentanyl community
                                          4
                                           2
                                         0
                                                    2012    2013     2014          2015          2016

     In general, where the Commission has a quality improvement programme focused on a specific aspect of
     patient safety, improvements are seen in safe practice and patient outcomes. Many more issues of patient
     safety can, however, be tackled through national programmes.

     Patient experience
     Patient experience is an important part of quality of care. Providing a better experience, developing
     partnerships with patients, and patient and family/whānau-centred care are linked to improved health,
     clinical, satisfaction and financial outcomes.9 To monitor this, the Commission conducts an inpatient
     experience survey and a primary care patient experience survey.
     Results for the inpatient experience survey have been remarkably consistent over three-and-a-half years, as
     shown in Figure 28, which provides data for the whole country. The orange bars show the range of average
     national scores over the 14 iterations of the survey undertaken.

     9 Balik B, Conway J, Zipperer L, et al. 2011. Achieving an Exceptional Patient and Family Experience of Inpatient Hospital Care. IHI Innovation
       Series white paper. Cambridge, MA: Institute for Healthcare Improvement. URL: www.ihi.org/resources/Pages/IHIWhitePapers/
       AchievingExceptionalPatientFamilyExperienceInpatientHospitalCareWhitePaper.aspx (accessed March 2018).

                                                                                                 A Window on the Quality of New Zealand’s Health Care 2018   23
Figure 28: Variation in proportion of respondents giving the most positive response over time, inpatient
     experience survey, New Zealand, August 2014 to November 2017

                  In your opinion, how clean was the hospital room or ward
                                                         that you were in?

           Was religious or spiritual support available when you needed it?

                     Were you given enough privacy when discussing your
                                                 condition or treatment?
                     Did you feel you were involved in decisions about your
                                                  discharge from hospital?
     Did you feel other staff listened to what you had to say? (Yes, always)

         Did you feel nurses listened to what you had to say? (Yes, always)

      Did you have confidence and trust in the other members of the team
                                               treating you? (Yes, always)
              Did you have confidence and trust in the nurses treating you?
                                                              (Yes, always)
             Did you have confidence and trust in the doctors treating you?
                                                              (Yes, always)
               Did staff tell you how the operation went in a way you could
                                             understand? (Yes, completely)
       Before the operation did staff explain the risks and benefits in a way
                                  you could understand? (Yes, completely)
         Was cultural support available when you needed it? (Yes, always)

                   Overall, did you feel staff treated you with kindness and
               understanding while you were in the hospital? (Yes, always)
              Overall, did you feel staff treated you with respect and dignity
                                while you were in the hospital? (Yes, always)
           Do you think the hospital staff did everything they could to help
                                         control your pain? (Yes, definitely)
            If you needed help from the staff getting to the toilet or using a
                              bedpan, did you get it in time? (Yes, always)
          Do you feel you received enough information from the hospital on
      how to manage your condition after your discharge? (Yes, definitely)
     Were you given conflicting information by different staff members, eg,
        one staff member would tell you one thing and then another would
                                           tell you something different? (No)
     Did the hospital staff include your family/whānau or someone close to
                           you in discussions about your care? (Yes, always)
        Were you involved as much as you wanted to be in decisions about
                               your care and treatment? (Yes, definitely)
      Did a member of staff tell you about medication side effects to watch
                               for when you went home? (Yes, completely)
        Did you feel doctors listened to what you had to say? (Yes, always)

                     Was your condition explained to you in a way that you
                                     could understand? (Yes, completely)
            When you had important questions to ask a doctor, did you get
                      answers that you could understand? (Yes, always)
                                                                                 0   10    20      30       40      50      60      70       80     90   100

                                                                                          Percentage of respondents giving most positive response
                                                                                                          Average        Range

     Over that time, however, the variation between the best- and worst-scoring DHBs has been much greater,
     suggesting improvement is possible in at least some parts of the country (Figure 29). The orange bars in
     Figure 29 show the inter-DHB range of average results.

24   A Window on the Quality of New Zealand’s Health Care 2018
Figure 29: Variation in proportion of respondents giving the most positive response between DHBs, inpatient
experience survey, New Zealand, average August 2014 to November 2017

                  In your opinion, how clean was the hospital room or
                                              ward that you were in?
      Was religious or spiritual support available when you needed it?

                Were you given enough privacy when discussing your
                                             ondition or treatment?
                Did you feel you were involved in decisions about your
                                             discharge from hospital?
Did you feel other staff listened to what you had to say? (Yes, always)

    Did you feel nurses listened to what you had to say? (Yes, always)

           Did you have confidence and trust in the other members of
                                the team treating you? (Yes, always)
         Did you have confidence and trust in the nurses treating you?
                                                         (Yes, always)
        Did you have confidence and trust in the doctors treating you?
                                                         (Yes, always)
          Did staff tell you how the operation went in a way you could
                                        understand? (Yes, completely)
  Before the operation did staff explain the risks and benefits in a way
                             you could understand? (Yes, completely)
    Was cultural support available when you needed it? (Yes, always)

              Overall, did you feel staff treated you with kindness and
          understanding while you were in the hospital? (Yes, always)
  Overall, did you feel staff treated you with respect and dignity while
                                 you were in the hospital? (Yes, always)
      Do you think the hospital staff did everything they could to help
                                    control your pain? (Yes, definitely)
       If you needed help from the staff getting to the toilet or using a
                         bedpan, did you get it in time? (Yes, always)
   Do you feel you received enough information from the hospital on
 how to manage your condition after your discharge? (Yes, definitely)
Were you given conflicting information by different staff members, eg,
   one staff member would tell you one thing and then another would
                                      tell you something different? (No)
Did the hospital staff include your family/whānau or someone close to
                      you in discussions about your care? (Yes, always)
   Were you involved as much as you wanted to be in decisions about
                          your care and treatment? (Yes, definitely)
 Did a member of staff tell you about medication side effects to watch
                          for when you went home? (Yes, completely)
   Did you feel doctors listened to what you had to say? (Yes, always)

                    Was your condition explained to you in a way that
                           you could understand? (Yes, completely)
       When you had important questions to ask a doctor, did you get
                 answers that you could understand? (Yes, always)
                                                                            0   10    20      30       40      50      60      70       80     90   100
                                                                                     Percentage of respondents giving most positive response
                                                                                                     Average        Range

Because considerable variation exists between DHBs, we should be able to see improvement for these
questions in some areas over time.
The variation in the proportion of respondents agreeing that the hospital in which they were treated was
‘very clean’ is striking and concerning. This has potential links with control of infection, and other
jurisdictions have seen significant improvement in this measure when concerted efforts have been made.

                                                                                     A Window on the Quality of New Zealand’s Health Care 2018            25
The consistent low scores for information about medication side effects hold over time and between DHBs,
     and are mirrored for primary care (see Figure 31). The Commission responded by commissioning research
     into how this could be, and in some cases has been, addressed. A range of potential approaches could do
     this, including improving discharge documentation and targeting medications with common or serious side
     effects.10
     Both issues raise the question, however, of how best can we get improvement in responses to the survey
     results. This is an issue reflected on by the Commission’s Director of Partners in Care below.

         Drowning in data: Let’s focus on some action
         by Chris Walsh, Director, Partners in Care, Health Quality & Safety Commission
         With over three years of data from the patient experience surveys in DHB inpatient services, we can be
         pretty sure of a few things. One, the lower-scoring areas haven’t shifted nationally. Two, the variation in
         these scores between the best- and worst-scoring DHBs is wide. Three, this is a worry.
         Why? Because good patient experience equates with better health outcomes, and because mediocrity
         is not good enough.
         The lower-scoring areas are around communication about medication, how patients can manage their
         condition when they leave hospital and how families/whānau or someone close is involved in
         discussions about the patient’s care.
         All are critical to patient health and wellbeing.
         What’s to be done? Let’s have a nationally based approach.
         The national falls and infection prevention and control programmes have resulted in fewer falls
         and infections.
         Maybe it’s time to refresh our approach to targets and consider how this could be used to improve
         patient experience.

     We first reported results from the primary care patient experience survey in December 2017.11 Since then,
     uptake of the survey has increased considerably, with over half of all practices now undertaking it once a
     quarter. The most recent available quarter results are reported in this section.
     Despite the dramatic increase in uptake and much more widespread use of the survey, the responses have
     been remarkably consistent at a national level from the year 1 results reported in December 2017 (Figure
     30; orange new and blue old).
     Responses from the general practitioner (GP) surgeries are generally positive, for example, more than
     85 percent of respondents felt wait times at the GP were acceptable. Even more positive results were
     evident for respect and kindness.

     10 Health Quality & Safety Commission. 2017. Raising the bar on the national patient experience survey: Report findings and recommendations.
        Wellington: Health Quality & Safety Commission. URL: www.hqsc.govt.nz/assets/Consumer-Engagement/Publications/Raising_the_
        bar_on_the_National_Patient_Experience_Survey_-_May_2017.pdf (accessed 22 May 2018).
     11 Health Quality & Safety Commission. 2017. Primary care patient experience survey: Results from the first year of pilots. Wellington: Health
        Quality & Safety Commission. URL: www.hqsc.govt.nz/assets/Health-Quality-Evaluation/PR/Primary_care_experience_survey_report_
        Dec_2017_final.pdf (accessed 26 April 2018).

26   A Window on the Quality of New Zealand’s Health Care 2018
You can also read