LIVERPOOL CITY REGION - Child and Family Poverty Needs Assessment - Halton I Knowsley I Liverpool I Sefton I St. Helens I Wirral
←
→
Page content transcription
If your browser does not render page correctly, please read the page content below

LIVERPOOL CITY REGION
         Halton   ■   Knowsley   ■   Liverpool   ■   Sefton   ■   St. Helens   ■   Wirral

Child and Family Poverty Needs Assessment
Contents

Foreword                                                           3

Executive Summary                                                  5

    1       Introduction                                          11
    2       Why Child and Family Poverty Matters                  13
    3       Background                                            15
    4       Local Context                                         21
    5       Partners involved in tackling Child and               27
            Family Poverty
    6       What does Child and Family Poverty look               29
            like in the Liverpool City Region?
    7       Governance                                            61
    8       Next Steps                                            62

Appendix 1                                                        63
Relationship between National, City Region and Local Strategies

Appendix 2                                                        64
Child Poverty and Life Chances Governance Structure

Supplementary Papers
Key Messages from Local Authority Needs Assessments
 • Halton
 • Knowsley
 • Liverpool
 • Sefton
 • St. Helens
 • Wirral

                                                                       1

Foreword

We are pleased to be able to present to you the Liverpool City Region Child and Family
Poverty Needs Assessment. The Needs Assessment forms an instrumental part of our
approach to addressing poverty and improving the life chances of children and families
across the City Region.

The process for developing the assessment has been a great partnership effort, involving
all City Region Local Authorities, local strategic and service delivery partners and
children and families.

We are confident that this needs assessment document provides us with a sound basis for
formulating our Liverpool City Region Child Poverty and Life Chances Strategy.

                   Councillor Ron Round                           Sheena Ramsey
                   Leader                                         Chief Executive
                   Knowsley Metropolitan                          Knowsley Metropolitan
                   Borough Council                                Borough Council
                   Liverpool City Region Portfolio                Chair
                   Holder of Employment and Skills                City Employment Strategy Board

                                                                                                   3
4
Executive Summary

Introduction                                                          Background
Around 90,000 children in the Liverpool City                          The requirement for Local Authorities to
Region are living in poverty1. Many of these                          produce a child poverty needs assessment
children will have an unequal start in life. A child                  was introduced by the Child Poverty Act
from a poor family is less likely to achieve their                    (March 2010).The policy and financial
academic potential and secure employment in                           environment has rapidly changed since the Act
adulthood, plus they are more likely to experience                    obtained Royal Assent, but what is crucially
a wide range of health inequalities and live in an                    important to this agenda is that the Child Poverty
unsafe environment.The perpetuating cycle of                          Act and the commitment to ending child poverty
poverty is not just damaging to individual lives but                  by 2020 have secured cross-party support.
also to society as a whole. It undermines efforts
to achieve sustainable and cohesive communities                       City Region partners have a strong track record
and also has significant resource implications for                    of working in partnership on shared priorities
public services.                                                      and have signed up to the long-term vision to
                                                                      “establish our status as a thriving international
The Liverpool City Region (LCR) Cabinet and                           City Region by 2030”. City Region partners
City Employment Strategy Board are fully                              recognise that failure to break the
committed to working together to improve the                          intergenerational transmission of poverty will
life chances of children and families in poverty                      mean that many children growing up in poverty
across the City Region. In order to fulfil this                       today will become the parents of children in
commitment, first a clear understanding of the                        poverty tomorrow and undermine these
extent and nature of poverty in the City Region                       long-term objectives.Therefore, the Liverpool
is required.The purpose of the LCR Child and                          City Region Cabinet commissioned the
Family Poverty Needs Assessment is to establish                       development of a Child and Family Poverty
a comprehensive picture of poverty. It draws                          Framework to join up efforts to reduce child
heavily on both quantitative and qualitative                          and family poverty across the City Region,
intelligence from the six local authority areas.                      both strategically and in terms of delivery.
This collective approach will help to determine                       This needs assessment is an important element
common cross boundary issues that will be the                         of the Framework.
focus of the City Region Child Poverty and Life
Chances Strategy.

1
    HMRC National Indicator 116 data for 31 August 2008 (figures released Autumn 2010)

                                                                                                                           5
Region’s underpinning economic weaknesses
    Local Context                                                       make these challenges far more daunting.
    Generally, parental employment is seen as the
    best route out of income poverty; therefore it is
    important to consider the health of the local
    economy and local labour market conditions.
                                                                        What does Child and
    The Liverpool City Region comprises the                             Family Poverty look like
    boroughs of Halton, Knowsley, Sefton, St. Helens,
    Wirral and the City of Liverpool.Together these                     in the City Region?
    districts make up a functional economic area
                                                                        The latest available data shows that on 31 August
    with approximately 90% of all residents both
                                                                        2008, 89,785 children in the Liverpool City
    living and working in the City Region; this is one
                                                                        Region were living in poverty - around 28% of all
    of the most contained employment markets in
                                                                        children3. This exceeds the levels of child poverty
    the country2.
                                                                        across the North West (22.8%) and England
    The Liverpool City Region has enjoyed an                            (20.9%)4.
    absolute improvement on many economic
                                                                        The following points provide a ‘snapshot’ of the
    indicators in the last 5 years; however the City
                                                                        extent and distribution of child poverty in the
    Region’s performance is more mixed relative to
                                                                        City Region on 31 August 2008:
    the rest of England.
                                                                           • The majority (77,965 or 86.8%) of children
    If the City Region reflected the England average it                       living in poverty are under 16 years of age
    would have:                                                               and 53,520 (59.6%) are under age 11
        • 46,000 fewer people without any                                  • Most children living in poverty (85.2%) live
           qualifications                                                     in households claiming Income Support (IS)
        • 26,400 more people with a level 2                                   or Job Seekers Allowance (JSA). The
           qualification (equivalent to 5 GCSEs)                              remaining 14.8% live in families with income
        • 43,800 more people with a level 4                                   below 60% of the median income who are
           qualification (equivalent to a Degree)                             claiming the Working Tax Credit (WTC)
                                                                              and/or Child Tax Credit (CTC)
        • In addition, if the LCR met the previous
           Government’s aspirational 80%                                   • The majority of children in poverty
           employment rate it would need to move                              (69,390) live in lone parent families (77.3%),
           an additional 115,000 more people into                             higher than the England average of 68.2%
           work.                                                           • The Liverpool City Region has a higher
                                                                              proportion of lone parent families on
    Jobs growth forecasts for the City Region -                               IS/JSA benefit (81.1%) than England
    certainly for the five years ahead - are bleak.                           (76.0)%
    The scenarios to 2030 are generally more
                                                                           • More than two fifths (41.0%) of children
    optimistic. One of the most pressing issues
                                                                              living in poverty in the Liverpool City
    for the City Region that could have an impact
                                                                              Region live in families with three or more
    on child and family poverty rates is the impact
                                                                              children; this is lower than the proportion
    of pending public sector spending cuts and
                                                                              in families with three or more children in
    related redundancies.
                                                                              England (45.5%)
    Economic resilience measures support a general                         • Local authority average child poverty
    and important message about the economic                                  figures mask the depth of child poverty in
    fragility of the City Region. Measures suggest that                       certain pockets or neighbourhoods,
    whilst the prevailing economic conditions create                          particularly within Sefton.
    challenging circumstances for any area, the City

    2
        LCR Employment and Skills Strategy and Commissioning Framework
    3
        Includes all dependent children under the age of 20
    4
        Figures based on HMRC NI 116 data (31 August 2008) figures released Autumn 2010

6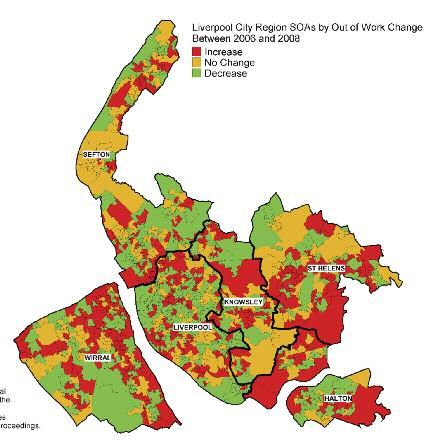
In overall terms, more neighbourhoods
experienced an increase in poverty, than a
                                                                        Pregnancy
decrease, during 2006-08. Whilst more current                           A relatively high proportion of young
data on child poverty is unavailable, a rise in                         people in the City Region are caught in a
redundancies and decrease in recruitment is likely                      cycle of poverty that starts to undermine
to have had a negative impact on child poverty                          their life chances even before they are
rates in the City Region in recent years.                               born. This is largely because the
‘In-work’ poverty has decreased in the majority of                      generation before them has already been
neighbourhoods, however ‘out-of-work’ poverty                           exposed to the poverty cycle.
has risen, demonstrating that worklessness                                 • On average, more babies are born to
remains a significant challenge for the City Region.                           teenage mothers in the City Region
                                                                               compared to England as a whole. In 2009,
Economic and social deprivation is widespread                                  the City Region birth rate was almost 50
across the City Region, almost one in three                                    per 1,000 population of females aged
households can be categorised as ‘Hard Pressed’*.                              15-17, compared with a little over 38 per
There are particularly high concentrations of                                  1,000 in England.These babies have a 63%
these households in Knowsley and Liverpool.                                    increased risk of being born into poverty
‘Hard Pressed’ parents will face limited                                       compared to babies born to mothers in
opportunities to improve their circumstances as                                their twenties6.
their qualifications and skills are likely to be low.
                                                                           • In terms of maternal health, the City Region
                                                                               has a comparatively large cohort of parents
                                                                               that are susceptible to low emotional
Drivers of outcomes in                                                         health and well being. However there is
                                                                               little reliable local data on the extent of
childhood and young                                                            mental health problems.
adulthood                                                                  • Low parental skills and attainment impacts
                                                                               on children’s foundation years and their
The factors that influence children’s outcomes                                 ability to perform well at school.
change as they grow up. Using a ‘Poverty and Life
Chances Model’5 a range of quantitative and
qualitative data has been drawn together to
identify factors that are influencing the outcomes
                                                                        Birth
for children in the Liverpool City Region at                            At birth we can begin to see the effects of
various stages in their lives.                                          the disadvantage experienced during
                                                                        pregnancy.
                                                                           • Low birth weight and infant mortality are
                                                                              slightly higher in the City Region than the
                                                                              rest of England.
                                                                           • Around 52% of all City Region mothers
                                                                              initiate breastfeeding, compared to 73%
                                                                              nationally. Therefore more babies in the
                                                                              City Region are missing out on the short
                                                                              and long term health benefits of being
                                                                              breastfed.

5
    Field F,The Foundation Years: Preventing Poor Children Becoming Poor Adults (2010)
6
    Department for Education and Skills (2010) Teenage Pregnancy: Accelerating the Strategy to 2010

* Conclusion is based on analysis using the ACORN classification tool. ACORN provides categorised and detailed demographic
  data at neighbourhood, postcode and household level.
                                                                                                                             7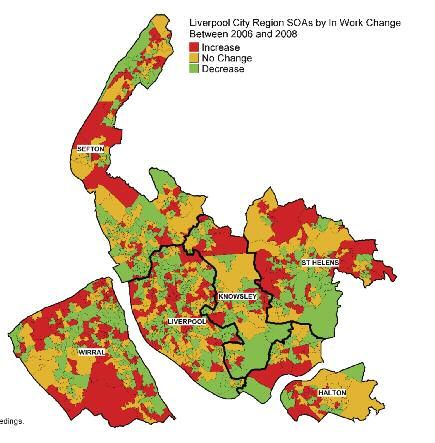
5 Years                                                 Secondary Years
    By age 5, the outcomes for many                         Educational achievement can provide
    children in the City Region are below                   an effective route out of the poverty
    the national average.                                   cycle. However, due to the challenges
       • Key indicators suggest that the health and         experienced by children in their earliest
         wellbeing of children in the City Region           years, this can be extremely difficult
         during their early school years is worse           to achieve.
         than for children in the rest of England.             • Around 46% of City Region pupils
         More 5 year olds have decayed, missing                  achieved 5 A*-C grades (or equivalent)
         or filled teeth and there is a higher                   including Maths and English in 2008/09.
         prevalence of obesity amongst children                  This is an improvement on attainment
         in reception class.                                     levels for the previous year; however a
       • In terms of the home environment, 40% of                long lasting gap still remains with the
         owner occupied and 55% of privately                     North West (49.9%) and England
         rented homes in the City Region fail to                 (49.8%).
         meet the Decent Homes Standard7.                      • In line with the national trend,
         This has implications for children’s health             educational disadvantage amongst
         and ability to study at home.                           children in poverty is more prevalent in
       • There is a strong correlation between                   secondary years than in primary years.
         domestic crime and child poverty, but there             The attainment gap at Key Stage 4
         is little evidence that this link is also               between LCR pupils eligible for FSM and
         causative.                                              their peers is a staggering 30%.

    Primary Years                                           Transition to adulthood
    In Primary years, many City Region
    children living in poverty are experiencing             Many young people who have grown up
    forms of developmental disadvantage.                    in poverty start their adult life at a distinct
                                                            disadvantage in the labour market.
       • Free School Meals (FSM) eligibility can be
          used as a proxy measure of child poverty.            • Around 25% of City Region young people
          At Key Stage 2 (age 10/11) the                         who were previously eligible for free school
          achievement gap between City Region                    meals gain a level 3 qualification at age 19
          pupils eligible for free school meals and              compared to 40% of their peers.
          their peers is around 20%.                           • Unsurprisingly, poor attainment results
       • Obesity prevalence at age 10-11 is even                 impact on future destinations.Young people
          greater than at age 5. City Region levels              from non-FSM backgrounds are nearly
          (21.4%) also continue to exceed North                  three times more likely to progress to
          West (18.9%) and National figures (18.3%).             higher education by age 19 compared to
                                                                 those from FSM backgrounds.
       • Consultations with children and young
          people suggest that children’s career                • The proportion of all City Region young
          aspirations at this age are generally positive         people Not in Education, Employment or
          and heavily influenced by strong role                  Training has improved in recent years;
          models; however aspirations then appear to             although levels remain higher than North
          dissipate during teenage years as many feel            West and England comparators.
          they do not have the opportunities to                • Family attitudes and behaviours have a
          achieve those aspirations.                             profound influence on children’s outcomes;

    7
        Liverpool City Region Multi Area Agreement (2009)

8
anecdotal information suggests that this            Anecdotal evidence suggests that this can
      relationship in some cases can have                 relate to perceptions that some jobs do
      negative impacts and can lead to a                  not pay well enough to encourage
      transmission of intergenerational                   someone out of a complex benefits
      worklessness.                                       position and into work. In addition, many
                                                          people do not claim benefits they are
                                                          entitled to as the system is extremely
                                                          difficult to navigate.
Consequences and                                        • Insufficient childcare acts as an obstacle to
Impacts of Poverty                                        many families wanting to access
                                                          employment and training opportunities.
As a result of factors such as low                        The main concerns are affordability and
educational attainment and poor health                    inflexible opening times.
and wellbeing, many individuals who                     • There is high public transport dependency
have grown up in poverty find themselves                  amongst low income families; however
trapped in circumstances that make it                     current services fail to meet travel needs.
difficult to break the poverty cycle.                     Access to employment and hospitals can
   • In May 2010, more than 104,400 residents             be particularly problematic. Issues include
      were claiming Incapacity Benefit /                  high costs, poor timetabling of buses
      Employment Support Allowance in the City            (especially for shift workers), long journey
      Region.The large majority of these                  times and unreliable services.
      claimants have been dependent on these            • Social rented homes play a key role in
      benefits for more than two years, creating a        providing affordable housing; the current
      major challenge in terms of returning to            shortage of social housing across the City
      work.                                               Region is creating problems for many
   • Around 50,500 residents were claiming Job            families with children who cannot afford or
      Seekers Allowance (JSA).There is evidence           access a mortgage.
      of a reduction in the City Region JSA
                                                     These findings are developed further in the
      claimant count which suggests that the City
                                                     forthcoming sections of this report.
      Region has been keeping pace with the
      national average in getting people off this
      benefit.
   • There were 24,510 lone parent benefit           The gap between the
      claimants in the City Region in May 2010.
      In line with national trends the proportion    City Region and the
      of LCR Lone Parent claimants has declined
      over the previous 12 months.                   national average
   • Money is tight for many families in the City    A great deal of data is available that has some
      Region whose income is below 60% of the        bearing on the current state of the City Region in
      contemporary median income. Fiscal             terms of poverty. The essential message, however,
      changes such as a rise in VAT and reduction    relates to the gap between the City Region and
      in housing benefits could intensify the        the national average. The following table
      situation. Money also costs more for the       simplifies some of the data to illustrate the
      poor; many turn to high interest shops and     percentage difference on a number of the most
      local money lenders due to lack of             critical indicators. The significant gaps in benefits
      affordable credit.                             dependency and some of the foundation years
   • The Benefit System can act as a barrier to      indicators (e.g. breast feeding and tooth decay)
      moving into employment.The inflexibility of    are notable.
      the current system creates a ‘Benefit Trap’
      that is difficult to escape.

                                                                                                             9
The percentage gap between the Liverpool City Region and national average
(England)
Drivers of
outcomes in
childhood and % Gap between
young LCR and
adulthood Indicator national average Implications
Pregnancy Teen 17.5% worse Babies of teenage mothers often experience
conceptions poorer health outcomes and suffer
developmental disadvantage
Birth Low birth weight 5.6% worse Babies of a low birth weight are most at risk of
dying young or suffering health related problems
Infant mortality 2.1% worse Children in deprived families are twice as likely
to die at birth or infancy, compared to children
in richer families
Breastfeeding 28.8% worse Breastfeeding promotes health and prevents
disease in both the short and long term, for
both infant and mother
5 years Tooth decay 37.4% worse Tooth decay levels tend to be much higher
amongst children from disadvantaged
backgrounds, making it strongly associated
with social deprivation
Obesity Primary 16.3% worse An overweight or obese child is at greater
Reception risk of developing ill-health now or in the future
Primary years Obesity Primary 16.9% worse As above
Yr 6
Secondary Attainment at 7.4% worse Success in acquiring formal qualifications
years Key Stage 4 bolsters children's self-esteem, and enhances
development of self-identity
Transition to Achievement at 18.6% worse Young people who have grown up in poverty
adulthood 19 years old start their adult life at a distinct disadvantage
in the labour market
Young people 20% worse Those who progress to higher education are
age 15 from FSM more likely to secure well paid employment
backgrounds
who progress to
HE
NEET 27.8% worse NEET is a major predictor of unemployment,
low income and poor mental health in later life
Consequences IB/ESA claimant 64.2% worse Worklessness can be transmitted through
and impacts rates generations
of poverty and
reduced life JSA claimant 51.4% worse Those in receipt of JSA are deemed to be in
chances rate ‘out of work’ poverty
Lone Parent 52.9% worse Children in lone parent households are more
claimant rates likely to be living in relative poverty conditions,
with potentially less parental support
Average 9.9% worse Those in low income households are at a
household greater risk of experiencing financial exclusion
income and debt
101. Introduction
The Liverpool City Region (LCR) Cabinet and This is an overarching City Region Child and
City Employment Strategy Board are fully Family Poverty Needs Assessment which focuses
committed to improving the life chances of primarily on shared cross boundary drivers of
children and families in poverty across the City poverty, and includes six supporting Local
Region. They identified tackling child and family Authority needs assessments that explore issues
poverty as one of their key priorities and in detail at borough and neighbourhood level.
commissioned the development of the Liverpool The key messages from the individual Local
City Region Child and Family Poverty Framework Authority assessments are provided in
to join up efforts to reduce child poverty across supplementary papers at the back of this
the City Region, both strategically and in terms of document.
delivery. An important element of the Framework
is the City Region Child and Family Poverty It is important to emphasise that the LCR Child
Needs Assessment. and Family Poverty Needs Assessment and wider
approach does not compromise or replace local
The Needs Assessment builds on the evidence policy and activity; City Region and local work
base within the LCR analysis report ‘A Brighter should complement and add value to one
Future: Working Together to Tackle Child and another.This collective approach can significantly
Family Poverty’. A Brighter Future concluded enhance opportunities to secure positive
that local districts experience common cross outcomes for children and families.
boundary issues and there is much to be gained
by working in partnership and aligning activity The City Region wide Child and Family Poverty
under a common goal. Needs Assessment is pioneering work that will:
• Ensure consistency and clarity in relation
to data analysis and methodology.
Lack of suitable and comparable data and
1.1 Purpose of the intelligence has been a significant barrier to
City Region Child developing effective approaches to tackling
child and family poverty.The LCR Needs
and Family Poverty Assessment provides a comprehensive and
common approach to measuring and
Needs Assessment monitoring poverty across the six Local
Authority areas.
Child and family poverty is a complex and
multifaceted issue.To tackle the problem we need • Determine clear priorities for local and
to have a clear understanding of the extent and City Region Child and Family Poverty
nature of needs.This requires an in depth analysis Strategies and provide the foundations for
of robust data and research.The City Region strategic investment.
Child and Family Poverty Needs Assessment • Develop a common understanding of
draws heavily on both quantitative and qualitative cross boundary challenges and
intelligence from the six local authority areas to opportunities for joint work.
provide a comprehensive picture of poverty These shared challenges will be the focus
across the City Region. of the City Region Child Poverty and Life
11Chances Strategy. In some cases our
response to common issues may take the
1.2 Why we need a
form of City Region wide programmes; in City Region Needs
others, issues may be best addressed
through locally developed and delivered Assessment
initiatives - here the LCR approach will add To coincide with the functional
value by facilitating the sharing of best economic area
practice.
Child and family poverty is symptomatic of many
• Highlight the wide ranging impacts of factors that link to labour market dynamics.
poverty on future outcomes through Given that the LCR is a functional economic area,
application of the ‘The Drivers of Life it would have proved extremely difficult for local
Chances Model’8. This approach areas to produce cogent needs assessments for
emphasises the commitment required to their district in isolation. A City Region wide
tackle child and family poverty from a wide assessment therefore provides the most realistic
spectrum of partners, including those basis for making progress in tackling poverty.
providing early years, health, employment
and skills, financial inclusion, housing, To support our collective long-term
regeneration, cultural and transport objectives
services. Partners have signed up to the long-term vision
• Provide details of national policy to “establish our status as a thriving
initiatives and fiscal changes that will international City Region by 2030”. City region
impact on children and families in poverty partners recognise that failure to break the
and will need to be considered when intergenerational transmission of poverty will
developing interventions at a local and City mean that many children growing up in poverty
today will become the parents of poverty
Region level.
tomorrow, undermining our long-term objectives.
• Provide an essential tool for the Liverpool
City Region Child Poverty and Life To optimise use of resources
Chances Commission. The Commission As well as ensuring a consistent approach to
will draw on the Needs Assessment to set measuring and assessing the level of need across
its priorities and work programme. the City Region, a centrally coordinated needs
assessment provides efficiencies and good value
Appendix 1 illustrates the relationship between
for money.There may be further opportunities
the local and City Region Child and Family
to optimise the use of resources through the
Poverty Needs Assessment with other relevant LCR Child Poverty and Life Chances Strategy.
local, City Region and National strategies. This strategy will provide a framework for the
co-commissioning of City Region wide and child
and family poverty programmes.
To share excellent and innovative
practice
Across the City Region, local areas have
developed innovative and effective practices to
tackle child and family poverty. Close working
through both the LCR Needs Assessment and
the City Region Child Poverty and Life Chances
Strategy will help to facilitate the sharing of
evaluated good practice between areas.
8
Field F,The Foundation Years: Preventing Poor Children Becoming Poor Adults (2010)
122. Why Child and Family Poverty
Matters
The impact of growing up in poverty goes much
Notable numbers
deeper than just income deprivation. It is
• Children growing up in poverty are 37 times
important that policy makers, practitioners and more likely to die as a result of exposure to
commissioners across the City Region have a smoke, fire and flames9
clear understanding of the long lasting and wide • Children in disadvantaged families are
reaching affects that poverty can have on life 3 times more likely to suffer mental
chances. Children growing up in poverty are health disorders10
deprived of a fair start in life. Evidence shows that • Children in poverty are twice as likely to be
a child from a poor family is: homeless or trapped in bad housing11
• More likely to experience unsafe • Nearly one in five girls and more than one in
environments four boys in receipt of free school meals (a key
• More likely to suffer social isolation poverty indicator) leave school without at least
five GCSEs12
• More likely to experience a wide range of
• More than a quarter of all child pedestrian
health inequalities accidents happen in the most deprived
• More likely to suffer from poverty of 10 per cent of wards13
aspiration
• Less likely to achieve their academic
The economic costs of allowing the
potential
intergenerational cycle of poverty to continue
• Less likely to gain access to the services are immense. An in-depth study by the
designed to meet their needs. Joseph Rowntree Foundation14 cautiously
These early inequalities often continue into later estimates that child poverty costs the public
life and limit children’s ability to achieve economic sector between £12 billion and £22 billion a year.
wellbeing and escape poverty. These estimates relate to government spending
that deals with the immediate fallout of child
The intergenerational cycle of poverty is not just poverty, including expenditure by social services,
damaging to the lives of children and families, it is school education, police and the criminal justice.
detrimental to society as a whole. It undermines
our wider efforts to achieve sustainable and However, child poverty also has long-term
cohesive communities through our key economic costs to society. Children who grow up
partnership strategies. in poverty are less likely to work as adults and
often receive relatively low earnings if they do.
The annual cost of below-average employment
rates and earnings levels among adults who grew
up in poverty is about £13 billion, of which
£5 billion represents extra benefit payments and
lower tax revenues; the remaining £8 billion is
lost earnings to individuals, affecting gross
domestic product.
9
Edwards et al, Deaths from Injury in Children and Employment Status in Family Analysis in Class Specific Death Rates, British
Medical Journal (2006)
10
Hirsch D and Spencer N, Unhealthy Lives: Intergenerational Links Between Child Poverty and Poor Health in the UK. End Child
Poverty Now Policy Briefing (2008)
11
Shelter, Child Poverty and Housing Briefing (2006)
12
Hirsch, D. Chicken and Egg: child poverty and educational inequalities. CPAG policy briefing (September 2007)
13
Grayling et al, Streets Ahead: Safe and Liveable Streets for Children, IPPR (2002)
14
Hirsh D. Estimating the cost of Child Poverty, JRF (2008) 13Whilst calculations of this nature cannot be exact, The following diagram tries to capture some of
the estimates serve to highlight the growing the main drivers of poverty, and illustrate how
urgency to address child and family poverty these operate in a cycle that can lead to cross-
collectively and particularly given the increasing generational poverty. It is not inevitable that
pressures on public finances. disadvantage in foundation years will lead to
lower income or less wellbeing in later life, but it
is more likely.
An illustration of the drivers of the cross-generational cycle of child and family poverty
143. Background
• Cooperation to reduce Child Poverty -
3.1 Policy Context Promotes cooperation between local
The requirement for Local Authorities to partners with a view to mitigating the
produce a child poverty needs assessment was effects of child poverty. Local Authorities
introduced by the Child Poverty Act (2010). can provide staff, goods, services,
City Region partners took the decision to accommodation or other resources, or the
broaden the assessment to cover ‘child and family’ creation of a pooled fund amongst
poverty in acknowledgment that poverty impacts partners, to ensure the requirements of the
on entire families. act are met.
• Sustainable Community Strategy -
The Act also requires responsible local
authorities to take their responsibilities to
Child Poverty Act tackle child poverty into account when
The Child Poverty Act received Royal Assent on preparing or revising their Sustainable
the 25 March 2010.This was a landmark occasion Community Strategy.
for the child poverty agenda as it enshrined in
These actions led by local authorities will
law the Government’s commitment to
contribute towards four challenging national child
eradicating child poverty by 2020.
poverty targets.
The Act also has important implications for the
way in which Local Authorities are required to
Targets outlined in the
address child poverty.
Child Poverty Act
Main requirements of the Act for By 2020:
Local Authorities • Reduce to less than 10% the proportion of
children living in relative low income.
Part 2 of the Act places a number of duties on
(Low income households have less than
Local Authorities and other local delivery 60% the median household income.)
partners to work together to tackle child poverty,
• Reduce to less than 5% the proportion of
specific duties include: families living in combined low income and
• Local Child Poverty Needs Assessment - material deprivation. (This is a wider measure
Local Authorities must make arrangements of people’s living standards.)
to prepare, publish and keep under review • Reduce to less than 5% the proportion of
a local child poverty needs assessment. children who live in absolute low income.
• Joint Child Poverty Strategy - Local joint (This target measures the income of families
child poverty strategies must be developed against a level held constant over time.)
to set out the measures partners propose • Reduce the proportion of children that
to take for the purpose of reducing and experience poverty for long periods of time
mitigating the effects of child poverty. (persistent poverty).The target will be set by
secondary legislation when the required data
will be available (expected before 2015).
15two parts.The findings from the first part were
3.2 The Coalition published in January 2011.The core message
Government’s Approach from the Interim Report is that Early Intervention
is an approach that offers real opportunities to
to Child and Family make cost-effective and long lasting
improvements. However the provision of
Poverty successful evidence-based Early Intervention
Crucially, the Child Poverty Act and the programmes remains persistently patchy.
commitment to ending child poverty by 2020 has Social Mobility Review - Unlocking social
secured cross-party support. Since coming into mobility is at the top of the Government’s agenda
power, the Conservative - Liberal Democrat and will be a key feature of their strategy to
Coalition has pledged to maintain the 2020 goal eradicate child poverty.The Deputy Prime
and retain the Part 2 duties for local authorities. Minister personally champions social mobility
However the Coalition Government will not within Government and chairs a Ministerial
issue formal statutory guidance on Part 2 of the Group to drive action and lead work on a
Act or lay regulations for local child poverty cross-government strategy for improving social
needs assessments.This means local areas have mobility. Alan Milburn has been appointed
more flexibility to decide how best to respond to as the Independent Reviewer on social
the Child Poverty Act based on local strengths mobility to provide independent challenge and
and priorities. review progress.
The Coalition Government’s approach to tackling Review of the Early Years Foundation Stage
child and family poverty is still emerging, and will Framework - Dame Clare Tickell is leading a
be informed by a series of independent reviews: review on how early years settings can support
Review of Poverty and Life Chances - learning, development and welfare and help to
Labour MP for Birkenhead, Frank Field was give all children the best start in life. Interim
commissioned to lead an independent review of advice will be provided prior to the final report
poverty.The review ended in December 2010 being released in spring 2011.
and concluded that the UK needs to address
poverty in a fundamentally different way to make
a real change to children’s life chances as adults. National Child Poverty
There are two overarching recommendations: Strategy
• A Life Chances Index be developed to
measure equality in life outcomes for all As set out by the Child Poverty Act, the
children. Government will publish the first National Child
• ‘Foundation Years’ be established covering Poverty Strategy by March 2011.The strategy will
the period from womb to five as the first form the Government’s response to the findings
pillar of a tripartite education system: the of the aforementioned independent reviews and
Foundation Years leading to school years set out detailed plans for addressing the range of
leading to further, higher and continuing factors that cause poverty.
education. The National Child Poverty Commission
The Liverpool City Region has secured strong The Child Poverty Act commits the Government
links with the independent review, as Frank Field to establishing a National Child Poverty
has been confirmed as the Chair of the Commission to provide expert advice on child
Liverpool City Region Child Poverty and Life poverty strategies. An immediate action of the
Chances Commission (refer to Section 7 for Liverpool City Region Child Poverty and Life
further details). Chances Commission will be to establish links
Review on Early Intervention - Graham Allen with the National Commission to help ensure
was appointed by the Coalition Government last that the City Region’s voice is heard by central
July to lead an Independent Review of Early government, MPs and other key stakeholders.
Intervention.The Review has been undertaken in
16Wider Policy Context These reforms, combined with the economic
downturn, means that out of work parents will
The Government has made clear that its central need strong support systems to find and secure
priority is to reduce the deficit and restore sustainable ‘family friendly’ employment.
economic growth. Given the emphasis on the
economic aspects of poverty, any fiscal tightening Impact of Housing Benefit Reductions
and state reforms will inevitably have implications Major reforms to housing benefit were
for children and families in low income announced in the Emergency Budget (June 2010)
households.This section outlines significant policy which will affect the entitlements of tenants in
announcements that could impact on the needs social and private sector accommodation.The
of those in poverty. headline changes include:
Welfare to Work Reforms • Local Housing Allowance will be capped at
£250 for a one-bedroom property and
The welfare system is undergoing radical reforms £400 for a home of four or more
to ensure that it pays to be in work. Key bedrooms.The cap will apply to new
elements of this approach include increasing the customers from April 2011, however the
conditionality of out of work benefits and cap has been delayed for existing
improving the incentives to work. customers until January 2012 to provide
• Increase in benefit conditionality - In tenants with more time to negotiate a
summary, those who can work have the cheaper rent or find a new home. Local
responsibility to equip themselves to find Authorities have also been given
employment.Those who refuse to join a discretionary powers to make housing
return to work programme will lose the benefit payments to private landlords in
right to claim out of work benefits until return for reducing their rents (however
they do and people who refuse to accept this is only likely to be a temporary
reasonable job offers could lose the right measure);
to claim out of work benefits for three • Non-dependents deductions are to be
years. increased (April 2011);
The reforms also involve significant changes • The Consumer Price Index will be used
to the financial support received by lone rather than the higher Retail Price Index to
parents. For example, as of October 2012 calculate housing benefit up-rating.This
lone parents with children aged 5 and over means benefit increases will lag behind the
will no longer be entitled to income higher measure of inflation (April 2011);
support, if they are claiming this benefit
• Social housing tenants who are deemed to
solely because they are a lone parent.
be occupying a property too large for their
• Incentives to work - In October 2010 the needs will have their benefit reduced (April
national minimum wage rose from £5.80 to 2013).
£5.93. People aged 21 now also benefit
from the top rate (which was previously These reductions will have significant implications
only compulsory for workers aged 22 or for unemployed and low paid working parents
over) and there have also been who depend on housing benefit to pay their rent.
corresponding increases for younger Some concerns have been raised that these
workers. The Government has also reforms could potentially result in an increase in
announced a single universal credit system the number of households with rent arrears.
which will replace all other out of work and
in work benefits. A single means test will be
applied which intends to ensure that
everyone will be financially better off in
employment.The change will be phased in
over two Parliaments.
17Comprehensive Spending Review 3.3 Liverpool City
The Comprehensive Spending review
(October 2010) contained an outline of the
Region’s Approach to
Coalition Government’s Spending Plans to Tackling Child and
2014/15.The announcements made by the
Coalition Government include changes to the Family Poverty
provision of welfare benefits and services
which support low income families. The Liverpool Child and Family Poverty
Important announcements that have implications Framework is the key mechanism for joining up
for children and families in poverty include: work across the city region and improving the life
• Sure Start services will be protected in chances of children and families in poverty.
cash terms.The service will be refocused LCR Cabinet commissioned the framework in
on improving the life chances of recognition that much of existing child and
disadvantaged children and extending 15 family provision across the City Region is being
hours a week of early years education and delivered in a fragmented and isolated way.
care to all disadvantaged two year olds The Framework is the first step towards
from 2012-13. developing the coordinated approach needed.
• A capping system will be established to
ensure that no workless family will receive
more in welfare benefits than the take Key elements of the City
home pay of the average working Region Child and Family
household.
• From 2011-2012 the percentage of
Poverty Framework
childcare costs that low income families can A Brighter Future: Working Together to
claim through the childcare element of the Tackle Child and Family Poverty
working tax credit will be reduced from
80% to 70%. The analysis report ‘A Brighter Future’ (July 2010)
• The Education Maintenance Allowance will provides an excellent baseline of child and family
be refocused to the most deprived areas. poverty levels across City Region.The report
solidifies the need for a City Region approach and
The review also set out plans to reduce Local has helped to secure support from a broad range
Government funding by 28% which will affect the of partners.The Child and Family Poverty Needs
services provided by Councils to support Assessment builds on the initial evidence base
residents. However, the full implications of complied by this report.
spending cuts on service provision will only be
known from early 2011, after the Local Data Project
Government Finance Settlement has been
released and local authorities have completed One of the major barriers to addressing poverty
budget setting exercises. and improving life chances has been the lack of
suitable and comparable data and intelligence.
According to the Government the spending Given the scale and robustness of data required
review will have no measureable impact on to produce the needs assessment, a City Region
progress towards meeting its child poverty Child Poverty and Life Chances Data Group was
targets over the next two years. However, analysis convened to work closely with Mott Macdonald
by the Institute of Fiscal Studies, suggests that through the Merseyside Information Services
families with children will be hit hardest by the data contract.The data group includes
various cuts. representatives from all six local authorities to
Against this changing policy background and help ensure that a complete picture of poverty
tightening fiscal environment it makes sense that across the City Region local authority areas is
we build on our strong local and City Region established.The data and analysis produced by
partnerships and join together to address the this group has culminated in this LCR Child and
child and family poverty agenda. Family Poverty Needs Assessment.
18Child Poverty and
Life Chances Commission
A City Region Child Poverty and Life Chances
Commission has been established to formalise
the LCR’s high level commitment to tackling
poverty and act as the driving force behind the
City Region’s approach. Frank Field, Labour MP
for Birkenhead and Chair of the Independent
Review of Poverty and Life Chances leads the
Commission. It is a recommendation of the
independent review that other areas adopt the
approach pioneered by the City Region and
establish a poverty and life chances commission
for their own locality.
Child Poverty and
Life Chances Advisory Group
This small cross-cutting group of officers supports
the LCR Child Poverty and Life Chances
Commission and makes recommendations for
their approval.
City Region Child Poverty and
Life Chances Strategy
The City Region’s first Child Poverty and Life
Chances Strategy will flow from this needs
assessment. Its primary focus will be to improve
life chances for children by addressing the cross
boundary drivers of poverty identified in this
document. It is of utmost importance that the
strategy adds values to local activity.To avoid
potential conflict or duplication the Strategy will
be developed alongside local child poverty
strategies. In some cases the response to
common issues may take the form of City Region
wide programmes, whilst in others, locally
developed and delivered initiatives may prove
most effective - here the City Region Strategy will
enhance outcomes by facilitating the sharing of
best practice.
Joint Working on Employment
and Skills
Tackling child and family poverty is an objective of
the LCR Employment and Skills Strategy, primarily
through tackling worklessness and enhancing skills
in the most deprived communities.The City
Employment Strategy Continuum Model for
employment and skills provides the basis for both
worklessness and in work interventions.
19Key elements of the model are: • A route way of personalised assistance to
• A demand led approach which engages individuals from worklessness to
employers employment
• Delivery of recruitment and training • Integration with neighbourhood and
services which meet the needs of housing renewal.
employers and provide progression across Through the development of the local and City
the full qualifications spectrum from Level 1 Region child and family poverty strategies there is
through to Level 4 scope to build on this continuum model to
• Ensuring a good quality information, advice address any unmet parental employment and
and guidance service is integrated within skills needs identified by the LCR assessment.
each stage of the journey
204. Local context
Generally, parental employment is seen as the
Population and Family Characteristics
best route out of income poverty. Not only does
being in sustainable and well paid employment • Almost half (49.0%) of LCR families have just
provide families with the financial means to move one child.This is higher than the regional
(47.9%) and national (46.1%) comparator16.
out of poverty, it can also contribute towards
• Overall, the LCR has a smaller percentage of
positive health and improve confidence and self larger family sizes than seen regionally and
esteem. This section therefore provides an nationally17.
overview of the employment and skills market • The proportion of the LCR population aged
that parents in the LCR must navigate and under 16 is 20.7%.This is comparable to
considers economic forecasts for the region. regional (20.7%) and national (20.2%) figures.
There are, of course, further determinants of • However the region has a slightly lower
children’s outcomes and life chances; such as early percentage of working age residents and slightly
higher percentage of those of retirement age.
year’s development, maternal health and This trend is projected to continue18.
educational achievement.These areas are • 93.4% of LCR residents are ‘White British’.
explored in detail in section 6 - ‘What Does Child This is markedly higher than the national
and Family Poverty look like in the City Region’. comparator at 83.6%. All LCR districts have
comparable figures, with the exception of
Liverpool where the figure here is closer to the
national average at 88.2%19.
4.1 Introduction to the Economic activity is widely spread across the
Liverpool City Region City Region:
• Liverpool as the commercial, cultural and
The Liverpool City Region is home to 1.5 million transport hub and a world-class city for
people, which includes around 327,000 children business and knowledge;
in 191,000 families15. • Sefton as the base of the primary port at
The City Region comprises the boroughs of Seaforth and the classic tourist resort of
Halton, Knowsley, Sefton, St. Helens,Wirral and Southport;
the City of Liverpool.Together these districts • Halton has chemicals and the science and
make up a functional economic area with technology base of Daresbury, together
approximately 90% of all residents both living and with a significant logistics and distribution
working in the City Region; this is one of the base for the City Region at the Mersey
most contained employment markets in the Multimodal Gateway;
country20. The region is also closely related • Knowsley, St. Helens and Wirral provide key
economically to the surrounding areas of business locations for advanced
Warrington, Cheshire West and Chester, manufacturing and logistics for the City
Ellesmere Port, North East Wales and Cheshire Region.
and Lancashire.
15
Figures are based on child benefit claimant data.This source provides a good indication of total number of families and children,
as estimates suggest that 98% of all families take up the benefit
16
HMRC, Child Benefit Geographical Statistics August 2009
17
HMRC, Child Benefit Geographical Statistics August 2009
18
ONS, Mid-2009 population estimates
19
ONS Population Estimates by ethnic group (2007 Experimental Figures)
20
LCR Employment and Skills Strategy and Commissioning Framework 21The Liverpool City Region has enjoyed economic 1. Gross Value Added per capita has fallen
successes in the last 5 years. For example, the back a little as the deteriorating
value of the City Region economy is growing at a employment rate has cancelled out
faster rate of growth than the rest of the North gains in productivity.
West.The employment rate, number of self
employed people and business base also LCR’s employment rate is only around 90% of
increased over this period. However despite the England average. This is reflected in
achieving an absolute improvement on many comparatively high levels of people claiming ‘out
economic indicators, the City Region’s of work’ benefits (19.8% in LCR compared with
performance is more mixed relative to the rest 12.7% nationally)21.
of England.
Notable numbers
• The LCR average employment rate is 65%.
Notable numbers This lags behind the North West (67.8%) and
If the City Region reflected the England average it national (70.3%) rate22.
would have: • The proportion of LCR IB/ESA claimants has
• 46,000 less people without any qualifications. been declining steadily over recent years
(currently 11.0%), but levels still remain
• 26,400 more people with a level 2 qualification
significantly higher than the national average
(equivalent to 5 GCSEs). of 6.7%23.
• 43,800 more people with a level 4 qualification • The LCR JSA claimant level is 5.3% of the
(equivalent to a Degree). working age population compared to 3.5%
• In addition if LCR met the previous nationally24.
Government’s aspirational 80% employment
rate target it would need to move an 2. The jobs base has declined slightly
additional 115,000 more people into work. relative to the English benchmark, but
within this there have been significant
LCR partners acknowledge that a step change is improvements in the stock of businesses
needed in the City Region’s employment and and in business starts across LCR.
skills system for the long-term benefit of families,
communities and employers. A healthy business and employment base is vital
for tackling income poverty. However the jobs
base for LCR requires significant growth to match
the English average.The gap with England is now
4.2 Economic over 10% which equates to a deficit of around
60,000 jobs (taking account of population
Opportunities levels)25. A competitive labour market can
and Challenges marginalise men and women who are least able
to retain a foothold in employment, for example
The Liverpool City Region Employment and Skills the poorly qualified and those with poor health.
Strategy (2010) identifies five key challenges and More positively, the gap has closed significantly for
opportunities for the City Region economy and business starts and the business stock as a whole.
Labour market.These areas will be considered Nonetheless, the LCR still has a business stock
when developing the City Region Child Poverty which is roughly only 60% of the English average.
and Life Chances Strategy.
21
NOMIS, DWP Benefits (working age client group). Based on a four quarterly rolling average of out of work benefits (May 2010)
22
Annual Population Survey (April 2009 - March 2010)
23
NOMIS, DWP Benefits (working age client group) (May 2010)
24
NOMIS, JSA Claimant Count (September 2010)
25
LCR Employment and Skills Strategy and Commissioning Framework (2010)
22poverty, low skills can act as a major barrier to
Notable numbers
progressing in the work place and securing well
• The City of Liverpool provides significant paid employment.
employment opportunities for the wider
region.The total volume of jobs accounts for
38% of the LCR’s jobs base26.
Notable numbers
• 16.5% of the LCR working age population
• With the exception of Liverpool, job density in have no qualifications; this is around 4% points
all LCR local authorities is below national levels higher than the national comparator (12.1%)30.
(0.79). Job density ranges from 0.58 in Wirral • Around 46% of LCR pupils achieved 5 A*-C
to 0.84 in Liverpool27. grades (or equivalent) including Maths and
English in 2008/09.This is an improvement on
attainment levels for the previous year;
3. Good progress has been made on a however a long lasting gap still remains with
number of worklessness indicators the rest of England (49.8%)31.
although there remain issues with the
number of young people Not in 5. The gap has narrowed in terms of
Employment, Education or Training (NEET), neighbourhood deprivation, but there is
and economic inactivity across the adult still a very long way to go.
working age population.
Concentrations of economic and social
9.2% of LCR young people are classed as NEET deprivation are widespread across the City
compared to 7.2% nationally28. Levels of NEET Region. Based on ACORN classifications32, one in
are particularly high amongst those who are from three City Region households can be classed as
a workless household.This is an important ‘Hard Pressed’. Families within this cohort
indicator to monitor, as school leavers who are experience some of the most difficult social and
not in education or training are no longer economic conditions in the country, and appear
developing their skills and thus are more likely to have limited opportunity to improve their
to suffer from low pay at work both now and in circumstances.There are particularly high
the future. concentrations of ‘hard pressed’ families in
Knowsley and Liverpool.
Notable numbers
Notable numbers
• LCR NEET figures peak in Knowsley at 12.2%28.
• 32.8% of City Region households are ‘hard
• Unemployment is also an issue amongst young
pressed’.
adults.The majority of JSA Claimants in LCR
(36.4%) are aged between 20-2929. • Knowsley and Liverpool have the highest
percentage of postcodes classed as
hard-pressed (51% and 41% respectively)32.
4. There has been a significant and
comprehensive improvement in
qualification levels. This is a major
4.3 Looking to the future
achievement in a short time frame in an
area where the LCR has long lagged the
Economic Forecasts
rest of the country. Based on evidence from a range of economic
forecasts, the aggregate position on jobs for the
Qualification levels are improving due to City Region is bleak, certainly for the 5 years
increases feeding in from improved attainment at ahead.The scenarios to 2030 are generally more
secondary school and significant additional public optimistic. One of the most recent, forward
investment in adult skills development. However, looking studies for the City Region by PION
much work is still needed to reach the national Economics and Cambridge Economics
average. For many parents experiencing ‘in-work’ (December 2009) forecasts:
26
LCR Employment and Skills Commissioning Framework (2010)
27
ONS Job Density (2008)
28
Connexions Merseyside (Figures represent an average across August-October 2010)
29
NOMIS, JSA Claimant Count Age and Duration (October 2010)
30
Annual Population Survey (2009)
31
DFES (2008/09
32 23
ACORN is a classification tool that provides categorised and detailed demographic data at small neighbourhood, postcode and household level• Annual Net Job losses may continue until Given the high proportion of people (particularly
2012 women) with parental responsibilities who work
• It will not be before 2015 that employment in the public sector, these reductions could be
in LCR regains pre-recession levels severely detrimental to our overall efforts to
• Considering four scenarios (‘Extended reduce child and family poverty.The public sector
Recession’,‘Moderate Recovery’, has also led the way in terms of family friendly
‘Aspirational’ and Development Pipeline’) policies and work practices. Many parents made
through to 2030 they all show significant redundant could face the additional challenge of
jobs growth with a range of increases not only securing employment that matches their
between 45,000 and 87,000 jobs skills and work aspirations, but also fits around
their family and caring responsibilities.
• No expected advance in productivity is
projected for the LCR
However, as with all financial forecasts and Resilience: Experian
projections, this analysis must be viewed with
caution - especially as the study was conducted
Economic Resilience Index
before the full extent of the public sector Experian recently created an index in order to
spending cuts was know.The findings are viewed rank districts in terms of their resilience.
by many as relatively optimistic in projecting a Resilience is a concept used to describe the
recovery of employment levels for the City ability of an area to withstand and respond to
Region by 2015. shocks in the external environment such as public
Threat to Public Sector sector cuts and business losses.
One of the most pressing issues for the City The factors that underpin regional resilience are
Region that could have an impact on child and based on 4 broad themes:
family poverty rates is the impact of pending • Business
public sector spending cuts and inevitable • Community
redundancies.The public sector is a major • People
employer in the City Region, accounting for
• Place
around 200,000 jobs. Approximately 35% of
LCR’s jobs are in public administration, education The table below is an extract from a larger one
or health, which is markedly higher than the that ranks the 324 lower tier local authorities by
wider economic hinterland’s 24%. their overall economic resilience.The extract has
been selected to show only districts within the
On a National scale, the Office for Budget
North West, and the portion of the table that
Responsibility forecast that 490,000 public sector
includes all of the LCR districts.
jobs will go by 2015 as a result of the public
sector spending reductions.The scale of job The higher the rank, the less resilient a district is.
losses in LCR will become clearer in early 2011 The table is presented in descending order with
when local spending settlements and budget the least resilient at the top. The cells in the table
setting exercises are completed. Local Futures are colour-coded to highlight national quartiles.
forecasts (July 2010), as cited in a recent paper by The table demonstrates that all of the LCR
MIS on the implications of Public Sector Cuts33, districts are in the worst quartile for overall
pinpoints Sefton, Liverpool and Wirral as being resilience.
amongst the most vulnerable local areas in terms
of predicted public sector job losses by 2016.This
is largely due to the high proportion of public
sector jobs in these areas.
33
Implications of Public Sector Spending Cuts MIS Briefing Paper 1 (December 2010)
24You can also read