G reater Hollister Area Draft Storm ater Resource Plan
←
→
Page content transcription
If your browser does not render page correctly, please read the page content below
Gr e a te r Hol l i s t e r A r e a
D raf t S torm < a te r
Re so u r c e P l a n
/ ̅˼̉ ˂ˀ ˂ ˁ

                                       Prepared by
                                                     612 CLARION COURT
                                                     SAN LUIS OBISPO
                                                     CALIFORNIA 93401
                                                     T 805 544-4011
                                                     F 805 544-4294
                                                     www.wallacegroup.us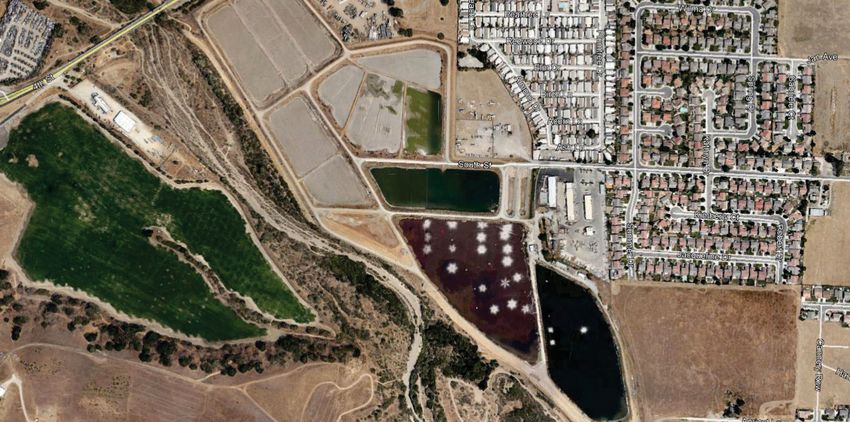
ACKNOWLEDGEMENTS
The Greater Hollister Area SWRP is prepared by Wallace Group on behalf of the City of Hollister, with
considerable contributions and input made by the Pajaro River Watershed Flood Prevention Authority. Wallace
Group gratefully acknowledges the City of Hollister, County of San Benito, and Pajaro River Flood Prevention
Authority for their efforts, involvement, and assistance in preparing the Greater Hollister Area SWRP:

City of Hollister
        Brett Miller, City Manager
        Michael Grzan, M.P.A., Environmental Programs Manager

County of San Benito
      Benny Young, Resource Management Agency Director
      Michael Chambless, Assistant Resource Management Agency Director

Pajaro River Watershed Flood Prevention Authority
       Lidia Gutierrez, Gutierrez Consultants, Inc.
       Mark Strudley, Santa Cruz County Flood Control and Water Conservation District, Zone 7

The Greater Hollister Area SWRP was completed with the efforts of many team members. They include:

Wallace Group
       Kari Wagner, P.E., Principal/Director of Water Resources
       Valerie Huff, P.E., Senior Civil Engineer
       Andrea Kingsbury, P.E., Civil Engineer
       Nate Whitacre, P.E, Civil Engineer

CERTIFICATION
In accordance with the provisions of Section 6735 of the Business and Professions Code of the State of
California, this report was prepared by or under the direction of the following Civil Engineer, licensed in the
State of California:

        ENGINEER IN RESPONSIBLE CHARGE:

         DRAFT FOR REVIEW
        Kari Wagner, PE C66026 Expiration: 6/30/2022                        Date
Table of Contents
CHAPTER 1 INTRODUCTION .............................................................................................................................................. 1-1
      Legislative Background ...................................................................................................................................................... 1-1
      Purpose of Plan .................................................................................................................................................................. 1-1
      Organization of the SWRP ................................................................................................................................................. 1-1
CHAPTER 2 WATERSHED IDENTIFICATION ........................................................................................................................ 2-1
      Pajaro River Watershed ..................................................................................................................................................... 2-1
      SWRP Boundary ................................................................................................................................................................. 2-1
      Land Use .......................................................................................................................................................................... 2-3
      Water Quality Priorities ..................................................................................................................................................... 2-3
      Surface Water .................................................................................................................................................................... 2-5
      Potable Water Treatment and Supply ............................................................................................................................... 2-6
      Wastewater Treatment ..................................................................................................................................................... 2-7
      Groundwater ..................................................................................................................................................................... 2-9
      Flood Management ......................................................................................................................................................... 2-10
      Natural Watershed Processes .......................................................................................................................................... 2-12
CHAPTER 3 WATER QUALITY COMPLIANCE ....................................................................................................................... 3-1
      Contributors to Storm Water Pollution .............................................................................................................................. 3-1
      Regulatory Plans and Permits ............................................................................................................................................ 3-1
CHAPTER 4 ORGANIZATION, COORDINATION, COLLABORATION ...................................................................................... 4-1
      Regional Water Management Group ................................................................................................................................ 4-1
      Local Agency and Organization Collaboration................................................................................................................... 4-1
      Public Engagement and Community Participation ............................................................................................................ 4-2
      Existing Planning Documents............................................................................................................................................. 4-2
CHAPTER 5 IDENTIFICATION & PRIORITIZATION OF PROJECTS .......................................................................................... 5-1
      Quantitative Benefit Methods ........................................................................................................................................... 5-1
      Benefit Metrics................................................................................................................................................................... 5-2
      Multiple Benefits ................................................................................................................................................................ 5-3
      Proposed SWRP Projects, Programs, and Opportunities ................................................................................................... 5-4
      Prioritization of Projects .................................................................................................................................................. 5-20
CHAPTER 6 IMPLEMENTATION STRATEGY AND SCHEDULE ............................................................................................... 6-1
      Funding Resources ............................................................................................................................................................. 6-1
      Plan Implementation ......................................................................................................................................................... 6-1
      Project Implementation ..................................................................................................................................................... 6-1
      Community Participation Strategy .................................................................................................................................... 6-2
      Implementation Performance Measures ........................................................................................................................... 6-2
CHAPTER 7 EDUCATION, OUTREACH, PUBLIC PARTICIPATION .......................................................................................... 7-1
      Storm Water Public Outreach ............................................................................................................................................ 7-1
      Community Participation in Plan Development ................................................................................................................. 7-1
      Engagement in Project Design and Implementation ......................................................................................................... 7-1
CHAPTER 8 REFERENCES ................................................................................................................................................... 8-1

                                                                                                                                                                                   Page i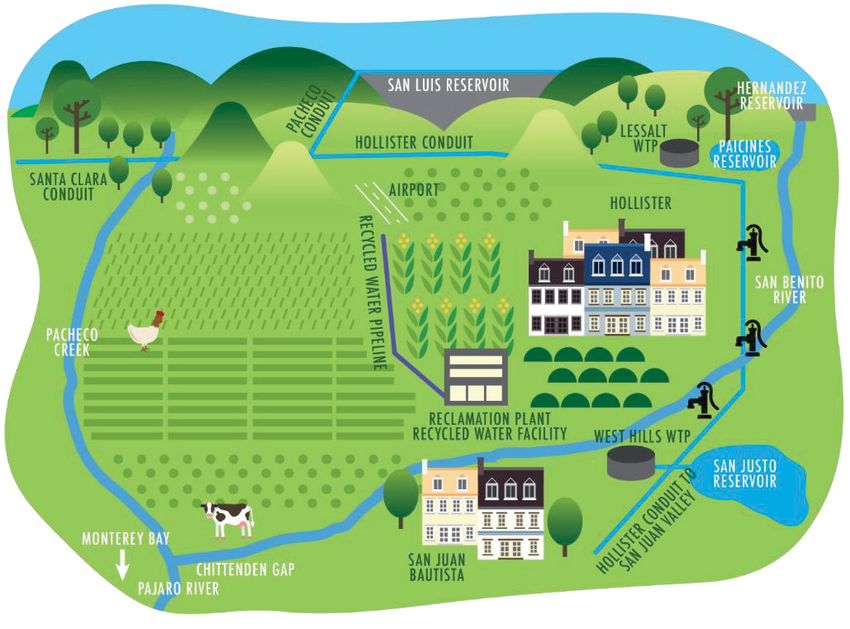
APPENDICES

Appendix A – Self-Certification Checklist (to be added in Final Report) ................................................................ A-1
Appendix B – North San Benito Storm Water Programs & Opportunities GSP Support Memorandum ............... B-1

                                                                                                                                   Page ii
List of Tables
Table 2-1 TMDLs ....................................................................................................................................................................... 2-3
Table 2-2 IWTP Water Balance Summary ................................................................................................................................. 2-8
Table 3-1 303(d) Impaired Water Bodies .................................................................................................................................. 3-2
Table 3-2 TMDLs for San Benito River and Santa Ana Creek .................................................................................................... 3-4
Table 3-3 PEAIP Outcome Levels .............................................................................................................................................. 3-6
Table 3-4 City of Hollister Pollutant Loadings ........................................................................................................................... 3-8
Table 4-1 SWRP Development Feedback .................................................................................................................................. 4-2
Table 5-1 Quantitative Metrics Summary ............................................................................................................................... 5-20
Table 5-2 SWRP Project Prioritization Table ........................................................................................................................... 5-21
Table 7-1 City of Hollister Council Meetings ............................................................................................................................. 7-2

                                                                       List of Figures
Figure 2-1 Pajaro River Watershed ......................................................................................................................................... 2-14
Figure 2-2 CalWater and USGS Designations .......................................................................................................................... 2-15
Figure 2-3 SWRP Boundary ..................................................................................................................................................... 2-16
Figure 2-4 SWRP Sub-Watersheds .......................................................................................................................................... 2-17
Figure 2-5 Santa Cruz County and South Santa Clara County SWRP ...................................................................................... 2-18
Figure 2-6 Hollister Land Use .................................................................................................................................................. 2-19
Figure 2-7 San Juan Bautista Land Use ................................................................................................................................... 2-20
Figure 2-8 San Benito County Zoning...................................................................................................................................... 2-21
Figure 2-9 Water Service Area ................................................................................................................................................ 2-22
Figure 2-10 San Benito County’s Water System ....................................................................................................................... 2-7
Figure 2-11 Wastewater Service Area .................................................................................................................................... 2-23
Figure 2-12 North San Benito Groundwater Basin ................................................................................................................. 2-24
Figure 2-13 FEMA Flood Map ................................................................................................................................................. 2-25
Figure 2-14 Natural Watershed Processes ............................................................................................................................. 2-26
Figure 3-1 MS4 Boundary ......................................................................................................................................................... 3-9
Figure 3-2 Opportunities for Particulate Load Reduction ....................................................................................................... 3-10
Figure 3-3 Opportunities for Stormwater Volume Reduction ................................................................................................ 3-10
Figure 5-1 Disadvantaged Communities ................................................................................................................................. 5-22
Figure 5-2 City of Hollister Project Locations .......................................................................................................................... 5-23
Figure 5-3 IWTP Pond Upgrades and Diversions .................................................................................................................... 5-24
Figure 5-4 Nash Road .............................................................................................................................................................. 5-25
Figure 5-5 San Benito Road ..................................................................................................................................................... 5-26
Figure 5-6 Bridge Road............................................................................................................................................................ 5-27
Figure 5-7 Soap Lake Floodplain Conservation Easements .................................................................................................... 5-28
Figure 5-8 Pacheco Reservoir Expansion Project .................................................................................................................... 5-29
Figure 5-9 Trash Capture Program Potential Locations .......................................................................................................... 5-30

                                                                                                                                                                               Page iii
List of Acronyms
AC      Acres
AF      Acre Feet
AFY     Acre Feet per Year
ACS     American Community Survey
AMBAG   Association of Monterey Bay Area Governments
BFE     Base Flood Elevation
BMP     Best Management Practice
CASQA   California Storm water Quality Association
CCAMP   Central Coast Ambient Monitoring Program
CCPCR   Central Coast Post-Construction Requirements
CEQA    California Environmental Quality Act
CFS     Cubic Feet per Second
Corps   Army Corps of Engineers
CVP     Central Valley Project
CWA     Clean Water Act
DAC     Disadvantaged Communities
D/DBP   Disinfection Byproducts
DWQ     Division of Water Quality
EA      Effectiveness Assessment
EIR     Environmental Impact Report
EPA     Environmental Protection Agency
FCS     Full Capture System
FEMA    Federal Emergency Management Authority
FIB     Fecal Indicator Bacteria
FPS     Feet per Second
ft      Feet
GAC     Granular Activated Carbon
GPD     Gallons Per Day
GSA     Groundwater Sustainability Authority
GSP     Groundwater Sustainability Plan
IRWMP   Integrated Regional Water Management Plan
IWTP    Industrial Wastewater Treatment Plant
KG      Kilograms
LBS     Pounds
LID     Low Impact Development
MCL     Maximum Contaminant Level
MG      Million Gallons
MGD     Million Gallons Per Day
MG/L    Milligrams per Liter
MHI     Mean Household Income
mL      Milliliters
MOU     Memorandum of Understanding
MPN     Most Probable Number
MS4     Municipal Separate Storm Sewer Systems

                                                       Page iv
N/A      Not Applicable
NEPA     National Environmental Policy Act
NFIP     National Flood Insurance Program
NPDES    National Pollutant Discharge Elimination System
OF       Outfall
PAH      Polynuclear Aromatic Hydrocarbons
PCR      Post-Construction Requirements
PEAIP    Program Effectiveness Assessment and Improvement Plan
PGA      Pollutant-Generating Activities
POC      Pollutant of Concern
POTW     Publicly Owned Treatment Works
PRWFPA   Pajaro River Watershed Flood Prevention Authority
PRWS     Pajaro River Watershed Study
PV       Pajaro Valley
RDWTP    Regional Domestic Wastewater Treatment Plant
RWMG     Regional Watershed Management Group
RWQCB    Regional Water Quality Control Board
SBCWD    San Benito County Water District
SBR      Sequencing Batch Reactor
SCM      Storm water Control Measure
SDAC     Severely Disadvantaged Communities
SNMP     Salt and Nutrient Management Plan
SSC      Suspended-Sediment Concentration
SSCWD    Sunnyslope County Water District
SGMA     Sustainable Groundwater Management Act
SSO      Sanitary Sewer Overflow
SWAMP    Surface Water Ambient Monitoring Program
SWMM     Storm Water Management Model
SWRCB    State Water Resources Control Board
SWRP     Storm Water Resource Plan
TBD      To Be Determined
TDS      Total Dissolved Solids
TELR     Tool to Evaluate Load Reduction
TMDL     Total Maximum Daily Load
USGS     United States Geological Survey
UV       Ultraviolet
WAAP     Waste Allocation Attainment Plant
WBD      Watershed Boundary Dataset
WDR      Waste Discharge Requirement
WRF      Water Resources Facility
WTP      Water Treatment Plant

                                                                 Page v
CHAPTER 1
                                          INTRODUCTION

This Storm Water Resource Plan (SWRP) is utilized as a planning document for the City of Hollister, City of San
Juan Bautista, and San Benito County to identify and prioritize storm water and dry weather runoff projects,
programs, and opportunities through a watershed-based approach to storm water management. This chapter
summarizes the legislative background for preparing the SWRP and describes the purpose of the SWRP.

Legislative Background

Proposition 1 (Section 79747) provides $200 million in grant funds for multiple-benefit storm water
management projects. The Storm Water Management Planning Act of 2014, Senate Bill 985, amended Water
Code Section 10560 et seq. to require a Storm Water Resource Plan (SWRP) in order to receive grant funding for
storm water and dry weather runoff capture projects from any bond approved by voters after January 1, 2014.
This applies to Proposition 1 grants for multi-benefit storm water management projects.

Purpose of Plan

The State Water Resources Control Board’s (SWRCB) Division of Water Quality (DWQ) developed the Storm
Water Resource Plan Guidelines for public agencies to prepare a SWRP consistent with the Water Code. These
Guidelines were adopted by the SWRCB in December 2015.

The purpose of a SWRP is to identify a watershed-based approach to managing storm water as a resource. This
planning document describes the watersheds tributary to the greater Hollister area, within the City of Hollister,
City of San Juan Bautista, and the northern portion of San Benito County. The Plan summarizes water quality
compliance and identifies planned and future storm water projects that will benefit water supply, water quality,
and the community.

This SWRP will be incorporated into the Pajaro River Watershed Integrated Regional Water Management Plan
(IRWMP). This integration is important for the SWRP objectives to match the broader water management goals
for the Pajaro River Watershed.

Organization of the SWRP

This SWRP is divided into the following chapters per the State Water Board’s SWRP Guidelines:

        Chapter 1—Introduction and SWRP Objectives: provides an overview of the legislative background and
        purpose of this SWRP.

        Chapter 2—Watershed Identification: describes the watershed boundary and characteristics; identifies
        surface and ground water resources along with potable water supplies and natural watershed processes.

                                                                                                           1-1
Chapter 3—Water Quality Compliance: identifies contributors to storm water pollution and summarizes
regulatory plans and permits such as Total Maximum Daily Load (TMDL) Implementation Plan, National
Pollutant Discharge Elimination System (NPDES) Permit, and Waste Discharge Permit.

Chapter 4—Organization, Coordination, Collaboration: describes local agencies, organizations, and
other stakeholders’ involvement along with community engagement and the incorporation of this plan
into the existing Integrated Regional Water Management Plan (IRWMP).

Chapter 5—Identification and Prioritization of Projects: identifies storm water and dry weather runoff
projects and prioritizes each based on quantitative measures.

Chapter 6—Implementation Strategy and Schedule: discusses how the SWRP will be integrated into the
IRWMP along with review, updates, and management of the SWRP; strategizes project implementation
including responsible entities, status tracking, performance measures, and community participation.

Chapter 7—Education, Outreach, Public Participation: discusses methods used for public education and
participation, engagement with local stake holders, and awareness for environmental injustice needs.

Chapter 8—References

                                                                                                 1-2
ʹ
ƌĞŐŝŽŶƚŚĂƚĚƌĂŝŶƐƚŽĂƌŝǀĞƌ͕ůĂŬĞ͕ŽƌŽƚŚĞƌďŽĚLJŽĨǁĂƚĞƌŝƐĚĞĨŝŶĞĚĂƐĂǁĂƚĞƌƐŚĞĚ͘dŚĞ^tZWĨŽĐƵƐĞƐŽŶĂ
ǁĂƚĞƌƐŚĞĚͲďĂƐĞĚĂƉƉƌŽĂĐŚƚŽƐƚŽƌŵǁĂƚĞƌŵĂŶĂŐĞŵĞŶƚŝŶŽƌĚĞƌƚŽƌĞƉůŝĐĂƚĞŶĂƚƵƌĂůŚLJĚƌŽůŽŐLJĂŶĚƉƌŽĐĞƐƐĞƐ
ǁŝƚŚŝŶƚŚĞǁĂƚĞƌƐŚĞĚ͘dŚĞWĂũĂƌŽZŝǀĞƌtĂƚĞƌƐŚĞĚ͕ŵĂŶĂŐĞĚďLJƚŚĞZĞŐŝŽŶĂůtĂƚĞƌƐŚĞĚDĂŶĂŐĞŵĞŶƚ'ƌŽƵƉ
;ZtD'Ϳ͕ŝƐƐŚŽǁŶŝŶ&ŝŐƵƌĞϮͲϭ͘dŚĞZtD'ŝŶĐůƵĚĞƐWĂũĂƌŽsĂůůĞLJtĂƚĞƌDĂŶĂŐĞŵĞŶƚŐĞŶĐLJ;WstĂƚĞƌͿ͕^ĂŶ
ĞŶŝƚŽŽƵŶƚLJtĂƚĞƌŝƐƚƌŝĐƚ͕ĂŶĚsĂůůĞLJtĂƚĞƌ͘dŚĞĨŽůůŽǁŝŶŐŝŶĨŽƌŵĂƚŝŽŶƌĞŐĂƌĚŝŶŐƚŚĞWĂũĂƌŽZŝǀĞƌtĂƚĞƌƐŚĞĚ
ǁĂƐƚĂŬĞŶĨƌŽŵƚŚĞWĂũĂƌŽZŝǀĞƌtĂƚĞƌƐŚĞĚ/ZtDW͘
dŚĞWĂũĂƌŽZŝǀĞƌŝƐƚŚĞůĂƌŐĞƐƚĐŽĂƐƚĂůƐƚƌĞĂŵďĞƚǁĞĞŶ^ĂŶ&ƌĂŶĐŝƐĐŽĂLJĂŶĚƚŚĞ^ĂůŝŶĂƐZŝǀĞƌ
tĂƚĞƌƐŚĞĚŝŶƚŚĞŽƵŶƚLJŽĨDŽŶƚĞƌĞLJ͘dŚĞǁĂƚĞƌƐŚĞĚŝƐĂƉƉƌŽdžŝŵĂƚĞůLJϭ͕ϯϬϬƐƋƵĂƌĞŵŝůĞƐĂŶĚŝƚ
ŝŶĐůƵĚĞƐƉŽƌƚŝŽŶƐŽĨ^ĂŶƚĂƌƵnj͕^ĂŶƚĂůĂƌĂ͕^ĂŶĞŶŝƚŽ͕ĂŶĚDŽŶƚĞƌĞLJŽƵŶƚŝĞƐ͘/ƚƐůĂƌŐĞƐŝnjĞ
ĐŽŶƚƌŝďƵƚĞƐƚŽƚŚĞŶƵŵďĞƌŽĨĚŝǀĞƌƐĞĞŶǀŝƌŽŶŵĞŶƚƐ͕ƉŚLJƐŝĐĂůĨĞĂƚƵƌĞƐ͕ĂŶĚůĂŶĚƵƐĞƐǁŝƚŚŝŶƚŚĞ
ǁĂƚĞƌƐŚĞĚ͘
dŚĞŵĂũŽƌĚŝƌĞĐƚƚƌŝďƵƚĂƌŝĞƐƚŽƚŚĞWĂũĂƌŽZŝǀĞƌŝŶĐůƵĚĞƚŚĞ^ĂŶĞŶŝƚŽZŝǀĞƌ͕dĞƋƵŝƐƋƵŝƚĂ^ůŽƵŐŚ͕^ĂŶƚĂŶĂ
ƌĞĞŬ͕WĂĐŚĞĐŽƌĞĞŬ͕>ůĂŐĂƐƌĞĞŬ͕hǀĂƐƌĞĞŬ͕ĂŶĚŽƌƌĂůŝƚŽƐƌĞĞŬ͘dŚĞWĂũĂƌŽZŝǀĞƌĨůŽǁƐƚŽƚŚĞWĂĐŝĨŝĐKĐĞĂŶ
ǀŝĂDŽŶƚĞƌĞLJĂLJ͘
dŚĞ^ƚĂƚĞtĂƚĞƌZĞƐŽƵƌĐĞƐŽŶƚƌŽůŽĂƌĚ;^tZͿ'ƵŝĚĞůŝŶĞƐƌĞĐŽŵŵĞŶĚƚŚĞďŽƵŶĚĂƌLJŽĨĂ^tZWƚŽďĞ
ĚĞůŝŶĞĂƚĞĚďLJƚŚĞĂůtĂƚĞƌǁĂƚĞƌƐŚĞĚĚĞƐŝŐŶĂƚŝŽŶƐ͕ƚŚĞhŶŝƚĞĚ^ƚĂƚĞƐ'ĞŽůŽŐŝĐĂů^ƵƌǀĞLJ;h^'^Ϳ,LJĚƌŽůŽŐŝĐ
ĚĞƐŝŐŶĂƚŝŽŶƐ͕ŽƌĂŶĞƋƵŝǀĂůĞŶƚďŽƵŶĚĂƌLJ͘&ŝŐƵƌĞϮͲϮƐŚŽǁƐƚŚĞĂůtĂƚĞƌĂŶĚh^'^,LJĚƌŽůŽŐŝĐhŶŝƚĞƐŝŐŶĂƚŝŽŶƐ
ĨŽƌƚŚĞWĂũĂƌŽZŝǀĞƌǁĂƚĞƌƐŚĞĚ͘
dŚŝƐ^tZWƐƚĂƌƚĞĚǁŝƚŚĨŽĐƵƐŝŶŐŽŶƐƚŽƌŵǁĂƚĞƌĂŶĚĚƌLJǁĞĂƚŚĞƌƌƵŶŽĨĨƉĂƚƚĞƌŶƐƉƌŝŵĂƌŝůLJŝŶƚŚĞŝƚLJŽĨ
,ŽůůŝƐƚĞƌďƵƚŐƌĞǁƚŽĞŶĐŽŵƉĂƐƐƚŚĞŐƌĞĂƚĞƌŶŽƌƚŚĞƌŶ^ĂŶĞŶŝƚŽŽƵŶƚLJǁĂƚĞƌƐŚĞĚďĞĐĂƵƐĞŽĨƚŚĞŝƌĞĨĨĞĐƚƐŽŶ
ƚŚĞĚŽǁŶƐƚƌĞĂŵWĂũĂƌŽZŝǀĞƌ͘dŚĞ^tZWďŽƵŶĚĂƌLJŝƐďĂƐĞĚŽŶƚŚĞĨŽůůŽǁŝŶŐĞŝŐŚƚƐƵďǁĂƚĞƌƐŚĞĚƐĨƌŽŵƚŚĞh^'^
tĂƚĞƌƐŚĞĚŽƵŶĚĂƌLJĂƚĂƐĞƚ;tͿ͗ŝƌĚƌĞĞŬͲ^ĂŶĞŶŝƚŽZŝǀĞƌ͕>ŽǁĞƌWĂĐŚĞĐŽƌĞĞŬ͕>ŽǁĞƌWĂũĂƌŽZŝǀĞƌ͕
>ŽǁĞƌhǀĂƐƌĞĞŬ͕^ĂŶ:ƵĂŶĂŶLJŽŶ͕^ĂŶƚĂŶĂƌĞĞŬ͕dĞƋƵŝƐƋƵŝƚĂ^ůŽƵŐŚ͕ĂŶĚhƉƉĞƌWĂũĂƌŽZŝǀĞƌ͘dŚĞ^tZW
ŽƵŶĚĂƌLJŝƐƐŚŽǁŶŽŶ&ŝŐƵƌĞϮͲϯ͘
dŚĞƐĞĞŝŐŚƚƐƵďǁĂƚĞƌƐŚĞĚƐǁĞƌĞŝĚĞŶƚŝĨŝĞĚďĂƐĞĚŽŶƚŚĞƐƵƉƉŽƌƚďLJŝƚLJŽĨ,ŽůůŝƐƚĞƌ͕ŽƵŶƚLJŽĨ^ĂŶĞŶŝƚŽ͕ĂŶĚ
WĂũĂƌŽZŝǀĞƌtĂƚĞƌƐŚĞĚ&ůŽŽĚWƌĞǀĞŶƚŝŽŶƵƚŚŽƌŝƚLJ;WZt&WͿƚŽŝĚĞŶƚŝĨLJŵƵůƚŝͲďĞŶĞĨŝƚƉƌŽũĞĐƚƐ͕ƉƌŽŐƌĂŵƐ͕ĂŶĚ
ŽƉƉŽƌƚƵŶŝƚŝĞƐǁŝƚŚŝŶƚŚŝƐƌĞŐŝŽŶ͘&ŝŐƵƌĞϮͲϰƐŚŽǁƐƚŚĞĞŝŐŚƚƐƵďǁĂƚĞƌƐŚĞĚƐƚŚĂƚŵĂŬĞƵƉƚŚĞ^tZWďŽƵŶĚĂƌLJ͘
ϮͲϭBird Creek-San Benito River
Bird Creek begins at the San Benito-Monterey County line north west of the City of Salinas. This creek drains to
the San Benito River, which is tributary to the Lower Pajaro River. The confluence of the San Benito River and
Pajaro River has historically been an important predictor for the flow conditions within the lower Pajaro River.
This subwatershed is 32,742 acres. The western portion of the City of Hollister drains to the San Benito River
through six (6) City outfalls and two (2) County outfalls.
Lower Pacheco Creek
The Lower Pacheco Creek within the SWRP boundary covers 6,689 acres in the subwatershed. The other 15,360
acres of the subwatershed is accounted for in the South Santa Clara County SWRP boundary. Pacheco Creek
begins downstream of the Pacheco Lake Reservoir Dam in Santa Clara County and continues through San Benito
County, terminating at San Felipe Lake.
Lower Pajaro River
The lower Pajaro River subwatershed spans San Benito, Santa Clara, Santa Cruz, and Monterey counties. Only
2,714 acres are within this SWRP Boundary. The other 33,280 acres of the subwatershed are accounted for in
the Greater Monterey County and Santa Cruz County SWRPs. A majority of the lower Pajaro River subwatershed
is within Monterey County, where the Pajaro River flows to the Pacific Ocean via Monterey Bay.
Lower Uvas Creek
The lower Uvas Creek subwatershed within the SWRP boundary covers 1,996 acres. The other 23,694 acres is
accounted for in the South Santa Clara County SWRP boundary. Uvas-Carnadero Creek flows through the length
of the subwatershed with Tar Creek and Tick Creek entering Uvas-Carnadero Creek upstream of its confluence
with the Pajaro River at the drainage point of the subwatershed.
San Juan Canyon
San Juan Canyon subwatershed, approximately 24,415 acres, is entirely encompassed within the SWRP
boundary. San Juan Valley is bounded by Lomerias Muertas and the Flint Hills to the north and the Gabilan
Range to the south and east. San Benito River enters the valley from the east and confluences with the Pajaro
River just north of this subwatershed.
Santa Ana Creek
The Santa Ana Creek subwatershed confluences with the Tequisquita Slough just north of the City of Hollister’s
limits. The eastern portion of the City of Hollister, approximately 3,343 acres, drains to the Santa Ana Creek
through seven (7) City outfalls. This subwatershed is 33,717 acres.
Tequisquita Slough
The Tequisquita Slough is tributary to the Upper Pajaro River. The Tequisquita Slough subwatershed is fed by
Santa Ana Creek and Arroyo Dos Picachos. This subwatershed flows into San Felipe Lake and has an approximate
area of 25,964 acres.
Upper Pajaro River
The upper Pajaro River subwatershed spans both the County of San Benito and the County of Santa Clara.
Approximately 19,923 acres of the total 35,200 acres are within this SWRP boundary. The Pajaro River begins at
San Felipe Lake and flows along the San Benito County line. Located in this subwatershed is Millers Canal, which
conveys water from the San Felipe Lake to the Pajaro River.
2-2Soap Lake Floodplain
This SWRP boundary encompasses the Soap Lake floodplain, which lies along the Pajaro River within San Benito
and Santa Clara Counties. Although a portion of this floodplain is encompassed in Santa Clara County, an analysis
of the Soap Lake floodplain was not included in the South Santa Clara County SWRP. The entirety of the Soap
Lake floodplain was important to include in this SWRP boundary due to the direct effects this floodplain has on
flooding in the lower Pajaro River watershed communities. Upper Soap Lake, also known as San Felipe Lake, is a
permanent body of water. Lower Soap Lake, or just Soap Lake, is created when flood events create a backup on
the Pajaro River upstream of the San Benito River.
Soap Lake is not a true lake, however, during significant rainfall events, the low-lying areas of Soap Lake become
flooded and storm flow backs up on the Pajaro River upstream of its confluence with the San Benito River.
Functioning in this manner, the Soap Lake floodplain is a natural detention basin in the upper Pajaro River
watershed, storing water and reducing peak flows that would otherwise increase flooding in the lower portions
of the Pajaro River watershed. This SWRP boundary, along with neighboring South Santa Clara County and Santa
Cruz County SWRB boundaries, is delineated on Figure 2-5.
Land Use
The land use agencies are the City of Hollister, City of San Juan Bautista, and County of San Benito. Development
within this watershed is clustered around the City of Hollister and the City of San Juan Bautista. Land use in both
of these cities is comprised of primarily residential development, with commercial development in and around
the downtown area, and a heavy concentration of industrial development near the Hollister Municipal Airport at
the northern end of the City of Hollister. The City of Hollister’s and City of San Juan Bautista’s land use is
displayed on Figure 2-6 and Figure 2-7, respectively. The County of San Benito is primarily agricultural land use.
Zoning for the portions of the County of San Benito within the SWRP are shown on Figure 2-8.
Water Quality Priorities
The Pajaro River has been extensively studied and found to be impaired with chemical and nutrients from storm
water runoff originating from cities and agriculture. Table 2-1 summarizes the Total Maximum Daily Loads
(TMDLs) within this SWRP.
Table 2-1 TMDLs
Water Body TMDL
Pacheco Creek Fecal Coliform: Resolution R3-2009-0008
Nitrate: R3-2005-0131
Sediment: Resolution R3-2005-0132
Pajaro River Fecal Coliform: Resolution R3-2009-0008
Chlorpyrifos & Diazinon: R3-2013-0011
Nutrients: R3-2015-0004
San Benito River Fecal Coliform: Resolution R3-2009-0008
Santa Ana Creek Fecal Coliform: Resolution R3-2009-0008
Tequisquita Slough Fecal Coliform: Resolution R3-2009-0008
San Juan Creek Fecal Coliform: Resolution R3-2009-0008
2-3Water Body TMDL
San Benito River Sediment: Resolution R3-2005-0132
Fecal Coliform
Coliforms are a group of bacteria that are present in different environments. The presence of total coliforms in
water is considered as less harmful, but the presence of fecal coliforms including Escherichia coli (E. coli), a
subset of F. Coli bacteria, is considered as a level of fecal contamination, which can lead to different disease
conditions. The water quality threshold for E. Coli is based on a minimum of five samples for any 30-day period,
which shall not exceed a geometric mean of 126 MPN (most probable number) per 100mL.
The EPA establishes and periodically updates water quality controls to protect human health. These criteria
were last updated in 2012 and continue to recommend use of Fecal Indicator Bacteria (FIB), namely E. coli and
Enteroccoci, to assess attainment of recreational uses and to support NPDES permit limits. Pathogens are the
top cause of receiving water impairments in the U.S. and receiving water impairments as defined by elevated
levels of FIB frequently occurring in urbanized areas. Although the epidemiological linkage between elevated FIB
in storm water and human health risk is less clearly understood than for sanitary sewage-impacted waters,
Municipal Separate Storm Sewer Systems (MS4) permit holders and watershed stakeholders must address storm
water system-related contributions of FIB to receiving waters to address MS4 storm water permit related
requirements, particularly as required under TMDLs and associated implementation plans. Listed below are the
likely sources of FIB in the City of Hollister.
x Wildlife-Avian sources
x Pet & Animal Wastes; Dog Parks
x Failing private sewer laterals
x Industrial & Commercial facilities: Food processing & service facilities, material stockpiles
x Restaurants-grease bins (food grease & oil recycle/disposal containers), trash
bins/enclosures, facility power washing
x Illicit Discharges-dumping
x Urban/Residential Point Sources-Sediment transport
Sediment
Sediment is reported as Suspended-Sediment Concentration (SSC) and is a common and well-researched storm
water quality pollutant. There is extensive literature and national datasets documenting the ranges of SSC
concentrations in land use and mixed urban runoff. While SSC loading from urban catchments may or may not
exceed regulatory thresholds, there is a well-documented range of concentrations emanating from urban lands
that are maintained from good to poor condition. In addition, storm water improvement actions implemented
to reduce sources of SSC or treat SSC loads entrained in storm water are, in many instances, also effective at
reducing the concentrations and loads of other common urban pollutants particularly FIB for which the City
Hollister has a TMDL requirement on their receiving waters, as discussed above. Processes commonly used to
treat urban storm water via structural Best Management Practices (BMPs)—infiltration, particle capture, and
media filtration, are equally effective at treating most hydrophobic pollutants. Hydrophilic pollutant load
reduction (i.e., nitrate) are assumed to occur concurrently with effective storm water volume reductions.
Sediment has long been a TMDL in many of the Pajaro River watershed tributaries as well as many other water
courses statewide. Sediment causes turbidity in receiving waters which interferes with fish reproductive
processes. Sediment is also linked to the City’s other TMDL, Fecal Coliform, as it is a sink for most pollutants.
2-4Additionally, coliform type bacteria may survive longer in sediments/organic litter than in the water column.
Therefore, sediment or organic litter, if mobilized, could be an important source of bacteria, and removal of
water column particulate-bound or free coliform bacteria may not constitute a reliable permanent removal
mechanism in some cases. For these reasons, sediment is also considered a proxy for bacteria and other types of
pollutants. During the 2013 MS4 term, many of the municipalities in California focused on sediment as a high
priority pollutant of concern (POC) and many of the City’s existing storm water program features utilize BMPs
for reducing discharge of sediment as well.
The San Benito River Watershed Study was prepared as part of the Pajaro River Watershed IRWMP Update. This
study found the San Benito River to be a significant source of sediment for the lower Pajaro River. Modeling
results showed that during 25-year and 100-year storm events, 50-64% of the lower Pajaro River’s sediment load
comes from the San Benito River, and during the 10-year events and smaller, the San Benito River contributions
increase to 80-100% of the sediment load. Based on these results, the Pajaro River Watershed IRWMP
recommended erosion and sediment reduction to be carried out on the San Benito River.
Surface Water
The San Benito County Water District (SBCWD) manages the surface water within the SWRP. It is important to
note that the Pacheco Reservoir, managed by Valley Water, has been included in this discussion because of its
downstream effect on communities in San Benito County. The following reservoir information was discussed in
the Pajaro River Watershed IRWMP.
San Justo Reservoir
The San Justo Reservoir, owned by the United States Bureau of Reclamation, is located 3 miles southwest of
Hollister. San Justo Reservoir provides elevated operational storage and flexibility for the SBCWD Central Valley
Project (CVP) system. This reservoir has a capacity of 10,000 AF.
Hernandez Reservoir
The Hernandez Reservoir stores runoff from the upper San Benito River and has a tributary watershed of about
85 square miles. The reservoir covers about 610 acres. The reservoir is operated to facilitate groundwater
recharge in the Gilroy-Hollister Groundwater Basin and provide flood protection. The capacity of this reservoir is
18,300 acre-feet (AF). This reservoir is not within the SWRP boundary.
Paicines Reservoir
The Paicines Reservoir is an off-stream reservoir located between the San Benito River and Tres Pinos Creek and
is filled by water diverted from the San Benito River, with some water coming from water stored and released
from Hernandez Reservoir. The capacity of this reservoir is 2,870 AF. This reservoir is not within the SWRP
boundary.
Pacheco Reservoir
Pacheco Reservoir is managed by Valley Water and owned and operated by Pacheco Pass Water District.
Although this reservoir is in Santa Clara County, the reservoir discharges to the Lower Pacheco Creek in San
Benito County. This reservoir is noted because of the Pacheco Reservoir Expansion Project and the downstream
benefits this project will have to reduce flood risk along Pacheco Creek and within communities in San Benito
County. More information on this project can be found in Chapter 5 of this report.
2-5Imported Water Supply
SBCWD purchases CVP surface water from the United States Bureau of Reclamation, which is imported through
the Sacramento River-San Joaquin River Delta to the San Luis Reservoir and conveyed through the Hollister
Conduit. The Hollister Conduit has a design capacity of 83 cubic feet per second (cfs) and extends approximately
19.5 miles from the Santa Clara Conduit to the terminus at San Justo Reservoir, located southwest of the City of
Hollister. The imported surface water is delivered to agricultural, municipal, and industrial customers in the
SBCWD Zone 6, which overlies portions of the Hollister and San Juan Management Areas of the North San Benito
Groundwater Basin.
Potable Water Treatment and Supply
Water service within the SWRP area is provided by the City of Hollister, the City of San Juan Bautista, and three
special districts: Sunnyslope County Water District (SSCWD), Aromas Water District, and Pacheco Pass Water
District. The City of Hollister supplies water service to the western half of the City, while SSCWD supplies water
service to the eastern half. The City of San Juan Bautista is the area’s municipal water supplier. Aromas Water
District is a multi-county special district that provides water service to approximately 950 connections in
Monterey and San Benito Counties. Pacheco Pass Water District is responsible for operating Pacheco Reservoir,
mainly to promote groundwater recharge within the District’s service area.
Lessalt Water Treatment Plant
The Lessalt Water Treatment Plant (WTP) is owned by SBCWD and operated under contract by SSCWD. The
plant was placed into operation in January 2003 and was upgraded in 2014 in compliance with the Disinfectants
and Disinfection Byproducts (D/DBP) Rule. Imported CVP water undergoes greensand, membrane filtration,
granular activated carbon (GAC) filtration, and disinfection. The plant has a rated capacity of 2.0 million gallons
per day (MGD) and a short-term production capacity of up to 2.5 MGD.
West Hills Water Treatment Plant
Construction of the West Hills WTP, also owned by the SBCWD and operated under contract by SSCWD, was
completed at the end of 2017. CVP surface water is delivered from the San Justo Reservoir to the West Hills
WTP, where it undergoes treatment using ballasted flocculation, dual media gravity filtration, and disinfection.
The treated water is stored and distributed by gravity into the City of Hollister’s water distribution system. The
plant has a current capacity of 4.5 MGD, with associated transmission facilities designed for an ultimate capacity
of 9.0 MGD.
2-6Figure 2-10 San Benito County’s Water System
www.sbcwd.com
The water service areas and treatment facilities are shown on Figure 2-9. Figure 2-10 above graphically
represents San Benito County’s water system.
Wastewater Treatment
The following are wastewater treatment facilities serving the SWRP area: City of Hollister Regional Domestic
Wastewater Treatment Plant, City of Hollister Industrial Wastewater Treatment Plant, Sunnyslope County Water
District – Cielo Vista Estates and Ridgemark Estates, and the City of San Juan Bautista. All service areas are
shown on Figure 2-11.
Hollister RDWTP
The Regional Domestic Wastewater Treatment Plant (RDWTP) was completed in 1980 and provides wastewater
collection service to residential, industrial, and commercial customers. The City of Hollister completed a
substantial upgrade to their wastewater treatment plant in 2008, including a plant expansion and upgrade, a
seasonal storage pond system, and recycled water distribution system, allowing the City to accept additional
wastewater flow from new customers. In 2016, the City replaced and upgraded the membranes which increased
actual treatment capacity but did not increase the permitted capacity of 4.0 MGD for dry weather flow
conditions and 5.0 MGD for wet weather flow conditions.
2-7The City of Hollister completed a Water Reclamation Facility (WRF) at the RDWTP in 2010 to comply with waste
discharge requirement (WDR). The 4.5 MGD capacity WRF replaced the RDWTP and produces Title 22 effluent as
recycled water. This water is being used for park irrigation in the City and agricultural irrigation within San
Benito County Water District. New pipelines were recently constructed to deliver recycled water to parcels in
the northern end of the City, and a storage pond at the WRF was lined to store up to 15 AF of recycled water.
Treated effluent not being used for recycled water is percolated to the groundwater basin.
Hollister IWTP
The City of Hollister also operates an Industrial Wastewater Treatment Plan (IWTP) which was completed in
1971. The IWTP was originally designed to treat high-strength wastewater from local industrial facilities. The
IWTP receives industrial wastewater during the summer canning season (mid-June thru mid-October) and storm
water during the winter/spring non-canning season. Treated wastewater from the IWTP is disposed of by
percolation/evaporation, with percolation recharging the underlying aquifer. Over the last 30 years the number
of industrial dischargers and corresponding wastewater flows to the IWTP have subsided. Currently there is only
one (1) cannery discharging industrial wastewater to the IWTP. This has left the IWTP with additional available
treatment and disposal capacity, which the City intends to use to treat and percolate storm water runoff
diverted from the storm water collection system.
Alternative compliance for Post-Construction Storm Water Management Requirements (PCR) is currently under
review by the Central Coast Regional Water Quality Control Board (RWQCB). This alternative compliance,
proposed in the City’s Watershed Plan, would allow Requirement 3 of the PCRs (Runoff Retention) to be met
offsite for applicable developments that drain to the San Benito River. Offsite compliance would be met through
diversion of runoff to the City’s IWTP for infiltration. The 95th percentile runoff volumes from existing
development and buildout conditions were calculated based on equations included in the Central Coast PCRs.
As part of the preliminary design for the IWTP Pond Upgrades, a water balance analysis was performed for the
site. This water balance looks at inflow, outflow, and accumulation during an average year and a wet year for
the recommended project. Inflows and outflows were analyzed monthly to determine if accumulation would
occur at the site. Additionally, total inflow and outflow over the course of a year was evaluated to determine if
the facility has adequate disposal capacity. Based on the analysis, the monthly water balance shows that for wet
year and maximum wastewater flow to the IWTP, no ponding or accumulation should occur. This assumes that
the percolation ponds are operated and maintained. The monthly water balance indicated the most limiting
scenario for disposal occurs during the summer where the discharger sends the maximum allowed wastewater
flow to the IWTP for the full canning season (3.2 MGD for 107 consecutive days). Table 5-1 summarizes the
annual water balance and shows that the facility has the capacity to infiltrate industrial wastewater and storm
water year-round with an acceptable factor of safety for the percolation ponds.
Table 2-2 IWTP Water Balance Summary
Total Inflow Total Outflow Factor of
Condition
(MG) Available (MG) Safety
Average Year1 492.6 1,108.3 2.25
Wet Year 2 627.2 1,108.3 1.8
1. Average year based on the 95th percentile storm and peak wastewater flow during the canning
season (3.2 MGD for 107 days)
2. Wet year based on the maximum annual rainfall record of 26.26” in 1983 with peak wastewater
flow during the canning season (3.2 MGD for 107 days)
2-8As part of this analysis, it was determined that the worst-case storm event for this site is multiple back-to-back
storms during the wet season (based on historical record). If this worst-case storm event were to occur again,
the site would have adequate storage capacity to retain the storm with an additional 100 AF of storage capacity
available. Ponding would occur from the accumulation of stormwater during this event, and it is estimated that
it would take approximately 1-2 months to percolate the water from the storm (assuming the percolation ponds
are properly maintained).
SSCWD Ridgemark Wastewater Treatment Plant
Sunnyslope County Water District operated two wastewater treatment plants serving residential and
commercial businesses in the Ridgemark area. In 2013, the two plants were replaced with a 0.35 MGD
wastewater treatment plant. This facility produces undisinfected secondary effluent, which is disposed of
through evaporation and/or percolation.
Cielo Vista Estates Wastewater Treatment Plant
Cielo Vista Estates consists of approximately 70 acres of residential development with approximately 76
residences. The wastewater treatment facility has a capacity to treat up to 30,000 gallons per day (GPD). The
effluent is disposed of via leach fields.
San Juan Bautista Wastewater Treatment Plant
The City of San Juan Bautista provides sewer services to most properties within the City. Residents in the
unincorporated area of the City are on septic systems. The City’s treatment plant is a 0.2 MGD tertiary
treatment facility that includes a mechanical screen and influent pump station, sequencing batch reactor (SBR)
pond, flow equalization tanks, a denitrification pond, pressure sand filters, and ultraviolet (UV) disinfection.
Sludge is stored in lagoons and filtered effluent sent through UV disinfection is discharged into a drainage
channel that is tributary to San Juan Creek. While there is some buffering capacity available in the SBR, the
available volume is not enough to equalize the excess daily flow during peak flow conditions. For long term
compliance, the tertiary treatment train needs to be expanded to accommodate higher flow rates.
Groundwater
Groundwater is a source of supply for the SWRP area, especially during time of drought. Figure 2-12 shows the
North San Benito Subbasin of the Gilroy-Hollister Groundwater Basin, which encompasses the SWRP area and is
a shared water resource for urban suppliers, agriculture, rural well owners, and environmental beneficial uses.
Both Hollister and SSCWD pump directly from wells located within their jurisdiction.
SBCWD is the Groundwater Sustainability Authority (GSA) for the Bolsa, Hollister, San Juan Bautista, and Tres
Pinos groundwater basins. Currently, a Groundwater Sustainability Plan (GSP) is being prepared for the North
San Benito subbasin in accordance with the Sustainable Groundwater Management Act (SGMA). This GSP
evaluates sustainability in terms of criteria including groundwater levels, storage, land subsidence, groundwater
quality, and interconnected surface water and groundwater dependent ecosystems. It presents the
hydrogeologic setting, groundwater conditions, and water budget and establishes sustainability criteria,
monitoring, and management actions for continued sustainable management.
Groundwater recharge occurs through natural and artificial methods, including infiltration, direct runoff, CVP
water and other surface water percolation, and percolation from treated wastewater effluent. The San Benito
River contributes some groundwater base flow upstream of its confluence with the Pajaro River, while the
Hernandez Reservoir, located upstream of the basin on the San Benito River, is operated to enhance flow in the
2-9river and recharge the groundwater basin. SBCWD also uses off stream basins to recharge local groundwater
with imported water; this provides water quantity and quality benefits.
The quality of groundwater in the Gilroy-Hollister groundwater basin is highly mineralized and of marginal
quality for drinking water and agriculture. SBCWD imports relatively high-quality water from the CVP for
agricultural use, municipal use, and recharge.
Flood Management
FEMA National Flood Hazard Layer
The floodplain within the SWRP area, as mapped by the Federal Emergency Management Authority (FEMA), has
the following flood hazard zones:
x Zone A: Areas subject to inundation by the 1-percent-annual-chance (100-year) flood event
generally determined using approximate methodologies. Because detailed hydraulic analyses have
not been performed, no Base Flood Elevations (BFEs) or flood depths are shown. Mandatory flood
insurance purchase requirements and floodplain management standards apply.
x Zone AE: Areas subject to inundation by the 1-percent-annual-chance flood event determined by
detailed methods. Base Flood Elevations (BFEs) are shown. Mandatory flood insurance purchase
requirements and floodplain management standards apply.
x Zone AO: Areas subject to inundation by 1-percent-annual-chance shallow flooding (usually sheet
flow on sloping terrain) where average depths are between one and three feet. Average flood
depths derived from detailed hydraulic analyses are shown in this zone. Mandatory flood insurance
purchase requirements and floodplain management standards apply.
x Zone X Shaded: Moderate flood hazard areas, subject to inundation by the 0.2-percent-annual-
chance (500-year) flood event. Mandatory flood insurance purchase requirements and floodplain
management standards do not apply.
x Zone X Un-Shaded: Low risk flood hazard area, above the elevation of the 0.2-percent-annual-
chance (500-year) flood event. Mandatory flood insurance purchase requirements and floodplain
managements standards do not apply.
Figure 2-13 illustrates potential flood hazard extents within the SWRP area.
Pajaro River Watershed Study
The Pajaro River Watershed Flood Prevention Authority (PRWFPA) was established in July 2000 by State
Assembly Bill 807 in order to “identify, evaluate, fund, and implement flood prevention and control strategies in
the Pajaro River Watershed, on an intergovernmental basis.” This watershed covers areas of four counties and
four water districts. The Board is comprised of one representative from each of the eight following agencies:
x County of Monterey
x County of San Benito
x County of Santa Clara
x County of Santa Cruz
x Monterey County Water Resources Agency
x San Benito County Water District
x Santa Clara Valley Water District
x Santa Cruz County Flood Control and Water Conservation District, Zone 7
2-10The Pajaro River Watershed Study (PRWS) has been the primary body of work through which the PRWFPA has
started to accomplish its mission. The PRWFPA has been involved in all aspects of the study including providing
direction for the study, reviewing results of the work completed for the PRWS, making critical decisions, and
adopting the selected project recommended and developed through the PRWS.
Phase 1 of the PRWS consisted of modeling both the hydrologic and sediment regimes of the watershed. The
results of Phase 1 provided a better understanding of the characteristics of the watershed and changes over
time that affect flooding frequency and flooding potential in the downstream reaches of the Pajaro River.
Phase 2 identified project alternatives that would provide flood protection for the Pajaro River from Chittenden
to Monterey Bay from the 100-year flood flows identified in Phase 1. The Phase 2 Study projects were
developed to coordinated with a concurrent Army Corps of Engineers (Corps) Lower Pajaro River flood
protection project.
After the conclusion of Phase 2, the Corps identified a 100-year flood protection project for the Lower Pajaro
River without any upstream projects. The Corps 100-year flood protection project assumes that the upstream
watershed conditions are maintained. The Phase 1 model results highlighted the natural flood attenuation
benefits of Soap Lake and the critical importance of maintaining those benefits as part of any Pajaro River flood
protection solution.
The focus of the PRWFPA shifted to ensure that the flows passing through the Lower Pajaro River Project in
Santa Cruz and Monterey Counties would not increase above the currently predicted levels. The most direct way
to achieve this goal was to preserve Soap Lake and its attenuation capabilities.
Phases 3 and 4 define and document the preferred method to maintain the Soap Lake attenuation and storage
capacity through the Soap Lake Floodplain Preservation Project. In Phase 3, Soap Lake was hydraulically
modeled, and the floodplain boundaries were defined. The impacts of flooding and land use preservation were
examined in compliance with the California Environmental Quality Act (CEQA) and the cost of the Project
estimated.
All phases of the PRWS were completed by 2005. The Soap Lake Floodplain Preservation Project has been listed
on the IRWMP’s 2019 Project Priority List and is included in this SWRP.
Hollister Municipal Code
For the City of Hollister, most of the land area within the San Benito River flood zone is currently used for
agriculture, industrial, or is vacant land. A few developed parcels adjacent to the San Benito River are
susceptible to 100-year flooding, including the California Aggregate and Mining facility and the City’s IWTP. The
Santa Ana Creek flood zone extends over approximately 140 acres of commercial and industrial development
southeast of the Airport. In addition, the floodplain covers approximately 550 acres of agricultural land on the
west side of Santa Ana Creek. The 500-year flood zone covers isolated low-lying areas of the City, including the
southern portion of the downtown core. Areas potentially affected by the 500-year flood are mostly residential
and commercial uses.
The Hollister Municipal Code Chapter 15.20 “Flood Damage Prevention Regulation” specifies standards of
construction within flood hazard areas and outlines the duties and responsibilities of the City’s floodplain
administrator. Code Section 17.14.040 “Flood Hazard Overlay Zone” specifies that residential development
within the floodplain is designed to avoid 100-year flood zones, and that industrial development within the
2-11floodplain shall comply with the City’s floodplain ordinance. The FEMA National Flood Insurance Program (NFIP)
requires that the City’s floodplain management regulations meet or exceed the minimum requirements as
includes in Chapter 44 of the Code of Federal Regulations.
San Juan Bautista Municipal Code
Northern San Benito County tends to encounter flooding problems. In San Juan Bautista, damage reported as a
result of these folds largely consists of agricultural losses with planting, field working delays, and crop damages.
As shown on Figure 2-13, the 100-year floodplain on San Juan Hollister Road follows San Juan Creek and the San
Andreas fault towards Highway 101.
Chapter 12-1, “Flood Hazard Prevention”, of the San Juan Bautista’s Municipal Code specifies general provisions,
administration, provisions for flood hazard reduction, and appeals and variances. The code specifies that all
development or land disturbance shall be set back a minimum of fifty (50) feet from the annual high-water mark
of San Juan Creek and twenty-five feet (25) from the annual high water mark of the San Juan Tributary.
Natural Watershed Processes
Nearly 80% of the unincorporated land in San Benito County is in some form of open space; however, natural
watershed processes have been disrupted mainly in the SWRP area due to urbanization in and around the City of
Hollister. Figure 2-14 provides a map of the national hydrography data within the SWRP boundary. As discussed
previously, the majority of land use in the City is residential and commercial development. The increase in
impervious areas results in less infiltration and groundwater recharge and more overland flow.
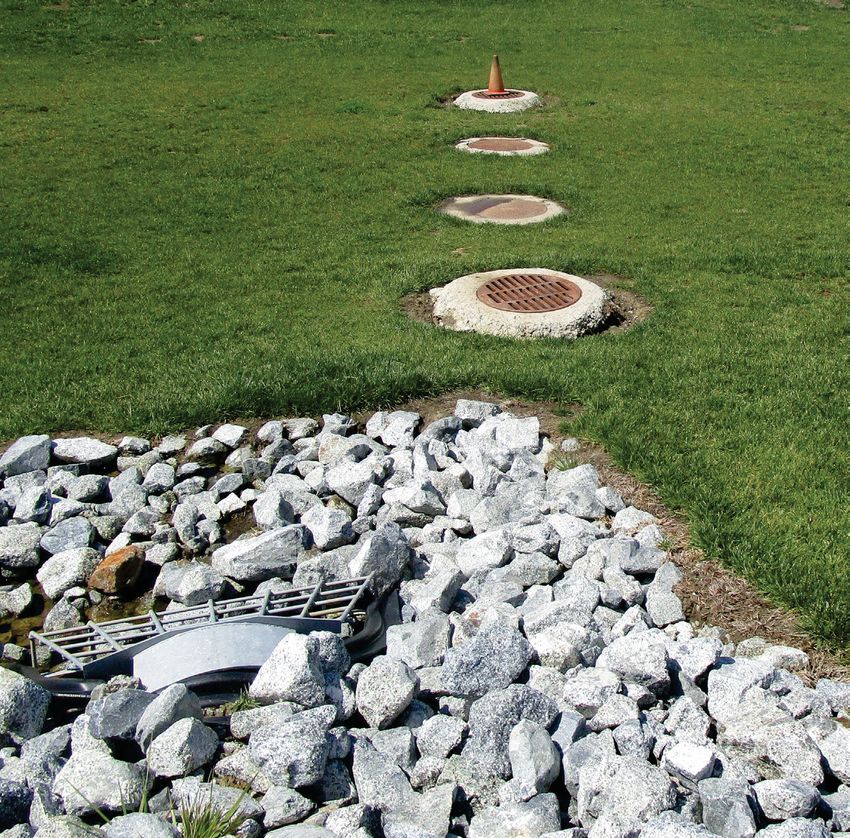
Best Management Practices
Best Management Practices (BMPs) are scheduling of activities, prohibitions of practices, maintenance
procedures, and other management practices to prevent or reduce the discharge of pollutants. Increased runoff
from impervious surfaces and urbanization can cause downstream erosion with increases of fine sediment
accumulation in creeks and rivers. Best management practices and low-impact developments help to maintain
the natural infiltration and runoff rates. The City of Hollister maintains several BMPs which include dry basins,
wet basin, infiltration basins, treatment vaults, bed filters, settling basins, biofilters, infiltration features (rock
lined channel), porous pavement, and sediment traps.
Post-Construction Requirements
Post-construction requirements (PCR) are needed for areas undergoing new development or redevelopment
since runoff from these types of areas can significantly affect receiving waterbodies. BMPs in these
developments can help minimize pollutant in post-construction storm water discharge. The PCRs through the
Central Coast Regional Water Quality Control Board (RWQCB) categorize the Central Coast Region into
Watershed Management Zones, to define geographic areas where specific performance requirements apply.
The City of Hollister is within Watershed Management Zones 1 and 4. Based on these zones, the following
requirements may apply to Regulated Projects, dependent on project size and thresholds for impervious surface.
x Performance Requirement 1: Site Design
x Performance Requirement 2: Water Quality Treatment
x Performance Requirement 3: Runoff Retention
x Performance Requirement 4: Peak Management
2-12You can also read