The Effects of a $15 Minimum Wage by 2019 in San Jose and Santa Clara County
←
→
Page content transcription
If your browser does not render page correctly, please read the page content below
POLICY BRIEF
                                                                                   June 2016

The Effects of a $15 Minimum Wage by
2019 in San Jose and Santa Clara County
By Michael Reich, Claire Montialoux, Sylvia Allegretto, Ken Jacobs,
Annette Bernhardt, and Sarah Thomason
With the assistance of Saika Belal and Ian Perry

Michael Reich is a Professor at UC Berkeley and Chair of the Center on Wage and Employment
Dynamics at UC Berkeley’s Institute for Research on Labor and Employment (IRLE). Claire
Montialoux is an Economics Researcher at IRLE. Sylvia Allegretto is Co-Chair of the Center on
Wage and Employment Dynamics at IRLE. Ken Jacobs is the Chair of the UC Berkeley Center for
Labor Research and Education at IRLE. Annette Bernhardt is a senior researcher at IRLE.
Sarah Thomason is a data analyst at the Center for Labor Research and Education at IRLE.
Saika Belal and Ian Perry are members of the UC Berkeley IRLE Minimum Wage Research
Group.
CONTENTS
KEY FINDINGS ........................................................................................................................................ 1
   Scenario A: Key findings for a $15 minimum wage increase in San Jose ..................................... 4
   Scenario B: Key findings for a $15 minimum wage increase in all of Santa Clara County........... 7
PART 1. THE POLICY CONTEXT ............................................................................................................ 10
   1. The economic context .................................................................................................................. 11
   2. The minimum wage increase schedules .................................................................................... 14
PART 2. EMPLOYMENT IMPACT ANALYSIS IN SAN JOSE AND SANTA CLARA COUNTY .................... 15
   1. Previous minimum wage research.............................................................................................. 16
   2. The UC Berkeley IRLE minimum wage model ............................................................................ 18
   3. Effects on workers ....................................................................................................................... 22
   4. Effects on businesses .................................................................................................................. 29
   5. Effects on employment ................................................................................................................ 34
PART 3. POLICY ISSUES ....................................................................................................................... 47
   Impacts on Specific Subpopulations............................................................................................... 48
   Wage Level........................................................................................................................................ 53
CONCLUSION ........................................................................................................................................ 56
APPENDIX: DATA AND METHODS ........................................................................................................ 59
   A1. The wage simulation model ...................................................................................................... 60
   A2. Calibrating the UC Berkeley IRLE minimum wage model ........................................................ 63
Endnotes ............................................................................................................................................... 72
References ............................................................................................................................................ 76
KEY FINDINGS

The Effects of a $15 Minimum Wage by 2019 in Santa Clara County and San Jose   1
We present here, at the request of the City of San Jose, an analysis of the impact of minimum
wage increases for both San Jose and all of Santa Clara County. Both scenarios begin on January
1, 2017 and increase to $15 by January 1, 2019. 1
Critics of minimum wage increases often cite factors that will reduce employment, such as
automation or reduced sales, as firms raise prices to recoup their increased costs. Advocates
often argue that better-paid workers are less likely to quit and will be more productive, and that a
minimum wage increase positively affects jobs and economic output as workers can increase
their consumer spending. Here we take into account all of these often competing factors to
assess the net effects of the policy.
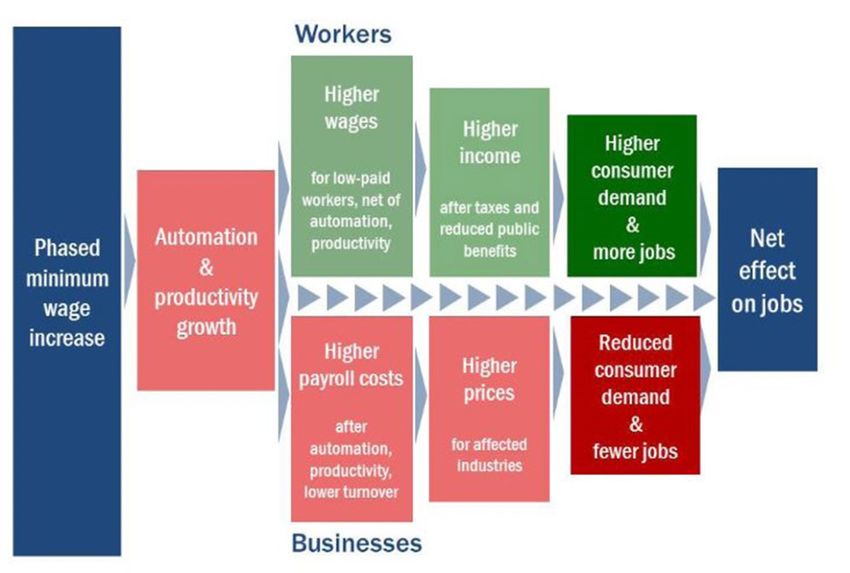
Our analysis applies a new structural labor market model that we created specifically to analyze
the effects of a $15 minimum wage. We take into account how workers, businesses, and
consumers are affected and respond to such a policy and we integrate these responses in a
unified manner. In doing so, we draw upon modern economic analyses of labor and product
markets. As we explain in the report, the main effects of minimum wages are made up of
substitution, scale, and income effects. The figure below provides a guide to the structure of our
model.
Figure 1. UC Berkeley IRLE minimum wage model
Source: UC Berkeley IRLE Minimum Wage Research Group
The Effects of a $15 Minimum Wage by 2019 in Santa Clara County and San Jose 2Our data are drawn from the Census Bureau’s American Community Survey and from other Census and U.S. Bureau of Labor Statistics datasets. We also make use of the extensive research conducted by economists—including ourselves—in recent years on minimum wages, and upon research on related economic topics. Our estimates of the effects of a $15 minimum wage are also based upon existing research on labor markets, business operations, and consumer markets. Our estimates compare employment numbers if the policy were to be adopted to employment numbers if the policy is not adopted. Other factors that may affect employment by 2019 are therefore outside the scope of our analysis. We have successfully tested our model with a set of robustness exercises. Our analysis does not incorporate the recent state minimum wage law passed in April 2016. Since the San Jose and Santa Clara County scenarios are on a faster timeline, the number and demographics of workers affected would be similar if we had included the scheduled statewide increases. However, the size of the average wage increase and the effect on firms compared to the new baseline established by the state would be somewhat smaller. The Effects of a $15 Minimum Wage by 2019 in Santa Clara County and San Jose 3
SCENARIO A: KEY FINDINGS FOR A $15 MINIMUM WAGE INCREASE IN
SAN JOSE – BY 2019

Economic context
•   When accounting for inflation, median earnings in San Jose were 10.5 percent lower in 2014
    compared to their 2007 pre-recession level. Median annual earnings in San Jose are 20.9
    percent higher than the state as a whole, but 17.3 percent less than median earnings in
    Santa Clara County.

•   Unemployment rates have declined significantly for the state and San Jose. The April 2016
    unemployment rate for California was 5.3 percent, down to its 2007 pre-recession rate.
    Annual unemployment in San Jose had was 4.5 percent in 2015, lower than its pre-recession
    rate (5.2 percent in 2007). 2

Effects on workers – by the end of 2019
•   Increasing the minimum wage to $15 would increase earnings for 115,000 workers, or 31.1
    percent of the city’s workforce.

•   Among those getting raises in San Jose, annual pay would increase 17.8 percent, or about
    $3,000 (in 2014 dollars) on average. These estimates include a ripple effect: some workers
    who already earn $15 will also receive an increase.

•   96 percent of workers who would get increases are over 20 and 56 percent are over 30—with
    a median age of 32.

•   The proposed minimum wage increase would disproportionately benefit Latinos, who
    represent 53 percent of affected workers.

•   Workers who would get pay increases are less-educated than the overall workforce, but
    almost half (48 percent) have some college experience or higher.

•   The median annual earnings of workers who would get raises ($18,100 in 2014 dollars) are
    36 percent of median earnings for all workers in San Jose ($50,507). Workers getting
    increases are disproportionately employed in part-time jobs, and are also less likely to have
    health insurance through their employer.

•   Workers who would get pay increases disproportionately live in low-income families; on
    average, they earn close to half of their family’s income.

The Effects of a $15 Minimum Wage by 2019 in Santa Clara County and San Jose                  4
• The research literature suggests downstream benefits from the proposed wage increase, such
as improved health outcomes for both workers and their children, and increases in children’s
school achievement and cognitive and behavioral outcomes.
Effects on businesses and consumers – by the end of 2019
• Three industries account for over half of the private sector workers getting increases in San
Jose: restaurants (21.0 percent), retail trade (19.1 percent), and administrative and waste
management services (14.7 percent).
• 77.8 percent of workers in the restaurant industry in the private sector would receive a wage
increase, compared to 11.5 percent in manufacturing.
• Total wages would increase by 10.1 percent for restaurants and 1.3 percent across all
employers. This increase is much smaller than the minimum wage increase because many
businesses already pay over $15 and many workers who would get pay increases are already
paid more than the current minimum wage. In addition, the workers who would receive pay
increases are the lowest paid workers in San Jose and their wages represent only 8.3 percent
of total wages.
• Employee turnover reductions, automation, and increases in worker productivity would offset
some of these payroll cost increases.
• Businesses could absorb the remaining payroll cost increases by increasing prices slightly—by
0.3 percent through 2019. This price increase is well below annual inflation of 2.5 percent
over the past five years. Price increases in restaurants would be higher, 3.1 percent.
• Price increases would be much smaller than labor cost increases because labor costs
average about 22 percent of operating costs; compared to 31 percent for restaurants and 11
percent for retail.
• The consumers who would pay these increased prices range across the entire income
distribution.
Net effect on employment in San Jose, Santa Clara County and nine nearby counties
– by the end of 2019
• Our estimate projects slightly slower employment growth during the phase-in period than
without the minimum wage increase: cumulatively, 960 fewer jobs by the end of 2019 in San
Jose, which corresponds to 0.3 percent of projected 2019 employment. In comparison,
employment in the state is projected to grow 1.32 percent annually in the same time period.
The Effects of a $15 Minimum Wage by 2019 in Santa Clara County and San Jose 5• Most of the reduction in job growth in San Jose reflects leakage of the increased spending by
workers getting increases into the rest of the region. A substantial share of San Jose workers
who would get pay increases live and spend their increased income in neighboring areas.
Taking into account the increased spending in surrounding areas, we estimate there would be
80 fewer jobs over the larger regional area than without the wage increase. This area includes
the following counties: Santa Clara, Alameda, San Mateo, San Francisco, Santa Cruz,
Monterey, and San Benito.
The Effects of a $15 Minimum Wage by 2019 in Santa Clara County and San Jose 6SCENARIO B: KEY FINDINGS FOR A $15 MINIMUM WAGE INCREASE IN
ALL OF SANTA CLARA COUNTY – BY 2019
Economic context
• After accounting for inflation, the earnings of typical workers in the county declined by 8.3
percent between their pre-recession level in 2007 and 2014. Median annual earnings in
Santa Clara County are 49.6 percent higher than in the state as a whole.
• Santa Clara County has experienced rapid employment growth in the recovery from the
recession. Over 62 percent of Santa Clara County’s working age residents are employed,
compared to 57 percent in the state as a whole.
• The unemployment rate in Santa Clara County was 4.2 percent in 2015, significantly
below the pre-recession rate and falling.
Effects on workers – by the end of 2019
• Increasing the minimum wage to $15 would increase earnings for about 250,000 workers
in Santa Clara County, or 25.3 percent of the county’s workforce.
• Among those getting raises in Santa Clara County, annual pay would increase 19.4
percent, or $3,200 (in 2014 dollars) on average. These estimates include a ripple effect in
which some workers who already earn $15 will also receive an increase.
• The demographics of the affected workers in Santa Clara County mirror those in San Jose:
95.5 percent are over the age of 20, with a median age of 32; 37.0 percent are married;
33.9 percent have children; nearly half are Latino.
• The median annual earnings of affected workers ($17,821 in 2014 dollars) are about
one-third of the median for all workers in Santa Clara County ($57,956).
Effects on businesses and consumers – by the end of 2019
• Three industries account for nearly half of the private sector workers getting increases in
Santa Clara County: food services (20.2 percent), retail trade (16.1 percent), and
administrative and waste management services (11.9 percent).
• 71 percent of workers in the restaurant industry in the private sector would receive a
wage increase, compared to 11.2 percent in manufacturing.
The Effects of a $15 Minimum Wage by 2019 in Santa Clara County and San Jose 7• Total wages would increase by 9.5 percent for restaurants and one percent across all
employers. This increase is much smaller than the minimum wage increase because many
businesses already pay over $15 and many workers who will get pay increases are already
paid over the current minimum wage. In addition, the workers who would receive pay
increases are the lowest paid workers in Santa Clara County and their wages represent
only 6.1 percent of total wages.
• Employee turnover reductions, automation, and increases in worker productivity would
offset some of these payroll cost increases.
• Businesses would absorb the remaining payroll cost increases by increasing prices
slightly—by 0.2 percent through 2019. This price increase is well below annual inflation of
nearly 2.5 percent over the past five years. Price increases in restaurants would be higher
at 2.9 percent.
• Price increases would be much smaller than labor cost increases because labor costs
average about 22 percent of operating costs; compared to 31 percent for restaurants and
11 percent for retail.
• The consumers who would pay these increased prices range across the entire income
distribution.
Net effect on employment in Santa Clara County and nine nearby counties – by 2019
• Our estimate projects slower employment growth over the phase-in period than without
the minimum wage increase: cumulatively, 1,350 fewer jobs by the end of 2019 in Santa
Clara County, which corresponds to 0.1 percent of projected 2019 employment. In
comparison, employment in the state is projected to grow 1.32 percent annually in the
same time period.
• Based upon regional commuting and spending patterns, we estimate a net gain of less
than one hundred jobs over the larger region that includes the counties of Santa Clara,
Alameda, San Mateo, San Francisco, Santa Cruz, Monterey, and San Benito. The
employment gains generated by a $15 minimum wage within Santa Clara County are
spread over nearby counties.
The Effects of a $15 Minimum Wage by 2019 in Santa Clara County and San Jose 8LIMITS TO OUR STUDY
• Any prospective impact study involves an inherent level of uncertainty. Actual effects may
differ from our estimates if future economic conditions vary from current forecasts.
• We estimate the net effects on jobs in the city, county and region. The effects will vary for
particular industries.
• We do not take into account the effects of higher wages on worker health and on worker
training, which are likely to be positive. Also, although higher parental earnings have well-
documented effects on children’s health, educational outcomes, and future earnings, these
long-run effects are beyond the time scope of our study.
• These results cannot be generalized to minimum wages higher than $15. Our model predicts
additional negative effects would occur at some higher minimum wage.
CONCLUSION
• Like all forecasts, our results may differ if other economic conditions change.
• A $15 countywide minimum wage by 2019 would generate a significant increase in earnings
for about 115,000 workers in San Jose and 250,000 workers in Santa Clara County. The
improvement in living standards would outweigh the small effect on employment.
• How can such a major improvement in living standards occur without adverse employment
effects? While a higher minimum wage induces some automation, as well as increased
worker productivity and slightly higher prices, it simultaneously increases worker purchasing
power. These positive and negative effects on employment largely offset each other. In the
end, the impacts of the minimum wage will be employee turnover reductions, productivity
increases and modest price increases.
The Effects of a $15 Minimum Wage by 2019 in Santa Clara County and San Jose 9PART 1. THE POLICY CONTEXT The Effects of a $15 Minimum Wage by 2019 in Santa Clara County and San Jose 10
1. THE ECONOMIC CONTEXT

We review here the current economic conditions in Santa Clara County, the City of San Jose and,
for context, California. We focus on four economic indicators over the Great Recession and
recovery: unemployment rates, job growth, employment rates, and earnings. Each provides a
somewhat different perspective on the nature of the current recovery.

The Great Recession started near the end of 2007 and officially lasted until June 2009.
California was hit hard by the recession as state unemployment rates soared into double digits as
did the rates for San Jose and Santa Clara County (Figure 2). Unemployment rates started to
decline as the economy improved. The April 2016 unemployment rate for California was 5.3
percent, down to its 2007 pre-recession rate. The 2015 annual unemployment in San Jose was
4.5 percent, lower than its pre-recession rate (5.2 percent in 2007).

                          Figure 2. Annual unemployment rates, 2007-2015

              Source: Annual unemployment rates are from the California Employment Development Department.

Unemployment rates improved as job growth strengthened over the last several years. Figure 3
shows the sizable job losses in Santa Clara County and California during the recession. Job
growth returned in 2011—at a faster pace in Santa Clara County than in California—and that
higher pace of job growth in Santa Clara County has increased even as job growth in the state
steadily improved.

The Effects of a $15 Minimum Wage by 2019 in Santa Clara County and San Jose                                 11
Figure 3. Job growth, California and Santa Clara County, 2007-2015
Source: Authors’ calculation of growth in total nonfarm payrolls (annual averages) from Current Employment
Statistics.
Note: *Data for Santa Clara County refers to the San Jose–Sunnyvale–Santa Clara MSA
Figure 4. The employment rate (EPOPS), 2007-2014
Sources: California state employment-to-population ratios are calculated using annual employment data
from the CPS and annual population data from the U.S. Census. Santa Clara County ratios are calculated
using annual employment data from EDD and annual population data from the U.S. Census.
The Effects of a $15 Minimum Wage by 2019 in Santa Clara County and San Jose 12Figure 4 depicts trends in the employment rate - the share of the working age population that is
employed. This indicator is a companion to the unemployment rate as it counts workers who
stopped looking for work and those who want more hours of work. Santa Clara County has
experienced rapid employment growth over the recovery. Over 62 percent of Santa Clara County
residents are employed compared to 57 percent for the state as a whole. Figure 4 shows that the
earnings of typical workers in Santa Clara County far outpace earnings for workers in San Jose
and the state overall. Median annual earnings in Santa Clara County are $52,377 (in 2014
dollars) which is 49.6 percent higher than the state as a whole. Annual earnings in San Jose are
$43,313 (in 2014 dollars), which is 20.9 percent higher than the state as a whole, but 17.3
percent less than median earnings in Santa Clara County.
However, pay in both the county and the state is lower than it was in 2007. In Santa Clara
County, after accounting for inflation, earnings of typical workers have declined by 8.3 percent,
compared to pre-recession levels. The pay of typical workers in the City of San Jose is 10.5
percent lower compared to the 2007 per-recession level. These patterns suggest that inequality
has continued to increase even during economic expansions. 3
Figure 5. Real median earnings, 2007-2014
Source: American Community Surveys 2007-2014.
Note: Median annual earnings for workplace geography in real 2014 inflation-adjusted dollars for
workers 16 years and over with earnings.
In summary, unemployment and employment trends show that California’s economic recovery
has strengthened substantially in recent years—and even more so in Santa Clara County and San
Jose. Median annual earnings are considerably higher in Santa Clara County and San Jose than
in the state as a whole. However, the earnings of typical workers have declined despite the
economy recovery.
The Effects of a $15 Minimum Wage by 2019 in Santa Clara County and San Jose 132. THE MINIMUM WAGE INCREASE SCHEDULES
Both of the scenarios considered in this report would phase in minimum wage increases over
three years, starting with $12 an hour in 2017 and reaching $15 an hour in 2019. In Scenario A,
this minimum wage schedule is adopted in San Jose. In Scenario B, this minimum wage schedule
is adopte throughout Santa Clara County, including San Jose. Tables 1 and 2 compare these two
minimum wage scenarios to the “baseline” schedules currently in effect (as of March 1, 2016).
In the impact analyses that follow, our logic will be to estimate the effects of Scenario A and B,
relative to their respective baseline schedules. (Our analysis does not take into account the
recent state minimum wage increase signed into law in April 2016).
Table 1. San Jose Minimum Wage Schedule: Scenario A
2017 2018 2019
Baseline schedule* $10.53 $10.76 $11.00
Scenario schedule $12.00 $13.50 $15.00
* Based on San Jose’s minimum wage schedule as of March 1, 2016. It does not take into account the state minimum wage
increase enacted on April 4, 2016. San Jose’s minimum wage was indexed to the U.S. All Cities CPI-W. We estimate each year’s
minimum wage using the average annual increase in the CPI-W over the past 10 years.
Table 2. Santa Clara County Minimum Wage Schedule: Scenario B
2015 workforce 2017 2018 2019
Baseline schedules
San Jose & Sunnyvale 431,000 $10.53* $10.76* $11.00*
Palo Alto & Santa Clara
211,000 $11.25* $11.50* $11.75*
City
Mountain View 84,000 $13.00 $15.00 $15.37*
Rest of Santa Clara
180,000 $10.00 $10.00 $10.00
County (state schedule)
Scenario schedule
Santa Clara County
906,000 $12.00 $13.50 $15.00
(except Mountain View)
Note: The baselines for these schedules were in effect as of March 1, 2016. Proposals being considered by individual cities were
not used. We do not take into account the state minimum wage increase enacted on April 4, 2016.
* Where minimum wages are scheduled to increase according to CPI, we estimate the increase using the average annual CPI
increase over the past 10 years. Mountain View’s minimum wage is indexed to the San Francisco CMSA CPI-W. All other cities
are indexed to the U.S. All Cities CPI-W.
The Effects of a $15 Minimum Wage by 2019 in Santa Clara County and San Jose 14PART 2. EMPLOYMENT IMPACT ANALYSIS IN SAN JOSE AND SANTA CLARA COUNTY The Effects of a $15 Minimum Wage by 2019 in Santa Clara County and San Jose 15
1. PREVIOUS MINIMUM WAGE RESEARCH

In the past two decades, economists have conducted numerous econometric studies of the
effects of minimum wages. The overwhelming majority have focused on the employment effects
(Belman and Wolfson 2014; Belman and Wolfson 2015; Schmitt 2015). Typically these studies
make use of panel data on workers or firms from standard government sources such as the
Current Population Survey or the Quarterly Census on Employment and Wages.

Most extant research on minimum wages does not detect significant effects on workers age 20
and over. Some observers attribute the lack of visible effects to the relatively small proportion of
adults who were affected by past minimum wage increases in the U.S. 4 These observers argue
that minimum wage effects should be detectible by examining groups that are more affected,
notably teens and restaurant workers (Brown 1999).

Economists have therefore focused on these two groups. After two decades of methodological
controversy among researchers, the literature has produced some areas of agreement. In
particular, recent studies of the effects on restaurant workers by researchers with opposing
methodological views have arrived at a consensus: the employment effects are either extremely
small or non-existent. 5 The effects of minimum wages on teen employment remain somewhat
controversial. Some researchers find significant but not large negative effects (Neumark, Salas,
and Wascher 2014) while others find effects that are much smaller, close to zero (Allegretto et al.
2015).

The remaining controversy over effects on teens has become less relevant than it once was.
While teens once represented one-fourth of all workers affected by minimum wages nationwide,
their importance has fallen to less than half that level today. We find that teens represent only
4.5 percent of the workers who would be affected by the proposed $15 Santa Clara County
minimum wage. Moreover, compared to teens, the rest of the low-wage workforce is older and
has more work experience and schooling than was the case in previous decades. Results that are
specific to teens are therefore not as informative for the effects on the workforce as a whole.

This minimum wage research uses quasi-experimental methods, exploiting time and state
variation between 1979 and 2012 in federal and state minimum wages to identify causal effects.
The most credible of the studies use state of the art statistical methods to ensure that the causal
comparisons are apples to apples. However, the minimum wage changes in these past
experiences, which peak at about $10, generated increases for at most 8-10 percent of the
workforce. In contrast, approximately 31 percent of all workers would receive a wage increase in
the $15 San Jose scenario and 25 percent in the $15 Santa Clara County scenario, far higher
than is the case in the minimum wage research literature to date. As a result, this previous
research is at best only suggestive of the effects we consider here.

The Effects of a $15 Minimum Wage by 2019 in Santa Clara County and San Jose                    16
Moreover, this quasi-experimental econometric approach does not tell us whether employment
effects are the result of automation, or price increases, or other possible mechanisms. Instead, it
incorporates the results of all these mechanisms without identifying which are at work.

Since the quasi-experimental econometric approach is not appropriate for our study, we draw
here upon the other major empirical method used by economists—building and calibrating a
structural model. Thus, in order to better understand the impacts of a larger minimum wage
increase, we model how the minimum wage policy works its way through the San Jose and Santa
Clara County economy, examining workers, businesses, and consumers. We incorporate
outcomes from economists’ best research on labor markets, business practices, and consumer
spending to construct a structural, multi-iterative model to estimate the effects of the scenarios
for San Jose and Santa Clara County.

The Effects of a $15 Minimum Wage by 2019 in Santa Clara County and San Jose                  17
2. THE UC BERKELEY IRLE MINIMUM WAGE MODEL

In 2015, the UC Berkeley Institute for Research on Labor and Employment (IRLE) minimum wage
group developed a structural model to study the prospective impacts of a $15 minimum wage in
Los Angeles. 6 This model was further enhanced to study the effects of a $15 minimum wage in
New York State (Reich et al. 2016). The current report, which uses that model, contains two
components:

    •   A wage simulation model that predicts the number of workers that will be affected by (i.e.,
        receive) minimum wage increases. The results of this model are described in the first part
        of this report, and the model itself is described in detail in the appendix.

    •   An economic impact model that predicts the effect of minimum wage increases, given the
        structure of the workforce affected, on consumer demand. We focus on the latter in this
        section.

We also adapt the model to apply to San Jose and Santa Clara County in particular. Our estimates
draw on standard government data sources, the large body of economic research on the
minimum wage, other research studies, and a standard regional economic model (IMPLAN).
These data sources and models are fully documented in the text, accompanying endnotes, and in
the appendix.

Our economic impact model recognizes that higher minimum wages will affect labor supply and
labor demand. Adjustments to labor supply include lower employee turnover and lower job
vacancy rates. Adjustments to labor demand include possible substitutions of capital for labor
and skilled labor for unskilled labor, greater worker productivity when wages rise, reductions in
employment because higher prices reduce sales, and increases in employment because workers’
spending out of their higher income will increase sales and employment. The net effect depends
upon the magnitudes of the individual adjustments, again taking into account interactions among
them.

The labor demand model draws from standard labor economic textbook analyses. For industry
labor demand, these analyses incorporate “substitution” and “scale” effects in labor, capital, and
goods markets. For a formal version of this labor demand model, see Cahuc, Carcillo and Zylberg
(2014). Since our concern here is on the effects of an economy-wide minimum wage, we add an
“income effect.” The income effect accounts for changes in the level of economic output when
wage increases lead to increased consumer demand.

Model Structure
Figure 6 summarizes our model qualitatively in a flow diagram. The green boxes refer to the
effects on workers and the red boxes refer to the effects on businesses. The automation and

The Effects of a $15 Minimum Wage by 2019 in Santa Clara County and San Jose                   18
productivity box is placed first to highlight how businesses will respond to a minimum wage.
Automation here refers only to capital-labor substitution that is induced by the minimum wage,
not to the much larger degree of automation that has taken place for decades. Productivity
growth can come from automation, from workers working harder or smarter when pay is high,
and from workers having more experience, as when minimum wages reduce employee turnover.
Figure 6. UC Berkeley IRLE minimum wage model
Source: UC Berkeley IRLE Minimum Wage Research Group
Examine next the effects on workers, shown in the green boxes and move from left to right. The
first green box refers to the higher wages received by lower-paid workers. The next green box
accounts for the net effect of taxes and reduced receipt of public benefit programs on workers’
income. Workers will pay more in taxes as their wages increase and eligibility for public benefits
will decline. The third box refers to how workers’ increased spending power out of their higher net
income translates into higher consumer demand and more jobs. We will refer to this mechanism
as the income effect of minimum wages.
Examine now the effects on businesses and again move from left to right. The higher minimum
wage will increase businesses’ payroll costs, but some of these higher costs will be offset
because employee turnover will fall, generating savings in recruitment and retention costs. Firms
may also find that higher-paid and more experienced workers will be more productive, which
could also offset payroll cost increases. In other words, one effect of a higher minimum wage is to
induce more efficient management practices.
The Effects of a $15 Minimum Wage by 2019 in Santa Clara County and San Jose 19Higher payroll costs (net of turnover and productivity savings) will lead firms to increase prices, leading to reduced consumer demand. We will refer to this adjustment mechanism as the scale effect, as it identifies reductions in the scale of output that will reduce the demand for workers. As we have already mentioned, businesses may also respond to higher minimum wages by increasing their investment in equipment. This substitution effect (think automation) also reduces their demand for workers. The income effect has a positive effect on employment, while the scale and substitution effects each have negative effects on employment. The sum of the income, scale, and substitution effects determines the net employment effect of the minimum wage, as shown in the blue box on the right side of Figure 6. Figure 6 is useful for understanding the basic structure of our model. But it leaves out some important details. First, the effects on businesses and workers in the red and green boxes of the model occur simultaneously, not sequentially. The effects in reality are therefore captured only by examining the net effects on the economy and employment. These net effects are symbolized by the blue box at the right of the diagram. Second, Figure 6 omits some feedback loops that would make the figure unwieldy, but which are included in our calculations. Model calibration and dynamics The net effect of minimum wages on employment equals the sum of the income, scale, and substitution effects. The income effect will always be positive, while the scale and substitution effects will always be negative. Whether the net effect is positive, zero, or negative therefore depends upon the relative magnitudes of its three components. These relative magnitudes in turn depend upon the quantitative responses of workers and businesses to a minimum wage increase. We refer to the model’s parameters as the inputs that determine these multiple quantitative responses. Some of these parameters, such as the propensity to substitute capital for labor, may not vary with the magnitude of the minimum wage increase. Other parameters, such as turnover cost savings, are likely to vary with the size of the increase. As with any economic model, we calibrate our model using the best data and research findings available. The details are presented in Section 5 below and in Appendix A2. The model’s parameters and dynamics must be consistent with two conditions. First, the model must be consistent with the very small effects that researchers find for the smaller pre-2015 increases in federal and state minimum wages. Second, although labor demand in low-wage labor markets may be much less responsive to wages than is commonly thought, labor demand is not completely unresponsive. The model must therefore be consistent with growing negative effects if minimum wages were to reach extremely high levels, such as at $25 or $40 per hour. The big unknown, of course, is: At what level do the effects become visibly negative and how quickly do they become more negative? The Effects of a $15 Minimum Wage by 2019 in Santa Clara County and San Jose 20
In a forthcoming paper, Reich et al. (2016) show that our calibrated model predicts extremely
small effects for minimum wage increases of up to 25 percent, to a minimum wage of $10. At
this minimum wage, the income, scale, and substitution effects are each very small. As the
minimum wage reaches higher levels, the (positive) income effect weakens since the increase in
the proportion of workers getting pay increases slows down, and because the propensity to
consume of higher-paid workers is lower than that of lower paid workers. At the same time, the
(negative) scale effect strengthens because turnover cost savings diminish and the price
elasticity of consumer demand becomes higher for higher-priced goods. 7 Our model is thus
consistent with growing negative employment effects at higher minimum wage levels.

We have tested our model’s calibration by undertaking a series of robustness tests. The tests
show that this net effect changes by small amounts when we vary the model’s parameters (Reich
et al. 2016). In the next sections, we discuss how we quantify the effects in each of the boxes in
Figure 6.

The Effects of a $15 Minimum Wage by 2019 in Santa Clara County and San Jose                 21
3. EFFECTS ON WORKERS

We begin by analyzing the effects of the Scenario A (San Jose) and Scenario B (Santa Clara
County) minimum wage increases on workers. To estimate these effects, we use publicly-
available government datasets to model (a) the number of workers who would receive pay
increases under the two minimum wage scenarios and (b) the size of those wage increases. We
exclude federal and state government employees, local school district employees, In Home
Supportive Services (IHSS) workers, and self-employed workers from our analysis, since those
groups of workers would not be eligible for local minimum wage laws.

Specifically, for each scenario, our model produces two different simulations of the future wage
distribution. First, we conduct a baseline simulation, in which we assume that the minimum wage
will increase each year according to minimum wage laws that are already in effect (see Tables 1
and 2 above). For Scenario B (Santa Clara County), we assume that cities that do not have their
own minimum wage law will follow the state minimum wage schedule in effect as of January 1,
2016 (again, this analysis does not take into account the new state minimum wage law signed in
April 2016). Second, we conduct a simulation that models the future wage distribution under
each of the two minimum wage increase scenarios.

We then compare the baseline and scenario simulations and estimate, for each yearly phase-in
step, the number of workers that would be affected by the scenario and the additional wages
they would receive as a result, above and beyond any currently scheduled minimum wage
increases. In constructing these estimates, our model adjusts for expected growth in
employment, wages and inflation over time. Our estimates also take into account what is often
referred to as a “ripple” or “compression” effect: workers who make slightly more that the
scenario minimum wage are also likely to receive wage increases. More information on our
methodology is available in Appendix A1.

3.1 Workforce Impacts
Table 3 shows the estimated number and percentage of eligible workers affected under Scenario
A (San Jose) and Scenario B (Santa Clara County). Under Scenario A, we estimate that 115,000
workers in San Jose will receive a pay raise by 2019, or about 31.1 percent of the eligible
workforce. Of these, 92,000 are directly affected workers (earning less than $15 per hour when
the scenario would be fully implemented in 2019) and 23,000 are indirectly affected (earning
slightly more than $15 per hour when the scenario would be fully implemented in 2019).

Under Scenario B, 250,000 workers, or about 25.3 percent of the eligible workforce in Santa
Clara County, would receive a pay raise by 2019. Of these, 198,000 are directly affected workers
and 52,000 are indirectly affected workers. Estimates for Santa Clara County include San Jose.

The Effects of a $15 Minimum Wage by 2019 in Santa Clara County and San Jose               22
Table 3. Estimated cumulative impacts on workers by 2019

                                                                                      Scenario A:               Scenario B:
Cumulative workforce impacts
                                                                                       San Jose              Santa Clara County
Percent of eligible workforce receiving pay increases                                    31.1%                     25.3%
Total number of workers receiving increases                                             115,000                   250,000
  Number of workers affected directly                                                   92,000                    198,000
  Number of workers affected indirectly                                                 23,000                     52,000
Average hourly wage increase (2014 dollars)                                              $1.81                     $1.92
Average annual earnings increase for workers receiving increases (2014
                                                                                        $3,000                     $3,200
dollars)
Average percent annual earnings increase for workers receiving increases                 17.8%                     19.4%
Total aggregate increase in wages (2014 dollars)                                      $345 million              $796 million
Source: Authors’ analysis of ACS, OES, and QCEW data. See Appendix A1 for details.
Note: Santa Clara County impacts include those for the entire county, including San Jose. Eligible workers are those that work in
the city/county where the new minimum wage policy is implemented. Directly affected workers earned between 50% of the old
minimum wage and 100% of the new minimum wage. Indirectly affected workers earned between 100% and 115% of the new
minimum wage. Average annual earnings is per worker, not per job.

We also estimate the additional earnings that affected workers would receive under each
scenario, relative to their earnings under current minimum wage schedules. Table 3 shows the
estimated cumulative increase in affected workers’ hourly wages, annual earnings, and
percentage increase in annual earnings, as well as the cumulative total earnings increase for all
affected workers. By full implementation in 2019, we estimate that the wages of affected
workers will have risen by about $1.92 per hour in Santa Clara County and $1.81 per hour in San
Jose. That amounts to an estimated additional $3,000 in earnings per year for impacted workers
in San Jose and $3,200 for impacted workers in Santa Clara County. In total, we estimate that
affected workers will earn an additional $796 million by 2019 in Santa Clara County. In San Jose,
we estimate that affected workers will earn an additional $345 million by 2019. All estimates are
listed in 2014 dollars. 8

3.2 Impact on Benefits Eligibility and Poverty
Some policymakers have expressed concern that affected workers and their families could
ultimately be worse off after minimum wage increases if they are no longer eligible for means-
tested social assistance programs. However, research suggests that most workers will come out
well ahead financially, because the benefits from most social assistance programs phase out as
recipients’ income rises. This means that as the earnings of affected workers rise, the benefits
they receive will gradually decline instead of being eliminated all at once. 9 In fact, the
Congressional Budget Office (Congressional Budget Office 2012) has estimated that the average
marginal tax rate for low-and moderate-income workers is 34.8 percent, meaning that affected
workers will keep 65.2 cents of each additional dollar they earn. So while taxes and reductions in
social assistance benefits will erode some of the additional earnings for affected workers, most

The Effects of a $15 Minimum Wage by 2019 in Santa Clara County and San Jose                                                23
families will still see significant gains in income under the scenario minimum wage increases. Finally, Arin Dube has estimated that for each percentage increase in the minimum wage, household poverty is reduced by -0.24 percent (2013). Applying this measure of the elasticity of poverty with respect to the minimum wage, we estimate that an increase to $15 would reduce the number of households in poverty by 8.5 percent in San Jose and 8.2 percent in Santa Clara County. 3.3 Demographics of Affected Workers Next, we analyze the demographic and job characteristics of the workers who would be affected by the two minimum wage scenarios (including both directly and indirectly affected workers). Table 4 profiles workers affected by Scenario A in San Jose. In the first column, we display the characteristics of all eligible workers. For example, 58.3 percent of San Jose workers are men and 41.7 percent are women. In the second column, we show the distribution of affected workers by 2019. For example, we estimate that 51.4 percent of affected workers are men and 48.6 percent are women. In the third column, we present the share of each demographic group that will receive a wage increase. For example, we estimate that 27.4 percent of male workers and 36.2 percent of female workers eligible for the proposed increase will receive a raise. Contrary to the common perception that minimum wage workers are mainly teens, we estimate that 95.6 percent of affected workers in San Jose are in their twenties or older and 56.3 percent are in their thirties or older. The scenario will be particularly beneficial to Latino/a workers in San Jose, as half of these workers (50.8 percent) will receive a raise. Workers of all education levels would benefit from the scenario, with less educated workers benefitting the most. About half of affected workers have no college education (51.2 percent) We estimate that over a third of affected workers in San Jose have children (33.9 percent) and 37.1 percent are married. Affected workers in San Jose disproportionately live in low-income families, with 40.3 percent at or below 200 percent of the federal poverty level. Fully 91.8 percent of workers in poor families will receive a pay increase. On average, affected workers in San Jose bring home 48.5 percent of their family’s income, suggesting that they are primary breadwinners in their families and are not providing supplementary income. We estimate that the median annual earnings of affected workers ($18,100 in 2014 dollars) is less than half (35.8 percent) of the median earnings for all workers in San Jose. Affected workers are disproportionately employed in part-time or part-year jobs, and are much less likely to have health insurance provided by their employer than the overall San Jose workforce. 10 The Effects of a $15 Minimum Wage by 2019 in Santa Clara County and San Jose 24
Table 4. Demographic and job characteristics of affected workers in Scenario A - San Jose

                                                    Percent of eligible      Percent of eligible     Percent of group
                                                        workers            workers getting a raise    getting a raise
Gender
Male                                                       58.3                       51.4                27.4
Female                                                     41.7                       48.6                36.2
Median Age                                                  39                         32
Age
16-19                                                      1.6                        4.4                 86.6
20-29                                                      22.4                       39.3                54.4
30-39                                                      27.2                       22.8                26.1
40-54                                                      35.6                       23.7                20.7
55-64                                                      13.3                       9.8                 22.9
Race/Ethnicity
White (Non-Latino)                                         33.8                       20.9                19.2
Black (Non-Latino)                                         2.6                        3.1                 37.5
Latino/a                                                   29.9                       50.8                52.8
Asian (Non-Latino)                                         31.0                       22.7                22.7
Other                                                      2.6                        2.4                 28.7
Education
Less than High School                                      11.1                       23.9                66.7
High School or G.E.D.                                      16.5                       27.3                51.4
Some College                                               20.2                       26.7                41.0
Associate’s Degree                                         7.1                        7.7                 33.4
Bachelor’s Degree or Higher                                45.0                       14.4                9.9
Country of Birth
U.S. Born                                                  51.8                       48.0                28.8
Foreign Born                                               48.2                       52.0                33.5
Family Structure
Married                                                    55.0                       37.1                20.9
Has Children                                               44.2                       33.9                23.8
Family Income Relative to Poverty Level (FPL)
Less than 100% of FPL                                      3.8                         11.4               91.8
100% to 150% of FPL                                        5.1                         14.3               86.6
150% to 200% of FPL                                        6.0                         14.7               75.8
200% to 300% of FPL                                        13.0                        24.2               57.7
Greater than 300% of FPL                                   72.1                        35.5               15.3
Average Worker Share of Family Income                      62.9                        48.5
Median Individual Annual Earnings (2014 Dollars)         $50,507                     $18,100
Full-Time / Part-Time Worker
Full-Time (35 or More Hours per Week)                      82.8                       64.6                24.2
Part-Time (Fewer than 35 Hours per Week)                   17.2                       35.4                64.0
Full-Year / Part-Year Worker
Full-Year (50-52 Weeks per Year)                           87.1                       80.2                28.6
Part-Year (Fewer than 50 Weeks per Year)                   12.9                       19.8                47.7
Health Insurance Provided by Employer
Yes                                                        77.1                       52.0                20.9
No                                                         22.9                       48.0                65.1
Source: Authors’ analysis of ACS, OES, and QCEW data. See Appendix A1 for details.

The Effects of a $15 Minimum Wage by 2019 in Santa Clara County and San Jose                                      25
In Table 5, we show the demographic and job characteristics of the affected workers under Scenario B in Santa Clara County. Affected workers in Santa Clara County as a whole share many of the same characteristics as affected workers in San Jose. Nearly half of Latino/a workers would receive a raise as a result of the proposed law. Over half are in their thirties or older (56.6 percent) and most are in their twenties or older (95.5 percent). About a third have children (33.9 percent). As in San Jose, a disproportionate number of affected workers in Santa Clara County live in families at or below 200 percent of the federal poverty level (39.9 percent), and most workers living in families below the poverty line will receive a pay increase (91.1 percent). On average, affected workers bring home almost half of their family’s income (48.0 percent). The earnings gap between affected workers and the overall workforce is higher for Santa Clara County than for San Jose. We estimate that the median annual earnings of affected workers ($17,821 in 2014 dollars) is less than one third (30.7 percent) of the median earnings for all workers in Santa Clara County. As in San Jose, affected workers in Santa Clara County are disproportionately employed in part-time or part-year jobs, and are much less likely to have health insurance provided by their employer than the overall Santa Clara County workforce. 11 The Effects of a $15 Minimum Wage by 2019 in Santa Clara County and San Jose 26
Table 5. Demographic and job characteristics of affected workers in Scenario B - Santa Clara County

                                                     Percent of eligible     Percent of eligible     Percent of group
                                                         workers           workers getting a raise    getting a raise
Gender
Male                                                        57.3                    49.2                  24.4
Female                                                      42.7                    50.8                  33.3
Median Age                                                   39                      32
Age
16-19                                                       1.4                     4.5                   86.7
20-29                                                       21.6                    38.9                  50.6
30-39                                                       28.0                    22.7                  23.3
40-54                                                       35.9                    24.1                  18.9
55-64                                                       13.2                    9.8                   20.6
Race/Ethnicity
White (Non-Latino)                                          34.9                    21.1                  17.3
Black (Non-Latino)                                          2.5                     3.2                   35.6
Latino/a                                                    26.2                    49.3                  50.8
Asian (Non-Latino)                                          33.6                    23.9                  20.6
Other                                                       2.8                     2.5                   25.8
Education
Less than High School                                       9.3                     22.9                  66.0
High School or G.E.D.                                       14.2                    26.5                  50.0
Some College                                                18.8                    26.8                  39.0
Associate’s Degree                                          7.0                     8.0                   31.3
Bachelor’s Degree or Higher                                 50.7                    15.9                  9.2
Country of Birth
U.S. Born                                                   51.5                    48.2                  26.3
Foreign Born                                                48.5                    51.8                  30.2
Family Structure
Married                                                     56.2                    37.0                  18.7
Has Children                                                44.8                    33.9                  21.4
Family Income Relative to Poverty Level (FPL)
Less than 100% of FPL                                      3.3                      11.2                  91.1
100% to 150% of FPL                                        4.4                      14.2                  86.4
150% to 200% of FPL                                        5.2                      14.5                  75.2
200% to 300% of FPL                                        11.7                     24.0                  55.3
Greater than 300% of FPL                                   75.4                     36.1                  13.7
Average Worker Share of Family Income                      63.9                     48.0
Median Individual Annual Earnings (2014 Dollars)         $57,956                  $17,821
Full-Time / Part-Time Worker
Full-Time (35 or More Hours per Week)                       84.1                    64.7                  21.9
Part-Time (Fewer than 35 Hours per Week)                    15.9                    35.3                  60.3
Full-Year / Part-Year Worker
Full-Year (50-52 Weeks per Year)                            87.4                    79.7                  25.8
Part-Year (Fewer than 50 Weeks per Year)                    12.6                    20.3                  44.8
Health Insurance Provided by Employer
Yes                                                         79.8                    53.2                  19.0
No                                                          20.2                    46.8                  62.7
Source: Authors’ analysis of ACS, OES, and QCEW data. See Appendix Section A1 for details.

The Effects of a $15 Minimum Wage by 2019 in Santa Clara County and San Jose                                      27
3.5 Downstream effects The increases in earnings shown in Tables 4 and 5 would be substantial and would have an immediate impact on the lives of low-wage workers and their families in San Jose and Santa Clara County. But it is important to recognize that there are longer-term effects of minimum wage increases as well. Low wages have been shown to affect workers negatively in a variety of ways, but the health impacts are most pronounced. All else being equal, low wages (and in turn poverty) result in increased rates of high blood pressure and high levels of stress, as well as shorter life expectancy (Leigh and Du 2012). A recent study from the United Kingdom found that by reducing the financial strain on low-wage workers, an increase in the minimum wage improves mental health at a level comparable to the effect of antidepressants on depression (Reeves et al. 2016). In another study, additional income led to fewer arrests for parents and increases in parental supervision of their children (Akee et al. 2010). Similarly, increases in Earned Income Tax Credit (EITC) program payments led to improvements in the mental health of mothers (Evans and Garthwaite 2010; Congressional Budget Office 2012). Multiple rigorous studies also establish a causal negative effect of low incomes on outcomes for children. A recent review of peer-reviewed articles found that 29 of 34 studies established a negative effect of poverty on children’s outcomes (K. Cooper and Stewart 2013). Using data from a randomized control trial of the Minnesota Family Investment Program, researchers found positive, significant effects on children’s social behavior and school engagement due to increases in income (Morris and Gennetian 2003). Other researchers analyzed data from ten such studies and found significant effects of increased income on school achievement (Rodgers 2004). Generally, these studies show that additional income has a positive effect on the outcomes of children in households of all income levels. However, multiple studies also suggest that additional income has a larger effect in very-low-income households compared to middle-income households (Dahl and Lochner 2012); (Akee et al. 2010); (Costello et al. 2003). Some evidence indicates that additional income early in life is important to cognitive outcomes, whereas additional income in later childhood may be more important in terms of behavioral outcomes (K. Cooper and Stewart 2013). The Effects of a $15 Minimum Wage by 2019 in Santa Clara County and San Jose 28
4. EFFECTS ON BUSINESSES

How a higher minimum wage affects a firm depends on how much the firm’s operating costs
change and on how the firm responds to those changes. In this section, we first identify the
industries that will be highly affected by the two minimum wage increase scenarios. We then
estimate the impact of the minimum wage increases on firms’ operating costs across the entire
economy and for highly affected industries, taking into account savings from reduced turnover.
We describe the effects on businesses separately for Scenario A (San Jose) and Scenario B
(Santa Clara County).

4.1 Scenario A: San Jose
Minimum wage increases do not affect all industries equally. We therefore begin with an analysis
of the impact of Scenario A at the industry level. Table 6 shows the estimated distribution of
affected workers across San Jose’s industries by 2019. In the first column, we show the
percentage of the overall eligible San Jose workforce in each industry. The second column
displays our estimate of the distribution across industries of workers getting a raise under the
scenario. The third column presents our estimate of the percentage of workers getting a raise
within each industry.

Over half of affected workers are employed in just three service sector industries: food services
(21.0 percent), retail (19.1 percent), and administrative and waste management services (14.7
percent), which is comprised mainly of building services contractors and employment agencies.
The service sector also dominates the list of industries that have high rates of low-wage work—
that is, industries where we estimate a high share of workers will get a raise (for example, 77.8
percent in food services and 50.7 percent in administrative and waste management services).

We also examine the sectoral distribution of affected workers in Table 6. Our estimates show that
affected workers are largely employed in the private, for-profit sector. Nonprofit and public sector
workers are less likely to be affected than the overall San Jose workforce.

The Effects of a $15 Minimum Wage by 2019 in Santa Clara County and San Jose                   29
Table 6. Cumulative impact estimates for major industries in San Jose by 2019

                                                                                         Percent of eligible
                                                                  Percent of eligible                           Percent of industry
                                                                                         workers getting a
                                                                      workers                                     getting a raise
                                                                                               raise
All Sectors
Agriculture, Forestry, Fishing, Hunting, and Mining                      0.2                    0.3
Construction                                                             6.0                    6.5                    33.3
Manufacturing                                                            16.5                   6.1                    11.5
Wholesale Trade                                                          4.6                    3.2                    21.2
Retail Trade                                                             12.7                   19.1                   46.8
Transportation, Warehousing, and Utilities                               2.8                    2.8                    31.0
Information                                                              3.1                    0.9                     9.5
Finance, Insurance, Real Estate, and Rental and Leasing                  4.8                    3.1                    20.1
Professional, Scientific, and Management                                 11.9                   2.7                     7.2
Administrative and Waste Management Services                             9.0                    14.7                   50.7
Educational Services                                                     1.9                    1.6                    25.9
Health Services                                                          8.5                    5.5                    20.4
Social Assistance                                                        1.7                    2.4                    45.4
Arts, Entertainment, Recreation, and Accommodation                       2.8                    4.5                    49.2
Food Services                                                            8.4                    21.0                   77.8
Other Services                                                           3.1                    4.7                    47.9
Public Administration                                                    2.0                    0.7                    10.7
Total                                                                   100.0                  100.0
By Sector
Private, For-Profit                                                      90.0                   93.8                   32.4
Private, Non-Profit                                                      6.0                    4.6                    23.6
Public                                                                   4.0                    1.6                    12.6
Total                                                                   100.0                  100.0
Source: Authors’ analysis of ACS, OES, and QCEW data. See Appendix A2 part B for details.
Note: Blank value for “Percent of Industry That is Getting a Raise” indicates insufficient sample size for that category.

Changes in a firm’s operating costs due to a minimum wage increase are determined by the
following factors: the share of workers receiving wage increases, the average size of the wage
increases, and the labor share of operating costs within the firm. As we saw in Table 6, in most
industries only a minority of workers in San Jose will receive a wage increase under Scenario A.
Furthermore, among workers that do receive an increase, not everyone will receive the full
increase (because many of the affected workers already earn more than the current minimum).
Specifically, we estimate that the total wages of all affected workers will increase by 15.3 percent
in San Jose. However, affected workers’ wages represent only 8.3 percent of all workers’ wages
in San Jose. As a result, total wages in San Jose will increase by 1.3 percent.

Economic research suggests that some of the increased labor costs that businesses face as a
result of a higher minimum wage can be offset through lower turnover. In our calculations below,

The Effects of a $15 Minimum Wage by 2019 in Santa Clara County and San Jose                                                  30
You can also read