D5.1: Typology canvas of business models - CRAVEzero
←
→
Page content transcription
If your browser does not render page correctly, please read the page content below
D5.1: Typology canvas of
                 business models

          COST REDUCTION AND MARKET
      ACCELERATION FOR VIABLE NEARLY ZERO-
               ENERGY BUILDINGS
              Effective processes, robust solutions, new business models and reliable life cycle costs,
                 supporting user engagement and investors’ confidence towards net zero balance.

                                         CRAVEzero - Grant Agreement No. 741223
                                              WWW.CRAVEZERO.EU

                                                                                       Co-funded by the Horizon 2020

                                                                     Framework Programme of the European Union

This document has been prepared for the European Commission however it reflects the views only of the authors, and the Commission cannot be held
                                 responsible for any use which may be made of the information contained therein.                        1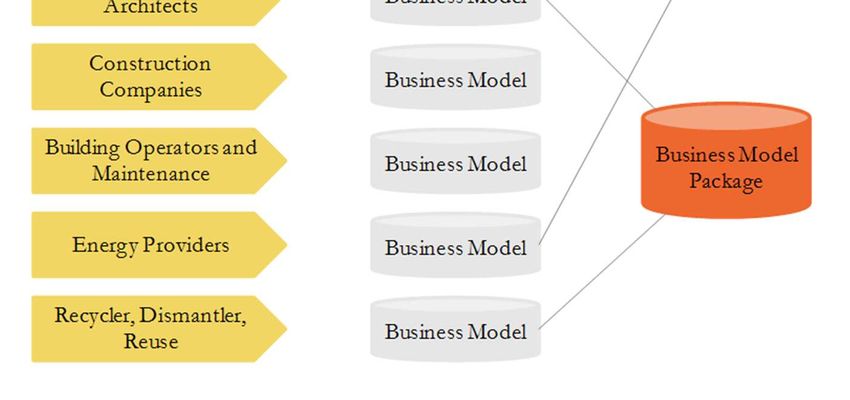
D5.1: Typology canvas of
             business models

                                                       Authors:
                               Arnulf   Dinkel1,   Benjamin Köhler1, Anneke Quast 1

                                               Contributors:
                    Lea Kießling1, Annalisa Andaloro2, Gerold Köhler3, Thomas Stöcker3

    1Fraunhofer Institute for Solar Energy Systems ISE, Heidenhofstraße 2, 79110 Freiburg, Germany
                     2eurac research, Via A. Volta 13/A, 39100 Bozen/Bolzano, Italy

          3Köhler&Meinzer GmbH, Junkersring 14, 76344 Eggenstein-Leopoldshafen, Germany

                                                    October, 2018

 Disclaimer Notice: This document has been prepared for the European Commission however it reflects the views only of the
authors, and the Commission cannot be held responsible for any use which may be made of the information contained therein.

                                                                                                                             2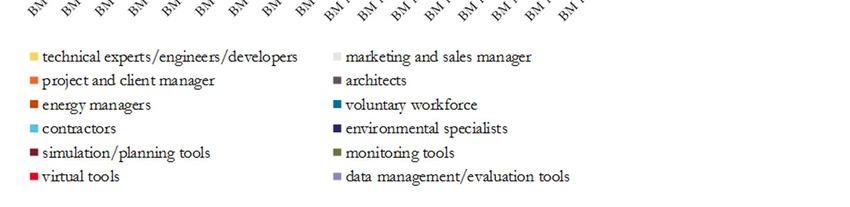
ACKNOWLEDGMENT
Large parts of the report are based on the results of the Master-Thesis of Ms. Anneke Quast, which was
conducted in the frame of Work Package 5 nZEB Business Models of the CRAVEzero project.

FOREWORD
This report summarizes activities and results of Workpackge 5 nZEB Business Models of the Horizon2020
CRAVEzero project.

A good starting point to get an overview of nZEB             framework conditions. CRAVEzero evaluates exist-
business models (BMs) is Figure 1. It gives an im-           ing business models in several EU countries, at least
pression of the most relevant stakeholders in the            from the biggest markets, taking into account re-
different steps of a building’s life cycle. In order to      gional particularities. All stakeholders are to be
promote the nZEB market win-win situations for               considered, ranging from municipalities to end
the stakeholders in each life cycle phase should be          users and building occupants. Each group of stake-
translated into business models. Stakeholders have           holders should be able to define (or be aware of)
been invited to round table discussions and asked            business models for low LCC nZEBs that propose
for their preferred business idea and the relevant           profitable situations and benefits for themselves.

Figure 1: Business model overview (source: Fraunhofer ISE)

A range of business models to be developed in                construction. The business models create answers
CRAVEzero considers technologies as well as                  to the key questions: Who are your customers?
planning and construction process, thus affecting            What are their needs? What do we offer? Value
requirements regarding technologies, planning and            propositions to serve customer problems and satis-

                                                                                                                3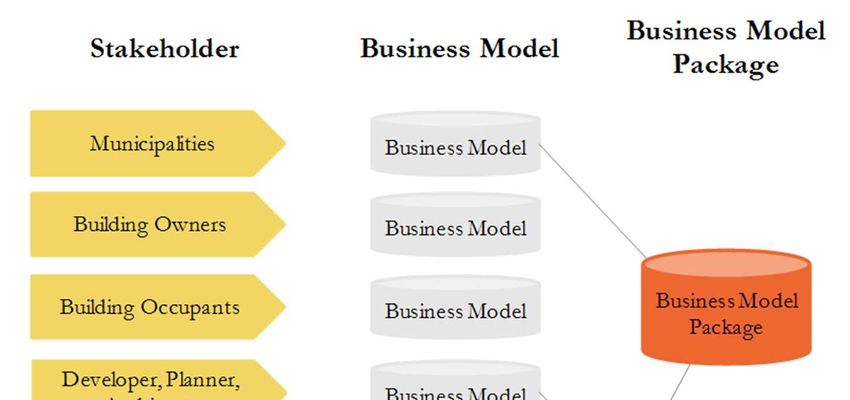
fy customer needs (in terms of performance, cus-           can be shifted from the investment phase to the
tomization, speed, comfort, design, and price) were        operational or other phases. The business models
defined. It is conceivable that stakeholders can           consider not only economic aspects but take into
either be a provider of a service or costumer or           account also energy, environmental and social as-
both.                                                      pects. Furthermore, a comprehensive analysis of
Robust business models are needed in order to              possible subsidies and financial mechanisms (pros
provide reliable information on the costs & benefits       and cons) will be carried out. The models address
that an investor and all involved stakeholders can         all involved stakeholders during the life cycle of the
have in the building process for a low LCC nZEB.           building and are able to generate win-win situa-
This allows also reducing the uncertainties that           tions.by increasing confidence and reliability.
impede the wide investments. Costs and benefits

Figure 2: Business models and CRAVEzero overall approach (source: Fraunhofer ISE)

Copyright by the Horizon 2020 Framework Programme of the European Union

Published by Arnulf Dinkel, Benjamin Köhler, Anneke Quast, Fraunhofer Institute for Solar Energy Sys-
tems ISE, Heidenhofstraße 2, 79110 Freiburg, Germany

Disclaimer Notice: This document has been prepared for the European Commission however it reflects the
views only of the authors, and the Commission cannot be held responsible for any use which may be made
of the information contained therein.

                                                                                                               4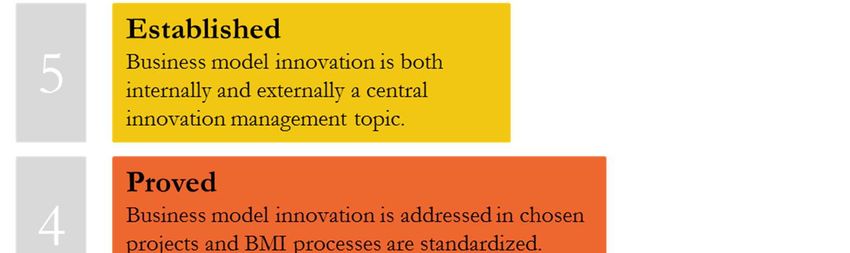
EXECUTIVE SUMMARY
This report features a method to analyze business     Model Canvas. The BMs have different stake-
models related to nZEBs, which has been devel-        holder perspectives, namely:
oped together with the involved partners. The              • Real Estate Developers,
project partners used this method to describe              • Planners,
their own business models and validate them. A             • General Contractors,
challenge for all partners was the description of
                                                           • Engineering and Construction,
revenue streams and costs. The business models
                                                           • FM/ Building Operator and
from the project partners are sometimes related
to the provided case studies. One lesson was that          • Urban Planner.
the business models for low LCC nZEBs are             Thereby they are also related to different stages in
often embedded into the “normal” business ap-         a building’s life cycle.
proach and it seems difficult to separate the         With the applied method critical success factors
nZEB business approach from the “normal”              (strengths and key factors) for nZEB related
business approach especially regarding costs and      Business Models were identified (see Figure 3 and
revenues.                                             Figure 4). Key strengths, which are essential in
However, through the described methodology            several provided models, are the “Guarantee on
and the incorporated attractiveness portfolio tool,   Comfort and Performance”, “Valuable Project
it is possible to assess business models.             Management”, Cost Reduction/ Guarantee of
In total, 17 Business Models (BMs) are analysed       Costs” and “Human Expertise and Experience”.
and described mainly based on the Business            “Competences/ Know-how / Experiences” was
                                                      identified as the key factor for realising cost effi-
                                                      cient nZEBs.

Figure 3: Cross-Analysis of BMs' strengths

                                                                                                         5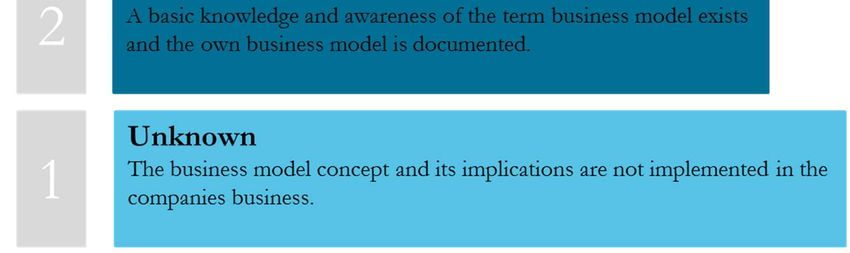
Figure 4: Cross-Analysis of BMs' key factors

In the following chapters the developed methodol-      Thereby critical success factors and the attractive-
ogy and the different necessary steps and tools are    ness of the analysed BMs are identified and rated. A
briefly described. Furthermore, the different col-     detailed description of the developed evaluation
lected BMs are clustered (according to stakeholder     method will be published in an additional paper.
perspective) and their major characteristics accord-
ing to the Business Model Canvas are provided and
compared with each other.

                                                                                                         6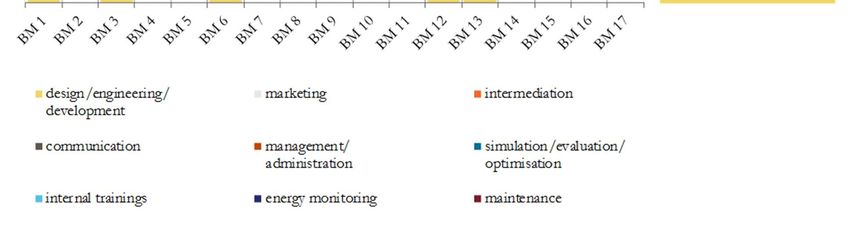
Contents
Introduction ......................................................................................................................................................................9
     1.1.        Objective .........................................................................................................................................................9
     1.2.        Tasks ............................................................................................................................................................. 10
     1.3.        Business Model Definition ........................................................................................................................ 11
2.      Methodology ......................................................................................................................................................... 11
     2.1.        Business View .............................................................................................................................................. 13
                         Business Model Canvas..................................................................................................................... 13
     2.2.        Feedback ....................................................................................................................................................... 13
3.      Business model repository, overview ................................................................................................................ 14
     3.1.        Business Models of partners ..................................................................................................................... 16
                         Real Estate Developer ....................................................................................................................... 16
                         Planner ................................................................................................................................................. 24
                         General Contractor ............................................................................................................................ 28
                         Engineering and Construction ......................................................................................................... 32
                         Facility Management and Building Operation............................................................................... 34
                         Urban Planning .................................................................................................................................. 38
     3.2.        Comparative Analysis of Business Models ............................................................................................. 40
     3.3.        Cluster of Business Models ....................................................................................................................... 44
     3.4.        Maturity of Models ..................................................................................................................................... 44
     3.5.        Life cycle Phases Covered ......................................................................................................................... 46
     3.6.        Economic Impact ....................................................................................................................................... 46
     3.7.        Critical Success Factors and Pitfalls ......................................................................................................... 47
                         Prioritization of Criteria .................................................................................................................... 49
     3.8.        Attractiveness Portfolio ............................................................................................................................. 50
                         Feedback.............................................................................................................................................. 52
     3.9.        Business Models of Other Stakerholders ................................................................................................ 53
4.      Link to other WPs ................................................................................................................................................ 53
     4.1.        Links to WP 2 Life Cycle Cost of nZEBs............................................................................................... 53
     4.2.        Link to WP 7, CRAVEzero Pinboard ..................................................................................................... 53
5.      Discussion ............................................................................................................................................................. 53
6.      Terminology .......................................................................................................................................................... 55
     6.1.        Terms and Definition ................................................................................................................................. 55
     6.2.        Acronyms ..................................................................................................................................................... 56
     6.3.        Normative References ................................................................................................................................ 56

                                                                                                                                                                                     7
7. References ............................................................................................................................................................. 57
LIST OF FIGURES
Figure 1: Business model overview ...............................................................................................................................3
Figure 2: Business models and CRAVEzero overall approach.................................................................................4
Figure 3: Cross-Analysis of BMs' strengths .................................................................................................................5
Figure 4: Cross-Analysis of BMs' key factors ..............................................................................................................6
Figure 4: Business model canvas method .................................................................................................................. 12
Figure 5: The business Model Canvas as proposed by Osterwalder and Pigneur .............................................. 13
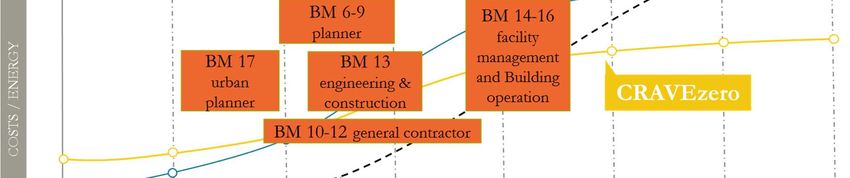
Figure 6: Business model allocation during building, planning and construction phase ................................... 14
Figure 7: Comparative analysis of different Value Propositions ........................................................................... 40
Figure 8: Comparative analysis of Customer Relationships ................................................................................... 41
Figure 9: Comparative analysis of Distribution Channels ...................................................................................... 42
Figure 10: Comparative Analysis of Revenue Streams ............................................................................................ 42
Figure 11: Comparative Analysis of Key Activities ................................................................................................. 43
Figure 12: Comparative Analysis of Key Resources ................................................................................................ 44
Figure 13: Maturity stages of the implementation of the business model concept in companies.................... 45
Figure 14: Life cycle phases of nZEBs ...................................................................................................................... 46
Figure 15: Cross-Analysis of BMs' strengths ............................................................................................................ 48
Figure 16: Cross-Analysis of BMs' key factors ......................................................................................................... 48
Figure 17: Attractiveness Portfolio ............................................................................................................................. 51
Figure 18: Summarized attractiveness portfolio ....................................................................................................... 52
LIST OF TABLES
Table 1: Steps of the evaluation method ................................................................................................................... 12
Table 2: Analyzed business models and their categorization ................................................................................. 15
Table 3: Result of the Prioritization ........................................................................................................................... 50
8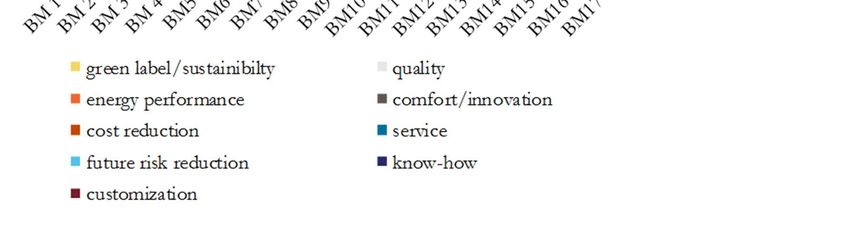
INTRODUCTION

The goal was to develop an operative methodology         ing but contain valuable knowledge and infor-
to achieve the best conditions towards cost optimal      mation about existing and tested business models.
nZEBs exploring the concept of integrating nZEB-         Therefore, another result of this report is the de-
technologies and business models in the whole            velopment of a method that allows for a holistic
planning, construction and operation process.            evaluation of business models. Hereby, both quan-
The evaluation and generation of enhanced and            titative and qualitative variables are considered. It
innovative business models are also part of the          enables involved and interested companies to ana-
study of nZEBs. In order to generate new business        lyze their proposed business model in order to see
models, it is necessary to identify what types of        whether it is success promising and which steps
different business models already exist in the mar-      need to be taken in order to enhance it.
kets and what makes them successful or incon-            In this report the collected business models of the
sistent. Therefore, in contrast to studies that have     CRAVEzero project partners are described. Cross-
been conducted before, the focus is not only on          comparisons of their strengths and key factors are
general business models in the building and energy       conducted in order to identify repetitive patterns
sector but also on concrete examples delivered           and differences for various stakeholder perspectives
from industry partners of CRAVEzero. The results         and regions. A detailed description of the devel-
of the evaluation are the basis for the generation of    oped evaluation method including steps that are not
new models that are not only theoretically interest-     described in this paper will be published in a sepa-
                                                         rate document.

 1.1. OBJECTIVE
There are many different business models and often       new examples for ‘Win-win-win’ nZEB business
they are closely linked to existing market structures,   show advantages to different types of stakeholders,
to a single stakeholder in the process and to poli-      for example, planners, developers, construction
cies. In other words, business models are often          companies and users, while positively contributing
country, stakeholder and context specific. Within        to the environment and society. It was analyzed
WP 5 several steps will be developed. In a first step    which business models exist in the major markets.
an inventory of different existing business models is    In a next step, this knowledge can be applied to
made, considering: (i) the CRAVEzero case studies,       help create a mass market for nZEBs. This will be
(ii) the approach in the participating countries and     achieved through the co-creation of potential effec-
(iii) global examples of successful case stories. Co-    tive business models and services with national
operative strategies are those, where different          stakeholders, accompanied by the definition of
stakeholders bundle their expertise’s to create posi-    guidelines for policymakers to allow for a more
tive outcomes, creating synergies and ‘win-win’          effective up-scaling of proven business models and
cross company boundaries. Already existing and           services.

                                                                                                            9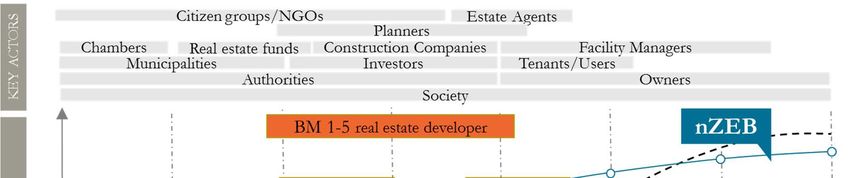
1.2. TASKS
In order to achieve the best possible results, this
work has been divided into two general tasks:

Task 5.1: Identify potential for ‘Win-win-win’         And chronologically in a second phase – not part of
sustainable business for all involved stakehold-       this report:
ers according to the process in WP3 (Result 7)         Task 5.2: New business models for nZEBs
    • Comparative analysis of current European         (Result 7)
        business models for nZEBs and their                 • Development of innovative business mod-
        frameworks/ecosystems with a clear focus                els for nZEBs and new requirements trans-
        on quantifying and qualifying effectiveness.            lation for the new market segments (e.g.
        Identification of stakeholders (policymak-              nZEB energy flat rates, flexible feed in tar-
        ers in the field, end-user representatives,             iffs, new nZEB contracting solutions, “all
        collectives, SME suppliers and receivers of             in” rent, Zero energy cost model, nZEB-
        energy services, academia, business devel-              public-private-partnership (PPP))
        opers, consultants, technology developers           • Development of shared contract models
        and NGOs in the field) for proven nZEB                  between design/engineering and construc-
        business models.                                        tion for integrated team processes, and de-
    • Analysis on how the different parameters                  velopment of collaboration models be-
        of success of business models and services              tween private clients and developers or
        relate to each other, regarding economic                suppliers and use of public-private partner-
        profitability, scale of impact and real sav-            ships. Optimize use of partly outsourcing
        ings, business creation, growth rate, syner-            in design/engineering and construction.
        gies with other values, adoption rate etc.          • Business models for building up coopera-
    • In-depth comparative analysis of similar                  tives to reduce investment costs due to col-
        business models in different countries, de-             lective purchasing. Coordination issues be-
        termining patterns, drivers, and pitfalls.              tween several construction companies
    • Identification of key factors that make                   and/or consultants, especially in case dif-
        business models succeed in the participat-              ferent construction technologies are used
        ing countries through an in-depth analysis              within the same neighborhood
        of country specific markets and policies for        • Definition of the canvas structure for the
        energy services and their influences on                 nZEB construction business model
        business models                                     • Investigation of the fund services available
    • Identification of market uptake potential                 for nZEB construction.
        for nZEB buildings in the biggest markets
        in Europe: Germany, UK, France, Italy and
        Spain; and considering the major regions,
        for example: Northern and Western Eu-
        rope, Southern Europe, and Eastern Eu-
        rope.

                                                                                                          10
1.3. BUSINESS MODEL DEFINITION
Reviewing literature especially in the field of entre- Furthermore, it must be clear how the company is
preneurship and strategic management, in which going to generate money/ profit and how value can
the topic is regularly discussed, several different be provided for customers at appropriate costs
opinions and definitions for the term business (Magretta, 2002, p. 4). Casadesus-Masanella and
model can be found. Magretta (2002, p. 4) for in- Ricart (2007, pp. 2-3) define a business model as
stance states that a business model describes how follows: “Business models refer to the logic of the
the different elements work together in order to firm, the way it operates and how it creates value
give a value to customers. According to Magretta for its stakeholders” and Osterwalder, whose theory
there are two areas that need to be described in a has become very popular, defines a business model
business model: all activities that are associated with as something that “[…] describes the rational of
making something like the design, the purchase of how an organization creates, delivers, and captures
raw materials and the manufacturing and all activi- value” (Osterwalder & Pigneur, 2010). Based on the
ties that associated with selling something as for different opinions found, business models can be
instance finding and reaching customers, transact- defined as follows:
ing, distributing products or delivering services.
A business model is a simplified depiction of the way a complex and profit-oriented system generates, delivers and captures
value. It illustrates the system’s essential elements and their interactions and thereby enables the beholder to grasp and enhance
it.
Being able to describe one’s business model helps ners in order to find financial aid. The information
understanding the underlying logic, discussing and provided in a business plan therefore needs to be
analysing the success potential and adjusting the more precisely and reliable. For instance, analytical
relevant parameters in order to enhance the busi- calculations of the financial bottom line need to be
ness model or create a new one. included. Moreover, the business strategy and the
The term ‘business plan’ is often confused with the business model, by which the strategy is imple-
term business model. While business models are mented, should be considered. According to that,
simplified, descriptive ways of showing how a the business model can be seen as the heart of the
company plans to create, provide and levy value, business plan. Within CRAVEzero the focus is on
the financial plan is only covered sketchily. A busi- the evaluation and development of nZEB business
ness plan, on the contrary, is a document that a models. Consequently, the data required and de-
company typically needs to convince banks and scribed is more qualitatively in nature.
private investors as well as possible strategic part-
2.METHODOLOGY
In order to evaluate nZEB business models the 5) Development of evaluation method
method is clustered into several steps: 6) Application of developed method
1) CRAVEzero partners describe their busi- An overview of the workflow to develop an nZEB
ness model related business model is given in Figure 5.
2) CRAVEzero partners find and describe The relevant steps of the developed evaluation
business models of other stakeholders method are shown in Table 1 below. When a busi-
3) CRAVEzero partners find and describe ness model is developed, these steps can be consid-
combined models; e.g. 2 or more partners ered to evaluate its success potential.
4) Evaluation at experts round table
11Figure 5: Business model canvas method (source: Fraunhofer ISE)
Table 1: Steps of the evaluation method (own depiction)
STEP TOOL ANTICIPATED RESULTS
Market view PESTEL Political, Economic, Socio-cultural, technical and environ
mental scope of the markets
Porters’ Five Forces Identification of the industries attractiveness
Business Business Model Canvas Which characteristics does a business model have? How is it
View structured? What are the essential factors of the Business
Model?
Consistency Check Check for inner logic and consistency
MICMAC (including in- Identification of critical success factors (CSF), interrelations
fluence-dependence-chart and stability of the system Business Model
and causal loop diagrams)
Customer Problem-solution-fit Evaluation of the level of fit of customers’ desires and solu-
View tions offered with the value proposition
Profitability Approximation due to Comparative analysis of the cost and revenue side of the
View insufficient data business models from a project (case-study) perspective. How
profitable is it for the company?
Decision Attractiveness Portfolio Illustration of internal (Profitability view) and external (Cus-
making tomer view) attractiveness
These steps lead to a comprehensive and wide- • Are there enough reasons for the customer
spread view on nZEB business models and could to choose the product/service over anoth-
be checked by the questions: er?
• Is the business model well thought- In the following chapters the first steps of the eval-
through? uation method are shown. Here, a focus is on the
• Is the business model profitable for the description of provided business model canvases
company? and the identification of common and differing
• Is the customer’s life enhanced by using aspects in regard to stakeholder perspectives and
the product/service and is he willing to pay geographic regions. The entire developed evalua-
the price? tion method is described in more detail in a sepa-
rate document.
122.1. BUSINESS VIEW
For the business model view at first the business Model Canvas as proposed by Osterwalder and
models (BMs) of the project partners contributing Pigneur (2010) is used.
to CRAVEzero are collected. For that, the Business
BUSINESS MODEL CANVAS
Most business models (BMs) components that are are reached in order to levy profit. Furthermore it is
regularly mentioned in literature are covered by the shown which kinds of activities and partnerships
Business Model Canvas proposed by Osterwalder are required along with a company’s resources in
and Pigneur (2010) which is illustrated in Figure 6. order to provide the offer and which costs incur by
It is an instrument to sketch ones business model that (Osterwalder and Pigneur, 2010).
and is used in order to collect information of the The scholars propose to look at each building block
project partners BMs. separately and fill them with sticky notes including
The Business Model Canvas consists of nine build- one element each. That way, the canvas can be
ing blocks that depict which product/service is discussed and enhanced easily.
offered to which kinds of customers and how these
Figure 6: The business Model Canvas as proposed by Osterwalder and Pigneur (Osterwalder and Pigneur, 2010)
2.2. FEEDBACK
All project partners have been asked to describe each canvas topic. A very special discussion has
their nZEB-related business models using Oster- been hold in identifying revenue streams related to
walder’s Business Model Canvas. 17 business mod- the described business model. It was stated for
els have been provided by the industry partners of most described BMs from the partners, that it is not
the CRAVEzero project. During the feedback of possible to excerpt detailed cost and revenues.
the project partners, several questions have been Nearly all described BMs are embedded into the
discussed, especially in clarifying the definitions of “business as usual” and therefor difficult to allocate
13cost and revenues. To mitigate this lack of numbers company wishes to develop a new and strictly bor-
the consortium discussed the possibility to cross- dered business model and deliver the related ser-
check the business models with the given numbers vices separately to the client. This was not given for
in WP2, the LCC analysis. But even in this WP it the described business models from the CRAVE
was difficult to allocate related costs. In elaborating zero partners.
additional options and during further discussions it For clarification a diagram was provided giving an
was said in the scientific core group, that fixing cost overview about possible business model allocation
and revenue streams makes only deeper sense if a and their combinations (see Figure 7).
Business Model Types (buildings, indicative)
Service 1 Standard
Service 2 (e.g. with nZEB elements, certification scheme)
Preparation Service 3 (e.g. nZEB special financial schemes)
Design 1 Standard
Design 2 (e.g. with nZEB elements, sun orientation) BM 1
Design Method 3 (e.g. extended energy simulations)
Service 1 Standard
PHASE
BM 2
Service 2 (e.g. for nZEB buildings extended tender)
Pre-construction
Product 1 Standard
Product 2 (e.g nZEB material performance) BM 4
Construction Service 3 (e.g. nZEB quality checks, blower door tests)
BM 3
Service 1 Standard
Service 2 (e.g. performance control)
Use
Figure 7: Business model allocation during building, planning and construction phase
3.BUSINESS MODEL REPOSITORY, OVERVIEW
For a more detailed impression, the provided busi- 3. Company: left side of BMC describing all
ness models are described in the following. In the company related issues, and
depicted tables the factors and the keywords pro- 4. Costs and Revenues: bottom of BMC.
vided by the partners are indicated. The results are
taken from the filled out Business Model Canvases, Furthermore, the respective characteristic strengths
but are anonymized. In order to guarantee readabil- and key factors are described. The business models
ity and keep the general structure of the BMC, the are addressing Real Estate Developers, Planners,
BMC is divided in 4 separated blocks: General Contractors, Engineering and Construc-
1. Value Proposition: central building block tion, Facility Management and Operation as well as
of BMC, Urban Planning. They are summarized in Table 2
2. Customers: right side of BMC describing
all customer related issues,
14Table 2: Analyzed business models and their categorization
Category Business Country Name Stakeholder perspective
Model
Real Estate BM 1 DE General Contractor Real Estate Developer and
Developer General Contractor
BM 2 SE Real Estate Developer Developer (contractor)
BM 3 SE Net ZEB Developer (contractor)
BM 4 FR Real Estate Development – Real Estate Developer in Ur-
Urban Planning ban/ District Planning.
BM 5 AT Cooperative Board of a Cooperative in Real
Estate Development
Planner BM 6 DE/AT Participation in Competitions Planner
BM 7 DE/AT LCC + CO2 optimization in Planner
early design stage
BM 8 DE/AT Passive House Certification / Planner
PHPP
BM 9 DE/AT Daylight Optimization Planner
General BM 10 FR Design and Build Residential General Contractor
Contractor Sector
BM 11 FR Design and Build Tertiary General Contractor
Sector
BM 12 IT General Contract – Multiplan General Contractor
Houses
Engineering BM 13 IT Single Houses (b2C) E&C Engineering and construction
and Con- company
struction
Facility BM 14 FR Facility Management Facility Management (FM)
Management company
& Building BM 15 AT/DE Monitoring User/ Owner
Operation BM 16 AT PV-Contracting Energy Service Company (ES-
CO)/ contractor
Urban Plan- BM 17 FR Urban Planning Real Estate Developer in the
ning field of Urban Planning
153.1. BUSINESS MODELS OF PARTNERS
REAL ESTATE DEVELOPER
3.1.1.1. BM 1: REAL ESTATE DEVELOPER, GENERAL CONTRACTOR
General description:
The Business Model Canvas is filled out by the various partners for tasks as advertisement, engi-
company’s own perspective and describes the activ- neering and construction, delivering resources and
ities of the company as a Real Estate Developer and maintenance. Their main resources are their skilled
General Contractor. The company offers turnkey employees and the value of the company’s brand.
nZEBs including the intermediation service with The company captures value with brokerage fees,
possible investors, architect’s services, building architectural and administrational services and asset
maintenance and administration. Since the offer sales. This compares to incurring costs for con-
includes the full range from start to finished build- struction, post processing, salaries, maintenance
ing they approach various different customer seg- and administration. According to the company this
ments from investors to owners, tenants, industries business model belongs to, they have a value-driven
and municipalities. They accompany their custom- approach.
ers from the beginning with a personal assistance
making sure their purchasing process is care-free Strengths: Long term value proposition and long
and they establish a long term customer relation- term customer relation (lock-in), value driven,
ship. Customers are reached by word-of-mouth brand
advertisement built on a strong brand as well as via
website and other communication channels. To Key factors: skilled employees, widespread compe-
provide the value proposition the company has tences
VALUE PROPOSITOIN
• High quality (brand of company)
• Turnkey, risk-reduced,
• Convenient building (care-free)
• Energy-efficient, ecological, individualized apartments/houses
• Intermediation services for investors
• Architect's services
• Maintenance/administration
CUSTOMERS
Customer Relationship: Customer Segment:
• Personal assistance • Owners
• Professional (care-free) relationship • Investor
• Attendance from the beginning • Industry
Distribution Channels: • Municipality
• Long-term relationships • Seller of owned houses
• Established brand • Tenant
• Mouth-to mouth (public awareness )
• Website, telephone, personal, e-mail, Segmented
16COMPANY
Key Partners: Key Activities:
Strategic alliances: • Production:- design, supervising, administra-
• Partners/clubs/associations -> advertising tion, intermediation, maintenance (care-free-
• Buyer-Supplier-Relationship: service)
• Trades (wrought) • Regional market
Construction work: Key Resources:
• Supplier, professional engineers (statics, ener- • Human
gy...) • Architects,
Delivering resources and services: • Skilled workers
• Maintenance companies • Local partnership
• Maintenance work • Intangible
• Company as brand
COSTS AND REVENUES
Cost Structure: Revenue Streams:
• Building costs, production costs, salaries, post 1. Asset sale
processing, maintenance/administration ex- 2. Architect services
penses 3. Administration services
• Value chain by independent suppliers 4. Brokerage fees
Value driven
3.1.1.2. BM 2: REAL ESTATE DEVELOPER
General description:
The Business Model Canvas describes the perspec- company’s own workforce served to do extensive
tive of a Developer (contractor). In this specific study about previous costs for the offices to ensure
case, the nZEB was built for the company itself. cost reductions as well as the iterative design pro-
Therefore, the business model consists of being a cess. The most important costs have been super-
role model to future customers, unifying the loca- structure, heating and cooling system, ventilation
tions of different company branches in one building and Photovoltaics (PVs). Revenues are created with
(creating synergies), and saving costs for energy the rents each company branch is paying for the
with the new office building compared to the pre- new office.
vious one. As a consequence of being its own cus-
tomer the relationship and distribution channels Strengths: shows competences with own buildings,
can be neglected. As partners only one subcontrac- lighthouse building.
tor, belonging to the same company, was hired for
geothermal heat pump systems. Other than that the Key factors: All services in house
17VALUE PROPOSITOIN
• Before the building was built, the company (which consists of many different braches) was situated at
many different locations in the city of Helsingborg.
• By relocating everyone to the same office, it was possible to offer new/fresh office space with no in-
creased costs. Furthermore synergies were expected when all branches got situated together.
• Important to “practice what you preach”. The company says that it is the number one green contrac-
tor. I.e. should have a “green office”
CUSTOMERS
Customer Relationship: Customer Segment:
• Internal costumer • Internal costumer
Distribution Channels: • Expected a high quality office which could
• Internal show that our company “practice what we
preach”
• (Niche market)
COMPANY
Key Partners: Key Activities:
• In this case, our company was developer, con- • An extensive study was carried out to gather
tractor and the costumer who would use the rental costs etc. for all branches before the new
building. office and predicted costs for the new office in
• One subcontractor was hired for the geother- order to ensure that the new office would not
mal heat pump system- also our own company increase costs
• Iterative design process with focus on dialog
and cooperation
Key Resources:
• Energy engineer: Defining design principles
• HVAC engineer: Defining requirements, focus-
ing on functions/performance instead of prod-
ucts
• Developer: Never deviating from the overall
Net ZEB goal
• Contractor: Trying to do everything a little bit
better
COSTS AND REVENUES
Cost Structure: Revenue Streams:
• Most important costs were superstructure, heat- • The costumers (different branches of our own
ing- and cooling system, ventilation and PVs company) were paying/renting for their own
offices, coffee machines etc. They were willing
to pay the same or less for a new office.
183.1.1.3. BM 3: NET ZEB
General description:
The Business Model Canvas describes the perspec- In order to provide the offer various sub-
tive of a Developer (contractor). The offer includes contractors were involved to take care of the elec-
the entire building process to ensure customers get tricity, plumbing, ventilation and prefab of the
the Green and future proof building they expect. buildings superstructure. The company’s most im-
Therefore, several necessary measures are taken. portant activities have been the definition of design
The segment the business model aims to reach principles, dialogue with municipalities, and the
includes small/young families and couples willing procurement of external funds for extra work/costs
to live in a Green Building. They are reached via in design and user phase. The company relies on
internet where ongoing and previous projects are their different specialized employees for the offers
displayed and customers can sign up if interested. provision as their key resource.
With additional sale meetings the company aims to
strengthen the customer relationship by informing Strengths: Future proof: no financial and technical
and dedicating time for interested customers before risks
signing a contract. During the building process the
personal contact is obtained. Key factors: fixed price during lifetime
VALUE PROPOSITOIN
• Green building/future proof
• Assuring the costumers that they will get what they expect
• Several measures are implemented to create a green building
• Free cooling (from ground)
CUSTOMERS
Customer Relationship: Customer Segment:
• Ongoing projects are displayed on company • Mass market segment, small/young families
website where people sign up to state their in- and/or couples
terest.
• All interested people are invited to a “sale meet-
ing” where they get more information and a
personal contact is established and a contract is
signed (if the costumer chooses)
• After contract, personal contact is maintained.
E.g. for choosing color in bed room etc.
Distribution Channels:
• Internet
19COMPANY
Key Partners: Key Activities:
• In this case, the company was both developer • Design principles for Net ZEB were defined
and contractor. Four important sub-contractors early in the process
were involved for: • Dialogue with municipality to get “OK” to
o Electricity build Net ZEB instead of Passive House
o Plumbing • External funds were received for extra
o Ventilation work/costs in design and user phase (energy
o Prefab superstructure/walls measuring)
Key Resources:
• Energy engineer: Defining design principles
• Architect: Striving for energy efficient design
• Environmental specialist: Support throughout
the process and securing external founds
COSTS AND REVENUES
Cost Structure: Revenue Streams:
• Most important costs were superstructure. • Prices are fixed. The costumer pays a fixed
price and pays a monthly fee after moving in in-
to the dwelling
203.1.1.4. BM 4: REAL ESTATE DEVELOPMENT – URBAN PLANNING
General description:
The Business Model Canvas describes the perspec- Partners like urban planners and construction com-
tive of a Real Estate Developer in Urban/ District panies alongside with the marketing done by the
Planning. The main attributes of the business mod- company itself help provide the offer. Thereby, the
el’s offer are the reduction of energy costs, the company uses their good reputation and brand
guaranteed neighborhood performance and the name, digital tools for sales and their experience in
improvement of quality of living for inhabitants. customization to grant the best outcomes.
The approached segments are private investors The most relevant costs incurring are those for the
such as individuals or companies as well as public purchase of the land, construction and payment of
investors like social housing companies all of whom sub-contractors. In turn, the company captures
are reached by marketing measures like posters, value by selling buildings and apartments to their
flyers, or points of sale. A good relationship with customers.
the relevant community is aimed for in order to
collect different opinions for possible improve- Strengths: Guarantee of neighborhood perfor-
ments. Afterwards customer support is provided mance, upgrade quality of life
for the exploitation and maintenance of the relevant Key factors: Focus on value, urban planning
district. knowledge
VALUE PROPOSITOIN
• Reduction of costs (thanks to energy savings + production / resale of renewable energy)
• Guarantee neighborhood performance by a third party (via obtaining environmental labels)
• Improve and maintain the quality of life of users
• Anticipation of future thermal regulations
CUSTOMERS
Customer Relationship: Customer Segment:
• "Community" to be maintained in order to • Private investors (individuals, companies, etc.)
collect the opinions and improvements pro- • Public investors (social housing, etc.)
posed by users
• Provide support (at least at the beginning) for
the exploitation/maintenance of the district
Distribution Channels:
• Marketing (ephemeral points of sale, posters,
flyers, etc.)
COMPANY
Key Partners: Key Activities:
• Urban planner (who gives the specifications) • Marketing ++
• Neighborhood life animator Key Resources:
• Construction companies • Reputation of the company
• Digital sales tools (3D models, virtual tours)
• Customer customization
COSTS AND REVENUES
Cost Structure: Revenue Streams:
• Purchase of land • Sale of lots (buildings, apartments)
• Construction costs
• Sub-contractors (community life animator...)
213.1.1.5. BM 5: COOPERATIVE
General description:
The business model canvas describes the perspec- ence. They make workshops to establish core
tive of the Board of a Cooperative, which in this groups for the implementation of community living
case is active on the market as Real Estate Devel- projects, conduct financial and legal negotiations
oper. The Cooperative aims to provide affordable and search for planning and construction teams.
and sustainable community living to residents inter- Thereby, landlords like regional governments or
ested in a community living model as well as private municipalities, banks, consulting companies, archi-
and commercial customers in collaborative building tects, general planner as well as construction com-
projects. In the future, it might be possible to have panies are the most relevant partners.
communities and municipalities as customers inter- The cost structure of this business model is value-
ested in developing cross-generational living pro- driven. Major costs incur for bank loans, construc-
jects. Features of the Cooperatives are support in tion and planning phase and service charges for the
the participation process, know-how and experi- operation of the community living. Revenues are
ence from previous projects, creditworthiness for made with members of the association /other cus-
financing and mobility solutions. The customer tomers paying rents/usage fees.
relationship is strengthened with meetings consist-
ing of working groups of the association and the Strengths: Very low fixed costs, voluntary work,
cooperative (founded by the association). Besides human expertise
this direct contact some projects are actively adver-
tised by workshops and events. Key factors: Close collaboration of Cooperative
The Cooperatives key resources are voluntary and association, creditworthiness.
working hours and human knowledge and experi-
VALUE PROPOSITOIN
• Implement the idea of community living by offering:
• Know how
• Support in participation processes
• Legal framework
• Experiences from other projects
• Creditworthiness for financing
• Affordable and sustainable living
• Mobility solutions
CUSTOMERS
Customer Relationship: Customer Segment:
• Sociocratic organized gatherings • Residents who are interested in a community
• Working groups of the association meet with living model
representatives of the cooperative which was • Private and commercial customers interested in
founded by the association collaborative building projects
Distribution Channels: • In future maybe communities/municipalities
• Mostly face-to-face and personal contacts which are interested in developing cross- gener-
• Members of the association and representatives ational living projects
of the cooperative themselves live and network
these projects and contacts
• Some community projects are actively adver-
tised by workshops and events
22COMPANY
Key Partners: Key Activities:
Generally: • Workshops and gatherings to establish core-
• Landlords like regional government, municipali- groups for the implementation
ty or ÖBB, who cooperate in planning and • Financial and legal negotiations
building law negotiations • Search for planning and construction team
• Bank Key Resources:
• Consulting companies • Human knowledge and experience
Project-specific: • Voluntary person hours
• Architect • Office with low administrating tasks
• General planner
• Construction and HVAC companies
COSTS AND REVENUES
Cost Structure: Revenue Streams:
Clearly value-driven and variable cost-structure with Residents / costumers are willing to pay for:
"economics of scope"-characteristics, depending on • Building project development
each single community building project: • Solvency
• Bank loans • Know-how for implementation
• Construction and planning costs • Different usage and subscription fees / rent
• Capital • Basics to establish and run the cooperative
• Service charges from the operation of the Both recurring and transaction revenues by dynamic
community living pricing on negotiation basis
The only exception are very basic fixed costs for the
office administration - but are on a minimum level
when no project is actually in development
23PLANNER
3.1.2.1. BM 6 PARTICIPATION IN COMPETITIONS
General description:
The Business Model Canvas describes the perspec- The company’s own experts use their experience
tive of a Planner. In this case the company de- and conduct life cycle assessments based on
scribes their business model of taking part in calls benchmarks as well as energetic assessments. Cost
for tenders in order to get acceptance of a bid. incur for personal expenditures and general office
Within their bid they propose innovative requirements. Revenues, in the contrary only arise if
drafts/concepts that minimize the life cycle costs the company receives acceptance for the bid (pre-
and CO2 emissions of a building. Possible customer defined prize money). In case of loaded competi-
segments are building owners, operators and end tions, where only a limited number of competitors
users wishing to build nZEBs. Since the competi- are participating, a base budget is received addition-
tion is anonymous there is no relation to the cus- ally.
tomers needed at this stage. Required documents
are handed in and published if the competition was Strengths: Getting more experiences with every
won. In order to create the bid the company coop- call for tenders
erates with architects, planners of building services Key factors:
and municipalities to get all necessary information. Experts’ know-how; sufficient resources
VALUE PROPOSITOIN
• Innovative drafts which minimize the life cycle costs and the output of CO2
CUSTOMERS
Customer Relationship: Customer Segment:
• Anonymous competition: no relation with the • Building owner with the wish to build NZEB
customer • Building owner with roles:
• Invited competition: Customer relation by posi- o Owner
tive experiences from former projects o Building operator
Distribution Channels: o User
• Publication of the competitive documents of
the prizewinners
COMPANY
Key Partners: Key Activities:
• Architects Analysis from site-specific heat and cold sources
• Planners of building services • Energy indicator estimation
• Municipality for information about regulations • Concept design
for utilization of environmental energy Key Resources:
• Expert know-how
• LCC assessment on the basis of benchmarks
• Energy assessment (sefaira)
COSTS AND REVENUES
Cost Structure: Revenue Streams:
• Personnel expenditure of experts • Anonymous competition (prizewinners receive
• General office costs predefined prize money)
• Loaded competition (invited participants re-
ceive a base budget + prizewinner prize money)
243.1.2.2. BM 7: LCC + CO2 OPTIMIZATION IN EARLY DESIGN STAGE
General description:
The Business Model Canvas describes the perspec- for variant analysis. For information about the
tive of a Planner. The company offers energetic building partners like architects and planners of
concepts for nZEBs that minimize the life cycle building services are consulted. Consequently, the
costs and reduce the CO2 emissions by making use biggest share of costs incurs for personnel expendi-
of passive systems and environmental energy. Pos- tures of experts and salaries followed by general
sible customers are building owners, operators or office costs. The reward for the energetic concept
end users. The relationship needed is not as intense depends on the size of the project, number of vari-
and limited to a contract for the energetic consulta- ants etc. and is regulated in the contract signed.
tion and evaluation resulting in a final report about
the energetic quality of the building. The company Strengths: Focus on one phase during planning
makes use of their employees know-ho, different process
simulation software, Building information manage- Key factors: Tool knowledge and efficient use
ment (BIM) and a self-developed life cycle cost tool
VALUE PROPOSITOIN
• Innovative and optimized energetic concepts which minimize the life cycle costs and the output of
CO2 - including passive systems and environmental energy
CUSTOMERS
Customer Relationship: Customer Segment:
• Contract for energetic consultation and evalua- • Building owner with the wish to build NZEB
tion of a building project • Building owner with rolls:
Distribution Channels: o Owner
• Report about the energetic quality o Building operator
o User
COMPANY
Key Partners: Key Activities:
• Architects Simulation / evaluation of energy related perfor-
• Planners of building services mance indicators:
• Energetic evaluation
• Thermal simulation
• Daylight simulation
Key Resources:
• Expert know-how
• Simulation software (designbuilder, IDAice,
SolarComputer)
• BIM (Revit)
• LCC Tool (own development) for variant anal-
ysis
COSTS AND REVENUES
Cost Structure: Revenue Streams:
• Personnel expenditure of experts • Reward according to contract with developer
• General office costs
253.1.2.3. BM 8: PASSIVE HOUSE CERTIFICATION / PHPP
General description:
The Business Model Canvas describes the perspec- The company’s key activity to provide the offer is
tive of a Planner. PHPP is a passive house planning the optimization of the thermal envelope of build-
tool that enables to increase a building’s energy ings making use of the employees’ know-how, the
efficiency. Afterwards a certificate, proving the PHPP excel sheet and architectural design. Conse-
increased energy efficiency is awarded. The chosen quently the most important costs within this busi-
customer segments are building owners, operators ness model are personnel expenditures, general
and end users that make an according contract with office costs and the PHPP certification while re-
the company. Customers can become aware of the wards are fixed in the regarding contract.
offer due to the company being officially listed as a Strengths: expert knowhow, excellent references
PHPP planner, references and word-of-mouth
advertisement. Key factors: PHPP excel sheet, listed PHPP plan-
ner
VALUE PROPOSITOIN
• PHPP Certificate
• Optimized building performance
CUSTOMERS
Customer Relationship: Customer Segment:
• Contract with client • Building owner with the wish to build NZEB
Distribution Channels: • Building owner with rolls:
• Publicity o Owner
• Excellent references o Building operator
• Listed PHPP planner o User
COMPANY
Key Partners: Key Activities:
• Architects • Optimization of the thermal envelope
• Building physics Key Resources:
• Client / user • Expert know-how
• Architectural design
• PHPP excel sheet
COSTS AND REVENUES
Cost Structure: Revenue Streams:
• Personnel expenditure of experts • Reward according to contract with developer
• General office costs
• PHPP certification
26You can also read