COSTS, BENEFITS AND ECONOMIC IMPACTS OF THE EU CLEAN AIR STRATEGY AND THEIR IMPLICATIONS ON INNOVATION AND COMPETITIVENESS - December 20, 2017 ...
←
→
Page content transcription
If your browser does not render page correctly, please read the page content below
COSTS, BENEFITS AND
ECONOMIC IMPACTS OF THE
   EU CLEAN AIR STRATEGY
  AND THEIR IMPLICATIONS
     ON INNOVATION AND
        COMPETITIVENESS

                                              December 20, 2017

                                            Editor: Markus Amann
            International Institute for Applied Systems Analysis (IIASA)

        0
Abstract

           Reducing air pollution has a number of benefits to society, improving health
           of the population and reducing damage to crops, forests, ecology and
           building and other materials. Quantification of the benefits of the revised
           emission ceilings indicates that they will exceed costs by a large margin.
           Taking a conservative position on the valuation of mortality leads to
           benefits:cost ratios in excess of 14, taking a less conservative position pushes
           the ratio above 50. Even this position is based on valuations that are low
           when compared to those recommended elsewhere.

                                                  1
The authors
This report has been produced by
Markus Amann1)
Mike Holland 2)
Rob Maas 3)
Bert Saveyn4)
Toon Vandyck4)
Affiliations:
1)
International Institute for Applied Systems Analysis (IIASA), Laxenburg, Austria
2)
EMRC, UK
3)
National Institute for Public Health and the Environment (RIVM), The Netherlands
4)
Joint Research Centre (JRC) of the European Commission, Seville, Spain
How to cite this report: Amann, M., Holland, M., Maas, R., Vandyck, T. and B. Saveyn (2017). Costs,
benefits and economic impacts of the EU Clean Air Strategy and their implications on innovation and
competitiveness. IIASA report. (http://gains.iiasa.ac.at)
Acknowledgements
This report was produced under Specific Agreement 11 under Framework Contract
ENV.C.3/FRA/2013/00131 of DG‐Environment of the European Commission.
Disclaimer
The views and opinions expressed in this paper do not necessarily represent the positions of IIASA, JRC
or its collaborating and supporting organizations.
The orientation and content of this report cannot be taken as indicating the position of the European
Commission or its services.
2Executive Summary
Reducing air pollution has a number of benefits to society, improving health of the population and
reducing damage to crops, forests, ecology and building and other materials.
The policy discussions on the revised Directive on National Emission Ceilings (NECD, 2016/2284/EU)
were informed by systematic cost‐effectiveness and cost‐benefit analyses conducted around 2013 with
the GAINS integrated assessment and ALPHA‐Riskpoll benefits models. Since the time these analyses
have been conducted, a number of important factors have changed. Complementing the 2017 outlook
into future air quality in Europe (Amann M. et al. 2017), this report presents a re‐assessment of the
costs, benefits and economic impacts of the latest clean air strategies and their implications on
innovation and competitiveness.
In addition to updates of the standard quantification of premature mortality and morbidity and their
economic valuation, this report addresses work days lost due to the exposure to air pollution in more
detail as it constitutes a potentially important element of a cost‐benefits analysis. For the recent
emission scenarios, it is estimated that working days lost due to air pollution decline from 0.63 per
worker on average to 0.3 under the policy scenarios. For the EU28, costs associated with lost working
days fall from €18.5 billion/year in 2005 to €8.5 billion/year by 2030 under the policy scenarios.
Quantification of the benefits of the revised emission ceilings indicates that they will exceed costs by a
large margin. Taking a conservative position on the valuation of mortality leads to benefits:cost ratios
in excess of 14, taking a less conservative position pushes the ratio above 50. Even this position is based
on valuations that are low when compared to those recommended elsewhere.
Case studies demonstrate that there are clear winners from stricter environmental policy regulation. A
strong domestic market – due to domestic environmental and energy policies – emerged as an
important success factor in all cases. In this context it is surprising that enterprises that produce clean
technology seem less involved in stakeholder consultations than the enterprises that have a vested
interest and are required to take additional abatement measures (or are at least less vocal in the public
debate).
3List of acronyms
ALPHA‐Riskpoll Model to estimate monetized benefits of air pollution control strategies
CAPRI Agricultural model developed by the University of Bonn
CBA Cost‐Benefits Analysis
EC4MACS European Consortium for Modelling Air Pollution and Climate Strategies
EEA European Environment Agency
ERR Emission Reduction Requirements of the NEC Directive
EU European Union
GAINS Greenhouse gas ‐ Air pollution Interactions and Synergies model
GDP Gross domestic product
GEM‐E3 General Equilibrium Model for Economy – Energy ‐ Environment
IIASA International Institute for Applied Systems Analysis
JRC Joint Research Centre for the EU
kt kilotons = 103 tons
NEC National Emission Ceilings (Directive)
NO2 Nitrogen dioxide
NOx Nitrogen oxides
O3 Ozone
PJ Petajoule = 1015 joule
PM10 Fine particles with an aerodynamic diameter of less than 10 µm
PM2.5 Fine particles with an aerodynamic diameter of less than 2.5 µm
PRIMES Energy Systems Model of the National Technical University of Athens
SO2 Sulphur dioxide
SOMOxx An ozone metric relevant for human health: Sum of means over xx ppb (daily
maximum 8‐hour concentrations)
TSAP Thematic Strategy on Air Pollution
VOLY Value of life year
VSL Value of statistical life
4Contents
1 Context ............................................................................................................................................... 6
2 Emission control costs ....................................................................................................................... 8
3 Benefits ............................................................................................................................................ 11
3.1 Health benefits......................................................................................................................... 12
3.1.1 Method ............................................................................................................................ 12
3.1.2 Results .............................................................................................................................. 17
3.2 Work days lost ......................................................................................................................... 22
3.2.1 Approach taken for this study ......................................................................................... 22
3.2.2 Results .............................................................................................................................. 23
3.2.3 Main findings ................................................................................................................... 26
3.3 Non‐health benefits ................................................................................................................. 27
4 Comparison of costs and benefits ................................................................................................... 29
4.1 Comparison of costs and health benefits ................................................................................ 29
4.1.1 Equity issues .................................................................................................................... 30
4.2 Market‐based costs and benefits: macro‐economic and sector‐specific assessment ........... 31
5 Innovation and competitiveness implications of clean air strategies ............................................. 36
5.1 Case studies ............................................................................................................................. 37
5.1.1 Flue gas desulphurization ................................................................................................ 37
5.1.2 Selective catalytic reduction............................................................................................ 38
5.1.3 Manure application ......................................................................................................... 39
5.1.4 Chemical air scrubbers for stables .................................................................................. 39
5.1.5 Wood pellet burners in the residential sector ................................................................ 39
6 Conclusions ...................................................................................................................................... 41
Annex 1: Work days lost ...................................................................................................................... 42
A1.1 Results from other studies ...................................................................................................... 42
A1.2 Review of the epidemiological literature on lost work days................................................... 46
5Costs, benefits and economic impacts of the
EU clean air strategies and their implications
on innovation and competitiveness
1 Context
In its Clean Air Programme for Europe (COM(2013)918 final), the European Commission has laid out a
comprehensive approach to improve air quality in Europe. It contains provisions for a regular tracking
of the progress towards the programme objectives by 2020 and every five years thereafter.
The main legislative instrument to achieve the 2030 objectives of the Clean Air Programme is Directive
2016/2284/EU on the reduction of national emissions of certain atmospheric pollutants, which entered
into force on 31 December 2016 (the NEC Directive or NECD). This directive sets national reduction
commitments for the five pollutants (sulphur dioxide, nitrogen oxides, volatile organic compounds,
ammonia and fine particulate matter) responsible for particulate matter and NO2 concentrations and
for acidification, eutrophication and ground‐level ozone pollution, which leads to significant negative
impacts on human health and the environment. The Commission proposal for the revised NECD, which
was adopted by the European Commission on December 18, 2013, was informed by extensive cost‐
effectiveness and cost‐benefits analyses with IIASA’s GAINS (Greenhouse gas – Air pollution
Interactions and Synergies) model (Amann et al. 2011) and cost‐benefit analysis undertaking the
ALPHA‐Riskpoll model (Holland, 2013b). After that, additional technical analyses were conducted with
the GAINS model to support negotiations in the Council and the European Parliament (Amann et al.
2014a); (Amann et al. 2014b) (Amann, M. et al. 2015).
In this context, this report presents a re‐assessment of the costs, benefits and economic impacts of the
latest clean air strategies and their implications on innovation and competitiveness. This report
complements the Commission's Clean Air Outlook into the future of air quality in Europe as expected
from the implementation of the revised NEC directive and other recent source‐oriented emission
legislation, and the more detailed underlying report 'Progress towards achievement of the EU's air
quality and emissions objectives' (Amann M. et al. 2017). In particular, the Outlook takes into account
retrospective changes of emission inventories for 2005 and their knock‐on effects for later years, new
projections of economic activities, and new source‐oriented emission regulations that have been
agreed after 2013.
This report examines the economic impacts for the following emission control scenarios for 2030:
• For the PRIMES 2016 REFERENCE scenario, emissions resulting from
• the legislation in place in 2017,
• the additional measures that would meet the Emission Reduction Requirements of the
NEC directive at least costs (the ERR 2030 scenario); and
• For the PRIMES CLIMATE AND ENERGY POLICY scenario, emissions resulting from
• the legislation in place in 2017,
6• the additional measures that would meet the Emission Reduction Requirements of the
NEC directive at least costs (the ERR 2030 scenario).
The analysis presented here is focused primarily on the assessment of health impacts across Europe in
2005 and 2030 for the scenarios listed above. Past work (e.g. Holland et al, 2011, 2014) has found that
health impacts dominate European air pollution CBAs, though this is in part a function of the problem
of quantifying ecosystem damage/benefits in monetary terms for integration to the CBA. The analysis
is extended here to include effects on building materials in some applications (though excluding cultural
heritage), forests, crops and ecosystems. It also provides additional detail on issues such as productivity
losses and healthcare costs. Analysis of forests and ecosystems was not included in earlier CBA reports
on air quality proposals for the Commission, with the methods used here having been developed under
the ECLAIRE study funded by European Commission DG Research1. It is noted that the ecosystem
analysis should be considered preliminary at the present time, as quantification is based on a very
limited set of valuation data. This and other emerging methodological details are also discussed in the
report.
Macro‐economic impacts of the emission control scenarios are also presented in Section 4.2 , based on
results of the JRC‐GEM‐E3 model operated by the Joint Research Centre (JRC) of the EU.
The remainder of the report is organized as follows: Section 2 summarizes emission control costs for
the scenarios for 2030 as estimated in the report 'Progress towards achievement of the EU's air quality
and emissions objectives' (Amann et al., 2017). Section 3 discusses the benefits that can be computed
for these emission control scenarios, for human health, productivity and non‐health related damages.
Section 4 compares costs and benefits. Section 5 discusses implications on competitiveness, and
conclusions are drawn in Section 6.
Methodological details and results for individual Member States are documented in a supporting
report, and are available in an Excel workbook that accompanies this report.
1
http://www.eclaire‐fp7.eu/
72 Emission control costs
The European Union has established a comprehensive framework to manage air quality, including
ambient air quality limit values, source‐oriented emission legislation, and national emission ceilings.
Assuming the PRIMES 2016 REFERENCE scenario in 2030, it is estimated that costs for implementation
of all source‐oriented legislation in force (as of 2017) will amount to € 79.2 bn/year in the EU‐28, which
constitutes about 0.53% of GDP or 153.8 €/person/year (Table 1). Compliance with the Emission
Reduction Requirements (ERR) of the NECD Directive (REF) will increase these costs by € 0.95 bn/year,
i.e., by 0,006% of GDP or € 1.86/person/year. The lower consumption of fossil fuels in the CLIMATE
AND ENERGY POLICY scenario would reduce air pollution control costs for implementation of the
current legislation to € 71 bn/year. Additional measures required to meet the ERRs would increase costs
by € 0.54 bn/yr, i.e., 0.004% of GDP or by € 1.05/person/year (for details see (Amann et al. 2017)).
TABLE 1: AIR POLLUTION CONTROL COSTS IN 2030
PRIMES 2016 REFERENCE CLIMATE AND ENERGY POLICY
2017 ERR 2030 Additional 2017 ERR 2030 Additional
legislation costs legislation costs
million €/year 79220 80180 960 71001 71540 539
% of GDP 0.527% 0.533% 0.006% 0.472% 0.476% 0.004%
€/capita 153.75 155.61 1.86 137.80 138.84 1.05
Air pollution control costs are unevenly distributed across the economic sectors (Table 2). More than
50% of total costs emerge for emission controls for road vehicles, while the power sector, industry and
non‐road mobile machinery carry about 13% of total costs each. In contrast, the share of agriculture in
total costs is about 3%. However, 40% of the costs of all additional measures that are required to
achieve the ERRs occur in agriculture, indicating the cost‐effectiveness of additional emission
reductions in this sector compared to the much higher costs of the remaining measures in other
sectors. Note that the higher percentage of additional costs for agriculture in this analysis as compared
with the original Commission proposal is largely due to the fact that additional costs for regulating
domestic combustion under the NECD are lower than then assumed, because much of the costs are
subsumed under the Ecodesign implementing acts for solid fuel stoves and boilers. The distribution of
costs across Member States is presented in Table 3.
8TABLE 2: AIR POLLUTION CONTROL COSTS IN 2030, BY SECTOR (MILLION €/YR)
PRIMES 2016 REFERENCE CLIMATE AND ENERGY POLICY
2017 ERR 2030 Additional 2017 ERR 2030 Additional
legislation costs legislation costs
Power sector 10257 10488 231 8752 8778 26
Domestic 4171 4228 57 3122 3154 32
Industry 10187 10468 281 10034 10141 107
Road transport 43180 43180 0 38602 38602 0
Non‐road mobile machinery 9370 9377 6 8434 8439 5
Agriculture 2120 2505 385 2120 2488 369
Total 79285 80246 960 71063 71602 539
Power sector 13% 13% 24% 12% 12% 5%
Domestic 5% 5% 6% 4% 4% 6%
Industry 13% 13% 29% 14% 14% 20%
Road transport 54% 54% 0% 54% 54% 0%
Non‐road mobile machinery 12% 12% 1% 12% 12% 1%
Agriculture 3% 3% 40% 3% 3% 68%
Total 100% 100% 100% 100% 100% 100%
9TABLE 3: EMISSION CONTROL COSTS FOR THE 2017 LEGISLATION SCENARIO AND THE COST ‐EFFECTIVE
ACHIEVEMENT OF THE EMISSION REDUCTION REQUIREMENTS IN 2030 (ERR 2030), FOR THE PRIMES 2016
REFERENCE AND THE CLIMATE AND ENERGY POLICY PROJECTIONS (MILLION €/YEAR)
PRIMES 2016 REFERENCE CLIMATE AND ENERGY POLICY
2017 ERR 2030 Additional 2017 ERR 2030 Additional
legislation costs legislation costs
Austria 1725 1730 5 1584 1589 5
Belgium 2365 2379 14 2133 2143 10
Bulgaria 1000 1004 3 905 908 3
Croatia 461 472 11 438 448 10
Cyprus 120 120 0 111 111 0
Czech Rep. 2114 2137 23 2008 2020 12
Denmark 1235 1236 1 1112 1113 0
Estonia 288 293 5 217 220 3
Finland 1214 1218 3 1105 1107 2
France 9924 9997 72 9055 9070 14
Germany 14218 14747 529 12402 12646 244
Greece 1463 1466 3 1338 1338 0
Hungary 939 948 10 868 874 6
Ireland 960 1000 40 877 915 38
Italy 8226 8267 41 7356 7382 26
Latvia 223 224 0 196 197 0
Lithuania 428 429 1 400 401 1
Luxembourg 296 298 2 258 259 1
Malta 41 41 0 39 39 0
Netherlands 3253 3329 76 3121 3185 64
Poland 9131 9181 50 7977 8016 39
Portugal 1155 1161 7 1061 1066 4
Romania 1833 1842 9 1737 1745 7
Slovakia 731 735 3 697 699 3
Slovenia 428 430 1 383 384 0
Spain 6794 6805 12 5935 5946 10
Sweden 1395 1396 1 1203 1204 1
UK 7257 7294 37 6482 6519 37
EU‐28 79220 80180 960 71001 71540 539
103 Benefits
While environmental measures entail certain pollution control costs, they are motivated by the
interests of improved well‐being, reduced damage to human health, and a cleaner environment to
safeguard the sustainability of ecosystems and their services. Although monetary valuations of these
aspects are challenging, a host of valuation studies show that the economic benefits of many air
pollution control measures substantially exceed their costs (e.g., Holland, 2014). In such cost‐benefit
studies a broad definition of ‘welfare’ is applied, including elements that are not included in the formal
definition of gross domestic production (GDP), such as changes in public health (premature death, pain
and suffering) and the loss of natural capital. Past work (e.g., Holland et al, 2011, 2013a, 2014) has
found that health impacts dominate European air pollution CBAs, though this is in part a function of the
problem of quantifying ecosystem damage/benefits in monetary terms for integration to the CBA.
This report presents a re‐analysis of earlier valuation studies on the benefits of clean air strategies in
Europe, for the most recent projections of economic development, emissions and air quality that are
presented in the progress report (Amann et al. 2017). The analysis is extended here to include effects
on building materials in some applications (though excluding cultural heritage), forests, crops and
ecosystems. It also provides additional detail on issues such as productivity losses and healthcare costs.
Analysis of forests and ecosystems was not included in earlier CBA reports on air quality proposals for
the Commission, with the methods used here having been developed under the ECLAIRE study funded
by European Commission DG Research. It is noted that the ecosystem analysis should be considered
preliminary at the present time, as quantification is based on a very limited set of valuation data. This
and other emerging methodological details are also discussed in the report.
Some damage categories are included in traditional GDP figures, although they would not account for
more than five percent of the total damage estimate including mortality and morbidity impacts (Amann
et al. 2013):
Damage to materials (iron, plastic) and cultural heritage: additional maintenance efforts are both
an economic cost and expenditure in the construction sector.
Damage to crops and forests: production losses generally lead to higher prices and additional
management efforts (e.g., liming, pest control). The latter are both a cost and an expenditure that
will add to the GDP.
Healthcare costs associated with pollution: costs of medicines and of hospitalisation. These costs
also entail incomes and employment in the health care sector.
Sick leave and loss of working days due to air pollution: although the pain and suffering is not
included in the GDP definition, sick leave reduces labour productivity, could lead to production
losses, lower wages or higher production costs. The total direct cost of lost working days due to
acute PM2.5 exposure in 2015 was valued at around €15bn (Holland, 2014). This damage category
is of special interest as the loss of working days could have a longer‐term impact on the economic
performance of a country.
113.1 Health benefits
3.1.1 Method
The method used here follows the impact pathway approach developed under the ExternE project
(ExternE, 1995, 1999, 2005) and the CBA for the Clean Air For Europe (CAFE) Programme, and applied
in the 2013 analysis of the revision of the Thematic Strategy on Air Pollution (Holland, 2014). This
approach follows a logical progression from emission, through dispersion and exposure to
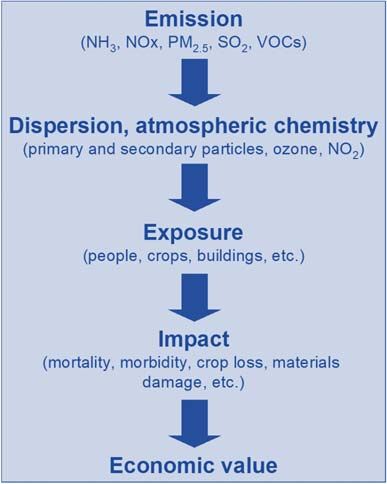
quantification of impacts and their valuation (Figure 1).
FIGURE 1: IMPACT PATHWAY APPROACH, TRACING THE CONSEQUENCES OF POLLUTANT RELEASE FROM EMISSION
TO IMPACT AND ECONOMIC VALUE
The methods used by Holland et al (1999) and Holland and King (1998) for CBA of the original
Gothenburg Protocol and EU NEC Directive were developed under the European Commission‐funded
ExternE (Externalities of Energy) project during the 1990s. Whilst that work had been extensively
reviewed during its development it was considered appropriate for the EU’s CAFE Programme to
conduct a thorough review of the methods, to consult widely with stakeholders and to subject the
methodology to a formal, independent and international peer review. This is documented as follows:
• Methodology Volume 1: Overview of Methodology (Holland et al, 2005a)
• Methodology Volume 2: Health Impact Assessment (Hurley et al, 2005)
• Methodology Volume 3: Uncertainty in the CAFE‐CBA (Holland, 2005b)
• Peer review: Krupnick et al (2005)
Methods were reviewed and updated under the EC4MACS study (Holland et al, 2013b), inter alia to
incorporate the conclusions from the REVIHAAP project of the World Health Organization (WHO)
regarding updated mortality assessment for ozone and PM (WHO, 2013a). Subsequent work on the
HRAPIE project (WHO, 2013b) provides further information on morbidity impacts (hospital admissions,
12incidence of bronchitis, lost work days, etc.), and was used for the CBA for the revision of the TSAP in
2013. For the purpose of comparison with the earlier work it was agreed that the analysis presented
here would follow the same method as used previously, unless significant new developments were
identified. The health functions and unit values applied to health impacts have therefore been kept
the same as for the 2013 analysis.
The final recommendations of the HRAPIE study are shown in Table 4. HRAPIE recommends that the
functions for which confidence is highest be given an ‘A’ rating and those for which confidence is less
(though still sufficiently high to be quantified) be given a ‘B’ rating. This is supplemented by ‘*’ for
effects that are additive for the purpose of the CBA. Effects that are not additive can be quantified to
provide additional information, though this has not been performed here.
TABLE 4: LIST OF HEALTH IMPACTS – HRAPIE RECOMMENDATIONS
Impact / population group Rating Population Exposure metric
Ozone
All cause mortality from chronic exposure B Over 30 years O3, SOMO35, summer months
All cause mortality from acute exposure A*/A All ages O3, SOMO35 (A*), SOMO10 (A)
Cardiac and respiratory mortality from acute A All ages O3, SOMO35 (A*), SOMO10 (A)
exposure
Respiratory hospital admissions A*/A Over 65 years O3, SOMO35 (A*), SOMO10 (A)
Cardiovascular hospital admissions A*/A Over 65 years O3, SOMO35 (A*), SOMO10 (A)
Minor Restricted Activity Days (MRADs) B*/B All ages O3, SOMO35 (B*), SOMO10 (B)
PM2.5
All cause mortality from chronic exposure as A* Over 30 years PM2.5, annual average
life years lost or premature deaths
Cause‐specific mortality from chronic A Over 30 years PM2.5, annual average
exposure
Infant Mortality B* 1 month to 1 year PM2.5, annual average
Chronic bronchitis in adults B* Over 27 years PM2.5, annual average
Bronchitis in children B* 6 – 12 years PM2.5, annual average
All cause mortality from acute exposure A All ages PM2.5, annual average
Respiratory Hospital Admissions A* All ages PM2.5, annual average
Cardiovascular Hospital Admissions A* All ages PM2.5, annual average
Restricted Activity Days (RADs) B* All PM2.5, annual average
Including lost working days B* 15 to 64 years PM2.5, annual average
Asthma symptoms in asthmatic children B* 5 to 19 years PM2.5, annual average
NO2
All cause mortality from chronic exposure B* Over 30 years NO2 annual mean >20ug.m‐3
All cause mortality from acute exposure A* All ages NO2 annual mean
Bronchitis in children B* 5 – 14 years NO2 annual mean
Respiratory hospital admissions A* All ages NO2 annual mean
13It is not yet possible to apply the HRAPIE recommendations in full. The main reasons for this are as
follows:
• For ozone, SOMO10 exposure data are currently unavailable.
• For NO2, there is a lack of agreement regarding the extent to which exposure data
quantified using EMEP outputs properly reflect exposure of the population. Quantification
of NO2 effects has therefore not been attempted.
• For effects of chronic exposure to ozone and NO2 (leaving aside the issues of exposure
modelling) on mortality, protocols for dealing with the potential for double counting
against the function applied for PM2.5 have not been agreed. Neither is therefore added
into total benefits. The HRAPIE report states that: ‘Some of the long‐term NO2 effects may
overlap with effects from long‐term PM2.5 (up to 33%).’ This statement could of course
be turned around to say that at least 67% of the NO2 impact is not accounted for within
the PM2.5 function, providing a bias to underestimation.
Valuation of health effects is performed by multiplying impacts (e.g., respiratory hospital admissions)
by an appropriate estimate of the unit value of each impact (e.g., the cost of a respiratory hospital
admission), as shown in Table 5. Unit values seek to describe the full economic effect of the impacts
that they are linked with. For health impacts, for example, which dominate the analysis, this will include
elements associated with the costs of health care, lost productivity amongst workers and welfare
losses/ lost utility, reflecting aversion to premature death or ill health. The price year of 2005 has been
retained for consistency with the cost‐effectiveness analysis carried out by IIASA using the GAINS
model. There is some evidence that the valuations adopted here are conservative, biasing to
underestimation of impacts. This is discussed in more depth below.
Valuation of mortality generates the largest damage costs in the analysis. Sensitivity analysis is applied
to demonstrate the effect of different assumptions on the balance of costs and benefits. Mortality is
either valued against loss of life expectancy (life years lost) using the value of a life year (VOLY) or against
deaths using the value of statistical life (VSL). In both cases median and mean estimates are available,
leading to a range for the VOLY of €57,700 to €138,700 and for the VSL of €1.09 to €2.22 million. The
results presented in this report mainly focus on the most conservative position, based on the median
VOLY. This is not intended to reflect a preference for the median VOLY, but simply to provide a baseline
for the assessment.
14TABLE 5: VALUES USED FOR THE HEALTH IMPACT ASSESSMENT (PRICE YEAR 2005)
Impact / population group Unit cost Unit
Ozone effects
Mortality from chronic exposure as:
Life years lost, or 57,700 / 138,700 €/life year lost (VOLY)
Premature deaths 1.09 / 2.22 million €/death (VSL)
Mortality from acute exposure 57,700 / 138,700 €/life year lost (VOLY)
Respiratory Hospital Admissions 2,220 €/hospital admission
Cardiovascular Hospital Admissions 2,220 €/hospital admission
Minor Restricted Activity Days (MRADs) 42 €/day
PM2.5 effects
Mortality from chronic exposure as:
Life years lost, or 57,700 / 138,700 €/life year lost (VOLY)
Premature deaths 1.09 / 2.22 million €/death (VSL)
(all‐cause and cause‐specific mortality)
Mortality from acute exposure 57,700 / 138,700 €/life year lost (VOLY)
Infant Mortality 1.6 to 3.3 million €/case
Chronic Bronchitis in adults 53,600 €/new case of chronic bronchitis
Bronchitis in children 588 €/case
Respiratory Hospital Admissions 2,220 €/hospital admission
Cardiac Hospital Admissions 2,220 €/hospital admission
Restricted Activity Days (RADs) 92 €/day
Work loss days 130 €/day
Asthma symptoms, asthmatic children 42 €/day
NO2 effects (though not quantified in this report)
Mortality from chronic exposure as:
Life years lost, or 57,700 / 138,700 €/life year lost (VOLY)
Premature deaths 1.09 / 2.22 million €/death (VSL)
Mortality from acute exposure 57,700 / 138,700 €/life year lost (VOLY)
Bronchitis in children 588 €/case
Respiratory Hospital Admissions 2,220 €/hospital admission
Health care costs are presented separately, calculated using the information presented in Table 6.
Overall, the positions adopted are conservative. There is also emerging information on a number of
possible additional health impacts that could have major added costs ‐ dementia, diabetes and obesity
(see RCP, 2016). However, evidence on these effects is as yet not conclusive.
15TABLE 6: AVAILABILITY OF HEALTHCARE COST DATA FOR HEALTH IMPACTS OF AIR POLLUTION
Effect Commentary
Mortality
Acute Mortality For adults it is assumed that there is no additional healthcare cost for ‘acute
mortality’ beyond what would have been incurred had death occurred slightly
later. In essence, the primary cause of death seems likely to be unchanged at
least in the vast majority of cases.
Chronic Mortality The position with respect to chronic mortality is more complicated than for
acute given that air pollution would have a greater role in causing the ill‐
health that leads to early death. There is, however, a question of the
aggregate effect on health services per individual, given that we all die at
some time and so will likely need health care at some point. It is possible that
prolongation of life may have no significant effect on overall demand for
health services.
Infant Mortality The small number of cases of infant mortality estimated here indicates that
the aggregate of healthcare cost associated with these infant deaths will be
low, even if the average treatment cost per child is high. However, like the
situation with chronic mortality for adults, this is a ‘tip of the iceberg’
situation, given that we quantify no morbidity effects for this age group. It is
quite illogical to consider that the only effect of air pollution on infant health
is mortality, if we accept the link to mortality as robust.
Morbidity
Minor Restricted Activity Given that these are defined as ‘minor’ restricted activity days it is anticipated
Days (acute) that whilst overall number are high, those experiencing the effect would be
unlikely to seek medical intervention.
Chronic Bronchitis in adults Healthcare costs for chronic bronchitis have been assessed systematically in a
number of European countries in a major study reporting in 2003. Results
varied significantly between countries:
France: €530/patient/year (Piperno et al, 2003)
Italy: €1,261/patient per year (Dal Negro et al, 2003)
Netherlands: €614/patient/year (Wouters, 2003)
Spain: €3,238/patient/year (Izquiero, 2003)
UK €1,147/patient/year (Britton, 2003)
The average figure across these countries is €1,358. Based on information
provided by Holland (2014) an estimate of 10 years average duration is
adopted.
Chronic bronchitis in Children with persistent symptoms would be taken to the doctor. Drawing on
children Netten and Curtis (2000, as reported by Hurley et al, 2005) the cost of a
consultation would be in the order of €45.
Respiratory Hospital Hospital admissions are valued at €2,220 per case. Of this, €1,000 is
Admissions (acute) attributed to healthcare costs. However, this seems likely to be an
underestimate given the average stay lengths linked to respiratory hospital
admissions in WHO’s Hospital Morbidity Database and costs indicated by
WHO’s CHOICE database.
Cardiac Hospital Hospital admissions are valued at €2,220 per case. Of this, €1,000 is attributed
Admissions (acute) to healthcare costs. However, this seems likely to be an underestimate given
the average stay lengths linked to cardiovascular hospital admissions in
WHO’s Hospital Morbidity Database and costs indicated by WHO’s CHOICE
database.
16Effect Commentary
Asthma symptom days As a minimum it would be anticipated that children experiencing an asthma
(children 5‐19yr) symptom day would receive some medication, valued previously at €1 per day
(Hurley et al, 2005).
Restricted Activity Days The broad definition of a ‘restricted activity day’ prevents attribution of an
(acute) average cost for healthcare. In many cases it is envisaged that there would be
no healthcare cost. However, given the large numbers involved a significant
aggregate cost could arise if just a minority of cases involved some level of
intervention.
3.1.2 Results
Analysis has been performed for two sets of population data. The first uses a constant population, fixed
at 2005 levels for consistency with the GAINS model. The use of a constant population permits change
in the risk of adverse impacts to be assessed, and is appropriate to the objectives of the GAINS cost‐
effectiveness analysis, in line with the metrics used during the negotiations on the NECD. However, for
a cost‐benefits analysis, it is appropriate to consider changes in population over time, for consistency
with the underlying demand and emissions modelling. Summary data for both sets of results are
presented here, though the CBA is only applied to results that account for population change. Overall
differences between the two sets of results (constant 2005 population, vs population adjusted by year)
are small. The range for the constant 2005 population for 2030 baseline is €214‐610 billion/year, which
falls within the range for the 2030 baseline with 2030 population assumed (€201‐724 billion/year).
Annual health impacts and their monetized equivalents are presented for the EU‐28 as well for all of
Europe, reflecting the impacts of EU emissions on non‐EU countries (Table 7 to Table 12). Emissions
from the EU28 will clearly impact other countries in the European region (Switzerland, Serbia, Russia,
Ukraine, etc.). Inclusion of these countries would add roughly 60% to the total damage costs.
The economic analyses conducted for the Clean Air Policy package identified work days lost due to the
exposure to air pollution as a potentially important element of a cost‐benefits analysis (Holland, 2014).
Across the scenarios considered, the direct economic value of the expected reduction of lost working
days was estimated between € 0,7 bn/yr and almost € 3 bn/yr, substantially offsetting the emission
control costs of the proposed reduction scenario. It was, however, acknowledged that this analysis was
based on a limited literature, and so further consideration is given in Annex 1 to the validity of the
estimates made earlier. The conclusion from the comparison is that the methods used in the core CBA
analysis for the Commission are conservative and likely to underestimate impacts on productivity.
17TABLE 7: ANNUAL HEALTH IMPACTS FOR THE EU28 IN 2030, THOUSAND EVENTS (DEATHS, CASES, DAYS, ETC.),
CONSTANT 2005 POPULATION (ERR 2030: E MISSION REDUCTION REQUIREMENTS OF THE NECD)
2005 PRIMES 2016 REFERENCE CLIMATE AND ENERGY POLICY
2017 ERR 2030 2017 ERR 2030
legislation legislation
Ozone
Acute mortality 30 19 18 18 18
Respiratory hospital admissions 20 13 12 13 12
Cardiac hospital admissions 92 56 55 55 54
Minor restricted activity days 123,819 76,988 75,088 75,312 73,988
PM2.5
Chronic mortality 5,002 2,533 2,312 2,442 2,269
(years of life lost) *
Chronic mortality (deaths) * 449 228 208 220 204
Infant mortality 1 1 0 1 0
Chronic bronchitis (adults) 365 186 169 179 166
Chronic bronchitis (children) 1,341 680 621 655 609
Respiratory hospital admissions 168 85 78 82 76
Cardiac hospital admissions 124 65 59 62 58
Restricted activity days 515,845 260,198 237,822 250,954 233,495
Lost working days 142,489 73,982 67,181 71,182 65,953
Asthma symptom days 14,138 7,162 6,541 6,907 6,424
Table 8: Monetised equivalent of annual health impacts for the EU28, €billion2005, constant 2005
population (ERR 2030: Emission reduction requirements of the NECD)
2005 PRIMES 2016 REFERENCE CLIMATE AND ENERGY POLICY
2017 ERR 2030 2017 ERR 2030
legislation legislation
Ozone
Acute mortality (median VOLY) * 1.7 1.1 1.1 1.1 1.0
Acute mortality (mean VOLY) * 4.2 2.6 2.5 2.5 2.5
Respiratory hospital admissions 0.05 0.03 0.03 0.03 0.03
Cardiac hospital admissions 0.2 0.1 0.1 0.1 0.1
Minor restricted activity days 5.2 3.2 3.2 3.2 3.1
PM2.5
Chronic mortality (median VOLY) * 289 146 133 141 131
Chronic mortality (medium VSL) * 998 506 462 488 453
Infant mortality (median VSL) 1.8 0.9 0.8 0.8 0.8
Infant mortality (mean VSL) 3.7 1.8 1.6 1.7 1.6
Chronic bronchitis (adults) 19.6 9.9 9.1 9.6 8.9
Chronic bronchitis (children) 0.8 0.4 0.4 0.4 0.4
Respiratory hospital admissions 0.4 0.2 0.2 0.2 0.2
Cardiac hospital admissions 0.3 0.1 0.1 0.1 0.1
Restricted activity days 47.5 23.9 21.9 23.1 21.5
Lost working days 18.5 9.6 8.7 9.3 8.6
Asthma symptom days 0.6 0.3 0.3 0.3 0.3
Total (low) 385 196 179 189 176
Total (high) 1,099 559 510 539 501
18TABLE 9: H EALTH CARE COSTS LINKED TO AIR POLLUTION FOR THE EU28, €MILLION2005/ YEAR, CONSTANT 2005
POPULATION (ERR 2030: E MISSION REDUCTION REQUIREMENTS OF THE NECD)
2005 PRIMES 2016 REFERENCE CLIMATE AND ENERGY POLICY
2017 ERR 2030 2017 ERR 2030
legislation legislation
Ozone
Respiratory hospital admissions
20 13 12 13 12
(>64)
Cardiovascular hospital admissions
92 56 55 55 54
(>64)
PM2.5
Chronic Bronchitis (adults) 4,182 2,125 1,939 2,049 1,904
Bronchitis in children aged 6 to 12 60 31 28 29 27
Respiratory Hospital Admissions
168 85 78 82 76
(All ages)
Cardiac Hospital Admissions
124 65 59 62 58
(>18 years)
Asthma symptom days
14 7 7 7 6
(children 5‐19yr)
Not quantified
Acute mortality (NO2, O3)
Effects assumed to have
negligible healthcare costs Minor restricted activity days (O3)
Chronic morbidity (in addition to chronic bronchitis) (NO2, O3 and PM2.5)
Infant morbidity (PM2.5)
Unquantified effects that may Restricted activity days (PM2.5)
have significant healthcare costs
Child bronchitis (NO2)
Respiratory hospital admissions (NO2)
Total where quantified 4,661 2,382 2,270 2,178 2,297
19TABLE 10: ANNUAL HEALTH IMPACTS FOR THE EU28 IN 2030, THOUSAND EVENTS (DEATHS, CASES , DAYS, ETC.),
FORECAST POPULATION FOR 2030 (ERR 2030: E MISSION REDUCTION REQUIREMENTS OF THE NECD)
2005 PRIMES 2016 REFERENCE CLIMATE AND ENERGY POLICY
2017 ERR 2030 2017 ERR 2030
legislation legislation
Ozone
Acute mortality 30 23 22 22 22
Respiratory hospital admissions 20 20 19 19 19
Cardiac hospital admissions 92 87 84 85 83
Minor restricted activity days 123,819 82,439 80,424 80,653 79,252
PM2.5
Chronic mortality
(years of life lost) * 5,002 2,279 2,082 2,197 2,043
Chronic mortality (deaths) * 449 274 250 264 245
Infant mortality 1 0 0 0 0
Chronic bronchitis (adults) 365 211 192 203 189
Chronic bronchitis (children) 1,341 659 602 635 591
Respiratory hospital admissions 168 90 82 87 81
Cardiac hospital admissions 124 70 63 67 62
Restricted activity days 515,845 288,525 263,879 278,290 259,085
Lost working days 142,489 68,614 62,419 66,033 61,266
Asthma symptom days 14,138 6,989 6,389 6,742 6,275
Table 11: Monetised equivalent of annual health impacts for the EU28, €billion2005, forecast
population for 2030 (ERR 2030: Emission reduction requirements of the NECD)
2005 PRIMES 2016 REFERENCE CLIMATE AND ENERGY POLICY
2017 ERR 2030 2017 ERR 2030
legislation legislation
Ozone
Acute mortality (median VOLY) * 1.7 1.3 1.3 1.3 1.3
Acute mortality (mean VOLY) * 4.2 3.1 3.1 3.1 3.0
Respiratory hospital admissions 0.05 0.04 0.04 0.04 0.04
Cardiac hospital admissions 0.2 0.2 0.2 0.2 0.2
Minor restricted activity days 5.2 3.5 3.4 3.4 3.3
PM2.5
Chronic mortality (median VOLY) * 289 132 120 127 118
Chronic mortality (medium VSL) * 998 608 555 586 545
Infant mortality (median VSL) 1.8 0.6 0.5 0.6 0.5
Infant mortality (mean VSL) 3.7 1.2 1.1 1.1 1.1
Chronic bronchitis (adults) 19.6 11.3 10.3 10.9 10.1
Chronic bronchitis (children) 0.8 0.4 0.4 0.4 0.3
Respiratory hospital admissions 0.4 0.2 0.2 0.2 0.2
Cardiac hospital admissions 0.3 0.2 0.1 0.1 0.1
Restricted activity days 47.5 26.5 24.3 25.6 23.8
Lost working days 18.5 8.9 8.1 8.6 8.0
Asthma symptom days 0.6 0.3 0.3 0.3 0.3
Total (low) 385 185 169 178 166
Total (high) 1,099 664 606 640 595
20TABLE 12: H EALTH CARE COSTS LINKED TO AIR POLLUTION FOR THE EU28, € MILLION2005/YEAR, FORECAST
POPULATION FOR 2030 (ERR 2030: E MISSION REDUCTION REQUIREMENTS OF THE NECD)
2005 PRIMES 2016 REFERENCE CLIMATE AND ENERGY POLICY
2017 ERR 2030 2017 ERR 2030
legislation legislation
Ozone
Respiratory hospital admissions
20 20 19 19 19
(>64)
Cardiovascular hospital admissions
92 87 84 85 83
(>64)
PM2.5
Chronic Bronchitis (adults) 4,182 2,413 2,204 2,327 2,164
Bronchitis in children aged 6 to 12 60 30 27 29 27
Respiratory Hospital Admissions
168 90 82 87 81
(All ages)
Cardiac Hospital Admissions
124 70 63 67 62
(>18 years)
Asthma symptom days
14 7 6 7 6
(children 5‐19yr)
Not quantified
Acute mortality (NO2, O3)
Effects assumed to have Minor restricted activity days (O3)
negligible healthcare costs
Chronic morbidity (in addition to chronic bronchitis) (NO2, O3 and PM2.5)
Infant morbidity (PM2.5)
Restricted activity days (PM2.5)
Unquantified effects that may
have significant healthcare costs Child bronchitis (NO2)
Respiratory hospital admissions (NO2)
Total where quantified 4,661 2,716 2,487 2,620 2,442
213.2 Work days lost
The economic analyses conducted for the Clean Air Policy package identified work days lost due to the
exposure to air pollution as a potentially important element of a cost‐benefits analysis (Holland, 2014).
Across the scenarios considered, the direct economic value of the expected reduction of lost working
days was estimated between € 0,7 bn/yr and almost € 3 bn/yr, substantially offsetting the emission
control costs of the proposed reduction scenario. It was, however, acknowledged that this analysis was
based on a limited literature, and so further consideration is given in Annex 1 regarding the validity of
the estimates. The conclusion is that the methods used in the core CBA analysis for the Commission
and presented here are conservative, and likely to underestimate impacts on productivity.
3.2.1 Approach taken for this study
The HRAPIE (Health Response to Air Pollutants in Europe) study carried out by the World Health
Organization for the revision of the Thematic Strategy on Air Pollution of the European Commission did
not provide specific response functions for absenteeim, but referred to the logic of the impact being
present and to the quality of the core study referenced (Ostro, 1987) – see Table 13 It was noted that
the confidence interval for this effect is very tight around the best estimate (relative risk of 1.046 in a
range of 1.039 to 1.053 per 10µg.m‐3). Given the limited literature considered for this effect, the range
was expanded in the uncertainty analysis subsequently performed as part of the CBA, though the best
estimate was retained. The applied range for Monte Carlo analysis was +/‐80% of the best estimate
with a uniform distribution.
TABLE 13. SUMMARY OF RECOMMENDATIONS FOR EFFECTS OF SHORT TERM PM2.5 EXPOSURE ON THE INCIDENCE
OF ABSENTEEISM ( WORK DAYS LOST)
Work days lost
Group B* (lower confidence than category A effects, but still to be included in CBA)
Pollutant metric Annual average PM2.5 with no threshold
Population Working age (20‐64).
Effect Work days lost.
Relative risk 1.046, 95%CI 1.039 to 1.053 per 10 g.m‐3. Range based on results for a population
of 12,000 adults aged 20‐64 from 49 metropolitan areas of the USA.
Result to be subtracted from estimate of RADs where both are applied together.
Population and UN mid estimates for population. For baseline rates, country‐specific data on
incidence data absenteeism from work due to illness is provided by WHO’s European Health for
All database (HFA‐DB) (http://data.euro.who.int/hfadb/). Though the baseline
rates are available for most countries, the definitions and criteria used for
registering sick leave differ between countries increasing uncertainty of burden
estimates.
References Ostro (1987)
223.2.2 Results
The impacts on workdays lost of the air pollution control scenarios presented in the Outlook and report
have been estimated here by applying the same broad method (with updates on employment and
absence statistics) as used for the evaluation of the Thematic Strategy on Air Pollution (TSAP) in 2013
(Holland, 2014). Impacts on lost working days, not accounting for mortality, are shown in Table 14.
Across the EU in 2005, it is estimated that 142 million work days were lost as a result of exposure to air
pollution. Results are calculated for a uniform population, identical to 2005, to factor out the impacts
of demographic change (this is accounted for elsewhere in the study outputs). By 2030 it is forecast
that the number of lost working days will have declined to 74 million under current legislation. The
policy scenarios considered here then further reduce impacts to around 66 million lost working days
per year.
To put these figures into context, they correspond to a decline from 0.63 working days lost to air
pollution per worker on average to 0.3 under the policy scenarios.
Costs associated with lost working days are shown in Table 15, with costs for the EU28 in 2005 of €18.5
billion/year, falling to €8.5 billion/year by 2030 under the policy scenarios.
As noted in Annex 1, analysis elsewhere (e.g., USEPA, 2011; Ricardo/IOM, 2014; World Bank, 2016),
suggests additional impacts on productivity beyond those described by the response function for acute
exposure to PM2.5 and work days lost. These arise from impacts on mortality amongst those in the
workforce and other morbidity impacts. A broad indication of the costs arising from the wider
assessment of lost productivity can be gained by applying the ratio of total impact from the
Ricardo/IOM study to their estimate of costs associated specifically with the loss of working days
quantified for PM2.5 using the function from Ostro, as recommended by HRAPIE. Results are shown in
Table 16, with costs for the EU28 in 2005 of €66 billion/year, falling to €30 billion/year by 2030 under
the policy scenarios.
23TABLE 14: WORK DAYS LOST (THOUSANDS) UNDER THE SCENARIOS CONSIDERED . CONSTANT 2005 POPULATION
ASSUMED
2005 PRIMES 2016 REFERENCE CLIMATE AND ENERGY POLICY
2017 ERR 2030 2017 ERR 2030
legislation legislation
EU countries
Austria 2,003 1,091 1,007 1,045 976
Belgium 3,317 1,927 1,632 1,852 1,607
Bulgaria 2,631 1,004 949 966 915
Cyprus 201 130 129 130 129
Czech Republic 4,412 2,427 2,195 2,346 2,159
Germany 30,749 18,329 16,127 17,718 15,985
Denmark 878 475 447 457 434
Estonia 157 107 103 103 100
Spain 11,088 4,360 4,215 4,194 4,071
Finland 612 433 426 404 399
France 14,303 7,107 6,583 6,756 6,394
United Kingdom 7,692 3,531 3,270 3,506 3,265
Greece 4,323 1,707 1,673 1,651 1,636
Croatia 1,655 735 677 717 667
Hungary 3,258 1,705 1,492 1,666 1,475
Ireland 480 244 234 239 229
Italy 18,846 10,025 9,067 9,681 9,001
Lithuania 533 321 309 310 301
Luxembourg 107 58 52 56 52
Latvia 367 226 219 219 213
Malta 48 26 25 26 25
Netherlands 4,991 2,674 2,419 2,586 2,387
Poland 18,561 10,120 9,072 9,426 8,769
Portugal 2,455 1,038 981 1,018 968
Romania 5,775 2,459 2,277 2,389 2,215
Sweden 863 574 555 558 542
Slovenia 692 341 301 322 294
Slovakia 1,489 808 746 842 747
Non‐EU countries
Albania 640 338 334 336 333
Bosnia and H. 807 409 396 405 394
Belarus 1,760 1,348 1,321 1,331 1,311
Switzerland 1,508 1,031 986 1,009 980
Serbia and M. 3,008 1,378 1,337 1,365 1,330
Moldova 842 563 550 558 546
TFYR Macedonia 97 45 44 44 44
Norway 517 411 405 409 404
Russian Federation 21,047 18,721 18,683 18,694 18,665
Ukraine 4,217 3,223 3,185 3,208 3,176
EU total 142,489 73,982 67,181 71,182 65,953
Non‐EU total 34,443 27,466 27,241 27,358 27,182
Total 176,932 101,447 94,422 98,540 93,135
24TABLE 15: VALUE OF LOST WORKING DAYS (€MILLION/YEAR)
2005 PRIMES 2016 REFERENCE CLIMATE AND ENERGY POLICY
2017 ERR 2030 2017 ERR 2030
legislation legislation
EU countries
Austria 260 142 131 136 127
Belgium 431 250 212 241 209
Bulgaria 342 130 123 126 119
Cyprus 26 17 17 17 17
Czech Republic 574 316 285 305 281
Germany 3,997 2,383 2,097 2,303 2,078
Denmark 114 62 58 59 56
Estonia 20 14 13 13 13
Spain 1,441 567 548 545 529
Finland 80 56 55 53 52
France 1,859 924 856 878 831
United Kingdom 1,000 459 425 456 424
Greece 562 222 218 215 213
Croatia 215 96 88 93 87
Hungary 424 222 194 217 192
Ireland 62 32 30 31 30
Italy 2,450 1,303 1,179 1,259 1,170
Lithuania 69 42 40 40 39
Luxembourg 14 8 7 7 7
Latvia 48 29 28 28 28
Malta 6 3 3 3 3
Netherlands 649 348 314 336 310
Poland 2,413 1,316 1,179 1,225 1,140
Portugal 319 135 128 132 126
Romania 751 320 296 311 288
Sweden 112 75 72 73 70
Slovenia 90 44 39 42 38
Slovakia 194 105 97 109 97
Non‐EU countries
Albania 83 44 43 44 43
Bosnia and H. 105 53 51 53 51
Belarus 229 175 172 173 170
Switzerland 196 134 128 131 127
Serbia and M. 391 179 174 177 173
Moldova 109 73 71 73 71
TFYR Macedonia 13 6 6 6 6
Norway 67 53 53 53 52
Russian Federation 2,736 2,434 2,429 2,430 2,426
Ukraine 548 419 414 417 413
EU total 18,524 9,618 8,734 9,254 8,574
Non‐EU total 4,478 3,571 3,541 3,557 3,534
Total 23,001 13,188 12,275 12,810 12,108
25TABLE 16: UPPER BOUND ESTIMATE OF PRODUCTIVITY IMPACTS (€MILLION/YEAR )
2005 PRIMES 2016 REFERENCE CLIMATE AND ENERGY POLICY
2017 ERR 2030 2017 ERR 2030
legislation legislation
EU countries
Austria 923 503 464 482 450
Belgium 1,529 888 752 854 741
Bulgaria 1,213 463 438 445 422
Cyprus 93 60 59 60 59
Czech Republic 2,034 1,119 1,012 1,081 995
Germany 14,175 8,449 7,435 8,168 7,369
Denmark 405 219 206 211 200
Estonia 72 49 47 48 46
Spain 5,112 2,010 1,943 1,933 1,877
Finland 282 199 196 186 184
France 6,594 3,276 3,035 3,114 2,948
United Kingdom 3,546 1,628 1,507 1,616 1,505
Greece 1,993 787 771 761 754
Croatia 763 339 312 330 307
Hungary 1,502 786 688 768 680
Ireland 221 113 108 110 106
Italy 8,688 4,621 4,180 4,463 4,149
Lithuania 246 148 142 143 139
Luxembourg 49 27 24 26 24
Latvia 169 104 101 101 98
Malta 22 12 12 12 12
Netherlands 2,301 1,233 1,115 1,192 1,101
Poland 8,556 4,665 4,182 4,345 4,042
Portugal 1,132 479 452 469 446
Romania 2,662 1,133 1,050 1,101 1,021
Sweden 398 265 256 257 250
Slovenia 319 157 139 149 136
Slovakia 686 372 344 388 344
Non‐EU countries
Albania 295 156 154 155 153
Bosnia and H. 372 188 182 187 181
Belarus 811 622 609 614 604
Switzerland 695 475 455 465 452
Serbia and M. 1,387 635 616 629 613
Moldova 388 260 253 257 252
TFYR Macedonia 45 21 20 20 20
Norway 238 189 187 188 186
Russian Federation 9,703 8,630 8,613 8,618 8,605
Ukraine 1,944 1,486 1,468 1,479 1,464
EU total 65,687 34,105 30,970 32,814 30,404
Non‐EU total 15,878 12,661 12,558 12,612 12,531
Total 81,564 46,766 43,528 45,426 42,935
3.2.3 Main findings
There is broad consensus that air pollution affects productivity in the economy, with studies carried
out in Europe, the USA, and by international organisations including WHO, OECD and World Bank.
There are a variety of mechanisms by which productivity can be affected:
26• Effects of short term (acute) exposure on morbidity, leading to an inability to attend work
• Effects leading to reduced performance at work (presenteeism)
• Reduction in the size of the labour force through impacts on mortality
• Inability to work through longer term health issues (e.g. associated with cardiovascular or
respiratory illness)
Existing analysis for the European Commission for the CBA is limited to the first of these mechanisms.
Results appear to be of a reasonable order of magnitude, averaging around 0.5 work days lost per year
per employee from air pollutant exposure. There is broad consistency between the response function
adopted for this analysis and the response functions adopted for other health conditions.
Overall, it is considered that the restricted analysis performed for the European Commission to date is
likely to be conservative, providing a lower bound for impacts on productivity.
Taking a range based largely around the question of whether or not mortality is included in the analysis
of productivity losses gives the following estimates for the EU28:
• 2005: €19 ‐ €66 billion/year
• 2030, current legislation: €10 ‐ €35 billion/year
• 2030, policy scenarios: €8.5 ‐ €30 billion/year
Associated damage is therefore significant. This paper provides a rationale for considering the
estimates made so far for the European Commission to be conservative.
3.3 Non‐health benefits
The impact assessment of the EU air policy package only describes the physical damage of air pollution
to nature, i.e., the percentage of Natura2000 areas in a grid cell with an exceedance of the critical load
of nitrogen is used as a proxy for potential biodiversity loss. In the FP7 project ECLAIRE, efforts were
made to monetise the loss of biodiversity (ECLAIRE, 2015). Several methods were explored, such as
• monetisation of damage to the local economy (e.g., reduced wood production); lost
opportunities of carbon sequestration;
• reduced value of nature due to species loss (derived from stated preference surveys);
• increased costs of nature management to remove excess nitrogen; or
• the implied costs of sufficiently reducing nitrogen emissions in and around the assigned
Natura2000 areas to guarantee a ‘favourable’ conservation status for these areas (the so‐
called regulatory revealed preference method).
Whatever method was used, the estimated damage to nature was modest compared to the monetised
mortality figures. While the low‐end (willingness to pay based) estimates of the damage to nature
would be more than twice the sum of damage to crops and materials, the monetised damage to nature
would be ‘only’ 3‐12% of the damage to health.
A sensitivity analysis with the GAINS‐model showed that the incremental benefits of adding an
additional 75% gap‐closure target for nature conservation (on top of a 70% gap‐closure for health
protection) would exceed the 1% increase in abatement costs. Such a strategy would imply additional
27ammonia measures for large farms at a cost of €23 million for the EU28, while additional nature benefits
would be worth €35‐2500 million (ECLAIRE, 2015b).
For the purpose of this assessment, and in line with earlier benefit analyses for the Clean Air Policy
package, monetized benefits have been estimates for crops, forest production, carbon sequestration,
ecosystems and materials, both for the EU‐Member States and the non‐EU countries (Table 17).
TABLE 17: N ON HEALTH IMPACTS, BY SCENARIO. €MILLION2005/YEAR
2005 PRIMES 2016 REFERENCE CLIMATE AND ENERGY POLICY
2017 ERR 2030 2017 ERR 2030
legislation legislation
Crops: EU 8,649 6,515 6,448 6,430 6,390
Crops: Non‐EU 2,613 2,159 2,151 2,149 2,143
Crops: total 11,262 8,674 8,599 8,579 8,533
Forest production: EU 2,911 2,398 2,381 2,377 2,367
Forest production: non‐EU nq nq nq nq nq
Forest production: total 2,911 2,398 2,381 2,377 2,367
Forest C sequestration: EU 1,536 5,054 5,019 5,009 4,989
Forest C sequestration: non‐EU nq nq nq nq nq
Forest C sequestration: total 1,536 5,054 5,019 5,009 4,989
Ecosystems: EU 3,435 2,826 2,570 2,791 2,542
Ecosystems: non‐EU nq nq nq nq nq
Ecosystems: total 3,435 2,826 2,570 2,791 2,542
Materials: EU 1,501 356 314 322 302
Materials: non‐EU nq nq nq nq nq
Materials: total 1,501 356 314 322 302
Total non‐health: EU 18,032 17,149 16,733 16,929 16,590
Total non‐health: non‐EU 2,613 2,159 2,151 2,149 2,143
Total non‐health, all countries 20,645 19,308 18,883 19,077 18,733
28You can also read