Joint Strategic Needs Assessment: Outdoor Air Quality in Kingston - Kingston Council
←
→
Page content transcription
If your browser does not render page correctly, please read the page content below
Joint Strategic Needs Assessment:
Outdoor Air Quality in Kingston
March 2018

Emily Humphreys
Tejal Indulkar
James Moore
Helen Raison
Russell Styles
Dave Trew
Contents
Summary .............................................................................................................................. 4
1.        Introduction .................................................................................................................... 5
2.        Scope of this document.................................................................................................. 6
3.        What is air pollution and where does it come from? ....................................................... 7
     Sources of air pollution ...................................................................................................... 7
          Roads .......................................................................................................................... 10
          Construction................................................................................................................. 10
          Industry and agriculture................................................................................................ 10
          Domestic sources of air pollution ................................................................................. 10
          Aviation ........................................................................................................................ 11
          Natural factors affecting air pollution and its distribution ............................................... 11
4.        Impact of air pollution on public health ......................................................................... 12
     What is the overall health impact? ................................................................................... 12
     Who is affected? Air pollution and health inequalities ...................................................... 13
          Children and young people .......................................................................................... 13
          Older people and people with health problems ............................................................ 14
          Socio-economic status ................................................................................................. 14
          Road transport users ................................................................................................... 15
     Which health conditions are linked to pollution? .............................................................. 17
5.        Air quality and public health in Kingston ....................................................................... 18
     Overall air quality in Kingston .......................................................................................... 18
     How does Kingston compare to the rest of London?........................................................ 19
     Local air quality hotspots ................................................................................................. 20
          Overall air quality hotspots ........................................................................................... 20
          Nitrogen dioxide hotspots............................................................................................. 21
     Air quality and educational institutions ............................................................................. 24
     Public health effects of air pollution in Kingston ............................................................... 27
          Attributable deaths ....................................................................................................... 27
          Vulnerable people ........................................................................................................ 28
6.        Community Voice ......................................................................................................... 30
7.        What works? ................................................................................................................ 31
     1.      Planning ................................................................................................................... 31
     2.      Development Management....................................................................................... 31
     3.      Clean Air Zones........................................................................................................ 32
     4.      Reducing emissions from public sector transport services and vehicle fleets ........... 32

                                                                                                                                            2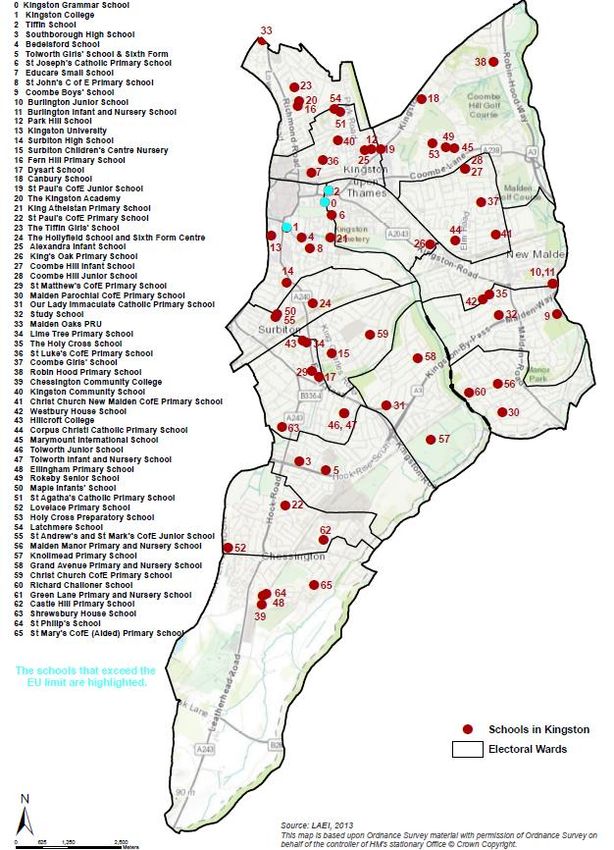
5.      Smooth driving and speed reduction ........................................................................ 32
     6.      Walking and cycling .................................................................................................. 32
     7.      Awareness raising .................................................................................................... 33
     Vulnerable groups ........................................................................................................... 34
     Efficient combustion and minimising other sources of air pollution................................... 34
8.        Current action on air quality ......................................................................................... 36
     National and international action...................................................................................... 36
     London action .................................................................................................................. 37
          London’s support for local air quality management ...................................................... 37
     Local action in Kingston ................................................................................................... 40
          Active Travel ................................................................................................................ 40
          Kingston Go Cycle (formerly Mini-Holland) Programme ............................................... 41
          Control of emissions from new developments .............................................................. 41
          Control of emissions from chimneys............................................................................. 42
          Control of smoke from bonfires .................................................................................... 42
          Air Pollution Alerts and communication ........................................................................ 42
          Low Pollution Walking Routes ...................................................................................... 43
          Kingston Beat the Street .............................................................................................. 43
          Kingston University ...................................................................................................... 44
          Environmental permits ................................................................................................. 44
9.        Recommendations ....................................................................................................... 45
Appendix A: Sources and impacts of key pollutants ............................................................ 48
Appendix B: London Atmospheric Emissions Inventory background and projections for
Kingston upon Thames ....................................................................................................... 49
Appendix C: Traffic, vehicle ownership and transport trends Kingston ................................ 61
Appendix D: Methodological note on estimated deaths attributable to air pollution in Kingston
........................................................................................................................................... 63
Appendix E: Glossary.......................................................................................................... 66

                                                                                                                                            3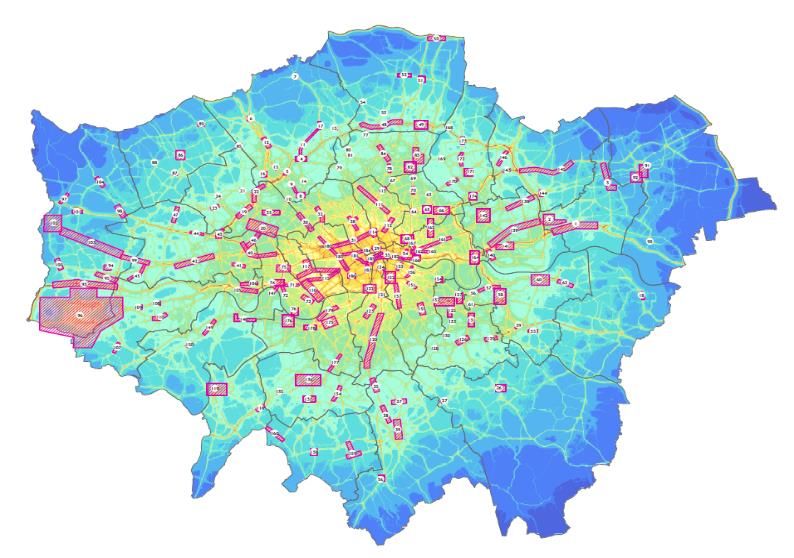
Summary

Poor air quality is having a significant impact on the health of people who live, work, study
and spend time in Kingston, contributing to the equivalent of one in twenty deaths for people
who live in the area. It has been linked to strokes, heart disease, asthma and Chronic
Obstructive Pulmonary Disease (COPD) and it particularly affects vulnerable people,
including children, older people, those with health problems and those who live in deprived
communities.

Over the long term, Kingston’s air quality has improved, and is expected to reach key EU air
quality targets by 2020. However, there are some pollutants for which no safe level of
exposure has been found, and almost all parts of the borough have worse air quality than
the average for England. This means air quality remains an important public health issue for
Kingston and for other parts of Greater London.

Although harmful outdoor air pollution comes from many places, the biggest source of it in
Kingston is road traffic. Air pollution is most concentrated in parts of Kingston where there is
high traffic congestion, so successfully reducing emissions from traffic would be the most
impactful thing to do to reduce the harm that pollution causes to the health of local people.

Kingston Council is already working to improve air quality through its Air Quality Action Plan,
and there are opportunities to go further by making it easy for more people to walk, cycle
and use public transport for local journeys and by making sure planning rules consider the
air quality impact of new developments.

Local business and public services all have a part to play too. Schools, colleges, hospitals
and healthcare facilities, and employers all contribute to congestion and transport emissions,
and can all help to reduce their impact on both the local environment and on people’s health.

This JSNA chapter makes recommendations for all these organisations and for local
residents and visitors about how to minimise the health impact of outdoor air pollution.

                                                                                               4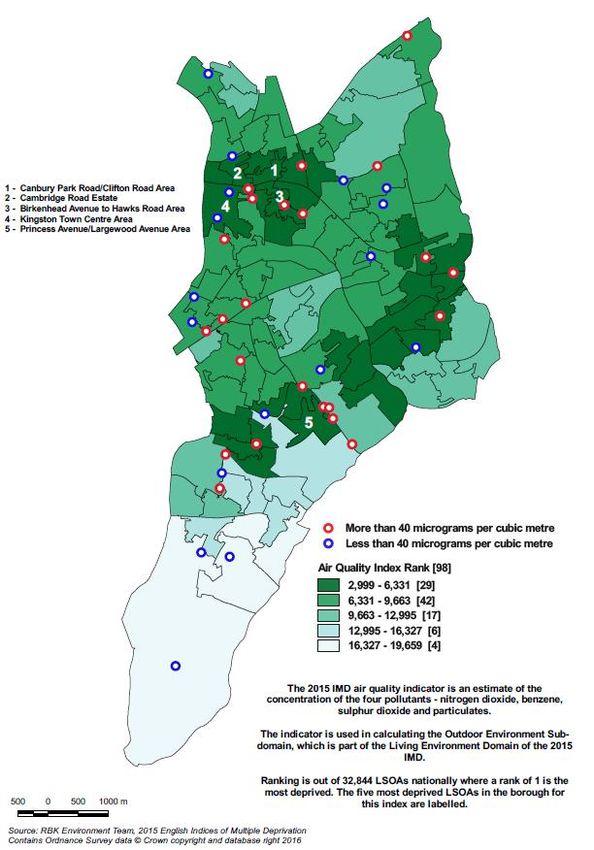
1. Introduction

Air pollution is a major public health issue, causing an estimated three million deaths a year
around the world.1 2

Although air quality in western Europe is better than in many lower and middle-income
countries, pollution is the single biggest environmental contributor to ill-health in the UK and
around the world.3 Reducing pollution is a priority for national, regional and local government
following high profile breaches of European limits for some of the most common pollutants.

London has been a focal point for public health action on air quality since the Clean Air Act
of 1956, which followed a reported 4,000 deaths during the Great Smog.4 The Clean Air Act
brought about dramatic reductions in coal burning and visible pollution, and as a result we
now face very different challenges in how to improve the quality of the air we breathe, with
most air pollution now coming from road traffic.

Kingston’s air is generally healthier than that of some other parts of London, but the people
who live, work, study or visit the borough can still be exposed to levels of pollution that are
harmful to their health, particularly close to busy, congested roads.

1 Kelly and Fussell, Air pollution and public health: emerging hazards and improved understanding of
risk, Environmental Geochemistry and Health August 2015, Volume 37, Issue 4, pp 631–649
https://link.springer.com/article/10.1007/s10653-015-9720-1
2
  http://www.who.int/gho/phe/outdoor_air_pollution/burden_text/en/ (accessed January 2018)
3
  Global Burden of Disease, 2015, see http://www.thelancet.com/lancet/visualisations/gbd-compare
(accessed February 2018)
4 BBC, Great Smog 60 Years On, 2012 http://www.bbc.co.uk/news/uk-england-london-20269309

(accessed January 2018)

                                                                                                       5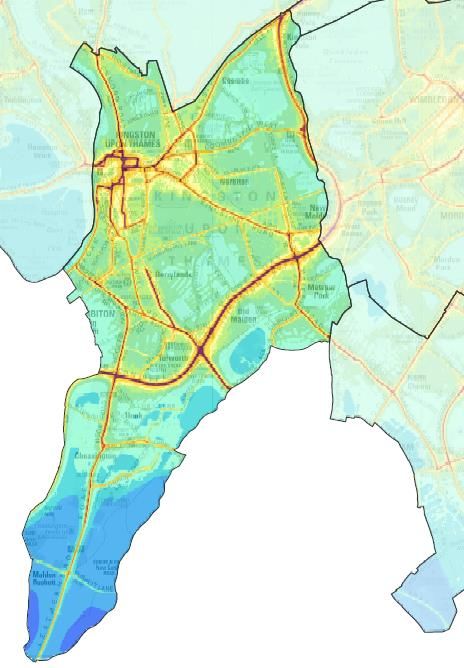
2. Scope of this document
This document has been prepared by Kingston Public Health. It forms a chapter of the
Kingston Joint Strategic Needs Assessment (JSNA), which the Health and Wellbeing Board
has a statutory duty to prepare in order to inform the Joint Health and Wellbeing Strategy.

This JSNA chapter reviews current evidence about outdoor air quality in Kingston and
makes recommendations about what can be done to reduce its negative impact on public
health. It brings this evidence together with information about the priorities of local people
and the plans of Kingston Council and other local organisations.

By combining these sources of information, we can:

    ●   Identify what can be done about air quality to make the most difference to public
        health in Kingston
    ●   Identify and build on the strengths of our existing local approach to improving air
        quality
    ●   Make the case for more local action where it is needed

It is intended to be useful to the following groups of people, and makes a series of
recommendations for each of them:

    ●   The Greater London Authority
    ●   Kingston Council’s Parking, Highways and Transport, Planning, Public Health and
        Environmental Health teams
    ●   Healthcare commissioners and providers
    ●   Developers
    ●   Kingston residents
    ●   Local businesses and other employers
    ●   Local schools, colleges and universities

This document is specifically focused on outdoor air quality, its public health effects in
Kingston and how to mitigate these effects locally. It does not give systematic consideration
to indoor air quality or to other environmental determinants of health such as noise pollution
or climate change. Although it also reviews some aspects of the wider context, it also does
not make recommendations about what action is required to reduce the public health impact
of air pollution at national or international level.

Nevertheless, an estimated 40-55% of particulate air pollution in London comes from outside
the area.5 This means that a comprehensive approach to air quality improvements needs
international, national and regional action as well as local plans, and it is important that work
to protect people’s health from the effects of air pollution continues at all these levels.

5GLA, Air Quality in Kingston upon Thames: A guide for Public Health Professionals (accessed
January 2018)

                                                                                                 6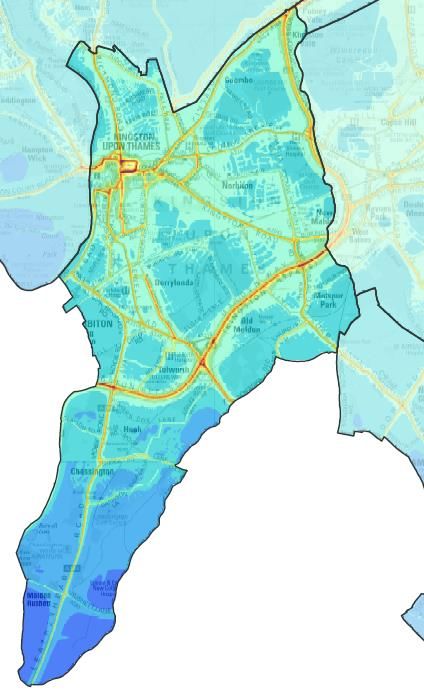
3. What is air pollution and where does it come from?
“Air pollution” refers to any chemical, physical, or biological agent that changes the natural
characteristics of the atmosphere6. The air pollutants that are most relevant to health in
Kingston are particulate matter (PM10 and PM2.5), oxides of nitrogen (NOx), sulphur dioxide
(S02) and ozone (O3).

Particulate matter is a mixture of tiny
particles made up of different chemicals.
It’s categorised by the size of the
particles rather than by what they are
made from. PM10 means particles that
are less than 10 microns across, while
PM2.5 means particles less than 2.5
microns across (see figure 1).7 The
smaller the particle, the easier it is for it
to get deep into the lungs, so the
smaller particles are ones most likely to
impact public health.

Oxides of nitrogen (NOx) are gases
which are produced when fuels are        Figure 1: size of particulates (source:
burned at high temperatures. Nitrogen    reference 7)
dioxide (NO2) is the most commonly
monitored. Road fuel burning mainly produces NO, which reacts rapidly in the atmosphere to
produce NO2.

Sulphur dioxide (SO2) is a gas which comes from burning fuels.

Ozone (O3) is a gas made from oxygen in the Earth’s atmosphere rather than being emitted
directly. It’s found naturally in the stratosphere, but it can also be both created and removed
by chemical reactions with other sources of air pollution.

Sources of air pollution

Air pollution comes from a range of local, national and international sources. Local factors
can lead to major variations in air quality, with different communities affected by different
problems: urban areas may have dense traffic on the roads, rural areas may be affected by
agricultural processes, while coastal areas may be more affected by shipping. Nevertheless,
air quality is affected by complex interactions between many different sources of pollution, as

6
    https://www.sciencedaily.com/terms/air_pollution.htm
7 From DEFRA, PHE and LGA, Air Quality: a briefing for Directors of Public Health, 2017,
http://www.adph.org.uk/wp-content/uploads/2017/03/6.3091_DEFRA_AirQualityGuide_9web.pdf
(accessed January 2018)

                                                                                                  7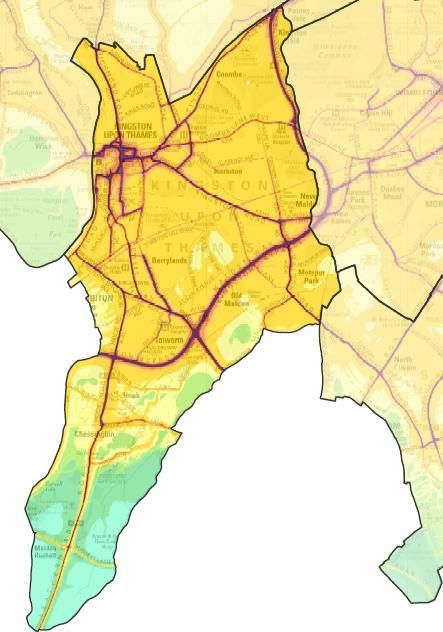
well as by weather patterns, which means that not all of the sources of air pollution in an
area can be addressed locally (see figure 2).8

8 From DEFRA, PHE and LGA, Air Quality: a briefing for Directors of Public Health, 2017,
http://www.adph.org.uk/wp-content/uploads/2017/03/6.3091_DEFRA_AirQualityGuide_9web.pdf
(accessed January 2018)

                                                                                              8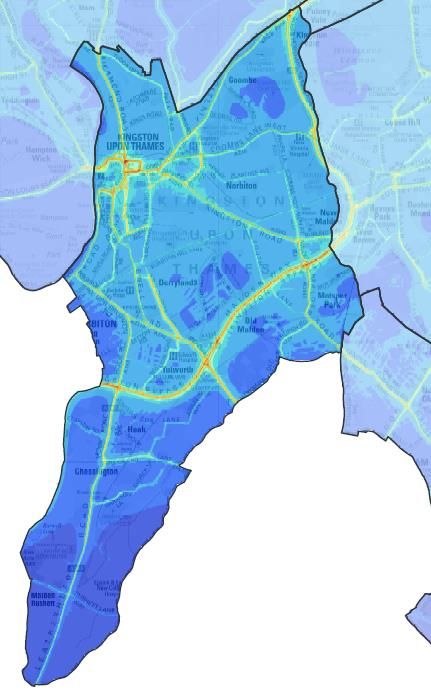
Figure 2: sources of air pollution (source – reference 7)   Key
                                                            NO2 – nitrogen dioxide
                                                            PM - particulate matter (includes PM10 and
                                                            PM2.5)
                                                            See page 7 for full definitions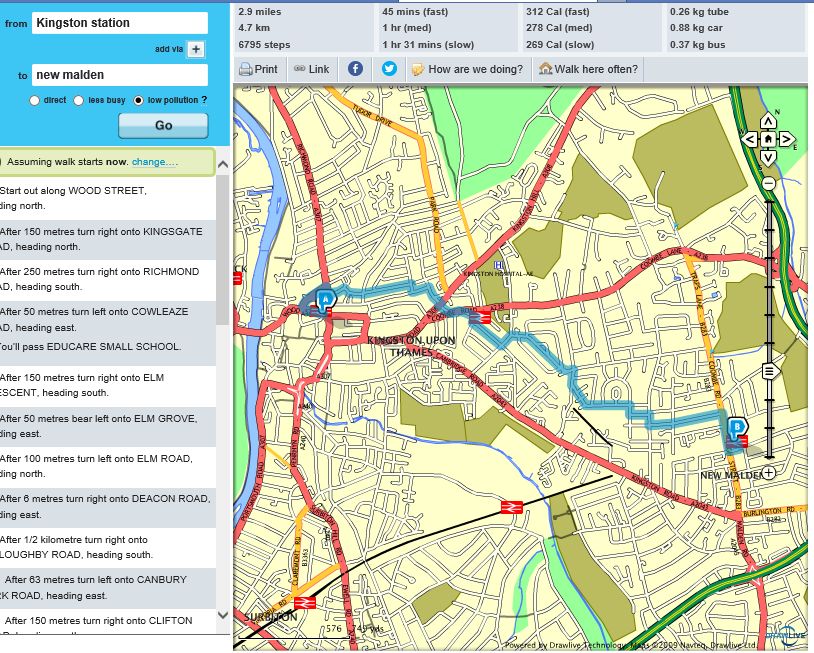
Roads
Motorised road traffic is the single biggest contributor to NOx and particulate matter (PM10) in
London.9

Pollution comes from both the burning of fuel, which can emit several different types of gas,
and from wear-and-tear on brake pads, tyres, and road surfaces which can produce fine
particles. All kinds of motorised road traffic can contribute to air pollution, but not all vehicles
are the same. The type of fuel, and the vehicle’s load and age can make a big difference.
Diesel cars emit more NOx and particulates than petrol cars: around a third of all UK NOx
emissions in 2015 came from road transport, and the majority of this was from diesel
vehicles.10

The age of a vehicle also makes a big difference because European emissions standards
have become stricter over time. Newer vehicles are manufactured to comply with the latest
standards and should emit fewer pollutants than older vehicles if they are well maintained.
Emissions of NOx from passenger cars decreased by 83% between 1990 and 2015.11

Construction
Construction projects can create a lot of localised particulate matter through both the
demolition and building process.12 Associated industries such as quarrying and transport can
further increase the impact of construction on air quality.

Industry and agriculture
Industrial processes, particularly those involving combustion of gas, oil or coal, can release
many different by-products into the air. Power plants are responsible for roughly 50% of SO2
emissions, and combustion (from both commercial and domestic sources) is also the main
source of particulate emissions.13 However, the amount of PM2.5 from power stations has
fallen by 91% since 1990.14

Agricultural processes result in the production of waste products entering the environment.
Agriculture is the leading contributor to the production of ammonia, which can come from
fertiliser and breakdown of urea (present in urine from farm animals).15

Domestic sources of air pollution
Fuel burning is the main source of air pollution from individual households. Domestic
heating, bonfires and barbecues can generate a lot of particulate matter, particularly when
burning solid fuel.16

Between 1990 and 2002, people used less coal to heat their homes and emissions from
domestic solid fuel burning fell significantly. However, this trend has since been reversed

9 IPPR, Lethal and Illegal: London’s Air Pollution Crisis, 2016
10 National Atmospheric Emissions Inventory,
http://naei.beis.gov.uk/overview/pollutants?pollutant_id=6, (accessed December 2017)
11 National Atmospheric Emissions Inventory,

http://naei.beis.gov.uk/overview/pollutants?pollutant_id=6, (accessed December 2017)
12 http://naei.defra.gov.uk/overview/ap-overview
13 National Atmospheric Emissions Inventory,

http://naei.beis.gov.uk/overview/pollutants?pollutant_id=24 (accessed December 2017)
14 National Atmospheric Emissions Inventory,

http://naei.beis.gov.uk/overview/pollutants?pollutant_id=122 (accessed December 2017)
15 See https://ec.europa.eu/environment/efe/themes/air/agricultural-sector-must-reduce-emissions-

and-help-fight-air-pollution_en
16 National Atmospheric Emissions Inventory,

http://naei.beis.gov.uk/overview/pollutants?pollutant_id=24 (accessed December 2017)
because of the growth in domestic wood burning, and overall domestic emissions of PM2.5
are now back at around 1990 levels, with approximately 85% now coming from wood
burning.17

Aviation
Aircraft engines are generally efficient and produce relatively low emissions, but pollution is
greater at take-off and landing which can affect local air quality near airports.18 This effect is
compounded by higher levels of road traffic to and from airports, and by noise pollution for
local communities near take-off and landing paths.

Natural factors affecting air pollution and its distribution
Relatively uncommon events such as volcanic eruptions and forest fires can produce SO2 as
well as other potentially harmful products of combustion.

Weather patterns can lead to the distribution of both natural and human-made pollutants
hundreds of miles from their original source, and can either help to disperse pollution, or
increase its intensity. For example, Saharan dust cloud episodes have been widely reported
in the UK media, and a DEFRA-commissioned report has identified that climate change
could make these events more common because of the northern spread of desertification.19

17 National Atmospheric Emissions Inventory,
http://naei.beis.gov.uk/overview/pollutants?pollutant_id=122 (accessed December 2017)
18 The International Civil Aviation Organization (ICAO) sets international standards for smoke and
certain gaseous pollutants for newly-produced large jet engines; it also restricts the venting of raw
fuels. https://www.icao.int
19 Sami Consulting, STRATEGIC EVIDENCE OF FUTURE CHANGE Horizon Scanning evidence and

analysis report (1) Appendices C and D Defra Partnership, p41
http://www.samiconsulting.co.uk/5defra1march2015appendicesCD.pdf, accessed 8 December
2017

                                                                                                  11
4. Impact of air pollution on public health
What is the overall health impact?
The Royal College of Physicians has estimated that the equivalent of around 40,000 deaths
per year in the UK can be linked to the combined impact of particulate matter and NOx20. If
babies born in London in 2010 were exposed to the same levels of particulate matter
throughout their lives as they were at their birth, then on average, they would lose at least
nine months of life expectancy.21
Although international agencies including the EU have established limit values for key
pollutants including particulates22, there is evidence that long-term exposure to
concentrations of PM2.5 well below these limits is linked to health risks23 24. The higher the
concentration, the more significant the health impact, but no threshold has been found below
which there are no health effects, so international guidelines aim to achieve the lowest
possible concentrations.25
Air pollution can have both short- and long-term effects on people’s health but it is the long-
term build-up of harm over time that has the greatest overall impact. Figure 3 is the World
Health Organisation’s illustration of the health effects of air quality on a whole population,
with many people experiencing mild or unnoticeable effects and fewer people experiencing
the most severe impact.26
20 Royal College of Physicians, Every Breath We Take (2016)
21 King’s College London, Understanding the health impacts of air pollution in London, 2015, p10
https://www.london.gov.uk/sites/default/files/hiainlondon_kingsreport_14072015_final.pdf (accessed
December 2017)
22 See section 8, Current Action on Air Quality
23 Cesaroni et al, Long term exposure to ambient air pollution and incidence of acute coronary events:
prospective cohort study and meta-analysis in 11 European cohorts from the ESCAPE Project,
BMJ 2014; 348:f7412 https://doi.org/10.1136/bmj.f7412; Beelen et al, Lancet, 383, 9919, Effects of
long-term exposure to air pollution on natural-cause mortality: an analysis of 22 European cohorts
within the multicentre ESCAPE project http://www.thelancet.com/journals/lancet/article/PIIS0140-
6736%2813%2962158-3/abstract
24 Beelen et al, Lancet, 383, 9919, Effects of long-term exposure to air pollution on natural-cause
mortality: an analysis of 22 European cohorts within the multicentre ESCAPE project
http://www.thelancet.com/journals/lancet/article/PIIS0140-6736%2813%2962158-3/abstract
25 WHO, 2016, Air Quality Factsheet http://www.who.int/mediacentre/factsheets/fs313/en/ (accessed
December 2017)
26 Taken from GLA, Air Quality in Kingston upon Thames: A guide for Public Health Professionals
(accessed January 2018)
12Figure 3:
Pyramid of air
pollution
health effects
Who is affected? Air pollution and health inequalities
Air pollution can affect everyone, particularly in urban areas with a significant amount of
traffic pollution, but there is a disproportionate impact on some groups of people, either
because they are exposed to more pollution or because they are particularly vulnerable to it
in some way.27 The factors that put people at risk are often interrelated: age, sex, diet,
income, body size and genetics can all play a part.
Nevertheless, in general, those who spend the most time in areas where air pollution is
concentrated are at the greatest risk. In the UK, this particularly includes those who live or
work near busy roads, or who drive for a living. This is because air pollution is typically at its
highest at the emission source, and as the distance from the source increases, air pollution
tends to decrease.
Children and young people
Children may be especially vulnerable to air pollution for many reasons. Their exposure may
be higher because they breathe more quickly than adults and spend more time exercising
outdoors.28 Those in buggies and prams are also physically closer to car exhaust pipes.29 As
well as having higher exposure, children may also be more affected by air pollution because
their lungs are not yet fully formed. There is evidence that exposure to high background
27 Deguen S and Zmirou-Navier D, Social inequalities resulting from health risks related to ambient air
quality—A European review, European Journal of Public Health, Vol. 20, No. 1, 27–35, 2010
28 American Academy of Pediatrics Committee on Environmental Health, Policy Statement: Ambient
Air Pollution: Health Hazards to Children, Pediatrics, 114, 6, 2004
http://pediatrics.aappublications.org/content/pediatrics/114/6/1699.full.pdf
29 British Lung Foundation, How air pollution affects your children’s lungs
13levels of air pollution affects their lung function and development as well as their risk of
having asthma.30
There is also a growing body of evidence suggesting that prenatal exposure to air pollution
may be associated with adverse outcomes in pregnancy. These include low birth weight, still
birth, intra uterine growth retardation and an increased risk of chronic disease in later life.31
Older people and people with health problems
The impact of short term episodes of poor air quality appears to particularly strongly affect
older people, perhaps because they are more likely to already have health problems which
are affected by pollution. For example, there are associations between high concentrations
of air pollution and hospital admissions for cardiovascular conditions in older people.32
Both lung and heart conditions can make people more vulnerable. There is particularly
strong evidence that air pollution affects lung function and worsens symptoms for people
with asthma and COPD.33
Socio-economic status
People living in deprived areas are often exposed to higher concentrations of air pollution
than those in wealthier areas, though there are exceptions in wealthy town centres.34 35 36
Research carried out on behalf of DEFRA found that across England, the proportion of
people exposed to the highest levels of PM10 was ten times as high in the most deprived
groups than the least deprived.37 London has a clear socioeconomic gradient in levels of
exposure to NOx and particulates, which may also affect people where they work and study,
as well as where they live.38 In 2010, 82% of the schools exposed to poor air quality in
London were deprived schools (defined as having a high proportion of children receiving free
school meals).39
30 Kulkarni & Grigg, Effect of Air Pollution on Children, 2008
https://www.sciencedirect.com/science/article/pii/S1751722208000280
31 GLA, Air Quality in Kingston upon Thames: A guide for Public Health Professionals (accessed
January 2018)
32 https://www.ncbi.nlm.nih.gov/pmc/articles/PMC1513338/
33 Kelly FJ, & Fussell JC, 2011, Air pollution and airway disease. Clinical and Experimental Allergy,
41(8), 1059–1071.
34 Local Government Association and Association of Directors of Public Health, Air Quality: A guide for
Directors of Public Health, 2017 http://www.adph.org.uk/wp-
content/uploads/2017/03/6.3091_DEFRA_AirQualityGuide_9web.pdf
35 Milojevic et al. Socioeconomic and urban-rural differentials in exposure to air pollution and mortality
burden in England, Environmental Health (2017) 16:104
36 Goodman et al, Characterising socio-economic inequalities in exposure to air pollution: A
comparison of socio-economic markers and scales of measurement, Health & Place
Volume 17, Issue 3, May 2011, Pages 767- 774
http://www.sciencedirect.com/science/article/pii/S1353829211000220
37 20.3% and 2% respectively of the most and least deprived deciles lived in the 10% of areas with the
highest PM10 concentrations, Pye et al, Air Quality and Social Deprivation in the UK: an
environmental inequalities analysis, AEA Technology, 2006 https://uk-
air.defra.gov.uk/assets/documents/reports/cat09/0701110944_AQinequalitiesFNL_AEAT_0506.pdf
(accessed January 2018)
38 Aether, 2013, Analysing Air Pollution Exposure in London, Report to the Greater London Authority,
https://www.london.gov.uk/sites/default/files/analysing_air_pollution_exposure_in_london_-
_technical_report_-_2013.pdf (accessed January 2018)
39 Aether, 2013, Analysing Air Pollution Exposure in London, Report to the Greater London Authority,
https://www.london.gov.uk/sites/default/files/analysing_air_pollution_exposure_in_london_-
_technical_report_-_2013.pdf (accessed January 2018)
14The 2010 Marmot Review of health inequalities highlighted that people in deprived areas
also experience more adverse health effects at the same level of exposure compared to
those from less deprived areas. 40 This may be because they are more likely to have health
problems already. People with a lower socioeconomic status are at higher risk for many
conditions which have also been linked to air pollution, including lung and heart diseases. 41
When considered separately, deprivation has a stronger relationship with poor health than
exposure to air pollution does, and combining the two worsens the impact.42
Figure 4 is an illustration of the possible cumulative impact of air pollution and deprivation
throughout someone’s life.43 Higher exposure can worsen health, in turn affecting life
chances and making it more likely that exposure to pollution will continue, worsening health
still further.
Road transport users
Since transport contributes a relatively high proportion of pollution in urban areas, some
researchers have investigated whether there are differences in how much people are
exposed to air pollution depending on how they travel. These studies have shown that
people who travel in cars, buses and taxis are exposed to a higher concentration of
pollutants than cyclists or pedestrians, though longer journey times do increase their overall
exposure.44 This is because air pollution is typically more concentrated in vehicle cabins
within traffic lanes than in the outside air nearby.
Cyclists and pedestrians will be less exposed to pollution if they choose a quieter route.
Analysis of key central London walking routes by King’s College London in 2017 found that
taking a side street reduced pollution exposure by 53%.45
40 Marmot M et al, Fair Society, Healthy Lives, 2010
41 Prescott and E and Vestbo J, Socioeconomic status and COPD, Thorax, 1999
42 Brunt H et al, Air pollution, deprivation and health: understanding relationships to add value to local
air quality management policy and practice in Wales, UK. J Public Health (Oxf). 2017 Sep
1;39(3):485-497.
43 From UNICEF, Clear the air for children, 2016,
https://www.unicef.org/publications/files/UNICEF_Clear_the_Air_for_Children_30_Oct_2016.pdf
(accessed January 2018)
44 Cepeda M et al, Levels of ambient air pollution according to mode of transport: a systematic review
The Lancet Public Health, Volume 2, Issue 1, January 2017, Pages e23-e34
45 The Guardian, Side street routes to avoid city pollution cut exposure by half, June 2017
https://www.theguardian.com/environment/2017/jun/14/side-street-routes-avoid-city-pollution-cut-exposure-by-
half (accessed January 2018)
15Figure 4: lifelong effects of air pollution (Source: UNICEF, Clear the Air for Children)
Which health conditions are linked to pollution?

                                                          Figure 5: where air pollutants go in our bodies and
                                                          what they do46
Poor air quality can contribute to early deaths
from many causes, with the most common being
stroke, followed by heart disease, chronic
obstructive pulmonary disease (COPD), lung
cancer and acute respiratory infections.47

Short term exposure to pollution aggravates
existing health conditions including heart,
circulatory and lung conditions. In particular, a
systematic review of evidence found that there is
a direct causal relationship between air pollution
and asthma attacks48 and the Committee on the
Medical Effects of Air Pollution has concluded
that there is likely to be a causal link between
high daily pollution levels and cardiovascular
deaths and hospital admissions.49

Long-term exposure to air pollution also affects
lung and cardiovascular health. Many experts
agree that air pollution contributes to the onset of
asthma in childhood and to cardiovascular
disease later in life.50 In addition, in 2012, the
International Agency for Research on Cancer
listed diesel exhaust pollution as a Class 1
carcinogen and extended this to all ambient air
pollution in 201351.

Emerging evidence also links long-term pollution
exposure to diabetes, obesity and changes linked
to dementia, as well as impacts on mental and
physical development in children and cognition in
older people.52 In addition, exposure to air
pollution may increase vulnerability to
infections.53

46 From DEFRA, PHE and LGA, Air Quality: a briefing for Directors of Public Health, 2017, http://www.adph.org.uk/wp-
content/uploads/2017/03/6.3091_DEFRA_AirQualityGuide_9web.pdf (accessed January 2018)
47 WHO, Burden of disease from ambient air pollution 2012,

http://www.who.int/phe/health_topics/outdoorair/databases/FINAL_HAP_AAP_BoD_24March2014.pdf?ua=1
(accessed January 2018)
48 Orellano et al, Effect of outdoor air pollution on asthma exacerbations in children and adults: Systematic review and

multilevel meta-analysis, PLoS One. 2017 Mar 20;12(3)
49 COMEAP, Cardiovascular disease and air pollution, 2006
50 Aphekom, Summary Report of the Aphekom

http://web.archive.org/web/20130807083807/http://www.aphekom.org:80/c/document_library/get_file?uuid=5532fafa-
921f-4ab1-9ed9-c0148f7da36a&groupId=10347 (accessed February 2018)
51 https://www.iarc.fr/en/media-centre/iarcnews/pdf/pr221_E.pdf
52 GLA, Air Quality in Kingston upon Thames: A guide for Public Health Professionals (accessed January 2018)
53 Kulkarni & Grigg, Effect of Air Pollution on Children, 2008

https://www.sciencedirect.com/science/article/pii/S1751722208000280
                                                                                                                     17
A summary of both the sources and the specific health effects of particular pollutants can be found in
Appendix A.
5. Air quality and public health in Kingston
Overall air quality in Kingston
Air quality across London, including in Kingston, has improved substantially since the 1990s, primarily as a
result of policies designed to reduce emissions from road transport. However, it remains an important
public health issue, and the latest pollution concentration data show that national and European annual
pollution limits are still being exceeded in some areas of the borough.54
NO2 and particulates are the main pollutants of concern in Kingston. Despite a longer-term trend for
reductions in levels of NO2, the latest annual Air Quality Status Report for Kingston upon Thames highlights
that the overall levels of NO2 have increased in the borough.55 However, reductions in particle emissions
over recent years have resulted in lower annual average concentrations of PM10 in Kingston, and the
borough is now compliant with EU PM10 limit values.56
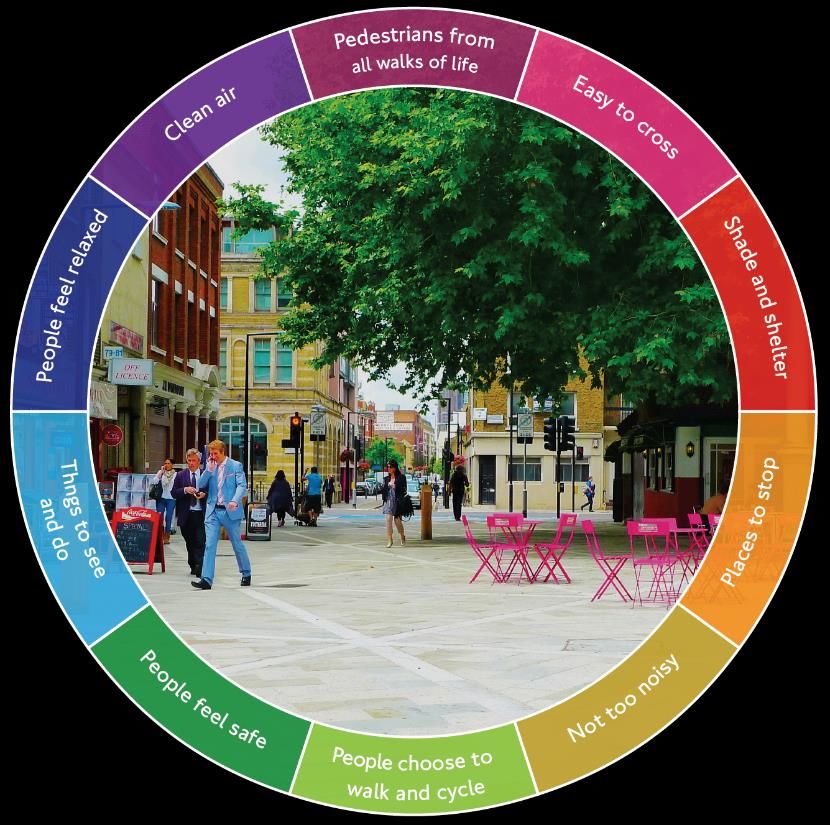
Figure 6 maps NO2 concentrations in Kingston in 2013, the year used as the baseline for London-wide
modelling. Although this data is relatively old, using it enables more detailed comparison with other areas
and future projections. Estimates from the Greater London Authority’s London Atmospheric Emissions
Inventory (LAEI) suggest that there are still likely to be areas of Kingston which do not meet EU limit values
for NO by 2020 unless further action is taken.
2
Full details of past, recent and projected levels of NOx, NO2, PM10 and PM2.5 are included in Appendix B.
According to these figures, the single greatest contributor to emissions in Kingston is road transport, which
is responsible for 61% of PM10, 72% of PM2.5 and 58% of NOx in the area.57
Although traffic flows in Kingston have decreased over the past two decades, there has been an increase in
the number of vehicle registrations, particularly for diesel vehicles. The total number of vehicle registrations
in Kingston increased by 4.5% between 2009 and 2016. This was a slightly higher increase than for London
as a whole (4.2%), but a smaller increase than for England (10.0%). However, the number of diesel cars
and vans registered in the area has gone up much more quickly, rising by 57.3%, and increasing from just
over a fifth (21.5%) of all vehicles to just under a third (32.4%) over the same period.58
Since diesel vehicles contribute more to NOx and particulate air pollution than other vehicle types, this
sharp increase may be part of the explanation for increases in NOx reported during the last three years.
Neighbouring boroughs also saw sharp increases in registration of diesel cars, which may be contributing
to Kingston’s air pollution as they visit or drive through the borough.
No recent local figures for Kingston are available to tell us overall what proportion of people use each mode
of transport for their typical journeys, but this is measured for Outer London as a whole. According to the
54London Atmospheric Emissions Inventory, 2017, London datastore, https://data.london.gov.uk/dataset/london-atmospheric-
emissions-inventory-2013 and https://data.london.gov.uk/dataset/llaqm-bespoke-borough-by-borough-air-quality-modelling-and-
data (accessed January 2018)
55 Royal Borough of Kingston Annual Air Quality Status Report for 2015, 2016
https://www.kingston.gov.uk/downloads/file/1761/rbk_kingston_annual_status_report_2016 (accessed January 2018)
56London Atmospheric Emissions Inventory, 2017, London datastore, https://data.london.gov.uk/dataset/london-atmospheric-
emissions-inventory-2013 and https://data.london.gov.uk/dataset/llaqm-bespoke-borough-by-borough-air-quality-modelling-and-
data (accessed January 2018)
57 See tables in Appendix B.
58 See tables in Appendix C.
18London Travel Demand Survey 2015-16, 24.9% of journeys in Outer London are walked, a decline of 3.8
percentage points since the survey began in 2005-6. The proportion of journeys that are cycled has risen
from 1.1% to 1.7% over the same period. The combined figure for journeys as either a car driver or
passenger was 47.2% in 2015-16.59 More local figures would give us a more accurate understanding of the
impact of people’s transport choices, but these figures do suggest that there is scope for more cycling and
walking in Outer London as a whole.
There is more information about trends in vehicle registration and traffic flows in Kingston and surrounding
areas in Appendix C.
Figure 6: annual mean NO2 concentrations for 2013 in Kingston and London (Source: LAEI 2017)
Alongside measurement of NO2 and particulate matter the Council has also assessed and screened benzene,
13 butadiene, carbon monoxide (CO), lead and sulphur dioxide (SO2) and has found that the concentration
of these pollutants are not likely to exceed the air quality objectives.
How does Kingston compare to the rest of London?
Figure 7 compares total NOx emissions and their sources in all London boroughs in 2013. It indicates that
emission levels in Kingston are similar to those in the neighbouring outer London boroughs of Sutton and
Merton, and lower than in many inner London boroughs, including neighbouring Wandsworth.
Although flight paths into Heathrow Airport pass over the borough, this graph shows that the contribution of
aviation to local air pollution in Kingston is relatively low. Heathrow generates a significant amount of air
pollution, but this is concentrated in areas closer to the airport itself. 60 Nevertheless, airport expansion has
the potential to affect Kingston’s air quality by changing road traffic patterns.
59 London Travel Demand Survey 2015-16, available at https://tfl.gov.uk/corporate/publications-and-reports/london-
travel-demand-survey (accessed January 2018)
60 Information on the environmental impact and air quality impact of airports and aeroplanes can be found at
http://publicapps.caa.co.uk/docs/33/CAP1524EnvironmentalInformation29032017.pdf
19Figure 7: NOx emissions by London borough
Note: D&C denotes Domestic and Commercial, NRMM denotes Non Road Mobile Machinery
Borough names that do not appear fully on the above chart are Barking and Dagenham, City of Westminster,
Hammersmith and Fulham, Kensington and Chelsea, Tower Hamlets and Waltham Forest
Source: LAEI Workshop 14th April 2016, TfL
Local air quality hotspots
There is substantial variation in pollution concentrations around the borough. Areas with high levels of
traffic congestion consistently have higher concentrations of pollutants, particularly areas close to Kingston
town centre and along parts of the A3.
Overall air quality hotspots
Air quality is a key indicator considered within the Living Environment domain of the Indices of Multiple
Deprivation (IMD) 2015. Using data from the National Atmospheric Emissions Inventory (NAEI), analysts
have produced an air quality score for each small area (known as a Lower Super Output Area or LSOA)
based on concentrations of four pollutants: nitrogen dioxide, particulate matter, benzene and sulphur
dioxide.
There are 98 LSOAs in Kingston, and like many parts of London, most rank relatively poorly for air quality
compared to the rest of England. Only four areas in Kingston are within the least disadvantaged half of the
country. Table 1 shows the five LSOAs with the highest and lowest ranking for air quality in Kingston.
20Table 1: Kingston’s most and least disadvantaged areas in terms of air quality (see map in figure 9)
Worst air quality in Kingston Best air quality in Kingston
Canbury Park Road/Clifton Road Area Garrison Lane Area
Cambridge Road Estate Chessington World of
Adventures/Malden Rushett Area
Birkenhead Avenue to Hawks Road Gilders Road/Rollesby Road Area
Area
Kingston Town Centre Area Compton Road/Padbury Rise Area
Princes Avenue/Largewood Avenue Leatherhead Road/Cheshire
Area Gardens area
Source: English Indices of Multiple Deprivation, 2015
Nitrogen dioxide hotspots
The Council also monitors NO2 pollution specifically. In 2016, this was measured at two continuous
monitoring stations (automatic) and at 40 diffusion tube (non-automatic) locations. A review of the
monitoring network and locations has taken place and in 2018, the number of automatic monitoring stations
is being increased to three. The results are compared against two objectives based on limit values set by
the EU. The hourly objective is intended to protect people from being exposed to very high concentrations
during episodes of severe pollution. The annual objective is the average concentration over a whole year,
and is meant to protect people from ongoing exposure to NO2.
The most recent results highlight that in 2016:
the two continuous monitoring sites exceeded the annual mean NO2 objective of 40μg/m3
the annual mean objective for NO2 was also exceeded at 23 out of 40 of the diffusion tube locations
the non-automatic monitors near Tolworth Roundabout and Kingston Road (near station) sites
exceeded 60μg/m3, which indicates that the hourly objective could be exceeded in these places
the highest concentration was 90.6μg/m3 and was recorded at a site on the A307 Cromwell Road,
one of the busiest roads in the borough
all 4 results from diffusion tubes located along the A3 Malden Way exceeded the objective at the
roadside.
Figure 8 shows changes in (non-automatic) monitoring of emissions of NO2 between 2015 and 2016 and
indicates which monitoring stations exceeded the annual mean objective. The monitoring sites with the
highest recorded levels of NO2 were at the 14-16 Cromwell Road and Tolworth Roundabout sites, both of
which have extensive traffic congestion at busy times.
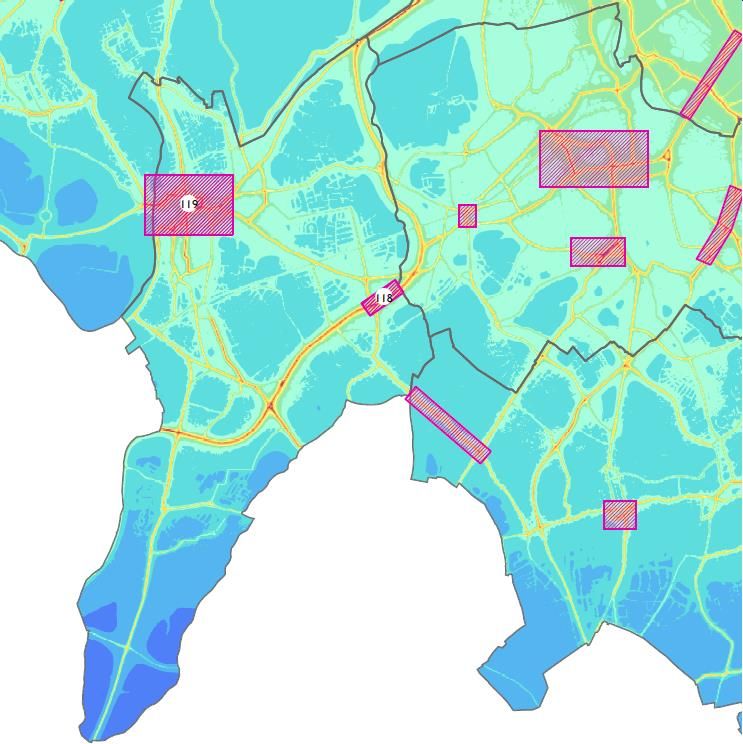
Figure 9 is a map showing the locations of the air quality monitors and their results in 2016, overlaid with the
air quality index from the outdoor environment domain of the Index of Multiple Deprivation. Most of the areas
highlighted with both high levels of NO2 and a high ranking for environmental disadvantage are either close
to Kingston town centre or to the A3.
21Figure 8: Mean NO2 measurements at 40 locations in the borough, 2015-2016 (threshold set at EU limit value of 40 µg/m3)
Annual mean NO2 concentration (µg/m3)
Source: Royal Borough of Kingston upon Thames, 2016
22Figure 9: LSOA Air Quality Index rank for Kingston, showing NO2 monitor locations in 2016 and the
five LSOAs with the poorest air quality in 2015
23Air quality and educational institutions
Because children and young people are particularly vulnerable to the effects of poor air quality, there is
concern about exposure to pollution in schools and childcare facilities.
In Kingston, there are 36 primary and 11 secondary schools providing free education to children aged four
to 18 years, with two new schools proposed for the future. Transport for London has analysed pollution
concentrations within 150m of these schools and some independent schools and colleges, examining 66
institutions using 2013 air pollution maps. The average NO2 concentration within a 150m buffer around
each school was used to assess air pollution exposure.
Figure 10 maps school locations. Three educational establishments in Kingston were exposed to more than
the annual mean NO2 EU limit value of 40 µg/m3: Kingston College, Kingston Grammar School and Tiffin
School (Boys), all of which are located in Kingston town centre, where road traffic is a major contributor to
air pollution.
Although only three educational establishments were in areas which exceeded annual EU mean limit
values for NO2 in 2013, many others had concentrations close to that level. NO2 levels rose at some local
air quality monitoring tubes between 2015 and 2016, and action to improve air quality around a number of
Kingston schools would be of benefit to population health. Table 2 identifies the average (mean) level of
NO2 for all 66 educational institutions in Kingston in 2013.
24Figure 10: Air quality exposure per educational establishment in Kingston, 2013
25Table 2: NO2 mean concentrations per educational establishment in 2013
Establishment name Type of Establishment Phase of NO2ug/m3 mean
education 2013
Kingston Grammar School Other Independent Not applicable 47.4
School
Kingston College Further Education 16 Plus 43.1
Tiffin School Academy Converter Secondary 42.8
Southborough High School Academy Converter Secondary 39.2
Bedelsford School Foundation Special Not applicable 38.9
School
Tolworth Girls' School & Sixth Form Academy Converter Secondary 38.1
St Joseph's Catholic Primary School Voluntary Aided School Primary 37.5
Educare Small School Other Independent Not applicable 37.5
School
St John's C of E Primary School Voluntary Aided School Primary 37.3
Coombe Boys' School Academy Converter Secondary 35.9
Burlington Junior School Community School Primary 35.8
Burlington Infant and Nursery School Community School Primary 35.8
Park Hill School Other Independent Not applicable 35.7
School
Kingston University Higher Education Not applicable 35.5
Institutions
Surbiton High School Other Independent Not applicable 35.4
School
Surbiton Children's Centre Nursery LA Nursery School Nursery 34.9
Fern Hill Primary School Community School Primary 34.5
Dysart School Community Special Not applicable 34.3
School
Canbury School Other Independent Not applicable 34.0
School
St Paul's CofE Junior School Voluntary Aided School Primary 33.7
The Kingston Academy Free Schools Secondary 33.6
King Athelstan Primary School Community School Primary 33.3
St Paul's CofE Primary School Voluntary Aided School Primary 33.2
The Tiffin Girls' School Academy Converter Secondary 33.1
The Hollyfield School and Sixth Form Academy Converter Secondary 32.9
Centre
Alexandra Infant School Community School Primary 32.5
King's Oak Primary School Community School Primary 32.4
Coombe Hill Infant School Community School Primary 32.4
Coombe Hill Junior School Community School Primary 32.4
St Matthew's CofE Primary School Voluntary Aided School Primary 32.4
Malden Parochial CofE Primary School Voluntary Aided School Primary 32.2
Our Lady Immaculate Catholic Primary Voluntary Aided School Primary 32.2
School
Study School Other Independent Not applicable 31.9
School
Malden Oaks PRU Pupil Referral Unit Not applicable 31.8
Lime Tree Primary School Foundation School Primary 31.7
The Holy Cross School Academy Converter Secondary 31.5
St Luke's CofE Primary School Foundation School Primary 31.4
Coombe Girls' School Academy Converter Secondary 31.4
Robin Hood Primary School Community School Primary 31.3
Chessington Community College Community School Secondary 31.3
Kingston Community School Free Schools Primary 31.0
Christ Church New Malden CofE Primary Voluntary Aided School Primary 31.0
School
26Westbury House School Other Independent Not applicable 30.9
School
Hillcroft College Miscellaneous Not applicable 30.8
Corpus Christi Catholic Primary School Voluntary Aided School Primary 30.6
Marymount International School Other Independent Not applicable 30.5
School
Tolworth Junior School Community School Primary 30.5
Tolworth Infant and Nursery School Community School Primary 30.5
Ellingham Primary School Community School Primary 30.5
Rokeby Senior School Other Independent Not applicable 30.4
School
Maple Infants' School Community School Primary 30.4
St Agatha's Catholic Primary School Academy Converter Primary 30.4
Lovelace Primary School Community School Primary 30.4
Holy Cross Preparatory School Other Independent Not applicable 30.3
School
Latchmere School Academy Converter Primary 30.3
St Andrew's and St Mark's CofE Junior Voluntary Aided School Primary 30.3
School
Malden Manor Primary and Nursery Community School Primary 30.0
School
Knollmead Primary School Academy Sponsor Led Primary 29.9
Grand Avenue Primary and Nursery Community School Primary 29.8
School
Christ Church CofE Primary School Voluntary Aided School Primary 29.7
Richard Challoner School Academy Converter Secondary 29.4
Green Lane Primary and Nursery School Community School Primary 29.0
Castle Hill Primary School Academy Converter Primary 29.0
Shrewsbury House School Other Independent Not applicable 28.8
School
St Philip's School Community Special Not applicable 28.3
School
St Mary's CofE (Aided) Primary School Voluntary Aided School Primary 28.3
Source: LAEI 2013
Public health effects of air pollution in Kingston
Attributable deaths
Public Health England has estimated that in 2010, Kingston had the equivalent of 68 deaths (or the loss of
730 years of life) as a result of exposure to man-made particulates.61 This is a higher proportion of deaths
than for England as a whole, but lower than the London average. In line with improvements to
concentrations of particulates, the proportion of deaths attributable to particulates has declined, but is still
the equivalent of around one in every twenty deaths (figure 11). No local estimate of deaths attributable to
NOx is available.
Estimating the number of people who have died, been admitted to hospital, or developed a health problem
as a result of air pollution is complex. It is important to note that the number of deaths presented here is
based on a statistical model and not on health records showing the causes of death for identifiable
individual people.
A more detailed discussion of the methods behind this and an alternative estimate which includes an
estimate of the equivalent number of deaths at ward level can be found in Appendix D.
61 https://www.gov.uk/government/uploads/system/uploads/attachment_data/file/332854/PHE_CRCE_010.pdf
27Figure 11: trends in proportion of deaths attributable to air pollution
Trends in proportion of deaths attributable to
air pollution
8
Percentage of attributable deaths (%)
7
6
5
4
3
2
1
Year
0
2011 2012 2013 2014 2015
Kingston 6.7 6.1 6.2 5.9 5.1
London 7.2 6.6 6.7 6.5 5.6
England 5.4 5.1 5.3 5.1 4.7
Source: Public Health Outcomes Framework
Vulnerable people
Kingston’s population includes 37,555 children aged under 18, and 22,984 people aged over 65.62 The
population registered with Kingston GPs is higher than the estimated resident population. According to
Kingston’s GP practice records, the local population also includes:
9,491 people with asthma (4.7% of people registered with Kingston GP practices) 63
2,294 people with COPD (1.1% of people registered with Kingston GP practices)64
4,176 people with chronic heart disease (2.1% of people registered with Kingston GP practices)65
62 Royal Borough of Kingston, Annual Public Health Report, 2016-17
63Public Health England, INHALE, QOF prevalence of asthma (all ages), 2015-16
https://fingertips.phe.org.uk/profile/inhale/data#page/1/gid/8000003/pat/46/par/E39000018/ati/153/are/E38000090/iid/2
53/age/1/sex/4
64Public Health England, INHALE, QOF prevalence of COPD (all ages), 2015-16
https://fingertips.phe.org.uk/profile/inhale/data#page/1/gid/8000003/pat/46/par/E39000018/ati/153/are/E38000090/iid/2
53/age/1/sex/4
65 Public Health England, Cardiovascular Disease Profile, QOF prevalence of CHD, 2016-17,
https://fingertips.phe.org.uk/profile/cardiovascular/data#page/0
28These people may be particularly vulnerable to the effects of exposure to air pollution and should be aware
of public health advice about how to respond to particularly severe episodes of air pollution.
296. Community Voice
In 2015, Kingston Council held a consultation on its current Kingston Air Quality action plan. This enabled
residents to put across their views on the Council’s plans. Cycle storage provision scored particularly highly
compared to other actions.
Residents also proposed the following:
more green along the A3
expansion of non-car transportation methods
action on engine idling
change to the way cars and cyclists were treated
buses in the future should be low-emission
more trees should be present to trap particulate matters
planning systems should be used to improve the way transport moves and is provided for
go beyond “the minimum” for cycle provision in new developments
reduced speed limits on residential roads and the A3
Concerns were also expressed that allocating more space to buses would increase car congestion.
Discussion with the Kingston Environment Forum, a group of interested residents and businesses in
Kingston, raised similar concerns. Members of this group would like to see an expansion of work to improve
air quality in Kingston, and raised the following issues:
a wish to see London reach over 50% green space (in the context of a proposal for a London
National Park)
a need for a new approach to improve the environment for walking and cycling
stopping engine idling, particularly near to schools
the extension of 20 mph limits
30You can also read