Air Quality in Ireland 2015 - Key Indicators of Ambient Air Quality - Environmental Protection Agency ...
←
→
Page content transcription
If your browser does not render page correctly, please read the page content below
Air Quality in Ireland 2015
Key Indicators of Ambient Air Quality
ENVIRONMENTAL PROTECTION AGENCY                                     Monitoring, Analysing and Reporting on the
The Environmental Protection Agency (EPA) is responsible for        Environment
protecting and improving the environment as a valuable asset        • Monitoring air quality and implementing the EU Clean Air for
for the people of Ireland. We are committed to protecting people      Europe (CAFÉ) Directive.
and the environment from the harmful effects of radiation and
                                                                    • Independent reporting to inform decision making by national
pollution.
                                                                      and local government (e.g. periodic reporting on the State of
                                                                      Ireland’s Environment and Indicator Reports).
The work of the EPA can be
divided into three main areas:                                      Regulating Ireland’s Greenhouse Gas Emissions
                                                                    • Preparing Ireland’s greenhouse gas inventories and projections.
Regulation: We implement effective regulation and environmental     • Implementing the Emissions Trading Directive, for over 100 of
compliance systems to deliver good environmental outcomes and         the largest producers of carbon dioxide in Ireland.
target those who don’t comply.

Knowledge: We provide high quality, targeted and timely             Environmental Research and Development
environmental data, information and assessment to inform            • Funding environmental research to identify pressures, inform
decision making at all levels.                                        policy and provide solutions in the areas of climate, water and
                                                                      sustainability.
Advocacy: We work with others to advocate for a clean,
productive and well protected environment and for sustainable       Strategic Environmental Assessment
environmental behaviour.                                            • Assessing the impact of proposed plans and programmes on the
                                                                      Irish environment (e.g. major development plans).
Our Responsibilities
                                                                    Radiological Protection
Licensing                                                           • Monitoring radiation levels, assessing exposure of people in
We regulate the following activities so that they do not endanger     Ireland to ionising radiation.
human health or harm the environment:                               • Assisting in developing national plans for emergencies arising
• waste facilities (e.g. landfills, incinerators, waste transfer      from nuclear accidents.
  stations);                                                        • Monitoring developments abroad relating to nuclear
• large scale industrial activities (e.g. pharmaceutical, cement      installations and radiological safety.
  manufacturing, power plants);                                     • Providing, or overseeing the provision of, specialist radiation
• intensive agriculture (e.g. pigs, poultry);                         protection services.
• the contained use and controlled release of Genetically
  Modified Organisms (GMOs);                                        Guidance, Accessible Information and Education
• sources of ionising radiation (e.g. x-ray and radiotherapy        • Providing advice and guidance to industry and the public on
  equipment, industrial sources);                                     environmental and radiological protection topics.
• large petrol storage facilities;                                  • Providing timely and easily accessible environmental
• waste water discharges;                                             information to encourage public participation in environmental
• dumping at sea activities.                                          decision-making (e.g. My Local Environment, Radon Maps).
                                                                    • Advising Government on matters relating to radiological safety
National Environmental Enforcement                                    and emergency response.
• Conducting an annual programme of audits and inspections of       • Developing a National Hazardous Waste Management Plan to
  EPA licensed facilities.                                            prevent and manage hazardous waste.
• Overseeing local authorities’ environmental protection
  responsibilities.                                                 Awareness Raising and Behavioural Change
• Supervising the supply of drinking water by public water          • Generating greater environmental awareness and influencing
  suppliers.                                                          positive behavioural change by supporting businesses,
• Working with local authorities and other agencies to tackle         communities and householders to become more resource
  environmental crime by co-ordinating a national enforcement         efficient.
  network, targeting offenders and overseeing remediation.          • Promoting radon testing in homes and workplaces and
• Enforcing Regulations such as Waste Electrical and Electronic       encouraging remediation where necessary.
  Equipment (WEEE), Restriction of Hazardous Substances
  (RoHS) and substances that deplete the ozone layer.               Management and structure of the EPA
• Prosecuting those who flout environmental law and damage the      The EPA is managed by a full time Board, consisting of a Director
  environment.                                                      General and five Directors. The work is carried out across five
                                                                    Offices:
                                                                    • Office of Environmental Sustainability
Water Management
• Monitoring and reporting on the quality of rivers, lakes,         • Office of Environmental Enforcement
  transitional and coastal waters of Ireland and groundwaters;      • Office of Evidence and Assessment
  measuring water levels and river flows.                           • Office of Radiological Protection
• National coordination and oversight of the Water Framework        • Office of Communications and Corporate Services
  Directive.                                                        The EPA is assisted by an Advisory Committee of twelve members
• Monitoring and reporting on Bathing Water Quality.                who meet regularly to discuss issues of concern and provide
                                                                    advice to the Board.
Air Quality in Ireland 2015

Key Indicators of Ambient Air Quality

           Dr. Micheál O’Dwyer

  National Ambient Air Quality Programme

      Office of Radiological Protection
Published by
Environmental Protection Agency
An Ghníomhaireacht um Chaomhnú Comhshaoil
PO Box 3000
Johnstown Castle Estate
County Wexford, Ireland

Telephone: +353 53 9160600
Lo Call: 1890 33 55 99
Fax: +353 53 9160699
Email: info@epa.ie
Web site: www.epa.ie

ISBN: 978-1-84095-697-9

© Environmental Protection Agency 2016

Although every effort has been made to ensure the accuracy of the material contained in this publication,
complete accuracy cannot be guaranteed. Neither the Environmental Protection Agency nor the author(s) accept
any responsibility whatsoever for loss or damage occasioned or claimed to have been occasioned, in part or in
full, as a consequence of any person acting or refraining from acting, as a result of a matter contained in this
publication. Parts of this publication may be reproduced without further permission, provided the source is
acknowledged.
Air Quality In Ireland                                                                                                                                 2015

        Contents

        Contents .................................................................................................................................................. 3
        Index of figures ....................................................................................................................................... 5
        Index of tables......................................................................................................................................... 6
        Acknowledgments................................................................................................................................... 7
        Glossary ................................................................................................................................................... 8
        Executive Summary ............................................................................................................................... 10
        1.      Introduction .................................................................................................................................. 13
             National Ambient Air Quality Monitoring Programme ..................................................................... 13
             Air pollution and human health ........................................................................................................ 13
             Air pollution, ecosystems and climate .............................................................................................. 13
             WHO air quality guidelines ............................................................................................................... 14
             Irish and EU air quality legislation..................................................................................................... 14
             Report objectives and coverage ....................................................................................................... 14
             Air quality zones 2015 ....................................................................................................................... 15
             Air quality monitoring network 2015................................................................................................ 16
             European air quality .......................................................................................................................... 16
        2.      Nitrogen oxides (NOX) ................................................................................................................... 17
        3.      Sulphur dioxide (SO2) .................................................................................................................... 18
        4.      Carbon monoxide (CO).................................................................................................................. 19
        5.      Ozone (O3) ..................................................................................................................................... 20
        6.      Particulate matter (PM10).............................................................................................................. 22
        7.      Particulate matter (PM2.5) ............................................................................................................. 24
        8.      Benzene and volatile organic compounds (VOCs) ........................................................................ 26
        9.      Heavy metals ................................................................................................................................. 27
        10.         Polycyclic aromatic hydrocarbons (PAH) .................................................................................. 29
        11.         Dioxins, PCBs and Brominated Flame Retardants survey ......................................................... 31
             11.1      Origins of Dioxins in Air ......................................................................................................... 31
                11.1.1         PCBs............................................................................................................................... 32

                                                                                                                                                                    3
Air Quality In Ireland                                                                                                                               2015

               11.1.2         Toxicity of Dioxins and PCBs ......................................................................................... 32
               11.1.3         Persistent Organic Pollutants (POPs) & the Stockholm Convention............................. 33
           11.2        Survey Results ....................................................................................................................... 33
               11.2.1         Summary ....................................................................................................................... 34
               11.2.2         Dioxins ........................................................................................................................... 34
               11.2.3         PCBs............................................................................................................................... 34
               11.2.4         Dioxins & PCBs .............................................................................................................. 34
               11.2.5         Comparison with earlier surveys and with other international studies. ...................... 34
               11.2.6         Brominated Dioxins and Furans (PBDD/PBDF) ............................................................. 36
           11.3        Brominated Flame Retardants (BFR) Study. ......................................................................... 36
               11.3.1         General .......................................................................................................................... 36
           11.4        Non Dioxin PCB results .......................................................................................................... 38
           11.5        Conclusions and Outlook ...................................................................................................... 38
        12.        EMEP and Air quality research .................................................................................................. 39
           12.1        European Monitoring and Evaluation Programme (EMEP) .................................................. 39
           12.2        Air quality research ............................................................................................................... 40
               12.2.1 Title: National mapping of GHG and non‐GHG emissions sources, Ole‐Kenneth
               Nielsen, Aarhus University ............................................................................................................ 42
               12.2.2 Title: Particulate Matter from Diesel Vehicles: Emission and Exposure in Ireland, A.
               McNabola, University of Dublin, Trinity College (TCD) ................................................................. 42
               12.2.3         Title: AEROSOURCE, C. O’Dowd, National University of Ireland Galway (NUIG) .......... 42
        13.        Key Statistics from Air Enforcement ......................................................................................... 43
        14.        Conclusion and future challenges ............................................................................................. 44
        Appendix A – Summary data tables ...................................................................................................... 46
        References ............................................................................................................................................ 69

                                                                                                                                                                  4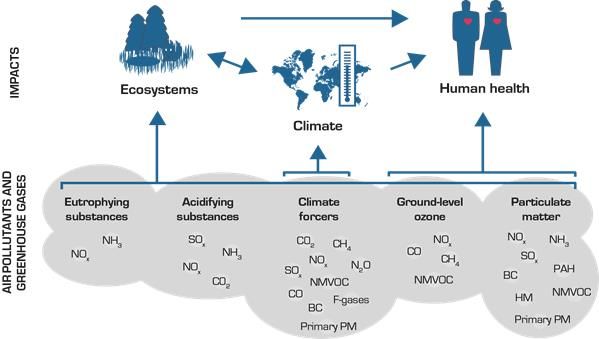
Air Quality In Ireland                                                                                                                         2015

        Index of figures

        Figure 1.1 Impacts of air pollution (source: EEA 2014) ......................................................................... 13
        Figure 1.2 EU vs WHO exposure levels to air pollution (source: EEA 2014) ......................................... 15
        Figure 1.3 Air quality zones in Ireland in 2015...................................................................................... 15
        Figure 1.4 Air Quality Monitoring Stations in 2015 .............................................................................. 16
        Figure 1.5 Concentrations of NO2 across EU Member States in 2013 .................................................. 16
        Figure 2.1 Trend in NO2 concentrations for zones in Ireland 2005 ‐ 2015 ........................................... 17
        Figure 3.1 Annual mean SO2 concentrations 2005 ‐ 2015 ................................................................... 18
        Figure 4.1 8‐hour maximum CO concentrations in Cork and Dublin, 2004 ‐ 2015 ............................... 19
        Figure 5.1 Annual Mean Ozone concentrations across Europe 2013 ................................................... 20
        Figure 5.2 8‐hour daily maximum concentrations at individual stations compared to the WHO
        guideline value for ozone...................................................................................................................... 21
        Figure 5.3 AOT40 at rural background stations, 2004 ‐ 2015 ............................................................... 21
        Figure 6.1 Annual mean PM10 concentrations 2005‐2015.................................................................... 22
        Figure 6.2 PM10 concentrations across Europe in 2013 ........................................................................ 23
        Figure 7.1 Annual mean PM2.5 concentrations 2009‐2015 ................................................................... 25
        Figure 8.1 Annual mean concentrations for VOC ozone precursors including Benzene at Rathmines,
        Dublin 2005‐2015.................................................................................................................................. 26
        Figure 9.1 Lead, Arsenic, Cadmium, Nickel concentrations in Ireland 2009 ‐ 2015 ............................. 28
        Figure 10.1 Annual mean PAH (BaP) concentration 2009‐2015 ........................................................... 30
        Figure 10.2 Annual mean values for PAH (BaP) at individual stations in Ireland in 2015 with reference
        to EEA air quality estimated reference level for BaP ............................................................................ 30
        Figure 11.1 Dioxins/Furans 2015 ‐ Data Compared with 2000‐2015 Averages .................................... 35
        Figure 11.2 Dioxins/Furans + PCBs 2015 ‐ Data Compared with 2000‐2015 Averages ........................ 36

                                                                                                                                                           5
Air Quality In Ireland                                                                                                                                   2015

        Index of tables

        Table 11.1 Summary of dioxin survey results 2015 .............................................................................. 35
        Table 11.2 Summary of milk fat data for PBDEs ................................................................................... 37
        Table 12.1 summary of ongoing EPA funded air quality related projects ............................................ 41

        Table A1 Summary of the Air Quality Directive's limit values, target values, long‐term objectives,
        information and alert threshold values for the protection of human health....................................... 46
        Table A2 WHO air quality guidelines (AQG), interim targets (IT) and EEA estimated reference levels
        (ERL) for PM, O3, NO2, BaP, SO2, CO, and toxic metals, in μg/m3, excepting BaP, CO, Cd and Pb. ..... 47
        Table A3 Summary of Air Quality Directive critical levels, target values and long‐term objectives for
        the protection of vegetation................................................................................................................. 48
        Table A4 Summary statistics for hourly NO2 concentrations in Ireland in 2015 .................................. 49
        Table A5 Summary statistics for hourly NOX concentrations in Ireland in 2015 .................................. 50
        Table A6 Summary statistics for hourly SO2 concentrations in Ireland in 2015 ................................... 51
        Table A7 Summary statistics for rolling 8‐hour CO concentrations in Ireland in 2015......................... 52
        Table A8 Summary statistics for rolling 8‐hour ozone concentrations in Ireland in 2015 ................... 53
        Table A9 AOT40 values from rural stations (Zone D) in Ireland, 2010 – 2015...................................... 54
        Table A10 Summary statistics for daily PM10 concentrations in Ireland in 2015 .................................. 55
        Table A11 Summary statistics for daily PM2.5 concentrations for Ireland in 2015 ............................... 56
        Table A12 Summary statistics for chemical composition of PM2.5 in 2015 .......................................... 57
        Table A13 Summary statistics for daily benzene concentrations in Ireland in 2015 ............................ 58
        Table A14 Summary statistics for daily ozone precursor VOCs concentrations at Rathmines in 2015 59
        Table A15 Summary statistics for daily ozone precursor VOCs concentrations at Kilkenny in 2015 ... 60
        Table A16 Summary statistics for monthly lead, arsenic, cadmium and nickel concentrations in
        Ireland in 2015 ...................................................................................................................................... 61
        Table A17 Summary statistics for monthly mercury concentrations in 2015 ...................................... 62
        Table A18 Summary statistics for monthly metal deposition concentrations in 2015......................... 63
        Table A19 Summary statistics for monthly PAH concentrations in 2015 ............................................. 64
        Table A20 Summary statistics for monthly PAH deposition concentrations in 2015 ........................... 65
        Table A 21 Summary statistics for daily ozone precursor VOCs concentrations at Portlaoise in 2015 66
        Table A22 Milk fat related PCDD/F and PCB‐TEQ values determined in the background samples A1 ‐ A
        25 .......................................................................................................................................................... 67
        Table A23 Milk fat related PCDD/F and PCB‐TEQ values determined in the potential impact samples
        B1 ‐ B 18 ................................................................................................................................................ 68

                                                                                                                                                                      6
Air Quality In Ireland 2015
Acknowledgments
The author wishes to acknowledge the contributions of his colleagues, Kevin Delaney, Patrick
Malone, Lin Delaney, Cathal Ruane, Patrick Kenny and Barbara Rafferty in the National Ambient Air
Quality Programme. Additional support in monitoring and analysis is provided by EPA staff in Dublin,
Castlebar, Monaghan, Mallow and Limerick with support in data collection and reporting from
colleagues in the Environmental Research Centre, Air Cross Office Team, IT and GIS teams. The input
of personnel from local authorities, the Health Service Executive, Met Éireann and NUI Galway and
others who provided data for inclusion in this report is also acknowledged
7Air Quality In Ireland 2015
Glossary
> Greater than
AOT40 This is a measure of the overall exposure of plants to ozone. It is the sum of
the excess hourly concentrations greater than 80 µg/m3 and is expressed as
ug/m3 hours. Only values measured between 08:00 and 20:00 Central
European Time each day from May to July are used for the calculation. (The
name AOT40 refers to 40ppb which is the same as 80 µg/m3)
As Arsenic
AEI Average exposure indicator
Assessment Threshold Concentration at which varying levels of monitoring must be implemented
Cd Cadmium
CAFE Clean Air for Europe Directive (2008/50/EC)
CEC Council of the European Communities
C6H6 Benzene
CLRTAP Convention on Long‐Range Transboundary Air Pollution
CO Carbon monoxide
DECLG Department of Environment, Community and Local Government
EC European Commission
EC/OC Elemental carbon/organic carbon
EMEP European Monitoring and Evaluation Programme
EPA Environmental Protection Agency
EU European Union
Hg Mercury
LAT Lower assessment threshold
Limit value Level to be attained and not exceeded
mg/m3 Milligrammes per cubic metre
na Not applicable
ng/m3 Nanogrammes per cubic metre
NH3 Ammonia
Ni Nickel
8Air Quality In Ireland 2015
NO Nitric oxide
NO2 Nitrogen dioxide
NOx Oxides of nitrogen
O3 Ozone
PAH Polycyclic aromatic hydrocarbon
Pb Lead
PM10 Particulate matter with diameter < 10 µm
PM2.5 Particulate matter with diameter < 2.5 µm
ppb Parts per billion
SO2 Sulphur dioxide
Target value Level to be attained where possible over a given period
Troposphere Region of the atmosphere from ground level to ~10‐15 kilometres
Stratosphere Region of the atmosphere from ~15 kilometres to 50 kilometres
VOCs Volatile organic compounds
yr year
UAT Upper assessment threshold
µm Micron
µg/m3 Microgrammes per cubic metre
µg/m3.h Microgrammes per cubic metre hours
µg/m2/day Microgrammes per square metre per day
Zone A Dublin
Zone B Cork
Zone C Galway, Limerick, Waterford, Clonmel, Kilkenny, Sligo, Drogheda, Wexford,
Athlone, Bray, Carlow, Dundalk, Ennis, Naas, Tralee, Celbridge, Letterkenny,
Mullingar, Navan, Newbridge, Portlaoise, Greystones and Leixlip.
Zone D Remainder of State (excluding Zones A, B and C)
9Air Quality In Ireland 2015
Executive Summary
Air Quality in Ireland 2015
Air monitoring data from 31 stations in the National Ambient Air Quality Monitoring Network was
assessed against legislative limit and target values for the protection of human health and
vegetation. Air monitoring data was also compared to the World Health Organisation (WHO)
guideline values (EEA estimated reference level used for PAH). Report highlights include:
No levels above the EU limit value were recorded at any of the ambient air quality network
monitoring sites in Ireland in 2015
WHO guideline values were exceeded as follows:
Ozone at 7 monitoring sites
Particulate Matter PM10 at 16 monitoring sites (24hr WHO guideline)
Particulate Matter PM2.5 at 8 monitoring sites (24hr WHO guideline)
Particulate Matter PM2.5 at 1 monitoring site (annual WHO guideline)
EEA reference levels were exceeded as follows
PAH at 4 monitoring sites
The dioxin survey 2015 shows levels recorded are similar or lower than those from previous
surveys and from studies undertaken in other EU countries
This report summarises the current state of research in air quality supported by the EPA in
2015
This report also summarises some key statistics from work undertaken in air enforcement in
2015 by the EPA.
Challenges
The links between poor air quality and human health are well understood with the 2014 report by
the European Environment Agency (EEA) estimating that around 1,200 deaths in Ireland in 2012
were directly linked to air pollution, while for Europe the figure was approximately 400,000 deaths.
It is now apparent that the EU limit value levels are inadequate to protect people from the harmful
effects of air pollutants and the WHO has intimated that there is no safe limit for air pollution. Along
10Air Quality In Ireland 2015
with the clear health benefits in improving air quality in Ireland, there is also an economic saving in
doing so, highlighted by the recent OECD report on the economic cost of air pollution (OECD 2016).
In general air quality in Ireland is good and compares favourably with other EU member states,
largely as a result of our relative absence of large cities, weather and access to predominantly clean
air masses from the south west. However this status is a comparison, relative to our European
neighbours many of whom are in exceedance of EU limit values for pollutants such as particulate
matter, ozone and nitrogen dioxide. It is also much too dependent on the vagaries of our weather.
When we compare our air quality levels to those recommended by the World Health Organisation,
the situation is less positive. We face challenges in reducing our levels of particulate matter (both
PM10 and PM2.5) and ozone to below those recommended by the WHO Air Quality Guidelines.
Particulate matter in Ireland is predominantly sourced from solid fuel burning and it is in this area
where much of the reductions can be made. As the improvement in our economy continues we will
also face challenges to comply with EU legislation for pollutants emitted from car exhausts.
Economic activity will likely be mirrored by increases in NOX emissions, particularly in urban areas.
City centre and urban monitoring sites in Ireland are approaching EU limit values for NO2, and it is
probable that we will see limit value exceedances in the near future unless mitigation steps are
taken.
Actions
A key part of the approach to tackling these issues is better engagement with the public on the topic
of air quality. The first step in this process is an increased access to air quality data and information.
This is highlighted in the EPA’s proposed National Ambient Air Quality Monitoring Programme
(AAMP) which is currently out for public consultation. This programme proposes three main pillars
along with under‐pinning supporting actions:
A greatly expanded national monitoring network
Modelling and forecasting capability
Citizen engagement and citizen science initiatives
Coinciding with the introduction of this AAMP, the EPA is now calling for movement towards the
adoption of the more health appropriate WHO Air Quality Guidelines, in particular for particulates
and ozone, as the legal standards across Europe and in Ireland.
Reductions in levels of particulate matter in Ireland can begin with the consumer, who once properly
informed can make decisions that will impact on their local air quality, particularly with regard to
their choice of home heating fuel. Any shift from burning of solid fuel to cleaner, more energy
efficient methods of home heating will result in cleaner air quality for the consumer, their family and
neighbours with a resultant improvement in their health.
With regard to vehicle exhaust emissions, although it is hoped that technological advances will go
some way to addressing this issue, this approach cannot be solely relied upon and complimentary
measures to mitigating the problem will be needed such as the transition of individuals from private
fossil fuel powered motor cars to alternative modes of transport such as walking, cycling and public
transport and policy incentives to promote a transition to more environmentally friendly and
sustainable options such as electric motor powered vehicles.
11Air Quality In Ireland 2015
The scientific community’s understanding of air pollution and its health implications is constantly
evolving and we need to work to communicate these changes and their importance to the public
and policy makers. This understanding will be crucial for individuals to make informed decisions on a
range of choices that have implications on their local air quality.
Although the problems are many, they are not insurmountable and it is heartening to know that the
power to make changes and provide solutions is within our control. Measures such as policy
changes, price incentives, and provision of clean alternatives for transport and home heating,
support for clean air choices, education and the decisions made by individual consumers all have a
role to play in maintaining and improving our air quality.
12Air Quality In Ireland 2015
1. Introduction
Air pollution and human health National Ambient Air Quality
Air pollution is the single largest environmental Monitoring Programme
health risk in Europe (EEA 2015). Cardiovascular In order to protect our health, vegetation and
complications like heart disease and stroke are the ecosystems, EU Directives set down air quality
main causes of premature death attributed to air standards for a wide variety of pollutants. The
pollution (WHO 2014). Air pollution itself is current standards are contained in the Clean Air for
responsible for 80% of cases of premature death in Europe (CAFE) Directive (EP & CEU, 2008) and the
Europe (2014). This negative impact on human Fourth Daughter Directive (EP & CEU, 2004). These
health also has considerable negative impact on Directives also include rules on how Member States
European member state economies, with working should monitor, assess and manage ambient air
days lost, reduced productivity and increased quality.
medical costs (OECD 2016).
The EPA, as the National Reference Laboratory, is
tasked with coordinating and managing this
Air pollution, ecosystems and climate monitoring programme. A nationwide network of 31
Air pollution also has impacts on vegetation, soil monitoring stations measures levels of air pollutants
and water quality. For example NH3, NOX and SO2 in each zone and delivers this information in real‐
contribute to the acidification of soil and water and time to the public at www.airquality.epa.ie.
ground‐level ozone damages agricultural crops,
forests and plants. Many air pollutants are also The EPA has issued for public consultation a National
climate forcers – for example the black carbon Ambient Air Quality Monitoring Programme, which
constituent of particulate matter and tropospheric will includes a proposed revision of the monitoring
ozone to name but two. Figure 1.1 shows an network and crucial actions to increase provision of
overview of the impacts of air pollution. air quality information to the public and improve
citizen engagement in this area.
Figure 1.1 Impacts of air pollution (source: EEA 2014)
13Air Quality In Ireland 2015
Report objectives and coverage Irish and EU air quality legislation
This report provides an overview of the situation The EPA is the designated competent authority for the
for ambient air quality in Ireland in 2015. It is implementation of all Irish and EU ambient air quality
based on monitoring data from 31 stations that legislation. It is assisted in its role by the local authorities and
were in operation during the year. Measured other partners, and it carries out ambient air quality
concentrations are compared with both: EU monitoring, which contributes to what is known as the
legislative standards and WHO air quality ‘National Ambient Air Quality Monitoring Network’. The EPA
guidelines) for a range of air pollutants. The air manages this monitoring network and is responsible for all
quality analysis presented here is based on reporting to stakeholders – which include the public and the
concentration measurements of the following EU. The EPA is also the National Reference Laboratory (NRL)
pollutants: for air quality for Ireland.
sulphur dioxide; The results of air quality monitoring in 2015 presented in this
report are compared to the limit and target values in the
nitrogen dioxide and oxides of nitrogen;
latest EU legislation, the Clean Air for Europe (CAFE) Directive
carbon monoxide; (EP and CEU, 2008) and the Fourth Daughter Directive (EP
ozone; and CEU, 2004). The CAFE Directive is an amalgamation of
the Air Quality Framework Directive and its subsequent First,
particulate matter ‐ PM10 and PM2.5;
Second and Third Daughter Directives. The CAFE Directive
benzene and volatile organic compounds was transposed into Irish legislation by the Air Quality
(VOCs); Standards Regulations 2011 (S.I. No. 180 of 2011).The 4th
Daughter Directive was transposed by the Arsenic, Cadmium,
heavy metals ‐ lead, arsenic, cadmium,
Mercury, Nickel and Polycyclic Aromatic Hydrocarbons in
nickel and mercury; Ambient Air Regulations 2009 (S.I. No. 58 of 2009).
polycyclic aromatic hydrocarbons (PAH);
Further details on air quality legislation can be found at
elemental carbon/organic carbon www.epa.ie/air/quality/standards/ and in previous air quality
(EC/OC) as part of PM2.5 speciation; and reports www.epa.ie/pubs/reports/air/quality/.
anions and cations as part of PM2.5
speciation. WHO air quality guidelines
The pollutants of most concern in terms of health This report makes reference to the World Health
impacts are particulate matter, PAH and, to a Organisation (WHO) air quality guidelines for particulate
lesser extent, ozone and nitrogen dioxide. The matter (PM10), ozone, nitrogen dioxide and sulphur dioxide
sources and impact of these air pollutants, (WHO, 2005); and also the WHO air quality guidelines
current levels in Ireland and trends over time for update, which includes PM2.5 (Air Qual Atmos Health, 2008).
each pollutant are outlined in this report. A These guidelines were developed by the WHO, to inform
chapter on dioxins in the Irish environment is policy makers and provide appropriate air quality targets
also included. Dioxins are not included in the air worldwide, based on the latest health information available.
quality network but are measured separately in Figure 1.2 below details a comparison of EU limits and WHO
milk samples. guideline values for six pollutants in EU urban areas (WHO
guideline for BaP in the figure below is based on the EEA air
quality reference level). When the stricter WHO guideline
values are applied a significantly higher proportion of the
urban population are exposed to harmful levels of air
pollution (EAA, 2014).
14Air Quality In Irreland 2015
2
Figurre 1.2 EU vs WHO
W exposure levels to air pollution
p (sourrce: EEA 2014))
Air qualitty zones 2015
2
EU legislatioon on air quaality requiress that Membber States divvide
ory into zonees for the asssessment annd management
their territo
of air qualitty. The zoness in place in Ireland in 22015 are shoown
in Figure 1.33. Zone A is the Dublin conurbationn, Zone B is the
Cork conurb bation with Zone C com mprising 23 large townss in
Ireland with h a populatiion >15,000. Zone D is the remain ning
area of Irelaand.
The air quaality in each
h zone is asssessed and classified with
w
respect to uupper and lower assesssment threshholds based on
measurements over thee previous fiive years. Uppper and low wer
assessment thresholds are prescriibed in the legislation for
each pollutaant. The num
mber of monitoring locat ions required is
dependent o on populatio
on size and whether
w ambbient air quaality
concentratioons exceed the upper assessment threshold, are
between the upper and d lower asseessment thr esholds, or are
below the lo
ower assessmment threshoold.
Figurre 1.3 Air quallity zones in Irreland in 2015
15Air Quality In Irreland 2015
2
Air
A qualitty monittoring ne
etwork
2015
2
The
T 31 mo onitoring sttations tha at were
employed in 2015 and whose
w data was
w used
in
n compiling this annual report are shown
s in
Figure 1.4. Th
here were no changes to o the air
quality monittoring netwo
ork in 2015.
European
E air qualitty
Since the 19770s the EU has attempte ed to use
environmentaal policy as the
t main insstrument
to
o improve air quality. To o a large exttent this
has been very succeessful, with h great
eductions in the primaryy pollutants across
re a all
member
m sstates andd a no
oticeable
im
mprovementt in air qu uality. Howe ever, air
pollution scieence is also improving and our
understanding of the impact of poor p air
quality on health is growing an nd new Figure 1.4 Aiir Quality Mon
nitoring Statioons in 2015
hallenges aree facing Euro
ch ope over thee coming
decades. In late 201 13, the European
co
ommission p proposed a new
n Clean Air
A Policy
Package for Europe, wh hich aims to o ensure
co
ompliance w with existingg legislation by 2020
and to further improve Eu urope’s air quality by
2030 and th hereafter (EC C 2013). Figgure 1.5
sh
hows annual average concentrattions of
nitrogen dioxxide (NO2) for the Europe ean wide
monitoring
m network (please note that these
graphs are p produced using 2013 airr quality
data). As eevident in the graphics NO2
exceedances are very com mmon acrosss most of
Europe, indiccating that NO2 is a problem
pollutant for European member states.
Figure 1.5 Co
oncentrations of NO2 acrosss EU Member States
S in 2013
16Air Quality In Ireland 2015
2. Nitrogen oxides (NOX)
Where does NOX come from? Why do we monitor NOX?
NOX refers to the two pollutants: nitric oxide (NO) and nitrogen dioxide NO2 concentrations are closely associated with
(NO2). They are produced during combustion at high temperatures with traffic volumes. As a result, sensitive individuals
the main sources in Ireland coming from vehicles and power stations. including asthmatics, elderly people and
The industrial sector is also a significant contributor to NOX levels in children are more susceptible to NO2 exposure
Ireland, particularly the cement production industry. The majority of closer to heavily trafficked roadways. Elevated
NOX emissions are comprised of NO, with typically 5 ‐ 10% being directly NO2 exposure can lead to health impacts
emitted NO2. Diesel engines tend to emit a higher percentage of NO2. including
Details with regard to ambient air quality standards and WHO guideline respiratory related issues
values for NOx and other pollutants are listed in Appendix A.
liver impacts
Elevated NOX concentrations impact on
2015 Results and trends ecosystems. NOX levels can contribute to the
acidification and eutrophication of soils and
50
water, which can lead to changes in species
45 Annual limit value diversity. NOX also acts as a precursor to ozone
40 and also is involved with the production of
35 secondary organic aerosol (SOA).
Annual Mean µg/m3
30 Zone A
Traffic
25 Zone A
Background
Outlook for NOX levels in Ireland
20
Zone B
15 Traffic Due to our continued reliance on fossil fuelled
10 Zone C combustion engine transport, NO2/NOX levels
5 will remain a problem pollutant in our Irish
Zone D
towns and cities. In fact, the problem will likely
0
be exacerbated with the continued increase in
economic activity, as NOx concentrations would
be expected to rise accordingly. Coupled with
Figure 2.1 Trend in NO2 concentrations for zones in Ireland 2005 ‐ 2015 favourable meteorological conditions for the
build‐up of NO2, it is probable that we will see
exceedances of the NO2 limit value in the near
NO2 concentrations were monitored at 15 locations across Ireland in future. Although there is some hope that
2015. NO2 values for all monitoring sites in Ireland were below the technological advances in the future may lead
annual limit value in 2015. Details regarding annual averages and other to lower NOX emissions from individual cars
statistics are available in Table A4 of Appendix A. (EURO 6 emissions standards), this technology
Figure 2.1 shows the trend for NO2 across Ireland for 2005 to 2015. will take time to make an impact on the levels
Levels across all zones of Ireland have remained relatively static since as they stand. A more certain route to
2005, with signs of a slight increasing trend in the years 2008 ‐ 2010. mitigating the problem of NOX, is for individuals
During this period NO2 levels were close to the limit value at Dublin City to prioritise public transport and alternative
and Cork City centre monitoring sites, with the limit value exceeded in modes of transport over use of the private
Dublin in 2009. However, NO2 levels decreased in general from 2010 to motor car. Transport policy in Ireland should
2012. This downward trend appears to have stabilised with NO2 values also further reflect this priority and should go
showing something of an increase again in 2013 and 2014 at some further in attempting to tackle the problem of
locations, such as the Zone B traffic site. air pollution, whether through the use of
alternative modes of transport or alternative
The reason for the decrease in NO2 concentrations from 2010 to 2012 fuels, including electric motor powered
could partly be due to meteorological conditions (a predominance of transport.
wet and windy weather), as well as a decrease in traffic numbers for the
period, reflective of the downturn in the economy.
17Air Quality In Ireland 2015
3. Sulphur dioxide (SO2)
Where does SO2 come from? Why do we monitor SO2
SO2 is a gas which is formed when sulphur containing fuels Health effects from elevated levels of SO2 include
(mainly coal and oil) are burned in power stations, domestically,
Aggravation of asthma
and elsewhere. Volcanic eruptions are the predominant natural
source of sulphur dioxide. Reduce in lung function
Details with regard to ambient air quality standards and WHO Inflammation of the respiratory tract
guideline values for SO2 and other pollutants are listed in
General discomfort, anxiety and headaches
Appendix A.
SO2 is also a contributor to acidification of rivers and
lakes.
2015 Results and Trends Outlook for SO2 concentrations
in Ireland
25
Smaller towns may be more vulnerable
Vegetation annual limit value
20 to higher SO2 levels due to increased
coal or peat usage. Although it is
Annual Mean µg/m3
Zone A (traffic) expected that SO2 concentrations across
15 Zone A (background) Ireland will remain low for the
Zone B foreseeable future, it will be important
10 Zone D
for the consumer to maintain
awareness of their choice of home
heating fuel and where possible to
5 choose cleaner alternatives over coal
and peat. Further volcanic activity in
Iceland, due to its ability to influence
0
SO2 concentrations here in Ireland, must
2005 2006 2007 2008 2009 2010 2011 2012 2013 2014 2015
also be monitored in the future.
Figure 3.1 Annual mean SO2 concentrations 2005 ‐ 2015
SO2 was measured at 10 stations in 2015. The results of individual stations are
listed in Table A6 of Appendix A. No exceedances of the daily EU limit or the WHO
guideline values were recorded in 2015.
Figure 3.1 shows the trend in annual mean SO2 concentrations across Ireland since
2005. Levels have been consistently low in Ireland in that period. This is reflective
of the shift in fuel choice across Ireland in both the residential heating sector and
the energy production sector, from sulphur containing bituminous coal to those
fuels which are low in SO2 production such as natural gas.
18Air Quality In Ireland 2015
4. Carbon monoxide (CO)
Where does CO come from? Why do we Monitor Carbon Monoxide?
Carbon monoxide is a colourless gas, formed from incomplete Elevated concentrations of carbon monoxide in
oxidation during combustion of fuel. Sources of CO in Ireland are ambient air can lead to
mainly from vehicles, although tobacco smoke and poorly
heart disease
adjusted and maintained combustion devices, such as boilers,
contribute also. CO concentrations tend to be higher in areas with damage to the central nervous system
heavy traffic congestion.
fatigue and headaches
Details with regard to ambient air quality standards and WHO
guideline values for CO and other pollutants are listed in Appendix
A.
2015 Results and Trends
12
Limit vlaue
10
8
Dublin
mg/m3
6 Cork
4
2
0
2005 2006 2007 2008 2009 2010 2011 2012 2013 2014 2015 Outlook for CO concentrations
Figure 4.1 8‐hour maximum CO concentrations in Cork and Dublin, 2004 ‐ Carbon monoxide concentrations in Ireland
2015 are expected to stay low for the foreseeable
future.
CO was measured at five locations in 2015; the results are detailed in
Table A7 of Appendix A. Levels in 2015 are very similar to
concentrations observed in from 2005 to 2014 and are below the limit
value. Measured concentrations were also below the WHO air quality
guideline values. Trends in CO concentrations in Dublin and Cork since
2005 are shown in Figure 4.1. Levels have remained low over the period
with all levels recorded below the limit value set out in the CAFE
Directive and WHO guideline.
19Air Quality In Irreland 2015
2
5. Ozone (O3)
Where
W do
oes ozone come Why d
do we mon
nitor ozone
e?
frrom?
Elevatedd concentrattions of ozone can decrrease lung fu unction. It can also
Ozzone is forrmed as a secondary aggravaate respirato ory ailmentss in sensitivve individuals e.g. asth
hmatics,
poollutant in the tropospherre from the individuuals with lungg disease
ch
hemical reacction of NO OX, CO and
olatile organic compounds (VOCs) in
vo
th
he presence of sunlight. Ozone can
Ozonee ‐ A transb
boundary issue
alsso be preseent in the troposphere
duue to down nward flux from the
ozzone‐rich sttratosphere, where it
occcurs naturally and has an n important
ro
ole in abssorbing harmful UV
radiation. Ozone is readily
traansported from Atlaantic and
Euuropean regions due to the t natural
movement off air massess. Ground‐
levvel ozone is depleted d through
re
eactions w
with trafffic‐emitted
poollutants; theerefore levels of ozone
ural areas than in urban
arre higher in ru
arreas.
Deetails with regard to ambient air
quuality standards and WHO O guideline
vaalues for ozone and otherr pollutants
arre listed in TTable A1, Table A2 and
Taable A3 of Appendix A.
Figure 5..1 Annual Mea
an Ozone conccentrations accross Europe 2013
2
Figure 55.1 shows thhe concentra ations of ozoone in Irelan
nd in the Eu uropean
context . The impaccts of ground level ozonne can be seen s in central and
southerrn Europe, paarticularly byy those counntries with larger cities and high
sunshin e levels. How
wever the inffluence of baackground levvels of ozonee can be
seen aalong the western se eaboard, wiith Ireland experiencin ng this
phenommenon.
Ozone cconcentrations are strong gly influenceed by meteorrological connditions;
stable aanticyclones over
o Ireland with warm s unny weathe er are more likely
l to
producee higher levvels of ozone. This ca n arise from local em missions;
particul arly the interaction of oxxides of nitroggen, VOCs annd sunlight or
o it can
be duee to transbo oundary sources from tthe rest of Europe and d other
contine nts. The lack of high presssure stable aiir masses durring recent su
ummers
is refleccted in the relatively low le
evels of ozonne observed during
d these years.
y
20Air Quality In Ireland 2015
2015 Results and Trends Outlook for ozone
concentrations in
160 Ireland
8-hr daily maximum µg/ m3
140
120 Short acute ozone pollution
WHO guideline
100 episodes are infrequent in
80 Ireland; however they have
60 happened in the past and will
40
happen in the future. They
20
0
are most likely to occur in
Zone A (Dublin) Zone B (Cork) Zone C (21 Zone D summer months when there
biggest towns) (remainder of
is a stable anti‐cyclone over
country)
Ireland bringing settled, warm
weather. Movement of
Figure 5.2 8‐hour daily maximum concentrations at individual stations compared polluted air masses from
to the WHO guideline value for ozone
Europe are more likely to
occur during these periods,
Ozone concentrations recorded in 2015 were below the EU limit value for
with the air masses likely to
human health. There were six days recorded with maximum average 8‐hour
mean concentrations >120 µg/m3, all at our Monaghan remote site – Kilkitt. contain high levels of ozone.
When compared to the WHO guideline value shown in Figure 5.2, seven
monitoring stations were above this guideline value. Summary statistics for Because ozone levels in
individual stations are contained in Table A8 of Appendix A Ireland are highly influenced
by transboundary sources,
9000 attainment of the Long‐Term
8000 Galway objective (LTO) and
remote
7000 Long‐term objective compliance with the WHO
Monaghan
guideline value will only occur
AOT40 (µg/m3).h
6000 remote
5000 Laois should hemispheric ozone
regional
4000 Kerry remote
levels reduce. This will require
a European, and possibly
3000
Mayo near global, effort to reduce
2000 town
emissions of ozone
1000 precursors.
0
Figure 5.3 AOT40 at rural background stations, 2004 ‐ 2015
Figure 5.3 shows the AOT40 for five rural background stations for the years
2005‐2015. The AOT40 is an indicator of exposure of vegetation to ozone
during the growing season, when vegetation is more susceptible to damage
from pollutants. Rural background stations are classified as remote, regional
or near‐city depending on their proximity to urban areas. Ozone levels are
higher in remote regions and tend to be highest along the western
seaboard (indicated by the Galway and Kerry sites) and lower in the east of
the country (indicated by the Monaghan site).
21Air Quality In Ireland 2015
6. Particulate matter (PM10)
Where does particulate matter (PM10) come from? Why do we monitor PM10?
PM10 are particles with diameters of 10 μm or less. These particles can Elevated levels of PM10 can cause the
include direct emissions such as dust, emissions from combustion following health effects:
engines, emissions from the burning of solid fuels or natural sources
cardiovascular disease
such as windblown salt, plant spores and pollens. These direct emissions
are known as primary PM10. PM10 can also be produced indirectly by lung diseases
formation of aerosols as a result of reactions of other pollutants such as
heart attacks and arrhythmias
NOX and SO2; these are known as secondary PM10. In Ireland the main
sources are solid fuel burning and vehicular traffic. Agriculture is also a
significant source of secondary particulate matter, primarily through
formation of aerosols from ammonium nitrates for example.
Details with regard to ambient air quality standards and WHO guideline
values for ozone and other pollutants are listed in Table A1, Table A2 and
Table A3 of Appendix A.
2015 Results and Trends
50
45
Annual limit value
40
Zone A traffic
Annual Mean µg/m3
35
Zone A background
30
Zone B traffic
25 WHO air quality guideline
Zone C
20
Zone D
15
10
5
0
2005 2006 2007 2008 2009 2010 2011 2012 2013 2014 2015
Figure 6.1 Annual mean PM10 concentrations 2005‐2015
PM10 was monitored at eighteen stations across Ireland in 2015; the results and summary statistics for individual
stations are available in Table A10 of Appendix A. Mean concentrations are below the annual limit value of 40 µg/m3.
With respect to WHO air quality guideline values, no monitoring stations exceeded the annual guideline value.
However, when measuring against the WHO 24‐hour mean guideline value (50 µg/m3), sixteen monitoring stations
had daily mean values > 50 µg/m3.
Figure 6.1 displays the trend in PM10 annual mean concentration from 2005 to 2015. In cities, traffic emissions are the
main source of PM10, while in smaller towns or those areas not connected to the natural gas grid, emissions from
residential solid fuel combustion dominate. The air quality in cities benefits from increased use of gas in place of solid
fuel, and a ban on the use of bituminous coal, with the result that levels of PM10 are similar across all zones. Despite
large differences in population number Zone D has similar PM concentrations compared to Zones A and B. This is
most likely due to residential solid fuel emissions in Zone D which in this zone are a more significant source than
traffic emissions.
22Air Quality In Irreland 2015
2
Ou
utlook for P
PM10 conccentrationss
Loooking at the ttrend analyssis for the lasst decade (Figgure 6.1) it is clear that there
t has beeen no discerrnible decreaase
in PM
P 10 concen ntrations acrooss Ireland. Although
A aveerage concentrations are e below the EU limit valu
ue, they bord der
the
e WHO air qu uality guideline value. To o see a reduuction in the impact of PM P 10 on the hhealth of thee populationn, a
connsistent decrrease in emissions is req quired. The i mpetus for thist decrease e could comme from an adoption of the t
WH HO air qualityy guideline value
v across the EU. The reductions in emissions across Irela nd will require a changee in
the
e choices individual custo omers make in the fuels tthey use to heat their ho omes, with a significant shift
s from so
olid
fue
el use to cleaaner alternattives. Impro oving the awwareness of consumers
c of
o the relatioonship betwe een health and
air quality and ssupporting clean
c air choices, will be eessential to achieve thesse goals.
PM
M10 ‐ a Euro
opean view
w
Figu
ure 6.2 PM10 cconcentrationss across Europ
pe in 2013
As can be seen from Figuree 6.2 above forf 2013, PM
M10 concentraations vary considerably
c throughout Europe. Mu uch
of this
t variation n stems from
m dominant fuel
f use on a regional basis, for taskss such as hom me heating oro even the use
u
of solid
s fuel forr outdoor coo
oking, with the
t use of woood in the Mediterranea
M n states a siggnificant sou
urce of PM.
23Air Quality In Ireland 2015
7. Particulate matter (PM2.5)
Where does particulate matter PM2.5 come from? Why do we monitor particulate
matter PM2.5?
PM2.5 or ‘fine’ particulate matter is particle pollution made of a mixture of
solids and liquids of size 2.5 μm or less. It is composed of a number of PM10 and PM2.5 include inhalable particles that
varying components depending on its source. These can include acids such are small enough to penetrate the thoracic
as nitrates and sulphates, VOCs, metals, and soil or dust particles. This region of the respiratory system. The health
PM2.5 can be emitted directly into the atmosphere or can be formed effects of inhalable PM are well documented.
secondarily. For example, sulphate particles are formed by the chemical They are due to exposure over both the short
reaction of SO2 in the atmosphere after its release from power plants or term (hours, days) and long term (months,
industrial facilities. PM2.5 is considered a better indicator of man‐made years) and include:
particulate matter than PM10.
respiratory and cardiovascular
Details with regard to ambient air quality standards and WHO guideline morbidity, such as aggravation of
values for PM2.5 and other pollutants are listed in of Appendix A asthma, respiratory symptoms and an
increase in hospital admissions;
mortality from cardiovascular and
respiratory diseases and from lung
cancer (WHO, 2013)
National Emission Reduction
Target for PM2.5
The CAFE Directive (2008/50/EC)
requires Member States to
determine the PM2.5 average
exposure indicator (AEI). The value
will decide the national exposure
reduction target (NERT) which must
be met by 2020.
Based on historical levels of PM2.5,
Ireland is required to reduce levels
by 10% on or before 2020. This
equates to a 1µg/m3 reduction from
10.4µg/m3 to 9.4µg/m3.
24Air Quality In Ireland 2015
Data 2015 Results
30
Annual limit value
25
Coleraine St.
20
Annual Mean µg/m3
Rathmines
Marino
15 Cork
Ennis
Longford
10
Claremorris
WHO air quality guideline Bray
5
Finglas
0
2009 2010 2011 2012 2013 2014 2015
Figure 7.1 Annual mean PM2.5 concentrations 2009‐2015
The CAFE Directive introduced mandatory monitoring of PM2.5. Figure 7.1 details results at 7 stations from 2009 to 2015.
Levels in Ireland are below both the stage one and stage two limit values of 25 and 20 µg/m3 (stage one was to be attained
by 2015, with stage two attainment by 2020). PM2.5 results for individual stations are detailed in Table A11 of Appendix A.
With regards to WHO air quality guideline values, Ireland exceeds the annual WHO guideline value for PM2.5 at 1 of the 9
stations monitored. When looking at the 24hr average WHO guideline value, 8 out of the 9 monitoring stations are above
this guideline value.
Summary statistics for chemical composition of PM2.5 in 2015 are shown in Table A12 of Appendix A
Outlook for PM2.5 concentrations
There have been no exceedances of the EU limit value for PM2.5 (25µg/m3) in Ireland. However as can be seen from Figure
7.1 concentrations in general are above the WHO air quality guideline value. PM2.5 is considered a better marker than
PM10 for anthropogenic air pollution and thus it is evident in Ireland that human activities are impacting on air quality with
the potential to negatively impact on human health. The levels observed have a variety of sources including contributions
from the commercial, industrial, and agriculture sectors. However the largest contribution in Ireland comes from the
residential sector with solid fuel combustion being the predominant source. Steps have been taken in recent years to
mitigate this problem with the extension of the bituminous coal ban; however a total shift from solid fuel combustion is
needed before large improvements will be noticed.
Under the National Emissions Reduction Target (NERT) set for each country by the European Commission, Ireland’s
obligation is to decrease PM2.5 concentrations by 10% by 2020. The timely implementation of sectoral emission reduction
polices will be key to achieving this target.
One aspect of particulate matter pollution which may be important in the future is ‘black carbon’. Black carbon is the
fraction of PM2.5 which strongly absorbs light, and it may be included into the National Emissions Ceiling Directive in the
future.
Black carbon is also a key concern for the recently formed Climate and Clean Air Coalition of which Ireland is a member.
The synergy of air quality and climate change issues, in particular short lived climate pollutants such as methane, black
carbon and ozone, is a key concern for this coalition.
25You can also read