Buckinghamshire Housing and Economic Development Needs Assessment 2016 - Study Appendices - Buckinghamshire Local Enterprise Partnership
←
→
Page content transcription
If your browser does not render page correctly, please read the page content below
Buckinghamshire
                Housing and Economic
                Development Needs
                Assessment 2016

                Study Appendices
                December 2016

Opinion Research Services   |   The Strand • Swansea • SA1 1AF   |   01792 535300   |   www.ors.org.uk   |   info@ors.org.uk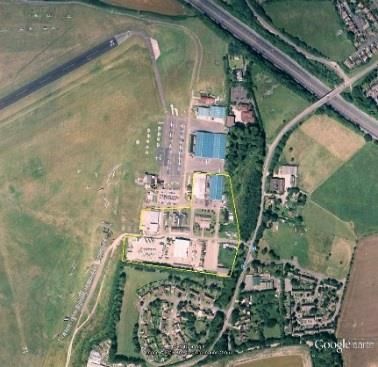
Opinion Research Services ▪ Atkins   |   Buckinghamshire HEDNA: Study Appendices                                                 December 2016

                                            Opinion Research Services | The Strand, Swansea SA1 1AF
                                            Jonathan Lee | David Harrison | Nigel Moore
                                            enquiries: 01792 535300 · info@ors.org.uk · www.ors.org.uk

                                            Atkins | Euston Tower, 286 Euston Road NW1 3AT
                                            Richard Ainsley
                                            enquiries: 020 7121 2280 · richard.ainsley@atkinsglobal.com · www.atkinsglobal.com

                                            © Copyright December 2016

                                                                        2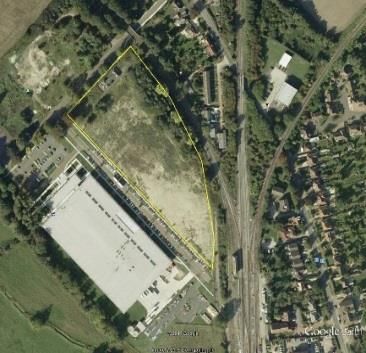
Opinion Research Services ▪ Atkins        |   Buckinghamshire HEDNA: Study Appendices                                                                         December 2016

        Contents
        Appendix A......................................................................................................... 4
           List of Property Agents Consulted .................................................................................................................. 4

        Appendix B ......................................................................................................... 5
           Stakeholder workshop meeting notes............................................................................................................ 5

        Appendix C ......................................................................................................... 9
           Site Reconnaissance ...................................................................................................................................... 9

        Appendix D ...................................................................................................... 14
           Experian and Trend-based scenarios ...........................................................................................................14

        Appendix E ....................................................................................................... 35
           Proportion of employment in each sector requiring B use class floorspace ...............................................35

        Appendix F ....................................................................................................... 38
           Sites with 1,000 sq. m or more of Net gain or loss of B-class Employment Floorspace ..............................38

        Appendix G ...................................................................................................... 42
           Consultation Responses ...............................................................................................................................42

                                                                                      3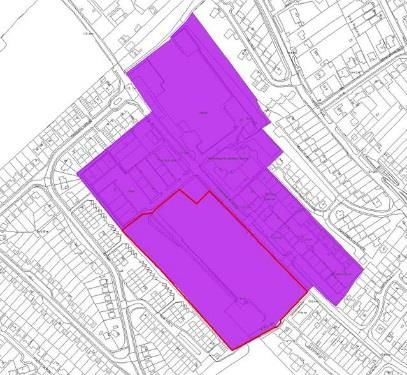
Opinion Research Services ▪ Atkins | Buckinghamshire HEDNA: Study Appendices December 2016
Appendix A:
List of Property Agents Consulted
Property market agents that contributed to the analysis include:
Stupples Chandler Gravey
Brown & Lee Clifford Billings
Philip Marsh Collins Deung Limited
Brown & Co
Dove Properties
Deriaz Slater
4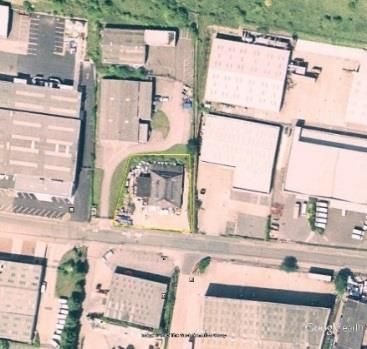
Opinion Research Services ▪ Atkins | Buckinghamshire HEDNA: Study Appendices December 2016
Appendix B:
Stakeholder workshop meeting
notes
Project: Buckinghamshire Economic Development Needs Assessment Stakeholder Workshop
th
Date and time: 19 May 2015 (10am-12.30am)
Meeting place: The Hub, High Wycombe
Present: Richard Ainsley Atkins
Zoe Green Atkins
Ilias Drivylas Atkins
Charlotte Morris Wycombe District Council
Charlotte Stevens Aylesbury Vale District Council
Judith Orr Chiltern District Council
Chris Schmidt-Reid Wycombe District Council
Ian Barham Buckinghamshire Thames Valley LEP
Steven Walford Buckinghamshire County Council
Mal Hussain Aylesbury Vale District Council
Ronnie Flemming Groundwork South (Thames Valley Area)
Tim Warrell Dove Properties
Paul Deriaz Deriaz Slater
Linda Walton Federation of Small Businesses
The following provides a summary of the key points of discussion raised at the Bucks Economic Needs
workshop.
Supply Side Issues
Geography
FEMA already defined in previous study (consisting of Aylesbury Vale, Wycombe and Chiltern
Districts, with a sub-area for Aylesbury Town).
Geographical areas influencing the FEMA economy - Milton Keynes, Oxfordshire, Cambridgeshire,
and London ‘the golden triangle’, also Slough, Maidenhead. East-West rail link will improve
connectivity, but there is still more investment in transport required.
Constraints on development – Green belt, Topography of land (hills in Wycombe), limited transport
connectivity, AONB.
Site Allocations
Aylesbury Vale – have a number of safeguarded employment sites, however local agents
considered that many of these sites are not suitable for development for employment uses (given
5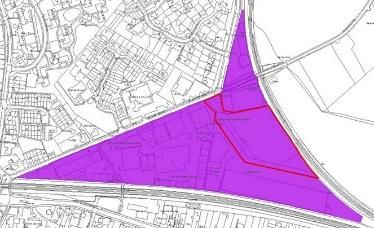
Opinion Research Services ▪ Atkins | Buckinghamshire HEDNA: Study Appendices December 2016
their locations which lack transport connections and other services / facilities). Aston Clinton MDA
– has not yet been brought forward for development. However, economic development officers at
Aylesbury Vale District Council are discussing options with the site owners.
Sites need to be allocated in the right locations (along key transport corridors) and with supporting
infrastructure (adequate road access).
Some sites are part of a wider mixed use scheme and often developers are not willing to bring
forward delivery of the employment component of the scheme (as playing a waiting game) often
they argue employment use is not viable.
Micro businesses struggle to find suitable premises for expansion/growth. This either constrains
growth or leads to them relocating elsewhere.
Chiltern and Wycombe – no land for B8 use class growth, generally more constrained than
Aylesbury Vale but have better transport connections, whereas Aylesbury Vale is less constrained
but poorer transport connections. Supply-driven equation – if you provide supply then
development will follow.
Lots of land allocated for grandiose B1 use class (head-quarters type accommodation) (e.g.
Silverstone development site) but there are very few spec B1 use class headquarter developments
going ahead across the country let alone Bucks.
Business requirements
Most of the demand for employment premises comes from existing local businesses wanting to
expand rather than businesses wanting to move in from outside the area.
Large businesses considering moving into the area not only need an appropriate site but need good
housing, retail, services, safety for their employees – quality of life/ ‘soft factors’.
Skills shortage – the area has a highly skilled and qualified population (high proportion with
degrees) but qualified young people tend to move elsewhere, primarily London or commute out for
work. This leads to skill gaps. Universities and colleges need to be providing the right training
courses to support the growing economic sectors in the FEMA. homes
Broadband connectivity is important for businesses but the level of connectivity does vary
considerably across the area.
Older premises are not meeting the needs of local businesses that need flexible modern style
accommodation. Local businesses are not able to expand. For example, locally based business ‘The
Entertainer’ – based in Amersham. 30 year old business employs middle/senior-level staff that
commute long distances as they can’t get the right skilled staff locally. The business has succeeded
in expanding its operations (by developing a national distribution centre), but this addition to their
stock is located further out in Banbury (250,000 sq. ft.) as there was not this type of suitable
accommodation available locally.
Transport infrastructure constraints affect development potential. Access to dual carriageways /
strategic transport routes are key to unlocking development sites.
Qualitative characteristics of sites are important – quantity may be available but not necessarily
right quality/location/type.
Vacancy rates vary, with pockets of high vacancy rates in locations which are less attractive for
employment. In particular Aylesbury Vale has areas of older premises which are not so attractive.
Other pressures / issues
Permitted Development Rights (PDRs) are affecting the office supply and difficult to predict which
sites will be affected. Viable office-based businesses are being displaced for residential conversion.
Some fully occupied premises are under pressure, and some are removing their tenants e.g. Offices
in Marlow and Tring.
6
Opinion Research Services ▪ Atkins | Buckinghamshire HEDNA: Study Appendices December 2016
Employment land also under pressure from housing development as residential land values are
typically higher than commercial. Some of the larger sites designated for employment uses may
have issues on viability for employment development.
Institutional finance a problem for seed bed development as their lending / investment criteria are
increasing all the time to bigger lot sizes.
Finance for infrastructure is also an issue.
There is a high proportion of start-ups in the area and people working from home.
The area is the heart of small start -up businesses and this should be supported, perhaps there is
too much of a hankering for big businesses.
Biggest challenge is providing suitable accommodation for businesses making the move from ‘home
working’ to small units. Multi-tenancies for lots of small units on a site are inefficient when
compared to one large tenancy.
‘Seed-bed’ units proven very successful e.g. Cressex, High Wycombe. More of these types of sites
are needed.
Big infrastructure investments imposed on the FEMA could have significant effects, such as dualling
the carriageway of the A421 could have a transformative effect on the north of the FEMA
connecting Buckingham to Milton Keynes and Bicester.
A41 Eastern Link Road around Aylesbury will improve connectivity to the north of the FEMA. A
proposal which would deliver the north east element of this linkage has been refused and is being
fought at appeal
Need to make more of innovation potential of the area – through better links with universities.
Demand Side Issues
Market demand
Office growth – little demand for large HQ offices.
Steady stream of demand for industrial premises – particularly modern / flexible accommodation
Plot ratios
Plot ratios are largely determined by car parking. Offices with no parking are more difficult to
let/sell. Many people do long commutes by car as in many cases it is not possible to travel by public
transport or cycling. Therefore parking space is essential – this pushes down plot ratios.
Small and large scale developments – different plot ratios. Town centre / rural location also affects
plot ratios.
County Council moving away from policy of capping parking. Developments must provide sufficient
(“just enough”) parking. This policy approach will need to be confirmed with the Local Authorities
Employment densities for offices are getting higher as businesses try to cut costs and more flexible
working meaning companies are able to get greater efficiencies out of floorspace.
Sectors
Manufacturing could revive if Brexit happens (this does not seem to take into account that many
international companies locate in Britain because they view it as their entry point to Europe).
Manufacturing decline could be halted if sufficient supply of B2 floorspace is provided.
Want to attract high value / high growth sectors (high value engineering, tech, aerospace
engineering, pharma)
Lack of local skills for high value/advanced manufacturing.
7
Opinion Research Services ▪ Atkins | Buckinghamshire HEDNA: Study Appendices December 2016
Forecasts are showing significant growth in B8 in the area but past trends show a decline in B8
employment. Not a surprise as limited supply of land for B8.
Does the area want B8 as they have few employees? Some smaller B8 units do actually have very
intense labour supply – particularly internet based industries where there is a lot of picking and
packing employment.
Good example of B1 development is at Chalfont St Peter, new development that is now fully
occupied.
Other Issues
External factors are influencing the FEMA – e.g. supply chain opportunities from the growth of
Luton Airport.
Economic strategy / vision needs to guide employment land policies – what can / does
Buckinghamshire want to do support.
Should there be a focus on certain sectors at certain business parks / employment areas. There is
precedent for this – creative industries and motorsports engineering.
A common message is needed from Buckinghamshire that it is a place to do business, the LEPs are a
good starting point.
8
Opinion Research Services ▪ Atkins | Buckinghamshire HEDNA: Study Appendices December 2016
Appendix C:
Site Reconnaissance
We undertook an assessment of some of the larger employment sites in the FEMA with a view
to considering whether there were opportunities for additional employment land in existing
employment sites and allocations. This work will help inform the HELAAs that each local
authority is currently undertaking.
This exercise involved rapid visitations to a limited number of sites that were agreed with the
three Buckinghamshire councils. The sites were selected on the basis of the following criteria:
Sites of strategic importance for the FEMA
Considerable size (more than 5 ha)
Identified for B class employment uses (existing site / future allocation within evidence base
documents etc.)
Capacity for B class employment uses (can be as part of a mixed use development)
Site that could come forward within the Study period (could provide short/medium/long term
opportunities)
The site reconnaissance assessments have helped to identify opportunities for future
employment supply (see chapter 6). Further details of the site reconnaissance work are included
in Appendix C. Key findings from the reconnaissance assessments are:
Aylesbury Vale – Has a number of key sites where new employment floorspace can be
developed. These fall into two categories: there are large greenfield opportunity sites (Aston
Clinton MDA, Arla and Aston 41, Berryfields, Silverstone) most of which currently have
planning permission; and there are existing employment sites with opportunity sites which
have planning permission (such as Gatehouse Industrial area, Haddenham Business Park
and Long Crendon Industrial Estate).
Chiltern – Has a limited range of sites that could come forward for employment floorspace. Of
the two sites visited only Asheridge Road has the opportunity for further development, where
a large cleared site is ready for redevelopment. Asheridge Road industrial estate is in good
condition and has some recent development that has come forward suggesting the site
remains attractive to the market.
Wycombe - Has a number of key sites where new employment floorspace can be developed.
These include: greenfield opportunity sites (Abbey Barn, Gomm Valley reserve sites);
existing employment sites with opportunity sites (Globe Park, Princes Estate, Sands
Industrial Estate and Wycombe Air Park). None of the opportunities identified at existing
industrial estates have planning permission, most are longer term opportunities as they will
require redevelopment of existing employment premises, whilst the opportunity at Princes
Estate is an immediate opportunity as the land is cleared and being marketed. The reserve
sites are poor in terms of access and location. The district lacks a good supply of shorter
term opportunities in accessible locations.
9
Opinion Research Services ▪ Atkins     |    Buckinghamshire HEDNA: Study Appendices                                                          December 2016

                                                                  Site Reconnaissance

Our ref   Site Name                  District           Assessment                                Opportunities       Opportunity Location

                                                        Well occupied, units in good
          Haddenham Business                            condition. Well laid out good servicing   Site has planning
          Park                                          and access. Two opportunities cleared     permission for B
      1                              Aylesbury Vale     / scrub land                              class development   N/A

                                                        Could not access - security controlled
          Westcott Venture Park
                                                        and owner would not agree
          (Westcott)
      2                              Aylesbury Vale     permission to enter.                      N/A                 N/A

          Gatehouse Industrial       Aylesbury Vale     Some opportunities opposite AVDC
          Area (Aylesbury)                              council offices. Derelict / vacant and
                                                        underutilised site on the corner of
                                                        gatehouse road and gatehouse close.
                                                        Longer term opportunity could be the
                                                        BT site on Griffin Lane. Some of site
                                                        has been converted to residential

                                                                                                  Site has planning
                                                                                                  permission for B
      3                                                                                           class development   N/A

          Aston Clinton Road         Aylesbury Vale     Large greenfield site, good strategic
          Major Development                             road access (A41 to M1). A little
          Area                                          isolated away from T/C and services

                                                                                                  Site has planning
                                                                                                  permission for B
      4                                                                                           class development   N/A

          Berryfields, Aylesbury                        Large scale residential development.
          off A41 (Aylesbury)                           Area north of station flagged for
                                                        employment. It will be important to
                                                        get a view from agents on what
                                                        demand would be like in this area.        Site has planning
                                                        Good access off A road and good rail      permission for B
      5                              Aylesbury Vale     access. Very few facilities nearby.       class development   N/A

          ARLA (Aston Clinton)       Aylesbury Vale     Dairy built out and operational. Land
                                                        available for warehouse / distribution
                                                        uses. Good location for these uses        Site has planning
                                                        given the access to strategic road        permission for B
      6                                                 network.                                  class development   N/A

          Aston 41, College Road     Aylesbury Vale     Greenfield land marketed for new          Site has planning
          North, Aylesbury, Bucks,                      production / warehouse units (Savills     permission for B
      7                                                 / LSH). Has outline consent. Good         class development   N/A

                                                                             10
Opinion Research Services ▪ Atkins | Buckinghamshire HEDNA: Study Appendices December 2016
Our ref Site Name District Assessment Opportunities Opportunity Location
location given access to strategic road
network.
Long Crendon Industrial Aylesbury Vale Well occupied, well laid out and
Park (Long Crendon) modern. Some very new units. Two
opportunity areas. 1 to the north is
cleared / greenfield. The other is
boarded up. Most units in good
condition some may be upgraded Site has planning
over time (e.g. Corner Drakes Drive & permission for B
8 Hikers Way) class development N/A
Raans Road
1.3 ha of
In reasonable condition, well opportunity for
9 Chiltern occupied. development.
Good quality business park / industrial
estate, some modern units recently
Asheridge Road
built. Large vacant site available.
Whilst there are some vacant units on
site, these are likely to be occupied in
the near future, as they are of a good Cleared site , B1 c
10 Chiltern quality. covering 2.6 ha / B2 / B8
Globe Park (Marlow)
(Southern Wycombe) Fairly well occupied. Lots of new units
being developed (high quality offices -
Meridian and Medina) and some new
units that have been occupied
Globeside. 1 redevelopment Some disused
opportunities (vacant boarded up buildings in poor
11 Wycombe buildings) condition B1 c / B2 / B8
Greenfield site.
Abbey Barn (reserve Access would need to be addressed
site) for the site. The location is relatively
isolated, Potentially less attractive for
B1a.
12 Wycombe N/A N/A
11Opinion Research Services ▪ Atkins | Buckinghamshire HEDNA: Study Appendices December 2016
Our ref Site Name District Assessment Opportunities Opportunity Location
Access seems very poor, narrow road
Gomm Valley (reserve
and weak bridge. Unlikely to meet
site)
13 Wycombe market demands. N/A N/A
Undeveloped land at
Princes Estate, Princes
Risborough
One large vacant parcel of land that is
being marketed by LSH (2.3ha). The 2.2ha of vacant land
rest of the site is quite new, good for identified for
14 Wycombe quality and well occupied (B1a / B1b) development. B1a/B1b
Sands Industrial Estate
(High Wycombe)
Large scale industrial estate which is
built at quite a high density. One
derelict unit could be redeveloped.
There are also two areas with poorer Redevelopment
quality units that could be opportunity for
redeveloped medium term to provide some of the derelict
15 Wycombe new floorspace. buildings. B1 c / B2 / B8
1 vacancy on boundary road. Area is
losing B class floorspace to retail and
Knaves Beech – Jn3 M40 other uses. Some good quality B1a
(High Wycombe) and storage and distribution units.
Fully built out and no scope for
16 Wycombe redevelopment, or opportunity land. N/A N/A
Well occupied industrial estate. 1
large vacant unit warehouse /
Soho Mills Industrial
industrial building. Some old units but
Estate / Wooburn
well occupied. Probably will be
Industrial Park (Southern
upgraded overtime, but no short /
Wycombe)
medium term redevelopment
17 Wycombe opportunities while occupied. N/A N/A
12Opinion Research Services ▪ Atkins | Buckinghamshire HEDNA: Study Appendices December 2016
Our ref Site Name District Assessment Opportunities Opportunity Location
Wycombe Air Park (High Used predominantly as an airfield.
Wycombe) There are industrial premises on the
site which are fair to poor quality and
the land is underutilised. Subject to Comprehensive
the airfields needs a comprehensive redevelopment of
redevelopment could take place. the area currently
Providing better quality and more occupied by
18 Wycombe floorspace. business premises. Suited to B1 / B2 / B8
Gomm Road/Tannery
Road Industrial Estate No scope for change, also
19 (High Wycombe) Wycombe predominantly retail and trade units. N/A N/A
1 ha of
development
Swan Frontage, High opportunity
Wycombe identified by
Wycombe District
20 Wycombe Council N/A
13Opinion Research Services ▪ Atkins | Buckinghamshire HEDNA: Study Appendices December 2016
Appendix D:
Experian and Trend-based scenarios
Aylesbury Vale
Aylesbury Vale Scenario 1 – Experian projections
According to Experian’s forecasts, full time equivalent employment (FTE) across all sectors in
Aylesbury Vale is forecast to increase from 59,900 FTEs in 2013 to approximately 72,000 FTEs in
2033, an increase of approximately 20% (Table D-1).
According to Experian’s forecasts, key growth sectors (in terms of absolute increase in FTE
employment) will include Administrative & Supportive Services, Wholesale, Professional Services,
and Health. The most notable decline is projected to take place in the Public Administration &
Defence sector, followed by Metal Products (manufacture of).
Table D-1 Aylesbury Vale Experian employment forecasts (FTEs) – sectors showing significant numerical changes in
employment
Sector Change 2013-2033 % change 2013-2033
Administrative & Supportive Services +2,200 +38%
Wholesale +2,100 +36%
Professional Services +1,800 +38%
Health +1,400 +30%
Residential Care & Social Work +1,100 +37%
Construction of Buildings
+1,000 +125%
Metal Products (manufacture of) -300 -43%
Public Administration & Defence -400 -11%
All sectors +12,100 +20%
Source: Experian
The number of FTEs in B use class sectors is forecast to increase from 29,070 in 2013 to 35,150 in
2033, an increase of approximately 21% (Table D-2). Employment in B1a/b sectors is forecast to
increase by approximately 4,440 FTE jobs between 2013 and 2033, which equates to an increase
of 21%. Employment growth in the B8 sector is projected to be lower in absolute terms but the
rate of growth is projected to be higher, at 28%.) The B1c/B2 sectors are forecast to experience
the lowest absolute and percentage employment growth, of 200 FTEs (an increase of 5%)
between 2013 and 2033.
14Opinion Research Services ▪ Atkins | Buckinghamshire HEDNA: Study Appendices December 2016
Table D-2 Aylesbury Vale Experian employment forecasts (FTEs) – B use class sectors
Change % change
Use class 2013 2033
2013-2033 2013-2033
B1a/b 21,620 26,060 +4,440 +21%
B1c/B2 4,210 4,410 +200 +5%
B8 5,000 6,380 +1,380 +28%
Total B use class 30,830 36,850 +6,020 +20%
Source: Experian, Atkins
Based on the above employment forecasts and the employment density and plot ratio
assumptions summarised in Chapter 6, Aylesbury Vale’s floorspace and land requirements over
the period 2013-2033 are summarised in Table D-3 and Table D-4 below.
Table D-3 Aylesbury Vale B use class floorspace need (square metres) – Scenario 1
Use class 2013 2033 Change 2013-2033
B1a/b 259,000 313,000 +53,000
B1c/B2 168,000 176,000 +8,000
B8 350,000 447,000 +97,000
Total B use class 778,000 936,000 +158,000
Source: Experian, Atkins
Table D-4 Aylesbury Vale B use class land need (hectares) – Scenario 1
Use class 2013 2033 Change 2013-2033
B1a/b 52 63 +11
B1c/B2 42 44 +2
B8 70 89 +19
Total B use class 164 196 +32
Source: Experian, Atkins
According to the Experian-based scenario, Aylesbury Vale will face additional land requirements
for all types of B use classes over the period to 2033, totalling 32 hectares. B8 will account for the
majority of this additional need (approximately 19 hectares).
15Opinion Research Services ▪ Atkins | Buckinghamshire HEDNA: Study Appendices December 2016
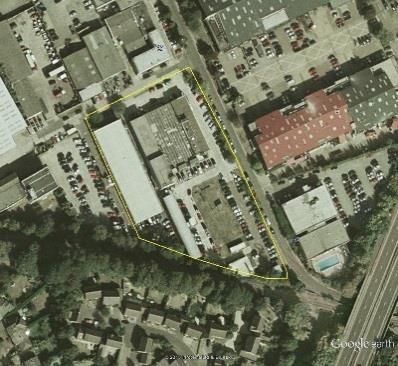
Aylesbury Vale Scenario 3 – Trend-based projections
Scenario 3 is a trend-based scenario based on Aylesbury Vale’s historical employment growth
levels between 1997 and 2013. Figure D-1 illustrates, there have been some fluctuations in the
number of FTE jobs over that period but there is a clearly positive trend line over time.
1
Figure D-1 Aylesbury Vale FTE employment 1997-2013
70,000
60,000
50,000
40,000
30,000
20,000
10,000
0
1997 1998 1999 2000 2001 2002 2003 2004 2005 2006 2007 2008 2009 2010 2011 2012 2013
Source: Experian
In total, employment grew by 6,400 FTE jobs over the period 1997-2013, representing growth of
approximately 12% (Table D-5). Key growth sectors over that period included Professional
Services, Administrative & Supportive Services, and Health. The greatest decline (in absolute
terms) took place across various Manufacturing sub-sectors and Insurance & Pensions.
1
The red dotted line shows the linear trend for FTE employment and the blue line shows the historic trend for FTE
employment over the period 1997 to 2013.
16Opinion Research Services ▪ Atkins | Buckinghamshire HEDNA: Study Appendices December 2016
Table D-5 Aylesbury Vale FTE employment – sectors showing significant numerical changes in employment
Sector Change 1997-2013 % change 1997-2013
Professional Services +2,600 +124%
Administrative & Supportive Services +2,300 +66%
Health +1,400 +42%
Residential Care & Social Work +900 +43%
Computing & Information Sciences +700 +70%
Agriculture, Forestry & Fishing -500 -33%
Manufacturing of Printing and
Recorded Media (manufacture of) -600 -67%
Insurance & Pensions -900 -69%
Other Manufacturing -900 -60%
Pharmaceuticals (manufacture of) -1000 -100%
All sectors +6,650 +12%
Source: Experian
The projection of these historical trends to 2033 suggests further employment growth in B1a/b
sectors and further decline in B1c/B2 and B8 sectors (Table D-6).
Table D-6 Aylesbury Vale trend-based employment projections (FTEs) – B use class sectors
Change % change
Use class 2013 2033
2013-2033 2013-2033
B1a/b 21,620 30,300 +8,680 +40%
B1c/B2 4,210 2,730 -1,480 -35%
B8 5,000 4,110 -890 -18%
Total B use class 30,830 37,140 +6,310 +20%
Source: Experian, Atkins
Under Scenario 3, B1a/b floorspace demand is projected to increase by some 105,000 square
metres over the period 2013-2033, while demand for B1c/B2 and B8 floorspace is projected to
decrease by 59,000 and 62,000 square metres respectively (Table D-7).
Table D-7 Aylesbury Vale B use class floorspace need (square metres) – Scenario 3
Use class 2013 2033 Change 2013-2033
B1a/b 259,000 364,000 +105,000
B1c/B2 168,000 109,000 -59,000
B8 350,000 288,000 -62,000
Total B use class 777,000 761,000 -16,000
Source: Experian, Atkins
The above floorspace requirements translate into an indicative need for 21 hectares of
additional B1a/b land over the period 2013-2033 (Table D-8). The decreasing need for B1c/B2
17Opinion Research Services ▪ Atkins | Buckinghamshire HEDNA: Study Appendices December 2016
and B8 land however would theoretically result in a surplus of approximately 27 hectares of
industrial and warehousing land.
Table D-8 Aylesbury Vale B use class land need (hectares) – Scenario 3
Use class 2013 2033 Change 2013-2033
B1a/b 52 73 +21
B1c/B2 42 27 -15
B8 70 58 -12
Total B use class 164 158 -6
Source: Experian, Atkins
Chiltern
Chiltern Scenario 1 – Experian projections
According to Experian’s forecasts, full time equivalent employment (FTE) across all sectors in
Chiltern is forecast to increase from 27,900 FTEs in 2014 to approximately 31,700 FTEs in 2036,
an increase of approximately 14% (Table D-9).
According to Experian’s forecasts, key growth sectors (in terms of absolute number of jobs) will
include Professional Services, Construction, and Finance. The most notable decline is projected
to take place in Wholesale and in Administrative & Supportive Services.
Table D-9 Chiltern Experian employment forecasts (FTEs) –sectors showing significant numerical changes in employment
Sector Change 2014-2036 % change 2014-2036
Professional Services +2,300 +61%
Construction of Buildings +700 +100%
Finance +600 +86%
Specialised Construction Activities +600 +67%
Accommodation & Food Services +500 +31%
Pharmaceuticals (manufacture of) -200 -25%
Administrative & Supportive Services -400 -29%
Wholesale -900 -31%
All sectors 3,800 14%
Source: Experian
The number of FTEs in B use class sectors is forecast to increase from 13,310 in 2014 to 15,710 in
2036, an increase of approximately 18% (Table D-10). Employment in B1a/b sectors is forecast to
increase by approximately 3,050 FTE jobs between 2014 and 2036, which equates to an increase
of 30%. Employment in B1c/B2 and B8 sectors is projected to decline by 20% each.
Table D-10 Chiltern Experian employment forecasts (FTEs) – B use class sectors
Use class 2014 2036 Change % change
18Opinion Research Services ▪ Atkins | Buckinghamshire HEDNA: Study Appendices December 2016
2014-2036 2014-2036
B1a/b 10,040 13,090 +3,050 +30%
B1c/B2 1,410 1,130 -280 -20%
B8 1,860 1,490 -370 -20%
Total B use class 13,310 15,710 +2,400 +18%
Source: Experian, Atkins
Based on the above employment forecasts, Chiltern is projected to need approximately 37,000
square metres of additional B1a/b floorspace by 2036 (Table D-11), which translates to indicative
demand for 7 additional hectares of B1a/b land (Table D-12).
Table D-11 Chiltern B use class floorspace need (square metres) – Scenario 1
Use class 2014 2036 Change 2014-2036
B1a/b 121,000 157,000 +37,000
B1c/B2 56,000 45,000 -11,000
B8 130,000 104,000 -26,000
Total B use class 307,080 306,580 -500
Source: Experian, Atkins
Table D-12 Chiltern B use class land need (hectares) – Scenario 1
Use class 2014 2036 Change 2014-2036
B1a/b 24 31 +7
B1c/B2 14 11 -3
B8 26 21 -5
Total B use class 64 64 -1
Source: Experian, Atkins
19Opinion Research Services ▪ Atkins | Buckinghamshire HEDNA: Study Appendices December 2016
Chiltern Scenario 3 – Trend-based projections
Scenario 3 is a trend-based scenario based on Chiltern’s historical employment growth levels
between 1997 and 2013 (Figure D-2).
2
Figure D-2 Chiltern FTE employment 1997-2013
30,000
25,000
Employment floorspace (sq.m)
20,000
15,000
10,000
5,000
0
1997 1998 1999 2000 2001 2002 2003 2004 2005 2006 2007 2008 2009 2010 2011 2012 2013
Source: Experian
In total, employment grew by approximately 4,200 FTE jobs over the period 1997-2013,
representing growth of approximately 19% (Table D-13). Key growth sectors over that period
included Professional Services, Computing & Information Services, Education, and Health. The
greatest decline (in absolute terms) took place across the various Manufacturing sub-sectors
and Wholesale.
2
The red dotted line shows the linear trend for FTE employment and the blue line shows the historic trend for FTE
employment over the period 1997 to 2013.
20Opinion Research Services ▪ Atkins | Buckinghamshire HEDNA: Study Appendices December 2016
Table D-13 Chiltern FTE employment –sectors showing significant numerical changes in employment
Sector Change 1997-2013 % change 1997-2013
Professional Services +1,800 +113%
Computing & Information Services +700 +117%
Education +700 +30%
Health +500 +45%
Residential Care & Social Work +400 +29%
Retail +400 +20%
Administrative & Supportive Services -200 -13%
Agriculture, Forestry & Fishing -200 -50%
Other Manufacturing -200 -40%
Other Private Services -200 -20%
Wholesale -400 -13%
All sectors +4,200 +19%
Source: Experian
The projection of these historical trends to 2036 suggests further employment growth in B1a/b
sectors and further decline in B1c/B2 and B8 sectors (Table D-14).
Table D-14 Chiltern trend-based employment projections (FTEs) – B use class sectors
Change % change
Use class 2014 2036
2014-2036 2014-2036
B1a/b 10,020 13,810 +3,790 +38%
B1c/B2 1,620 1,150 -470 -29%
B8 1,620 1,100 -520 -32%
Total B use class 13,260 16,060 +2,800 +21%
Source: Experian, Atkins
Under Scenario 3, B1a/b floorspace demand is projected to increase by some 46,000 square
metres over the period 2014-2036, while demand for B1c/B2 and B8 floorspace is projected to
decrease by 19,000 and 36,000 square metres respectively (Table D-15).
Table D-15 Chiltern B use class floorspace need (square metres) – Scenario 3
Use class 2014 2036 Change 2014-2036
B1a/b 120,000 166,000 +46,000
B1c/B2 65,000 46,000 -19,000
B8 113,000 77,000 -36,000
Total B use class 298,000 289,000 -9,000
Source: Experian, Atkins
The above floorspace requirements translate into an indicative need for 9 hectares of additional
B1a/b land over the period 2014-2036 (Table D-16).
21Opinion Research Services ▪ Atkins | Buckinghamshire HEDNA: Study Appendices December 2016
Table D-16 Chiltern B use class land need (hectares) – Scenario 3
Use class 2014 2036 Change 2014-2036
B1a/b 24 33 +9
B1c/B2 16 11 -5
B8 23 15 -7
Total B use class 63 60 -3
Source: Experian, Atkins
Wycombe
Wycombe Scenario 1 – Experian projections
According to Experian’s forecasts, full time equivalent employment (FTE) across all sectors in
Wycombe is forecast to increase from 69,700 FTEs in 2013 to approximately 80,800 FTEs in 2033,
an increase of approximately 13% (Table D-17).
According to Experian’s forecasts, key growth sectors (in terms of absolute number of jobs) will
include Wholesale, Accommodation & Food Services, and Health. The greatest decline is
projected to take place in Computer & Electronic Products (manufacture of) and Public
Administration & Defence.
Table D-17 Wycombe Experian employment forecasts (FTEs) –sectors with significant numerical change in employment
Sector Change 2013-2033 % change 2013-2033
Wholesale +1,700 +19%
Accommodation & Food Services +1,500 +42%
Construction of Buildings +1,500 +107%
Health +1,400 +37%
Residential Care & Social Work +1,300 +54%
Specialised Construction Activities +1,200 +44%
Finance -400 -29%
Public Administration & Defence -400 -24%
Computer & Electronic Products
(manufacture of) -1,100 -58%
All sectors +9,100 +13%
Source: Experian
The number of FTEs in B use class sectors is forecast to increase from 36,620 in 2013 to 38,150 in
2033, an increase of approximately 4% (Table D-18). Employment in B1a/b sectors is forecast to
increase by approximately 1,300 FTE jobs between 2013 and 2033, which equates to an increase
of 5%. Employment in B8 sectors is forecast to grow by 21% while industrial B1c/B2 employment
is projected to decline by 22% over the same period.
22Opinion Research Services ▪ Atkins | Buckinghamshire HEDNA: Study Appendices December 2016
Table D-18 Wycombe Experian employment forecasts (FTEs) – B use class sectors
Change % change
Use class 2013 2033
2013-2033 2013-2033
B1a/b 25,360 26,660 +1,300 +5%
B1c/B2 4,890 3,800 -1,090 -22%
B8 6,370 7,690 +1,320 +21%
Total B use class 36,620 38,150 +1,530 +4%
Source: Experian, Atkins
Based on the above employment forecasts, Wycombe is projected to need some 16,000 square
metres of additional B1a/b floorspace by 2033 and an additional 92,000 square metres of B8
floorspace (Table D-19). B1c/B2 floorspace requirements are projected to decrease by 44,000
square metres.
Table D-19 Wycombe B use class floorspace need (square metres) – Scenario 1
Change
Use class 2013 2033
2013-2033
B1a/b 304,000 320,000 +16,000
B1c/B2 196,000 152,000 -44,000
B8 446,000 538,000 +92,000
Total B use class 946,000 1,010,000 +64,000
Source: Experian, Atkins
The above translate into indicative need for 3 additional hectares of B1a/b land and 18 hectares
of B8 land (Table D-20).
Table D-20 Wycombe B use class land need (hectares) – Scenario 1
Change
Use class 2013 2033
2013-2033
B1a/b 61 64 +3
B1c/B2 49 38 -11
B8 89 108 +18
Total B use class 199 210 +11
Source: Experian, Atkins
23Opinion Research Services ▪ Atkins | Buckinghamshire HEDNA: Study Appendices December 2016
Wycombe Scenario 3 – Trend-based projections
Scenario 3 is a trend-based scenario based on Wycombe’s historical employment growth levels
between 1997 and 2013. As Figure D-3 illustrates, employment numbers peaked in 2001, and
there is a clear downward sloping trend throughout the period.
3
Figure D-3 Wycombe FTE employment 1997-2013
90,000
80,000
70,000
60,000
50,000
40,000
30,000
20,000
10,000
0
1997 1998 1999 2000 2001 2002 2003 2004 2005 2006 2007 2008 2009 2010 2011 2012 2013
Source: Experian
In total, employment declined by approximately 2,800 FTE jobs over the period 1997-2013,
representing a decrease of approximately 4% (Table D-21). Key growth sectors over that period
included Health, Specialised Construction Activities, and Computing & Information Services. The
greatest decline (in absolute terms) took place across the various Manufacturing sub-sectors,
and Administrative & Supportive Services.
3
The red dotted line shows the linear trend for FTE employment and the blue line shows the historic trend for FTE
employment over the period 1997 to 2013.
24Opinion Research Services ▪ Atkins | Buckinghamshire HEDNA: Study Appendices December 2016
Table D-21 Wycombe FTE employment – sectors with significant numerical change in employment
Sector Change 1997-2013 % change 1997-2013
Health +1,300 +52%
Specialised Construction Activities +1,200 +80%
Computing & Information Services +1,100 +33%
Real Estate +1,000 +250%
Residential Care & Social Work +800 +50%
Computer & Electronic Products
(manufacture of) -1,200 -39%
Wholesale -1,400 -14%
Administrative & Supportive Services -1,500 -22%
Other Manufacturing -1,800 -62%
Machinery & Equipment (manufacture
of ) -2,300 -96%
All sectors -2,800 -4%
Source: Experian
The projection of these historical trends to 2033 suggests decline across all B use class sectors
(Table D-22). In total, B use class employment is projected to decline by nearly 10,000 FTE jobs
between 2013 and 2033.
Table D-22 Wycombe trend-based employment projections (FTEs) – B use class sectors
Change % change
Use class 2013 2033
2013-2033 2013-2033
B1a/b 25,360 21,340 -4,020 -16%
B1c/B2 4,890 1,320 -3,570 -73%
B8 6,370 4,450 -1,920 -30%
Total B use class 36,620 27,110 -9,510 -26%
Source: Experian, Atkins
The above employment projections translate into declining floorspace and land requirements
across all B use classes (Table D-23 and Table D-24). Scenario 3 suggests that Wycombe’s
employment land requirements between 2013 and 2033 would decrease by a total of 72
hectares.
Table D-23 Wycombe B use class floorspace need (square metres) – Scenario 3
Use class 2013 2033 Change 2013-2033
B1a/b 304,000 256,000 -48,000
B1c/B2 196,000 53,000 -143,000
B8 446,000 311,000 -135,000
Total B use class 946,000 620,000 -326,000
Source: Experian, Atkins
25Opinion Research Services ▪ Atkins | Buckinghamshire HEDNA: Study Appendices December 2016
Table D-24 Wycombe B use class land need (hectares) – Scenario 3
Use class 2013 2033 Change 2013-2033
B1a/b 61 51 -10
B1c/B2 49 13 -36
B8 89 62 -27
Total B use class 199 127 -72
Source: Experian, Atkins
These trend-based projections should be treated with caution however as it is unlikely that
Wycombe will have such high levels of surplus B use class land by 2033. This is for several
reasons. First, there is general consensus that the sharp decline in manufacturing activity that
has taken place in previous years is expected to slow down. In fact, several high value
manufacturing sub-sectors (e.g. advanced engineering and manufacturing) are seeing a
resurgence across the UK.
Second, the above figures do not take into account any loss of existing employment land that
may take place over the assessment period. In reality, it is highly unlikely that all of Wycombe’s
existing employment sites will still be in B-class use in 2033. The government’s permitted
development rights policies enabling B1 and B8 to residential conversions and the policy
emphasis on re-using brownfield land for new housing developments is expected to lead to
further losses of employment land that will need to be replaced.
While the trend-based projections provide useful context for forecasting future economic
needs, they need to be considered alongside the findings of the other scenarios tested as part
of this assessment.
South Bucks
South Bucks Scenario 1 – Experian projections
The Experian forecasts predict that FTE employment in South Bucks is due to grow from 30,600
in 2014 to 36,400 in 2035. This is extrapolated to 36,700 by 2036. This represents a total
increase of 6,100 FTE employees, an increase of 20%.
Forecast FTE employment growth for selected sectors is presented in Table D-25. In terms of
absolute numbers, the highest growth sectors are the Residential Care & Social Work,
Accommodation and food services, and Wholesale. Land Transport, Storage & Post, Media
Activities, and Computing & Information Services are predicted to contract.
26Opinion Research Services ▪ Atkins | Buckinghamshire HEDNA: Study Appendices December 2016
Table D-25 South Bucks Experian employment forecasts (FTEs) –sectors with significant numerical change in employment
Sector Change 2014-2036 % change 2014-2036
Residential Care & Social Work +1,200 +60%
Accommodation & Food Services +900 +32%
Wholesale +900 +21%
Administrative & Supportive Services +700 +25%
Construction of Buildings +500 +50%
Transport Equipment (manufacture
of) +500 +63%
Computing & Information Services -200 -25%
Media Activities -200 -18%
Land Transport, Storage & Post -300 -27%
All sectors +6,100 +20%
Source: Experian
As observed in Table D-26, the number of FTEs in B use class sectors is forecast to increase from
15,660 in 2014 to 17,900 in 2036. This represents an increase of 14%. The largest absolute
growth by use class will be in B1a/b sectors, with growth of 1,350 FTE jobs (12% increase). The
highest proportional employment growth is to be in B1c/B2 sectors, with 35% employment
growth forecast (340 FTEs). B8 sectors experience more modest growth, with an additional 550
FTE jobs (growth of 18%).
Table D-26 South Bucks Experian employment forecasts (FTEs) – B use class sectors
Change % change
Use class 2014 2036
2014-2036 2014-2036
B1a/b 11,580 12,930 +1,350 +12%
B1c/B2 990 1,330 +340 +34%
B8 3,090 3,640 +550 +18%
Total B use class 15,660 17,900 +2,240 +14%
Source: Experian, Atkins
Based on these employment forecasts, South Bucks is projected to need some 16,000 square
metres of additional B1a/b floorspace by 2036 (Table D-27), which translates to indicative
demand for 3 additional hectares of B1a/b land (Table D-28).
Table D-27 South Bucks B use class floorspace need (square metres) – Scenario 1
Use class 2014 2036 Change 2014-2036
B1a/b 139,000 155,000 +16,000
B1c/B2 40,000 53,000 +14,000
B8 216,000 255,000 +39,000
Total B use class 395,000 463,000 +68,000
Source: Experian, Atkins
27Opinion Research Services ▪ Atkins | Buckinghamshire HEDNA: Study Appendices December 2016
Table D-28 South Bucks B use class land need (hectares) – Scenario 1
Use class 2014 2036 Change 2014-2036
B1a/b 28 31 +3
B1c/B2 10 13 +3
B8 43 51 +8
Total B use class 81 95 +14
Source: Experian, Atkins
South Bucks Scenario 3 – Trend-based projections
Scenario 3 is a trend-based scenario based on South Bucks’ historical employment growth levels
between 1997 and 2013 (Figure D-4).
4
Figure D-4 South Bucks FTE employment 1997-2013
35,000
30,000
25,000
Employment floorspace (sq.m)
20,000
15,000
10,000
5,000
0
1997 1998 1999 2000 2001 2002 2003 2004 2005 2006 2007 2008 2009 2010 2011 2012 2013
Source: Experian
In total, FTE employment grew 21% from 1997 to 2013, or by around 5,100 FTE employees
(Table D-29). Key growth sectors over that period included Residential Care & Social Work,
Professional Services and Health. Sectors where contraction in FTE employment has been
4
The red dotted line shows the linear trend for FTE employment and the blue line shows the historic trend for FTE
employment over the period 1997 to 2013.
28Opinion Research Services ▪ Atkins | Buckinghamshire HEDNA: Study Appendices December 2016
greatest include Chemicals (manufacture of) and Other Manufacturing, both of which are
estimated to have lost 100% of their employment.
Table D-29 South Bucks FTE employment 1997-2013 –sectors showing significant numerical change in employment
Sector Change 1997-2013 % change 1997-2013
Residential Care & Social Work +1,400 +233%
Professional Services +1,100 +42%
Health +700 +175%
Accommodation & Food Services +700 +37%
Administrative & Supportive Services +700 +39%
Chemicals (manufacture of) -1,000 -100%
Other Manufacturing -1,000 -100%
All sectors +5,100 +21%
Source: Experian
The projection of these historical trends to 2036 suggests further employment growth across all
sectors (Table D-30). Whilst the B1a/b sectors are projected to gain the greatest number of FTE
jobs (3,500), the B1c/B2 sectors are to experience the largest percentage growth (of 100%).
Moderate employment growth, of 200 FTEs or 7%, is projected in the B8 sectors.
Table D-30 South Bucks trend-based employment projections (FTEs) – B use class sectors
Change % change
Use class 2014 2036
2014-2036 2014-2036
B1a/b 11,000 14,500 +3,500 +32%
B1c/B2 900 1,800 +900 +100%
B8 2,900 3,100 +200 +7%
Total B use class 14,800 19,400 +4,600 +31%
Source: Experian, Atkins
As summarised in Table D-31, Scenario 3 predicts the demand for B1a/b floorspace will increase
by 41,900 square metres over the period 2014-2036. Demand for B1c/B2 and B8 floorspace will
also increase, by 36,000 and 20,000 square metres respectively. Total floorspace demand is
forecast to increase by approximately 98,000 square metres.
Table D-31 South Bucks B use class floorspace need (square metres) – Scenario 3
Use class 2014 2036 Change 2014-2036
B1a/b 132,000 174,000 +42,000
B1c/B2 36,000 71,000 +36,000
B8 200,000 221,000 +20,000
Total B use class 368,000 465,000 +98,000
Source: Experian, Atkins
The above floorspace requirements translate into an indicative need for 8 hectares of additional
B1a/b land over the period 2014-2036 and a total need of an additional 21 hectares of
employment land (Table D-32).
29Opinion Research Services ▪ Atkins | Buckinghamshire HEDNA: Study Appendices December 2016
Table D-32 South Bucks B use class land need (hectares) – Scenario 3
Use class 2014 2036 Change 2014-2036
B1a/b 26 35 +8
B1c/B2 9 18 +9
B8 40 44 +4
Total B use class 75 97 +21
Source: Experian, Atkins
FEMA
FEMA Scenario 1 – Experian projections
According to Experian’s forecasts, full time equivalent employment across all sectors in the FEMA
is forecast to increase by approximately 32,100 FTE jobs between 2013 and 2033, and a further
3,900 FTE jobs between 2033 and 2036 (Table D-33).
Experian’s forecasts predict that key growth sectors across the FEMA (in terms of absolute
number of jobs) will include Professional Services, Wholesale, and Construction of Buildings.
Many manufacturing sectors are predicted to contract, as is Public Administration & Defence.
Table D-33 FEMA Experian employment forecasts (FTEs) –sectors with significant numerical changes in employment
Sector Change 2013-2033 Change 2033-2036
Professional Services +32,100 +500
Wholesale +5,700 +400
Construction of Buildings +4,100 +200
Residential Care & Supportive
Services +3,900 +900
Accommodation & Food
Services +3,600 +400
Health +3,900 +500
Metal Products (manufacture
of) -600 -100
Public Administration &
Defence -900 +100
Computer & Electronic Products
(manufacture of) -1,100 -100
All sectors +32,100 +3,900
Source: Experian
The number of FTE employees in B use class sectors is forecast to increase from 95,020 in 2013
to 108,110 in 2036, an increase of approximately 17% (Table D-34). Employment in B1a/b sectors
is forecast to increase by approximately 10,860 FTE jobs between 2013 and 2036, which equates
to an increase of 16%. Employment in B8 sectors is forecast to grow by 3,210 FTE jobs (+20%)
while industrial employment is projected to experience a fall of 8% (980 FTE jobs).
30Opinion Research Services ▪ Atkins | Buckinghamshire HEDNA: Study Appendices December 2016
Table D-34 FEMA Experian employment forecasts (FTEs) – B use class sectors
Change Change
Use class 2013 2033 2036
2013-2033 2033-2036
B1a/b 67,410 78,270 79,270 +10,860 +1,000
B1c/B2 11,570 10,590 10,560 -980 -30
B8 16,040 19,250 19,500 +3,210 +250
Total B use class 95,020 108,110 109,330 +13,090 +1,220
Source: Experian, Atkins
Based on the above employment forecasts, the FEMA is projected to need some 142,000 square
metres of additional B1a/b floorspace by 2036 and an additional242,000 square metres of B8
floorspace (Table D-35). B1c/B2 floorspace requirements are projected to decrease by 40,000
square metres.
Table D-35 FEMA B use class floorspace need (square metres) – Scenario 1
Change
Change
Use class 2013 2033 2036 2013-
2033-2036
2033
B1a/b 809,000 939,000 951,000 +130,000 +12,000
B1c/B2 463,000 424,000 422,000 -39,000 -1,200
B8 1,123,000 1,348,000 1,365,000 +225,000 +18,000
Total B use class 2,395,000 2,710,000 2,739,000 +316,000 +28,000
Source: Experian, Atkins
The above floorspace projections translate into indicative need for approximately 28 additional
hectares of B1a/b land and 49 hectares of B8 land by 2033 (Table D-36). B1c/B2 land
requirements are expected to experience a reduction of 10 hectares.
Table D-36 FEMA B use class land need (hectares) – Scenario 1
Change Change
Use class 2013 2033 2036
2013-2033 2033-2036
B1a/b 162 188 190 +26 +28
B1c/B2 116 106 106 -10 -10
B8 225 270 273 +45 +48
Total B use class 502 563 569 +61 +67
Source: Experian, Atkins
FEMA Scenario 3 – Trend-based projections
Scenario 3 is a trend-based scenario based on the FEMA’s historical employment growth levels
between 1997 and 2013. As Figure D-6 illustrates, employment numbers have fluctuated over
that period, starting from 173,200 FTE jobs in 1997, rising to 190,300 in 2001 and reaching a low
of 178,200in 2009. The average number of FTE jobs over the period 1997-2013 was
approximately 183,300.
31Opinion Research Services ▪ Atkins | Buckinghamshire HEDNA: Study Appendices December 2016
5
Figure D-6 FEMA FTE employment 1997-2013 (Scenario 3)
200,000
180,000
160,000
140,000
120,000
100,000
80,000
60,000
40,000
20,000
0
1997 1998 1999 2000 2001 2002 2003 2004 2005 2006 2007 2008 2009 2010 2011 2012 2013
Source: Experian
The analysis of employment change by sector (Table D-37) shows that B1 sectors such as
Professional Services recorded high levels of employment growth between 1997 and 2013, but
B2 and B8 sectors, such as manufacturing, experienced significant levels of employment decline.
Table D-37 FEMA FTE employment 1997-2013 –sectors with significant numerical change in employment
Sector Change 1997-2013 % change 1997-2013
Professional Services +12,900 +7%
Health +5,100 +37%
Residential Care & Social Work +3,900 +53%
Computing & Information Services +3,500 +61%
Education +2,600 +46%
Real Estate +2,400 +19%
Computer & Electronic Products
(manufacture of) -1,500 -32%
Metal Products (manufacture of) -1,500 -47%
Printing and Recorded Media
(manufacture of) -1,500 -71%
Wholesale -1,800 -8%
Machinery & Equipment (manufacture -2,700 -82%
5
The red dotted line shows the linear trend for FTE employment and the blue line shows the historic trend for FTE
employment over the period 1997 to 2013.
32Opinion Research Services ▪ Atkins | Buckinghamshire HEDNA: Study Appendices December 2016
Sector Change 1997-2013 % change 1997-2013
of)
Other Manufacturing -3,900 -66%
All sectors +12,900 +7%
Source: Experian
The projection of these historical trends to 2036 suggests growth in B1a/b employment but
decline across B1c/B2 and B8 jobs (Table D-38). In total, B use class employment is projected to
experience modest growth of 1,680 FTE jobs.
Table D-38 FEMA trend-based employment projections (FTEs) – B use class sectors
Change Change
Use class 2013 2033 2036
2013-2033 2033-2036
B1a/b 67,410 78,910 80,628 +11,500 +1,700
B1c/B2 11,570 5,470 5,700 -6,100 +230
B8 16,040 12,700 12,435 -3,340 -270
Total B use class 95,020 97,080 98,763 +2,060 +1,680
Source: Experian, Atkins
The above employment projections translate into an additional requirement for some 159,000
square metres of B1a/b floorspace by 2036, and a theoretical surplus of almost 500,000 square
metres of industrial and warehousing floorspace (Table D-39).
Table D-39 FEMA B use class floorspace need (square metres) – Scenario 3
Change Change
Use class 2013 2033 2036 2013- 2033-
2033 2036
B1a/b 809,000 947,000 968,000 +138,000 +21,000
B1c/B2 463,000 219,000 228,000 -244,000 +9,000
B8 1,123,000 889,000 870,000 -234,000 -19,000
Total B use class 2,395,000 2,055,000 2,066,000 -340,000 +11,000
Source: Experian, Atkins
According to the projections of Scenario 3, the FEMA would have a significant surplus of B use
class land by 2036, as the additional requirements for 32 hectares of B1a/b land would be offset
by significant decline in demand for B1c/B2 and B8 land (Table D-40). As previously discussed,
however, the projections of the trend-based scenario should be treated with caution as such a
significant decline in B use class requirements is likely to be unrealistic.
Table D-40 FEMA B use class land need (hectares) – Scenario 3
Change Change
Use class 2013 2033 2036
2013-2033 2033-2036
B1a/b 162 189 194 +28 +4
33Opinion Research Services ▪ Atkins | Buckinghamshire HEDNA: Study Appendices December 2016
B1c/B2 116 55 57 -61 +2
B8 225 178 174 -47 -4
Total B use class 502 422 425 -80 +3
Source: Experian, Atkins
34Opinion Research Services ▪ Atkins | Buckinghamshire HEDNA: Study Appendices December 2016
Appendix E:
Proportion of employment in each
sector requiring B use class
floorspace
Experian analysis
Sector B1a/b B1c/B2 B8 NON-B
Accommodation & Food Services 100%
Administrative & Supportive Services 100%
Agriculture, Forestry & Fishing 100%
Air & Water Transport 25% 50% 25%
Chemicals (manufacture of) 100%
Civil Engineering 100%
Computer & Electronic Products (manufacture of) 10% 80% 10%
Computing & Information Services 100%
Construction of Buildings 10% 10% 20% 60%
Education 10% 90%
Extraction & Mining 100%
Finance 100%
Food, Drink & Tobacco (manufacture of) 70% 30%
Fuel Refining 100%
Health 10% 90%
Insurance & Pensions 100%
Land Transport, Storage & Post 30% 50% 20%
Machinery & Equipment (manufacture of) 70% 30%
Media Activities 50% 30% 20%
Metal Products (manufacture of) 80% 20%
Non-Metallic Products (manufacture of) 80% 20%
Other Manufacturing 100%
Other Private Services 50% 50%
35Opinion Research Services ▪ Atkins | Buckinghamshire HEDNA: Study Appendices December 2016
Sector B1a/b B1c/B2 B8 NON-B
Pharmaceuticals (manufacture of) 100%
Printing and Recorded Media (manufacture of) 10% 60% 30%
Professional Services 100%
Public Administration & Defence 70% 30%
Real Estate 100%
Recreation 100%
Residential Care & Social Work 10% 90%
Retail 100%
Specialised Construction Activities 100%
Telecoms 40% 20% 40%
Textiles & Clothing (manufacture of) 10% 60% 30%
Transport Equipment (manufacture of) 70% 30%
Utilities 20% 20% 60%
Wholesale 50% 50%
Wood & Paper (manufacture of) 60% 40%
36You can also read