TRANSAMERICA 2020 MARKET OUTLOOK - Not insured by FDIC or any federal government agency. May lose value. Not a deposit of or guaranteed by any ...
←
→
Page content transcription
If your browser does not render page correctly, please read the page content below

TRANSAMERICA 2020
      MARKET OUTLOOK

Not insured by FDIC or any federal government agency. May lose value. Not a deposit of or
guaranteed by any bank, bank affiliate, or credit union.
ABOUT THE AUTHOR
Tom is the Chief Investment Officer of
Transamerica Asset Management, the mutual fund
arm of Transamerica. Tom has more than 25 years
of investment management experience and has
managed large mutual fund portfolios and separate
accounts.

As a member of the senior management team, Tom
heads Transamerica’s thought leadership efforts
and provides perspectives to advisors, clients, the
media, and general public. He writes and publishes
Transamerica’s Market Outlook and other relevant
commentary. He also heads Transamerica’s mutual
fund sub-adviser selection and monitoring process,
as well as overall product management. Tom
holds a bachelor’s degree in political science from
Tulane University, and an MBA in finance from the
Wharton School at the University of Pennsylvania.

THOMAS R. WALD, CFA®
Chief Investment Officer,
Transamerica Asset Management, Inc.

                                                      2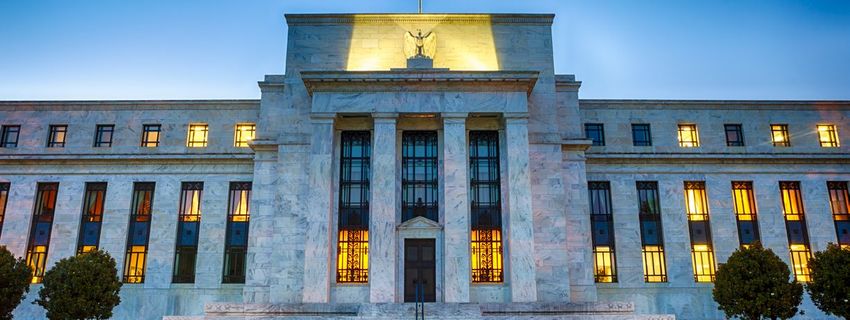
2020: WHERE WE STAND
• As we enter 2020, the market environment appears investor-friendly. We believe a
  confluence of positive characteristics could come together in aggregate to drive markets
  higher. The largest uncertainties are the upcoming November elections, geopolitical events,
  and the follow through on the recently improving U.S.-China trade relations.

• The U.S. economy is positioned for 2% growth or better in the year ahead, which should
  prove favorable for the equity and credit markets. Job growth remains impressive as
  unemployment rates have hit 50-year lows, and rising wages should continue to drive
  consumer spending. With benign inflation and the Fed’s proactive monetary policy
  adjustment in 2H19, we do not see a recession in the foreseeable future. Risks to growth
  include ongoing weakness in the manufacturing sector and corporate capital investment,
  which has slowed considerably. Should capital spending come off the sidelines, perhaps a
  result of mitigating trade uncertainties, we could see potential upside to growth.

• After U.S. stocks recently achieved record highs, we believe they are still well positioned
  for the year ahead as the economic and market backdrop could be reflecting a potential
  “Goldilocks” environment in 2020. This would consist of positive economic growth, non-
  threatening inflation, low interest rates, and rising corporate earnings growth. Valuations
  are reasonable, and after considering them with recent Fed rate cuts, we feel stocks could
  provide double-digit returns with potential upside from improving U.S.-China trade relations.
  We view a realistic one-year target on the S&P 500® to be 3,600.

• We believe the Fed has more than done its job for the year ahead by enacting three rate cuts
  in 2H19 and, in the process, helping to return the Treasury yield curve to a positive slope.
  As a result, the Fed is likely to remain on the sidelines over the next year barring either
  a material slowdown in the economy or unexpectedly high inflation, neither of which we
  attribute a strong probability. Bond investors will likely be well positioned toward the short
  end of the curve as longer maturities may not sufficiently compensate them for greater
  interest rate risk if the yield curve continues to steepen.

• High-yield and investment-grade bond investors are likely to experience coupon-type total
  returns in the year ahead as fundamentals continue to appear solid, although credit spreads
  remain close to multi-year lows. Risk in the U.S. corporate bond markets has also likely been
  mitigated by recent Fed rate cuts and the influx of negative-yielding overseas debt creating a
  global quest for income. We believe bond investors should continue to look toward higher-
  quality segments of the investment-grade and high-yield markets.

• Opportunities in international equities are looking stronger as both developed and
  emerging markets are positioned for a relative rebound versus U.S. stocks in 2020. This
  is based on bottoming global growth rates, more accommodative monetary policy from
  central banks, improving U.S.-China trade relations, better clarity on Brexit, and renewed
  earnings momentum of emerging market stocks. Should both global growth and emerging
  market earnings accelerate in the year ahead, as we believe they could, this would likely be
  favorably received by the markets.

• The upcoming presidential election will likely be more hostile and contentious than any
  in recent memory and could potentially impact the markets. Candidates offering policy
  agendas too far astray from traditionally accepted capitalist norms could also add to
  volatility if their perceived electability rises during the year. All things considered, however,
  politically based volatility in the year ahead could prove to be an opportunity.

                                                                                                      3
THE UNDERAPPRECIATED CATALYST
Investors often look for catalysts to identify market opportunities as they plot their course for
the year, and as we gaze ahead into 2020, we believe optimism is likely justified for perhaps
among the most underappreciated of reasons. Despite what clearly looks to be a year of
historically unprecedented political division and animosity, seemingly almost certain to
dominate the non-financial headlines and newscasts from now until November, the principal
reason we believe investors should look forward to remaining actively invested in the equity
and credit markets is, believe it or not, one of balance.

By balance, we mean a confluence of criteria, none of which individually make for an
overwhelming argument for market success in the year ahead, but in totality display the
potential for a healthier overall environment than most are likely fully appreciating. Over the
past year, we have referred to this as a potential “Goldilocks” scenario for investors — an
economic and market backdrop not too hot or too cold, but just enough for stock and bond
investors to generate good returns in the year ahead. So from where we stand, in a year
destined to be filled with verbal warfare on the campaign trail and cable opinion outlets, for
those simply wanting to step back from the noise and make some money in the markets, good
might seem pretty darn good.

A growing economy with lower interest rates and benign inflation, rising corporate earnings
growth, reasonable stock valuations, and solid fundamentals in the credit markets. Perhaps
none of these in and of itself are a game changer, but in aggregate they are a good mix for those
with fully invested portfolios and those with cash on the sidelines. Enough to stay in the game
and enough to stoke a little fear of missing out.

Of course, this is not to say the election and ongoing political environment, complete with their
many twists and turns, will not play a role in the markets. In all likelihood they will — but more
on that later. In addition, geopolitical risk has recently increased somewhat as seen in the U.S.-
Iran confrontation, and should we see further escalation, that could impact the markets as well.
However, right now it is important to view the landscape as it stands with the year before us,
and it’s here we see some green pasture.

There is an old saying that an optimist views the glass half full, the pessimist views it half
empty while the opportunist asks “is anyone going to finish that drink?” So, with this in mind
let’s take a look at what skilled mixologists might be seeing in the glass for the year ahead.

                                                                                                     4
U.S. ECONOMY

   The U.S. economy is positioned for 2% growth or better, which should
   prove favorable for the equity and credit markets. We do not see a
   recession in the foreseeable future and should capital spending come
   off the sidelines, perhaps a result of mitigating trade uncertainties,
   we could see potential upside to growth. Risks to growth include
   ongoing weakness in the manufacturing sector and corporate
   capital investment, which has slowed considerably.

We believe investors should view the prospects for the U.S. economy in 2020 from a lens
based on two important premises. First, we feel modest growth of approximately 2% is all
that is necessary to provide a favorable backdrop in the equity and credit markets. Second,
expectations, for the most part, remain somewhat skeptical that this level can be achieved. So
we have a relatively low bar and angst that it can be reached, this is precisely the sentiment
that breeds opportunity.

When looking at the trajectory for gross domestic product (GDP) throughout 2019, 2% growth
in 2020 should not seem nearly as daunting as many are making it out to be. Following a strong
1Q19 of 3.1% growth, the second and third quarters came in at 2.0% and 2.1%, respectively.
Current estimates for 4Q19 are at about 2.3%. Keep in mind, this pace of growth has been
achieved for the most part with higher interest rates than we are now experiencing and with all
of the China trade uncertainties that could subside to some extent in the year ahead.
So if the dynamics behind this trend growth can be maintained, we could see higher GDP
growth in 2020.

Our belief that 2% or better growth in 2020 can be achieved is predicated to a large degree on
the lower-rate environment the Fed has recently created and the mild inflationary trends that
are unlikely to move materially higher in the year ahead. A combination of 2% GDP growth, 2%
inflation, and a 1.5% Fed Funds rate is one we feel has tailwind written all over it.

GDP GROWTH TRAJECTORY

3.5%
            3.1%
3.0%
                                   Average 2.4%
                                                                                                        2.3%
2.5%

                                    2.0%                     2.1%
2.0%

1.5%

1.0%

0.5%

0.0%
             Q1                      Q2                       Q3                                       Q4 est.

                                                           Source: Bureau of Economic Analysis, Federal Reserve Bank of Atlanta

                                                                                                                                  5
So for the economy to preserve this 2% growth in the year ahead, therefore providing the markets with
the backdrop necessary for success, we believe the following areas of focus will prove critical:

• Progress on U.S.-China trade relations

• Alignment of consumer and corporate spending trends

• Reaching a bottom in the manufacturing sector

• Continued strength in the labor market

• Non-threatening levels of inflation

U.S. AND CHINA COME OUT OF THE COLD
December is typically not a month for much of anything to thaw, however the Phase One trade
agreement culminated by the U.S. and China in the final weeks of the year represents, in our opinion,
an important inflection point in the cold war of trade between the world’s two largest economies dating
back more than a year and a half. More than any other factor in the market over this past year, progress
toward an agreement and aversion of U.S.-imposed tariffs, in whole or part, have played major roles,
not just in ongoing market volatility but the perceived profile for economic growth in the U.S. and
globally.

In mid-December, an agreement of principle was reached by Presidents Trump and Xi Jinping in
which the U.S. has rolled back a meaningful portion of the $530 billion in tariffs previously enacted or
potentially to be imposed. The $160 billion scheduled to go into effect on December 15, which included
a large amount of consumer goods, has been taken off the table entirely. Approximately $120 billion
originally set forth this past September have been reduced from a rate of 15% to 7.5%, and the original
tranche of $250 billion implemented last summer at 25% remains unchanged. China has also agreed
conceptually to agricultural purchases from the U.S. of $40–$50 billion, an increase from the pre-
dispute levels of about $24 billion, though these numbers have not yet been finalized. This phase one
deal is expected to be formally signed in mid-January.

We believe investors should focus on a few key takeaways from this first real sign of progress between
the U.S. and China since relations deteriorated last spring. These would be:

• This Phase One deal, while certainly not eliminating the overall U.S.-China trade risk, could well
  represent a directional turning point as the worst may be over between the two nations. This would
  be a quite favorable development for investor psychology.

• While many would have preferred more, if not all, of the U.S. tariffs be rolled off, the movement
  in this agreement could very well be enough to encourage U.S. companies to increase capital
  spending and investment closer to pre-trade dispute levels, which could prove meaningful to the
  overall economy.
                                                                                                           6
• Investors should watch for continued progress and the prospect of a Phase Two agreement
  in 2020 with more tariff rollbacks. It is apparent now that an ultimate resolution will come
  in waves rather than one fell swoop, and if the surf continues to pick up, this will likely be
  favorable for economic growth and the markets.

While we would view this agreement as a welcome development, it’s important to recognize
that more drama likely awaits the market pertaining to this ongoing soap opera. If we have
learned anything about this trade dispute and its associated tariffs, it is that small changes in
direction can have real impacts on economic sentiment and the markets. We are not out of the
woods yet, though there is now a path. All considered, we believe this latest plot twist should
be viewed optimistically.

USMCA AGREEMENT ADDS TO IMPROVING TRADE ENVIRONMENT
More favorable news on trade reached the markets in the final days of December when the
House of Representatives approved the United States-Mexico-Canada Agreement (USMCA),
which will formally replace the North American Free Trade Agreement originally enacted by
the three countries in 1994. USMCA is considered to likely have a modestly favorable impact
on the U.S. economy based in large part upon what are beneficial terms to the farming and
auto industries. In addition to meaningful purchases by Canada of U.S. agricultural goods,
the agreement also dictates that by 2023, three-quarters of automobile components will
be produced within the three nations and 40% of those parts be manufactured by workers
earning at least $16 an hour. In total, early estimates are that the agreement could ultimately
add approximately half a million jobs and about 0.30% to U.S. GDP growth once fully
implemented in a few years. Perhaps more importantly, it could serve as an important example
that the overall trade environment is improving and incent businesses to increase capital
investment. In summary, we view the USMCA agreement as a welcome development to begin
2020 as it heads to the Senate for expected passage in January.

THE ECONOMIC ODD COUPLE: THE CONSUMER AND THE CORPORATION
Over the past year, there have been more than a few instances when economic bears set off
a flurry of alarms about a pending recession that seemingly appeared to be just around the
corner. Throughout these times of economic jitters, the U.S. consumer has shown tremendous
strength and resilience, displaying spending activity consistent with unemployment rates in
the mid-3% range (lowest in a half century) and personal income growth above 3%, a full 1%
higher than the previous decade’s average.

THE CONSUMER CONTINUES TO DRIVE GDP GROWTH
GDP and Personal Consumption Expenditures (January 2019 – November 2019)
5.0%
4.5%                        4.2%          4.3%                                                                                                     3.9%
         3.9%    3.7%                                4.0%             4.0%        4.0%            3.8%            4.0%
4.0%                                                                                                                                3.8%              4.0%
3.5%
3.0%              Q1
                 3.1%
2.5%                                                                                                                                                     2.4%
2.0%                                                                                       Q3                                    Q4 (est.)
                                                   Q2                                                                             2.3%
1.5%                                              2.0%                                    2.1%
1.0%
0.5%
0.0%
       1/31

                  2/28

                             3/31

                                           4/30

                                                         5/31

                                                                        6/30

                                                                                   7/31

                                                                                                   8/31

                                                                                                                    9/30

                                                                                                                                     10/31

                                                                                                                                                     11/30

                2019 Average GDP Growth                         Personal Consumption Expenditure Y/Y
                Average PCE Growth                              Gross Domestic Product
                                                                                            Source: Bureau of Economic Analysis, Federal Reserve Bank of Atlanta

                                                                                                                                                                   7
This can be seen in the trend of Personal Consumption Expenditures, which over the past year
have consistently come in at higher levels of growth than overall GDP. As consumer spending
represents about two-thirds of total economic growth, these numbers have been essential in
preserving growth throughout varying phases of the past year’s economic uncertainty.

However, the same cannot be said of corporate capital spending and investment, which, amid
the past year’s deteriorating U.S.-China trade relations, has pretty much ground to a halt. This
can be seen in recent trends of non-residential fixed investment (corporate expenditures on
capital such as commercial real estate, factories, tools, equipment, and software) having pretty
much stalled. It posted two consecutive quarters of negative growth in 2Q and 3Q19, fully
rolling over from a multi-year high of more than 8% back in 1Q18 (the last full quarter in which
the U.S.-China trade dispute was not a factor in the economy).

NONRESIDENTIAL FIXED INVESTMENT
Trade War has negatively impacted capital investment

10%

8%      8.4%       8.8%
                               7.9%                        Impact of U.S.-China Trade War
6%

                                                        4.8%
4%                                                                   4.4%

2%
                                            2.1%

0%
                                                                                     -1.0%

-2%
                                                                                                          -2.7%

-4%
       4Q17         1Q18        2Q18        3Q18        4Q18          1Q19            2Q19                 3Q19

                                                                                 Source: Bureau of Economic Analysis

Perhaps the trillion-dollar question facing the U.S. economy in 2020 can be summed up as
follows: Who is right about the future of the economy — consumers or corporations?

In seeking to answer this question, we focus on our belief that consumer behavior is reflecting
a multitude of factors in the economy while corporate spending may have been overly focused
on the U.S.-China trade dispute. Consumers are taking into account the labor market, their
confidence in finding and retaining jobs, the interest rates they are paying on debt, and recent
gains they have experienced in wages and income. On the other hand, corporations — and
this is also a perfectly reasonable perspective — appear to have been holding off on billions
in spending until there is more clarity on international trade and the ultimate level of tariffs
that the U.S. and China will be imposing on one another. Therein resides the impasse between
consumer and corporate spending trends within the U.S. economy.

We believe incremental trade progress between the U.S. and China, now at the very
least signifying a cessation to hostilities, could go a long way in thawing the corporate spending
freeze we have seen over the past year. A key element here is the recent culmination of a Phase
One deal between the U.S. and China, resulting in a rollback of $160 billion in tariffs by the U.S.
and large agricultural purchases by China.

                                                                                                                       8
The key point here is we believe there is pent up demand in corporate capital spending and
investment that will have to be unleashed at some point in the year ahead. While improving
trade relations could be a catalyst, so also might be the lower-rate environment helping to
support ongoing trends in consumer activity. Should we see the stagnation in corporate
spending break, 2% or better GDP growth will become more achievable in 2020.

ASSESSING THE MANUFACTURING SLOWDOWN
Another central theme being expressed by economic bears in recent months has been
the notion that the manufacturing sector of the U.S. economy has in fact already lapsed
into a recession. Flash update: yes, this is probably true. Flash update to the flash update:
manufacturing represents only about 11% of the total economy and 9% of nonfarm payrolls. In
addition, this recent industrial contraction may have bottomed.

The first week of October did serve as fodder for those on short-term recession watch, as the
Institute of Supply Management (ISM) Purchasing Managers Index (PMI) posted a contracting
indicator of 47.8 (above 50 represents expansion), its lowest level in almost a decade. In
addition, the ISM Nonmanufacturing Index released two days later came in at 52.6, below
expectations of 55. Bear in mind the ISM Index is a survey of what purchasing managers
anticipate but not necessarily the actions they have taken. Nonetheless, the impact of the trade
dispute turned trade war between the U.S. and China in place during 2H19 clearly showed up in
this September data.

October and November numbers for ISM Manufacturing PMI were not quite as bad at 48.3
and 48.1, but still in a contractionary trend. Nonmanufacturing PMI improved to 54.7 and 53.9,
nearly in line with previous expectations. So in summary, the September PMI results could be
representing a bottom, which would be a welcome development if U.S.-China trade relations
are bouncing off of depths as well.

ISM PURCHASING MANAGERS INDEXES
Manufacturing has contracted over the past year
62
61
60
59
58
57
56
55
                                                                                                                    53.9
54
53
52
 51
50
49
                                                                                                                     48.1
48
47
                                                   11/18

                                                                                                                     11/19
  11/17

                                            8/18

                                                                                                8/19
             2/18

                                                           2/19
                              5/18

                                                                         5/19

                    ISM Manufacturing PMI                         ISM Non-manufacturing PMI

                                                                                Source: Institute for Supply Management

                                                                                                                             9
JOBS MARKET AND WAGE GROWTH RESILIENT
For the better part of a year, we have been reiterating to investors that sometime in the near future we
will see a slowdown in monthly job gains below 100,000 and, more importantly, this should not be of
great concern. With an unemployment rate in the mid-3% range and at its lowest level in 50 years,
the economy has now basically reached full employment and pretty soon job gains will simply reflect
workforce population growth of about 75,000 a month. Moreover, this will ultimately represent the
fact that ongoing growth in the economy will no longer be dependent on maximizing employment but
maximizing the economic activity of those who are employed.

The good thing is we still believe this. The even better thing is that it still has not happened yet.

Since the beginning of 2010, when the unemployment rate was pushing 10%, the U.S. economy has
added over 19 million jobs, more than twice the amount lost during the financial crises and Great
Recession of 2007–2009. Through 2018, this averaged out to just over 200,000 per month for nine
years. This has been a truly exceptional run. The fact that 2019 has continued
at a rate averaging about 180,000 a month through the end of November is also
extremely impressive.

JOB GAINS AND UNEMPLOYMENT RATE SINCE GLOBAL FINANCIAL CRISIS
(January 2008 – November 2019)

  Declining Unemployment Rate                                                                                Total Job Gains and Losses Since GFC
                                                                                                       12%   25,000,000
           10.0%
                                                                                                       10%   20,000,000
                                                                                                                                                                          +22.5 million
                                                                                                             15,000,000
                                                                                                       8%
                                                                                                             10,000,000
                                                                                                       6%
                                                                                                              5,000,000
                                                                                           3.5%
                                                                                                       4%
                                                                                                                      0

                                                                                                       2%    -5,000,000            -8.7 million

                                                                                                       0%    -10,000,000
Nov 08

         Nov 09

                  Nov 10

                           Nov 11

                                    Nov 12

                                             Nov 13

                                                      Nov 14

                                                               Nov 15

                                                                        Nov 16

                                                                                 Nov 17

                                                                                          Nov 18

                                                                                                   Nov 19

                                                                                                             -15,000,000
                                                                                                                                  Jobs Lost                              Jobs Gained
                                                                                                                            During Financial Crisis                    During Recovery
                                    Unemployment Rate
                                                                                                                             (1/2008 - 2/2010)                        (3/2010 - 11/2019)
                                                                                                                                                             Source: Bureau of Labor Statistics

                                                                                                                                                                                                  10
                                                                                                                      Jobs lost period is 1/2008-2/2010. Jobs gained period is 3/2010-11/2019
Along those lines, nothing better demonstrated the strength and resiliency of the U.S. labor
market than the November nonfarms payroll report, which dramatically exceeded expectations
by adding 266,000 jobs and another 41,000 in upward revisions for September and October.
The overall unemployment rate fell to a fresh 50-year low of 3.5%, and average hourly earnings
also increased at an annualized rate of 3.1%. With three-month rolling average job gains now
once again above 200,000, we believe this report can certainly be viewed with optimism
looking into the New Year.
The November report also highlights the issue of wage growth, which as we have said many
times before in previous Outlooks had been a missing engine of growth in the economy
throughout most of the job revival of the past decade. Prior to 2008, average hourly earnings
of U.S. nonfarm employees had maintained a long-term average close to 3.5%. However, this
dipped to a generational low of just 1.2% in late 2012. Since then, hourly earnings fought their
way back to a 3% annualized rate in mid-2018, where they have been maintained since. We
continue to find this encouraging, but preserving such a level of wage growth will be important
in the year ahead.
WAGE GROWTH TAILWIND
Average Hourly Earnings continue to rise
4.0%
3.7%
3.5%
3.0%
3.1%
2.5%
2.0%
1.5%
1.5%
1.2%
1.0%
11/07
11/08
11/09
11/10
11/11
11/12
11/13
11/14
11/15
11/16
11/17
11/18
11/19
Average Hourly Earnings % Y/Y Average Hourly Earnings Nonsupervisory Workers % Y/Y
Source: Bureau of Labor Statistics
All considered, we believe the continued pace of strong monthly job gains combined with a
now-established higher level of wage growth is an important buffer within the economy and
serves as a key foundation of further consumer spending and overall GDP growth.
INFLATION LIKELY TO REMAIN BENIGN
Another key component in the economic backdrop is non-threatening levels of inflation. In this
regard, we believe concerning rates of inflation are still very much at bay.
Recent levels of inflation have been unable to materially surpass the all-important 2%
annualized rate that the Federal Reserve maintains as its long-term target. As of the end
of November, the headline Consumer Price Index (CPI) posted a 2.1% annual move with its
core number (ex food and energy) at 2.3%. More importantly, the Fed’s preferred measure
of inflation, the Personal Consumption Expenditures Price Index, continues to trend lower,
finishing November at only a 1.5% headline annualized rate and 1.6% on its core reading.
11INFLATION REMAINS BENIGN
Personal Consumption Expenditures Below 2%
3.0%
2.5%
2.0%
1.6%
1.5%
1.5%
1.0%
0.5%
0.0%
2/15
5/15
8/15
11/15
2/16
5/16
8/16
11/16
2/17
5/17
8/17
11/17
2/18
5/18
8/18
11/18
2/19
5/19
8/19
11/19
PCE Price Index % Y/Y Core PCE Price Index (ex. Food and Energy) % Y/Y
Source: Bureau of Economic Analysis
These continued mild inflation rates have not only played a role in sustained economic growth, but also
in the flexibility for the Fed to cut rates three times in 2H19. Admittedly, there have been times over the
past several years when a lack of inflation seemed to potentially threaten economic growth, and fears
of deflation crept into the collective mindset as well. However, the current environment continues to
be one of pleasant calm, sub-2% levels creating little fear of overheating the economy and allowing the
Fed extended leeway to reduce rates if necessary. Fortunately, we do not see this environment changing
much in 2020.
WELCOMING BACK THE UPWARD SLOPE
For much of the past year, the Treasury yield curve has been inverted, meaning that short-term interest
rates had been higher than long-term ones, traditionally viewed as a harbinger to a pending recession.
The curve first inverted in April, when the 10-year yield fell below the 3-month rate, but then quickly
readjusted only to invert again in June. In August, another closely watched slope of the curve, the
2-year-to-10-year portion, also inverted. So for most of 2H19, recession fears were quite prevalent
based on this indicator.
The theory behind the predictive power of an inverted curve is that as the bond market identifies the
economy meaningfully slowing, longer-term bonds will increase in demand as investors look to lock in
future yields on the expectation they will continue to fall as economic growth declines. Traders will also
seek higher-duration bonds as they will experience greater price increases as rates fall. As a result, the
balance of demand will cause longer-term bond yields to fall below short-term yields.
123-MONTH AND 10-YEAR U.S. TREASURY YIELDS
Yield Curve Recovery from Inversion
2.25%
2.00%
1.94% 1.92%
1.75%
1.56%
1.50%
Fed 1.46% Fed Fed
Rate Cut Rate Cut Rate Cut
7/31 9/18 10/30
1.25%
7/31
8/31
9/30
10/31
11/30
12/31
3-Month U.S. Treasury 10-Year U.S. Treasury
Source: Bloomberg
One might say inverted yield curves have been accurate almost to a fault in that they have correctly forecast
seven of the past five recessions. In other words, pretty much all modern-day recessions have been preceded
by inverted yield curves, but not all inverted yield curves have been proceeded by recessions. Most would
argue inverted curves correctly warned the market about upcoming recessions in 1980, 1981, 1990, 2001,
and 2008. However, in our opinion, strong arguments can be made that false alarms were flashed by inverted
curves in 1998 and 2005.
For more than any other reason, we believe the inverted curve of this past year occurred due to historically
anomalous negative yields in other regions of the world that, in our opinion, bordered on bizarre and absurd.
At times during the past year, more than $15 trillion of sovereign debt throughout the globe was providing
negative yields to investors. This included 10-year rates in Japan that fell in early September to as low as
-0.28% and in Germany of -0.70%. In Europe alone, four countries (Germany, France, Netherlands, and
Switzerland) have sported negative 10-year yields over the past 12 months. So in our opinion, capital was likely
flocking into the U.S. Treasury market where yields, on a comparative basis, looked high. And this created a
historically strong demand for longer-term U.S. bonds, which in turn suppressed yields and inverted the curve
for reasons unrelated to the economy.
132- AND 10-YEAR U.S. TREASURY YIELDS
Yield Curve Recovery from Inversion
2.13%
2.00%
1.92%
1.88%
1.75%
1.52% 1.63%
1.63%
1.50%
1.47%
1.38%
1.25%
7/31
8/31
9/30
10/31
11/30
12/31
2-Year U.S. Treasury 10-Year U.S. Treasury
Source: Bloomberg
Nonetheless, we applaud the Fed for its swift action in reducing rates in 2H19 and helping the
yield curve to dis-invert and reclaim a positive slope. In doing so, the Fed helped allay fears
of a recession and took one more argument away from the economic bears. While we were
vocal throughout the year that the inverted curve was due to negative overseas rates and not
related to economic forecasting (April 3, 2019 – “Inverted Yield Curve Not Flashing Recession
Warning”), it is a whole lot easier for investors to refer to a positive slope rather than research
the rationale of a negative one. As of December 16, the slope of the 3-month-to-10-year curve
was +0.28% (1.59% to 1.87%) and the 2-year-to-10-year +0.24% (1.63% to 1.87%).
In summary, we believe the U.S. economy most likely can achieve overall growth of 2% or
better in 2020, which should prove to be a favorable environment for the equity and credit
markets. Major points of emphasis will surround continued trade progress between the U.S.
and China beyond the recent Phase One agreement and the related impact of any increased
corporate capital spending and investment. If these come to fruition, there could be upside to
the mid-2% range.
THE U.S. ECONOMY: WHERE WE STAND
• We believe the U.S. economy is capable of 2% or better growth in the year ahead, providing
a favorable backdrop for the stock and credit markets.
• We do not see a material risk of recession in the year ahead.
• The Fed has already done its job by reducing rates in 2H19, providing for a lower-rate
environment while also dis-inverting the yield curve.
• Consumer spending will likely remain solid and continue to support economic growth.
• Continued progress in U.S.-China trade relations could be the impetus for a reversal in
corporate capital spending trends.
• Benign rates of inflation should also help the economy in 2020.
• Continued strength in the labor market, both in terms of job numbers and wage growth,
allows for an important buffer against a downturn.
14U.S. STOCKS
We believe U.S. stocks remain well positioned for the year ahead as
the economic and market backdrop could be reflecting a potential
“Goldilocks” environment in 2020. This would consist of positive
economic growth, mild inflation, low interest rates, and rising
corporate earnings growth. We view a realistic year-end 2020
target on the S&P 500 to be 3,600.
Stocks enter the New Year with major indices at or near record highs, despite what continues to be a good
degree of skepticism as to whether or not they deserve to be there. Given the impressive move stocks have had
in the past year, combined with the numerous concerns that have been continuously expressed by market bears
along the way, many wonder if we are being set up for falling equity prices in the year ahead.
No, we do not believe so. Going into 2020, there is, in our opinion, a lot to like about the U.S. stock market,
perhaps beginning with the fact there is a lot about this market many do not like. This is evident in the investor
exodus of equity mutual funds that has totaled $135 billion in net outflows through the end of November.
The bear arguments likely driving individual investors away from stocks over this past year have ranged
from record-high index prices to the trade hostilities between the U.S. and China, to earnings uncertainty, to
election mayhem and, of course, the relentless drumbeat of a pending recession. However, as we have said
before, markets climb a wall of worry, and while there is not as much worry as a year ago, there remains plenty
worthy of a climb. While we view these market concerns as legitimate, we believe there is a stronger set of
circumstances on the more-favorable side, setting up stocks for what could be a good year. By good, we would
mean potential double-digit total returns. Our 2020 year-end target on the S&P 500 is 3,600.
For those instinctively concerned that the equity markets may be prone to a down year following the strong
returns of this past one, it is interesting to note that history tells a bit of a different story. When looking at the
post World War II era beginning in 1946, there have been 26 years in which the S&P 500 posted total returns of
20% or better, and in 20 of those cases the index went on to book a positive gain in the following year with an
average total return of +13%. In aggregate, returns ranged from -9% in 2000 to +33% in 1997. So all else being
equal, history certainly is not flashing a sell signal here, in fact quite the opposite.
15HISTORICAL LOOK AT MARKET PERFORMANCE IN YEARS FOLLOWING 20% GAINS
IN THE S&P 500
(1946 - 2018)
+33.3%
+18.8%
77% +13.0%
-6.2%
23% -9.1%
20 Positive 6 Negative Average Average “Up” Average “Down” Best Year Worst Year
Years Years Calendar Year Year Year (1997) (2000)
From 1946 to 2018, calendar year total return on the S&P 500 was greater than 20% twenty-six times: 1949, 1950, 1951, 1954, 1955, 1958, 1961, 1963, 1967, 1975, 1976, 1980,
1982, 1983, 1985, 1989, 1991, 1995, 1996, 1997, 1998, 1999, 2003, 2009, 2013, and 2017.
Source: Bloomberg
What we see as the most enticing characteristics for stocks is a market backdrop comprised of
several individual factors. No single one of them in and of itself is a slam dunk argument to own
stocks, but in combination, they present one of the more attractive settings we have seen in
recent years. These all play into what we have identified over the past year as the
“Goldilocks” scenario.
This begins with an economy running not too hot or too cold and one that is performing well
above levels creating recessionary concerns. A Federal Reserve that has created a lower-
rate environment and is now prepared to step aside and let that run its course. Inflation that
remains below levels of concern, and corporate earnings growth that appears ready to rise
versus this past year. When tying these all together, 2020 is starting to look like it could be a
multi-singles baseball inning producing at least a few runs.
No question, there are risks and uncertainties present in the market that could derail this
favorable-looking path. Here we would rank the ongoing U.S.-China trade soap opera and the
upcoming elections at the top of the list. However, in totality, we would categorize stocks as
better positioned to benefit from the good than falter from the not so good.
ECONOMIC PICTURE LOOKS TO BE A TAILWIND
All considered, we would view 2% GDP growth in the U.S. economy as more than a favorable
backdrop for stocks. Under such a scenario, we believe U.S. equities are likely to see a tangible
pickup in corporate profits growth, which at most current valuations would translate into total
returns at least in line with earnings growth.
Immediately following the Fed’s first rate cut last July, we stated that the market was likely
positioned extremely well for what we referred to as a “2 and 2” environment (proper credit for
that term going to 1980s game show host, Chuck Woolery), meaning the combination of 2%
economic growth with two more 0.25% rate cuts from what was then a 2.00–2.25% Fed Funds
rate. We have since seen those two rate cuts. The market has reacted well, and should we see
2% growth in the year ahead, we believe it will continue to do so.
16GDP GROWTH AND FED FUNDS RATE
Fed Cuts Rates to “Preserve the Expansion”
3.5%
3.0%
2.50%
2.5%
2.25%
2.00%
2.0%
1.75%
1.5%
3.1% 2.0% 2.1% 2.0%
1.0%
0.5%
0.0%
1Q19 2Q19 3Q19 4Q19*
GDP % Q/Q SAAR Fed Funds Rate
Source: Bureau of Economic Analysis, Federal Reserve Bank of Atlanta
* Federal Reserve Bank of Atlanta GDPNow Estimate
In particular, we view continued strength in consumer spending as an ongoing catalyst for
stocks. The consumer has proven to be the most resilient player in the economy over the past
year and, given the lower rate environment as well as consistent growth in the job market and
higher wages, all of this could bode quite well for stocks in 2020. Healthy consumer spending
should be compatible with healthy equity markets.
RETAIL SALES AND THE S&P 500
Healthy Consumer and Healthy Markets (2016-2019)
7.0% 3,400
6.0% 3,200
3,154
5.0% 3,000
4.0% 2,800
3.3%
3.0% 2,600
2.0% 2,400
1.0% 2,200
0.0% 2,000
11/16
2/17
5/17
8/17
11/17
2/18
5/18
8/18
11/18
2/19
5/19
8/19
11/19
Retail Sales % Y/Y S&P 500 (RH)
Source: Census Bureau, Bloomberg
As mentioned earlier, we believe there could be pent up demand in corporate capital spending
programs, which, if unleashed, would also be favorable for equities. Of course the primary
culprit behind the recent glut within capital spending has been the U.S.-China trade dispute and
its seemingly unending tariff fatigue meaning we could be at an inflection point here as well
following the Phase One trade agreement. Under this improving scenario, corporate spending
could come off the sidelines in 2020, which should also be favorable for stocks.
17U.S. NONRESIDENTIAL FIXED INVESTMENT AND S&P 500 EARNINGS GROWTH
30%
28.5%
27.4%
27%
24%
22.0%
21%
18%
15.5%
15.3%
15%
12%
9%
8.4% 8.8%
6% 7.9%
3% 4.8% 4.4%
1.5%
2.1% -0.4%
0%
-2.7%
-1.0%
-3%
4Q17 1Q18 2Q18 3Q18 4Q18 1Q19 2Q19 3Q19
Nonresidential Fixed Investment Q/Q SAAR S&P 500 EPS Growth Y/Y
Source: Bureau of Economic Analysis, Bloomberg
THE UNLIKELY ALLY — INTEREST RATES
A year ago at this time, the rising tide of Fed tightening and higher interest rates appeared to
be public enemy No. 1 for the stock market. However, beginning this past May, when it became
evident that a U.S.-China trade deal had fallen into limbo and most of the feared tariffs would
actually go into practice, the Fed and the markets quickly reconciled like a couple of long lost
friends and have been ever so chummy since. It was almost as if once the market fell into
danger of real peril, the Fed arrived on the scene like Tom Brady in the final two minutes of the
Super Bowl. Perhaps with a little less bravado, of course.
All comparisons aside, the favorable environment the Fed has helped to create for stocks is
extremely meaningful. In addition to dialing down the recession fears and further enhancing
consumer discretionary income, the lower rates will continue to have a favorable impact on
equity valuations. While many choose to look at equity valuations purely from a price-earnings
perspective, often not fully accounting for earnings growth or the interest rate environment,
we feel it is imperative to include both when judging stocks on the cheap-versus-
expensive spectrum.
18MARKETS REACT TO FED EASING
S&P 500, Dow Jones, NASDAQ, & Fed Funds Rate
22%
20% 20.0%
2.50%
18% 17.8%
16% 15.9%
14%
2.25%
12%
10%
8% 2.00%
6%
4% 1.75%
2%
0%
-2%
5/31
6/30
7/31
8/31
9/30
10/31
11/30
12/31
S&P 500 DJIA NASDAQ Fed Funds Rate
Source: Bloomberg
BENIGN INFLATION ALSO A FRIEND TO STOCKS
We also believe inflation rates will remain nonthreatening in the year ahead. Even in the event the CPI
or PCE Price Index were to rise above 2% for a sustained period of time, we feel stocks could likely
tolerate such an environment, assuming the pace was not meteoric and the 3% level was not breached.
However, even this scenario seems far-fetched to us, as the long stagnation in wage growth that we
are now escaping still seems manageable to most corporations, and the continued disintermediation of
product distribution via technology appears to be breaking down traditional assumptions that inflation
will rise in a tightening job market. As Judge Smails said to young Danny Noonan as he approached his
final putt in the movie, Caddyshack, “Well, we’re waiting.” The waiting on higher inflation continues,
and we believe the wait will extend through 2020 at least.
STILL WAITING ON HIGHER RATES OF INFLATION
Personal Consumption Expenditures Trending Below 2%
3.0%
2.5%
2.0%
1.6%
1.5%
1.5%
1.0%
0.5%
0.0%
2/15
5/15
8/15
11/15
2/16
5/16
8/16
11/16
2/17
5/17
8/17
11/17
2/18
5/18
8/18
11/18
2/19
5/19
8/19
11/19
PCE Price Index % Y/Y Core PCE Price Index (ex. Food and Energy) % Y/Y
Source: Bureau of Economic Analysis
19Remaining near or below 2% inflation should continue to benefit stocks. It will help their
earnings profiles as companies worry less about passing on inordinate labor, cost of goods, or
service expenses to their customers. It will help to preserve the relative value of their earnings
streams and keep the Fed at bay from raising rates. We classify it as an expected favorable
attribute for the equity markets in the year ahead.
EARNINGS GROWTH IN 2020 — WHERE THE RUBBER HITS THE ROAD
As the curtain closes on 2019, there is little doubt earnings growth will post its toughest
year since 2015 as, depending on 4Q results, we will likely see profit increases on underlying
S&P 500 companies potentially finishing with flat-to-even, perhaps-slightly negative rates of
earnings growth for the year. Combined with probably only about 3% revenue growth, these
numbers cast a shadow on expected corporate earnings growth in 2020 that is at the root of
whether or not stocks in the year ahead will earn their keep within investor portfolios. This
concern about earnings growth has been exacerbated by the 3Q19 earnings season, which
marked the first time since 4Q15 through 2Q16 that the S&P 500 reported three consecutive
quarters of year-over-year profit declines.
As this pertains to the year ahead, consensus earnings estimates seem to be settling in at
about the 10% range for S&P 500. However, the overriding sentiment at this time is those
forecasts are too high and will shake out closer to low single digits or even flat to negative. This
seems to be almost a foregone conclusion in some corners of market punditry, but we disagree.
In fact, we believe under the right circumstances 10% earnings growth on the S&P 500 could
be achievable, and mid-to-high single-digit growth a strong probability. If this type of earnings
growth is achieved in 2020, we believe the market reaction should be favorable.
Reasons why we believe corporate earnings can challenge double digits and therefore provide
for total returns of at least that amount include:
Earnings comparisons will be favorable in 2020. Just as 2019 suffered from extremely
difficult year-over-year earnings comparisons, 2020 looks to benefit from fairly easy ones. This
past year was a challenging one from an earnings comparison perspective as strong profits
growth in 2018 combined with a one-time boost from lower tax rates made for a tough act to
follow in 2019. Now with annual comparisons versus a flat to negative year, it will be easier for
companies to post positive growth in 2020.
Higher levels of capital spending. Thawing U.S.-China trade hostilities could translate into
higher corporate capital spending and investment. Should such higher levels of capital spending
emerge as a result of the recent trade détente, this could show up in widespread higher profits
throughout the year. If consumer spending also remains strong, as we believe it will, the add-on
of corporate investment should provide a strong combination, favorably impacting revenues
and margins.
Reversal of margin erosion. Over the past year, bottom line profits grew less than top line
revenues as net margins on S&P 500 companies declined approximately 0.80%, from more
than 12% to about 11.2%. Revenue estimates for the S&P 500 in 2020 currently stand at about
5%–6%, meaning unless margins erode more, which we do not believe they will, earnings
growth would be at least that amount. If margins can rebound, earnings should once again
show higher growth than revenues, making earnings growth more likely.
Nothing quite like low expectations. Given the difficult earnings results of 2019, expectations
are quite low for 2020, and that’s where opportunity could reside. In our opinion, 6% organic
earnings growth combined with stock buybacks and a dividend is a recipe for double-digit
total returns.
We feel the earnings environment for stocks in 2020 could be more advantageous than most
are willing to believe at this point. While the first half of 2020 will prove critical in identifying
potential improving trends, we believe there could also be some probability of rising price-
earnings multiples throughout the year as well.
20CORPORATE EARNINGS LOOK TO RISE IN 2020
S&P 500 Year-over-Year EPS Growth
11%
10.0%
10%
9%
8%
7%
6%
5%
4.0%
4%
3%
2% 1.5%
1.0%
1%
0%
-1% -0.4%
1Q19 2Q19 3Q19 4Q19* 2020*
Source: Bloomberg
VALUATIONS REMAIN REASONABLE
Stocks for the most part enter 2020, in our opinion, reasonably to attractively valued, given
a combination of existing price-earnings multiples, expected earnings growth, and current
interest rates. The S&P 500 is presently carrying a 19.6x price-earnings on estimated 2019
earnings (as of December 20, 2019) and 17.8x estimated 2020 earnings. While this may appear
expensive by some historical measures, we believe investors also need to take into account
current market interest rates and their comparison to stock dividend yields. In this regard, the
S&P 500 currently maintains a dividend yield of about 1.80%, which closely compares to the
10-year Treasury rate of 1.92%. This, in our opinion, should help provide downside protection in
volatile markets.
S&P 500 PRICE TO 2019 EARNINGS AND PRICE TO 2020 EARNINGS
21x
20x
19.6x
19x
18x 17.8x
17x
16x
15x
14x
13x
12x
1/2
2/2
3/2
4/2
5/2
6/2
7/2
8/2
9/2
10/2
11/2
12/2
S&P 500 Price vs. 2019 EPS S&P 500 Price vs. 2020 EPS
Source: Bloomberg
21S&P 500 DIVIDEND YIELD VS. 10-YEAR U.S. TREASURY YIELD
3.00%
2.75%
2.75%
2.50%
2.25%
2.07%
2.0%
2.00%
1.92%
2.1%
1.8%
1.75%
1.50%
1.25%
12/31
1/31
2/28
3/31
4/30
5/31
6/30
7/31
8/31
9/30
10/31
11/30
12/31
S&P 500 Dividend Yield 10-Year U.S. Treasury Yield
Source: Bloomberg
The Fed has also provided valuation ammo in the 0.75% of Fed Funds rate reductions which
we believe will continue to filter through the market in 2020. This can be seen in one of our
favorite back-of-the-envelope-but-still-historically valid metrics, the equity risk premium, which
subtracts the current long-term, risk-free rate (10-year bond yield) from recent 12-month stock
earnings yields. Given the 0.82% drop in the 10-year yield amid a relatively flat environment
for corporate profits in the past year, this premium (as of December 15, 2019) stands at
approximately 2.8%. History shows this most likely means an increased probability of better-
than-historically average annualized returns for the S&P 500 over the next three years. With
earnings growth potentially increasing toward double digits in 2020, we believe the longer
term criteria and catalysts cited above bode such an event would likely provide meaningful
opportunities for stock investors.
EQUITY RISK PREMIUM
Stocks still priced attractive by historical standards based on earnings and interest rates
40%
12/19/19 ERP: 2.76%
Subsequent 3-Year Annualized Return
30%
20%
S&P 500 Earnings Yield 4.68%
Minus 10-Year U.S. Treasury Yield 1.92%
Equity Risk Premium 2.76% 10%
As of 12/19/2019
0%
-10%
-20%
-6% -5% -4% -3% -2% -1% 0% 1% 2% 3% 4% 5% 6% 7%
Equity Risk Premium
Source: Bloomberg
22ASSESSING RECENT GEOPOLITICAL RISK
The early days of 2020 have also seen some increasing geopolitical risk for stocks, as conflict
between the U.S. and Iran ratcheted up following the tactical strike on Iran’s General Qasem
Soleimani. This action then led to retaliation by Iran in the form of non-casualty-related
missile attacks on military bases in Iraq housing U.S. forces. We view this initial back and forth
of surgical military engagement as relatively limited at this point in time, and if no further
escalation results, the market impact will likely be muted. While this is clearly a risk investors
should follow in the year ahead, we would view the probability of direct or wide-scale military
engagement with Iran during the year ahead as remote.
Finally, we would be remiss in not reminding equity investors to be prepared for short-term
volatility in the year ahead and perhaps in the early months, as we could see some profit
taking following the exceptionally strong year that has just concluded. Under such a potential
scenario, perhaps even one of a full-fledged market correction, we believe the longer term
criteria and catalysts cited above bode such an event would likely provide meaningful
opportunities for stock investors.
U.S. STOCKS — WHERE WE STAND
• We believe U.S. stocks are poised for a good year in 2020, as our year-end target for the
S&P 500 is 3,600.
• Economic tailwinds will likely include 2% or better GDP growth, continued low
unemployment and inflation, as well as higher wages favorably impacting
consumer spending.
• Corporate earnings growth is likely to accelerate and could challenge double digits, which
would be above most expectations.
• Continued trade progress with China would also be positive for stocks, as this could
meaningfully boost investor psychology and move capital spending off the sidelines.
• The recent rate cuts by the Fed should favorably filter through the markets in terms of
consumer behavior, investor confidence, and overall equity valuations.
• We view overall valuation levels as reasonable given the prospect of rising earnings growth
and the lower interest rate environment now in place.
• Given the strong rise in stocks over the past year, we would not be surprised to see some
short-term volatility, perhaps based on profit taking, sometime in 1H20, but would likely
view such a development as an opportunity for equity investors.
23INTEREST RATES
We believe the Fed has more than done its job for the year ahead
by enacting three rate cuts in 2H19 and in the process helping to
return the Treasury yield curve to a positive slope. As a result,
the Fed is likely to remain on the sidelines over the next year and
bond investors will likely be well positioned toward the short end
of the curve.
GRACE UNDER FIREWORKS
In recent years there have been a lot of fireworks at the Federal Reserve, both incoming and
outgoing. So it is ironic that in 2020, a year in which fireworks are destined to light up the sky
on a lot of fronts — perhaps most of them political in nature — the Fed is likely to be on the
sidelines for most of it. Maybe with a front row seat, but still on the sidelines.
FED FUNDS TARGET RATE
Up and Down since 2016
3.00%
2.75%
Target Range
2.50%
2.25%–2.50%
2.25%
2.00%
1.75%
Target Range
1.50%
1.50%–1.75%
1.25%
1.00%
0.75%
0.50%
0.25%
0.00%
9/16
12/16
3/17
6/17
9/17
12/17
3/18
6/18
9/18
12/18
3/19
6/19
9/19
12/19
Fed Funds Target Rate Upper Bound
Source: Bloomberg
The Fed had a drama-filled year in 2019, not only because of criticism from the president,
but also due to its own stunning reversal in policy. Beginning with the release of the January
minutes, it was apparent the Fed had hit the pause button on raising rates and would be on
hold for at least the first half of the year. The term for this was “patience.” However, by the time
Memorial Day rolled around and the U.S.-China trade dispute was heading into a trade war,
that patience turned to accommodation, and Chairman Jay Powell’s now famous phrase, “we
will act as necessary to preserve the expansion,” was a signal rate cuts were on the horizon.
24FED FUNDS TARGET RATE
2.75%
“Patient”
2.50%
“Dovish”
2.25%
2.00%
1.75%
Target Range
1.50%–1.75%
1.50%
1.25%
1.00%
12/18
1/19
2/19
3/19
4/19
5/19
6/19
7/19
8/19
9/19
10/19
11/19
12/19
Fed Funds Target Rate Upper Bound
Source: Bloomberg
However by August, the Treasury bond yield curve had inverted, with long-term rates moving
lower than short-term rates, setting off recession warning alarms throughout the investment
world and financial media. While we believed the inversion to have been more the result of
negative interest rates overseas suppressing long-term U.S. rates, we also thought this was
a predicament the Fed needed to correct in short order. In response, the Fed quickly enacted
three 0.25% rate cuts between July and October, which quelled a good bit of the recession
fears and realigned the yield curve back to a positive slope. So kudos to Chairman Powell and
team for taking action amid the fireworks of this past year.
STAKING A POSITION ON THE SIDELINES
We feel the Fed has done its job ahead of time for 2020. Recognizing its overall misjudgment
from a year ago (if not fully admitting it), Chairman Powell and crew were quick to change
perspective and ultimately policy in nullifying three of the Fed’s four 2018 rate hikes and, in the
process, reversing an inverted yield curve. So think of the Fed as a starting pitcher that has put
in about six or seven innings of solid pitching and can now watch from the dugout. Except unlike
that starting pitcher, the Fed can get back in the game if it has to.
3-MONTH AND 10-YEAR U.S. TREASURY YIELDS
Yield Curve dis-inverts after rate cuts
2.25%
2.00%
1.92%
1.94%
1.75%
1.56%
1.50%
Fed 1.46% Fed Fed
Rate Cut Rate Cut Rate Cut
7/31 9/18 10/30
1.25%
7/31
8/31
9/30
10/31
11/30
12/31
3-Month U.S. Treasury 10-Year U.S. Treasury
Source: Bloomberg 25Minutes released from the October Fed Meeting, in which the Committee reduced the Fed
Funds rate to a target range of 1.50%–1.75%, seem to indicate the Fed may indeed be pulling
up some lawn chairs. In addition to two dissenting votes not to cut rates, discussions appeared
solidly framed around the notion that policy was where it needed to be and would require,
“material changes to be changed.” Other summary dialogue included, “the stance of policy
would likely remain where it is, as long as incoming information about the economy did not
result in a material reassessment of the economic outlook,” and, “further easing is unlikely in
the near term unless incoming data was consistent with a significant slowdown in the pace of
economic activity.” In the world of Fed speak, this is about as definitive as it gets, bearing in
mind of course it’s a very non-definitive science.
This position was more than reiterated at the Fed’s December meeting when the Committee
unanimously decided to leave the Fed Fuds rate unchanged at a target range of 1.50%–1.75%.
Furthermore, signaling through the “dot plot” of Fed member market expectations also
confirmed 2020 will be a quiet year for them, as consensus forecasts of the Committee
represent no action in the year ahead. Specific language from the statement included, “the
Committee judges that the current stance of monetary policy is appropriate to support
sustained expansion of economic activity, strong labor market conditions, and inflation near
the Committee’s symmetric 2% objective.” In our opinion, this wording as well as the overall
statement was consistent with the minutes from October.
To us, the message in all of this is pretty clear. It will take a real downturn in economic data
or upshot of inflation for the Fed to act in either direction, both of which we would view as
low-probability events in 2020. Chairman Powell in his post July press conference referred
to the rate reductions as a “mid-cycle adjustment,” while we summarized it at the time as a
“mini-easing cycle.” Regardless of the term, it has now passed and one can look back at these
three rate cuts as perhaps insurance against the economy turning south from worsening trade
relations with China or potentially slowing global growth finding its way into the U.S. However,
as we know, taking out insurance represents anticipatory risk of the unknown. The Fed has now
addressed this with its three rate reductions. From here, we believe further rate cuts will need
to be driven by real-time data.
INTERNATIONAL NEGATIVITY
So here is a question for the ages: Who would lend $1,000 without receiving interest and in the
process receive a guarantee of only getting back $950 in 10 years? (Not a trick question). The
answer is millions of people living in Japan and Europe.
The craze of negative interest rates hit almost a fever pitch during 2019 when, at its peak,
more than $17 trillion of sovereign debt was priced by the markets with less than a zero yield to
investors. To put this in practical terms, if you bought a $1,000 bond in Germany last summer,
locking in an interest rate of -0.70% (that’s negative zero-point-seven percent), you would have
been guaranteed to receive only $930 in 10 years. Despite the absurdity of this proposition,
multitudes of bond buyers, including large institutions and pension funds, accepted this money-
losing proposition with open arms.
26You can also read