Stability Programme Update 2019 - APRIL 2019 Incorporating the Department of Finance's Spring Forecasts - European Commission
←
→
Page content transcription
If your browser does not render page correctly, please read the page content below

Stability Programme Update 2019
Incorporating the Department of Finance’s Spring Forecasts

APRIL 2019

Prepared by the Economics Division,

Department of Finance

www.gov.ie/finance

Ireland’s Stability Programme
                April 2019 Update
Incorporating the Department of Finance’s Spring Forecasts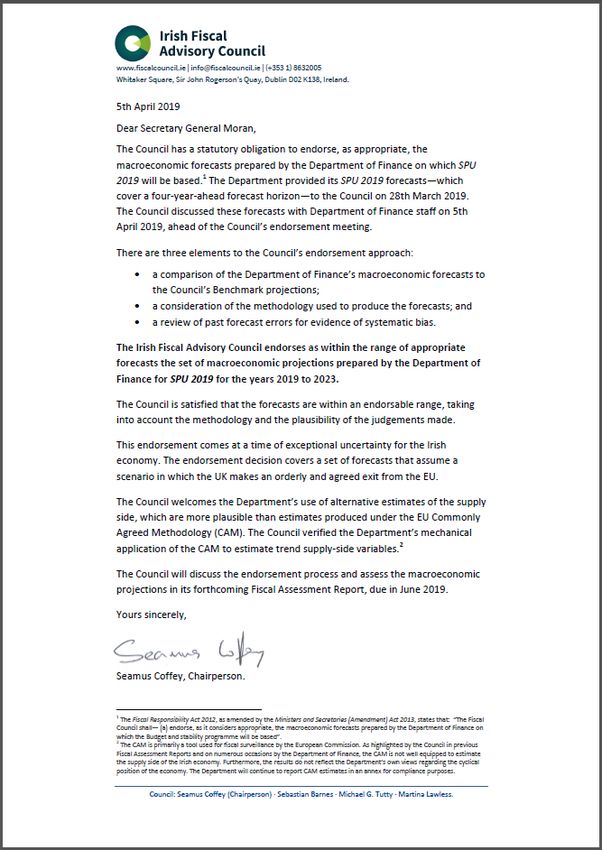
Foreword

This update of Ireland’s Stability Programme takes account of Budget 2019 and other
Government initiatives. It is Ireland’s national medium-term fiscal plan and includes an update of
the economic and fiscal outlook (the Department of Finance’s spring forecasts).1 This document
was submitted to the European Commission on 29th April 2019 in accordance with the
requirements of the European Semester.

It was presented in draft form to Dáil Éireann on 16th April prior to submission to the European
Commission.

The document incorporates horizontal guidance provided by the European Council to Member
States in March 2019 as part of the discussions on the European Semester (the annual cycle of
economic monitoring and policy guidance in the European Union). It has been prepared in line
with the May 2017 guidelines on the format and content of Stability and Convergence
Programmes.

This document should be read in conjunction with Ireland’s National Reform Programme (NRP)
2019, which sets out policies being advanced in response to challenges identified by the
European Commission in its Country Report on Ireland, and which reports on progress towards
Europe 2020 strategy targets.

The macroeconomic analysis and forecasts contained in this document are based on data
available to end-March 2019.            The fiscal projections are based on data to mid-April.                   The
macroeconomic forecasts were endorsed by the Irish Fiscal Advisory Council on 5 April 2019.2       th

The Department of Finance macroeconomic and fiscal forecasts are presented on an ex-post
basis, i.e. incorporating, in so far as is possible, the fiscal measures set out in Budget 2019 over
the medium-term.

1
  The Department publishes two sets of macroeconomic and budgetary forecasts each year:
     -   Department of Finance Spring Forecasts (contained in the Stability Programme Update), April;
     -   Department of Finance Autumn Forecasts (contained in the Budget), October.
Both sets of forecasts cover a five-year horizon; in the Spring forecasts, this implies a forecast for the current
year and the following four years while, in the Autumn forecasts, this implies a forecast for the following five years
given that the in-year figure for the current year is based on (mainly) outturn data.
2
    The powerpoint presentation provided to the IFAC is available on the Department’s website:
https://www.gov.ie/en/publication/a8a789-presentation-to-ifac-stability-programme-2019-update/

Department of Finance | Stability Programme Update 2019                                                       Page | i
Contents
Page
Foreword i
1 Overview and General Policy Strategy 1
1.1 Policy strategy 1
1.2 Short-term economic and budgetary outlook 2
2 Economic Outlook 4
2.1 Summary 4
2.2 Macroeconomic outturn 2018 4
2.3 Macroeconomic projections 2019 6
2.4 Balance of payments 13
2.5 The labour market 14
2.6 Price developments 15
2.7 Medium-term growth prospects 2019 to 2023 16
2.8 Comparison of forecasts 19
3 Exchequer Developments and Outlook 21
3.1 Summary 21
3.2 Fiscal outturn 2018 21
3.3 Fiscal outlook 2019 21
3.4 Fiscal outlook 2020-2023 24
4 General Government Developments and Outlook 28
4.1 Summary 28
4.2 General government balance in 2019 28
4.3 General government balance in 2020 28
4.4 Structural budget balance 29
4.5 Comparison of forecasts 30
5 General Government Debt 32
5.1 Summary 32
5.2 Debt developments 32
5.3 Debt composition 34
5.4 Credit ratings 36
5.5 Funding developments 36
5.6 Comparison of forecasts 37
6 Risk and Sensitivity Analysis 38
6.1 Summary 38
6.2 Risks to the economic and fiscal forecasts 38
6.3 Sensitivity analysis 40
6.4 Monitoring imbalances in the Irish economy 42
6.5 Contingent and other liabilities 46
7 Quality of Public Finances 50
7.1 Summary 50
7.2 Spending review 50
7.3 Equality budgeting pilot 51
7.4 Other reforms 51
Department of Finance | Ireland’s Stability Programme, April 2019 Update Page | ii8 Long-Term Sustainability of the Public Finances 53 8.1 Summary 53 8.2 Background 53 8.3 Long-Term budgetary prospects 54 8.4 Policy strategy 57 8.5 Conclusion 60 Tables, Figures, Boxes and Annexes Tables Table 1 Summary – main economic and fiscal variables 2 Table 2 External assumptions 6 Table 3 Macroeconomic prospects 10 Table 4 Savings, investment and the balance of payments 13 Table 5 Labour market developments 15 Table 6 Price developments 15 Table 7 Range of forecasts 19 Table 8 Budgetary projections 2018-2023 26 Table 9 Alternative presentation of exchequer position 27 Table 10 Exchequer balance to GGB 2018-2023 29 Table 11 Structural budget balance 30 Table 12 Comparison of budgetary forecasts 31 Table 13 General government debt developments 34 Table 14 Gross and net general government debt 35 Table 15 Irish sovereign credit ratings 36 Table 16 Sensitivity analysis, relative to baseline 41 Table 17 Exchequer Spending: 2009-2018: Plans v Outturns 44 Table 18 Real-time v Current Estimates of the Structural Balance 2003-2017 44 Table 19 Heat-map of Macroeconomic Indicators, 2002-2019 45 Table 20 Contingent liabilities 46 Table 21 Macro-economic risk assessment matrix 48 Table 22 Fiscal risk assessment matrix 49 Table 23 Long-term spending projections, per cent of GDP 55 Table 24 Long-term spending projections, per cent of GNI* 56 Table A1 Difference between Exchequer balance and general government balance 62 Table A2 General government balance 2018-2023 63 Table A3 Comparison of vintages of receipts and expenditures for 2018 64 Table A4 General government interest expenditure 2018-2023 65 Table A5 Projected movement in general government debt 2018-2023 65 Table A6 Breakdown of revenue 65 Table A7 Expenditure developments 66 Table A8 Budgetary plans 66 Table A9 Macro-economic aggregates 2018 to 2023 67 Table A10 Exchequer & general government aggregates, 2018-2023 68 Table A11 Previous GDP forecasts endorsed by the Irish Fiscal Advisory Council 69 Table A12 Previous general government balance forecasts 69 Department of Finance | Ireland’s Stability Programme, April 2019 Update Page | iii
Figures3
Figure 1       Change in external assumptions relative to autumn forecasts                                     7
Figure 2       Employment and the Phillips curve                                                              14
Figure 3       Contributions to changes in GDP and modified domestic demand                                   18
Figure 4       Comparison of autumn 2018 and spring 2019 GDP forecast                                         20
Figure 5       End-March cumulative tax receipts relative to profile                                          22
Figure 6       Comparison of autumn 2018 and spring 2019 GG balance forecast                                  31
Figure 7       General government debt-to-GDP and debt-to-GNI*                                                32
Figure 8       Debt interest to revenue ratio                                                                 33
Figure 9       Composition of general government debt at end 2018                                             35
Figure 10      Maturity profile of long-term marketable and official debt                                     36
Figure 11      Comparison of autumn and spring 2019 debt forecast                                             37
Figure 12      Confidence bands for real GDP growth, 2018-2019                                                38
Figure 13      Population aged 15 and over by age group                                                       54
Figure 14      State pension expenditure under selected scenarios                                             57

Boxes
Box 1          The yield curve in the US – information content                                                 8
Box 2          Possibility of a disorderly Brexit                                                             11
Box 3          Underlying measures of economic activity                                                       12
Box 4          Residential property prices                                                                    16
Box 5          Brexit through the prism of the euro-sterling bilateral exchange rate                          39
Box 6          Fiscal Heat Maps                                                                               43

Annexes
Annex 1        Additional fiscal statistics and tables                                                        62
Annex 2        Macro-economic and fiscal aggregates 2018 to 2023                                              67
Annex 3        Ireland’s National Reform Programme: summary of progress                                       70
Annex 4        Irish Fiscal Advisory Council Endorsement Letter                                               71

 3
  In line with the Governments Open Data Initiative the data underpinning charts in this document are available
 on the Department of Finance website.

 Department of Finance | Ireland’s Stability Programme, April 2019 Update                                Page | iv
Chapter 1
                       Overview and General Policy Strategy

1.1      Policy Strategy

The Irish economy is in an unusual position at present, juxta-positioned between possible domestic
overheating and capacity constraints on the one hand, and a slowdown in key export markets on the
                                                 4
other. Moreover, the UK’s forthcoming exit from the European Union casts a shadow over future
prospects. Charting a course through the next couple of years will be challenging for the Government
but, importantly, it is a challenge being met from a position of strength.

Provisional figures show that GDP increased by 6.7 per cent last year, with modified (final) domestic
demand (MDD) – a better measure of underlying economic activity in Ireland – increasing by 4.5 per
cent. This healthy pace of growth continues to pay dividends in the labour market, where the number
employed last year reached the highest level ever.

After a decade-long journey, the headline budget deficit was eliminated last year. At least part of this
reflects the impact of the economic cycle so that, notwithstanding measurement issues, it is probable
that the headline balance is flattering the underlying budgetary position.                This highlights the
importance of implementing prudent budgetary policy in ‘good times’ so that policy can provide
counter-cyclical support in the event of a downturn. This is why the Government will continue to re-
build fiscal buffers and prioritise stability-oriented budgetary policies.

The establishment of the Rainy Day Fund is an additional policy measure that the Government has
adopted. The Government is also acutely aware that the ratio of debt-to-national income (where
income is approximated by modified Gross National Income) is too high, at over 100 per cent.
Maintaining this ratio on a downward trajectory is a key priority for Government.

The UK’s exit from the European Union will impose significant costs on the Irish economy, involving
lost output and employment (relative to a hypothetical no-exit scenario). The question of how costly
depends crucially on the exact form that exit takes, i.e. orderly or disorderly. While the ratification of
the withdrawal agreement remains the Government’s preferred outcome, it is not possible to assign
an exact probability to the different forms of UK exit at present.                In recognition of this, the
Government’s broad strategy has been to assume an orderly exit but, simultaneously, to plan for a
disorderly exit.

The outcome of the European Council in April means that an ‘orderly exit’ remains the central
scenario underpinning this document. At the same time, it is readily understood that a disorderly exit,
where inter alia trade between the two regions reverts to World Trade Organisation (WTO) terms,
remains a distinct possibility. From an economic perspective, this would entail a severe disruption to
Irish-UK bilateral trade, with the impact magnified by deep, often ‘just-in-time’ supply-chain linkages
and, in all likelihood, non-tariff barriers and adverse exchange rate developments. The most affected
sectors include those in the broad agri-food sector, where WTO tariffs are particularly high. Research

4                             th
 The European Council on 10 April extended the exit date until 31 October 2019 at the latest, with an earlier
exit should the Withdrawal Agreement by ratified by both parties in the meantime.

Department of Finance | Ireland’s Stability Programme, April 2019 Update                                Page | 1
undertaken jointly by the Department of Finance and the ESRI shows that the impact of a disorderly
exit would be to reduce the level of GDP by 5 percentage points (relative to baseline) over the longer
term, with adverse implications for the labour market and the public finances .
1.2 Short-term Economic and Budgetary Outlook
Since the publication of the Department’s Autumn forecasts in October, the external environment has
become somewhat less benign. From an Irish perspective, the pace of growth has slowed in key
export markets, with a loss of momentum particularly evident in both the euro area and the UK.
Reflecting the less favourable external backdrop, the short-term forecasts for the Irish economy this
year set out in this document incorporate a modest downward revision of c.¼ percentage points; GDP
is now projected to expand by 3.9 per cent this year, with a broadly similar pace of growth projected
for MDD. For next year, GDP growth is forecast at 3.3 per cent (with MDD growth of 3.3 per cent
also). The economic forecasts set out in this document have been endorsed by the Irish Fiscal
Advisory Council.
Data from the CSO show a headline general government balance of 0.0 per cent of GDP last year.
For this year, a headline surplus of 0.2 per cent of GDP is projected, taking into account the over-
performance (relative to Budget expectations) of corporation tax receipts in the final quarter of last
year, most of which is assumed to carry forward to this year.
Table 1: summary – main economic and fiscal variables, per cent change (unless stated)
2018 2019 2020 2021 2022 2023
Economic Activity
Real GDP 6.7 3.9 3.3 2.4 2.5 2.6
Real GNP 5.9 3.7 3.1 2.2 2.3 2.4
Prices
HICP 0.7 0.9 1.1 1.6 2.0 2.3
Core HICP 0.2 1.1 1.5 1.8 2.0 2.3
GDP deflator 1.5 1.5 1.7 1.7 1.6 1.6
Balance of Payments
Trade balance (per cent of GDP) 31.2 30.7 30.4 30.1 29.6 29.1
Current account (per cent of GDP) 9.1 8.4 8.0 7.5 7.0 6.3
Labour Market
Total Employment (‘000)^ 2,259 2,309 2,357 2,393 2,432 2,474
Employment 2.9 2.2 2.1 1.5 1.6 1.7
Unemployment (per cent) 5.7 5.4 5.2 5.3 5.2 5.1
Public Finances (per cent of GDP)
General government balance 0.0 0.2 0.4 0.7 1.0 1.3
Structural balance (SGP^^) -1.6 -1.1 -0.4 0.2 0.7 1.3
Structural balance (DoF^^) 0.4 0.1 -0.1 0.1 0.2 0.2
Debt ratio (year-end) 64.8 61.1 55.8 55.4 53.2 51.6
Debt ratio (per cent of GNI*)^ 107.3 101.7 93.0 92.7 89.2 86.7
Net debt position (year-end) ~ 55.8 52.8 50.3 48.8 47.1 45.5
^ forecasts for GNI* are compiled on the purely technical assumption that this variable grows in line with nominal
GNP.
^^ Structural balance generated by output gap measures based on, respectively, the Stability and Growth Pact
(SGP) methodology and the Department of Finance’s GDP-based alternative methodology.
~ net debt figures from 2019 estimated by mechanical extrapolation of assets.
Source: CSO for 2018 and Department of Finance 2019-2023.
Department of Finance | Ireland’s Stability Programme, April 2019 Update Page | 2Part of the improvement in the headline deficit in recent years undoubtedly reflects the impact on
government revenue and expenditure of the economic cycle, which appears to be at a relatively
advanced stage. When adjusted for this, the underlying balance – the so-called structural balance –
is projected at -1.1 per cent for this year, according to the methodology set out in the preventive arm
of the Stability and Growth Pact (SGP). The Government is re-stating Ireland’s medium term
(budgetary) objective as a structural deficit of 0.5 per cent of GDP.
5
More tailored indicators suggest a different position in the economic cycle for Ireland. For instance,
estimates generated using more bespoke methods preferred by the Department of Finance point to
an economy that is broadly in balance at this point. On this basis, the structural deficit for this year
would be eliminated.
The debt-to-GDP ratio is projected at 61.1 per cent of GDP for this year, closing in on the 60 per cent
6
threshold set out in the Treaty. As highlighted previously, the debt-to-GDP ratio paints an overly
benign picture of public indebtedness in Ireland inter alia given the exceptional nominal growth rate of
GDP recorded in 2015. Other metrics – such as debt interest payments as a share of revenue or the
7
ratio of debt-to-modified GNI – show that, while declining, public indebtedness remains high in
Ireland (the ratio of debt-to-GNI* is projected at 102.2 per cent for this year). This highlights the
importance of the Government’s strategy of implementing prudent budgetary policies designed to
further reduce the elevated burden of public debt.
Net public indebtedness in Ireland – that is the general government sector’s financial liabilities less its
financial assets – is forecast at 53.1 per cent of GDP for this year. This takes into account
accumulated financial assets amounting to around 8.3 per cent of GDP at year-end.
The figure does not, however, take into account the State’s remaining assets in the domestic banks.
It is Government policy that any receipts from the disposal of banking assets and the winding down of
NAMA will be used to reduce public indebtedness. The rationale for this is simple: the collapse of the
banking system resulted in a massive increase in public indebtedness; accordingly, the repair of the
banking system must be used to reduce this indebtedness. As these receipts are realised over time,
8
the outstanding amount of both gross and net debt will decline.
In terms of fiscal strategy, estimates set out in this document are based on a number of moving parts
and will evolve over time. The economic and budgetary situation will continue to be monitored and
the next estimates will be set out in the Summer Economic Statement 2019 which will be published
shortly. This will set out the Government’s overall economic and budgetary strategy, and establish
the parameters for the forthcoming Budget.
5
See Estimating Ireland’s Output Gap (2018) available at:
https://www.gov.ie/en/publication/65c119-estimating-irelands-output-gap/
6
Protocol 12 attached to the Treaty on the Functioning of the European Union.
7
Modified Gross National Income (also known as GNI*) more accurately reflects the income standards of Irish
residents than GDP. It differs from actual GNI in that it excludes inter alia the depreciation of foreign-owned, but
Irish-resident, capital assets (most notably intellectual property and assets associated with aircraft leasing) and
the undistributed profits of firms that have re-domiciled to Ireland.
8
A more detailed analysis of public debt developments in Ireland will be outlined in the Department’s Annual
Report on Public Debt in Ireland which will be published shortly.
Department of Finance | Ireland’s Stability Programme, April 2019 Update Page | 3Department of Finance | Ireland’s Stability Programme, April 2019 Update Page | 4
Chapter 2
                                          Economic Outlook

2.1     Summary

The central scenario set out in this document is one in which the pace of economic growth in Ireland
is set to moderate to a more sustainable rate, from the very strong rates recorded in recent years.
The forecast is for headline GDP to increase by 3.9 per cent this year, a projection which incorporates
a modest downward revision relative to the Department’s Autumn forecasts in order to reflect less
favourable near-term prospects in key export markets.               Modified domestic demand – a more
meaningful measure of underlying economic activity in Ireland – is set to expand by 4.0 per cent. For
next year, both GDP and MDD are projected to increase at a rate of 3.3 per cent.

                                                                                                               9
The projections set out in this document are contingent upon a ‘soft’ exit of the UK from the EU.
Despite the decision of the European Council to extend Article 50 until 31 October to ensure an
orderly withdrawal, the probability of a disorderly, no-deal exit in late 2019 is still, by no means, a tail-
risk.

There are both upside and downside risks to this central scenario, although the balance of risk is
firmly tilted to the downside. Upside risks to the forecast are mainly statistical in nature: the measured
rate of GDP growth may be higher than forecast due to factors that have little bearing on domestic
                                                     10
living standards but are included in Irish GDP.           Downside risks are mainly, though not exclusively,
external in origin. The most pertinent of these relates to the possibility of a harder-than-assumed UK
exit from the European Union, which remains a non-trivial risk and which would have severe
implications for the Irish economy.

Over the medium-term, key sources of risk relate to the UK’s future relationship with the EU as well as
the possibility of a rolling-back of globalisation (from which Ireland has undoubtedly benefitted).
Domestic risks mainly relate to the possibility of an overheating economy, including through an
overshooting of housing supply. The balance of risk over the medium term is tilted firmly to the
downside.

2.2     Macroeconomic Outturn 2018

First estimates show that GDP increased by 6.7 per cent last year. This is ¾ percentage points lower-
than-assumed at the time of the Budget and reflects a combination of factors, including slightly
weaker-than-assumed personal consumer spending, a decline in net exports associated with ‘contract
                 11
manufacturing’        and de-stocking by firms in the third and fourth quarters.

9
  The central scenario involves a transition period applying until end-2020 during which the status quo applies,
followed by a free trade agreement between the UK and EU. The GDP growth rate is reduced by ½ of a
percentage point on average each year over the three years 2021 to 2023.
10
   GDP in Ireland is calculated in line with European and international standards.
11
   Contract manufacturing is a form of outsourcing where a company in Ireland engages a company abroad to
manufacture products on its behalf (and vice versa) but where the Irish-resident firm retains ownership of all
inputs into the production process.

Department of Finance | Ireland’s Stability Programme, April 2019 Update                               Page | 5
The headline export performance – with growth of 8.9 per cent recorded in 2018 – was driven heavily by pharmaceutical exports, with goods exports up almost 12 per cent as a result. Exports of goods associated with contract manufacturing were a modest drag on overall exports last year. Service exports were strong once again, with exports of computer services and royalties underpinning growth of 5 per cent. The expansion of royalty exports in recent years is a direct consequence of the on- shoring of intellectual property assets: with these assets now housed in Ireland, foreign affiliates must pay the Irish entity in order to produce goods and services, thereby generating a royalty export. Having said that, net exports of royalties remains in negative territory (royalty payments abroad exceed royalty payments to Irish entities). On the domestic front, investment increased by 9.8 per cent last year, although the headline figure was distorted by a significant increase in aircraft purchases, offset in part by a decrease in investment in intangible assets (both of these transactions are GDP-neutral in the short-term as the assets are sourced from abroad and, accordingly, classified as imports). Other components of capital formation were also weak last year with ‘core’ machinery and equipment spending (i.e. excluding the volatile components referred to above) essentially flat. In fact, building and construction was the only category of investment in positive territory, rising by 16 per cent last year with strong contributions from both the residential and non-residential construction sub-components. In line with strong growth in disposable income, improving consumer confidence and modest inflation, personal consumer spending grew at a healthy rate of 3 per cent last year, although the pace of growth moderated over the second half of the year. At an aggregate level, preliminary data suggest a pick-up in the savings ratio last year, to around 11½ per cent of disposable income. After a contraction in the first half of the year, imports picked up sharply thereafter, growing by 7 per cent for the year as a whole, with growth recorded in both the goods and service categories. The volatility in imports is largely due to erratic investment patterns, notably in aircraft and intangible assets, both which were weak in the first half of last year but which rebounded in the second half. The surge in aircraft investment in the second half of the year was particularly noteworthy, although it must be stressed that the impact of these transactions on the domestic economy is limited, given that these investments were mainly acquisitions by the aircraft leasing sector, with limited implications for the actual (as opposed to the measured) domestic capital stock. Export growth in nominal terms exceeded import growth last year and, accordingly, the trade balance widened once again, reaching its highest level ever. The cross-border factor income flow deficit also widened, albeit not to the same extent as the increase in the trade surplus. As a result, the current account of the balance of payments reached 9.1 per cent of GDP last year. In terms of the labour market, 63,000 (net) jobs were created over the course of last year, so that the level of employment was 2.9 per cent higher than a year earlier. There was also a noticeable shift from part-time employment into full-time employment, a further sign of the health of the labour market at present. On the nominal side, headline inflation was once again subdued, averaging just 0.7 per cent (on a HICP basis) for the year, as the dampening impact on prices of euro-sterling exchange rate appreciation offset the impact of rising oil prices and price increases in the services sector. The GDP Department of Finance | Ireland’s Stability Programme, April 2019 Update Page | 6
deflator – a wider measure of inflationary pressures in the economy – increased slightly last year,
largely due to exchange rate–related changes in the terms-of-trade.

2.3      Macroeconomic Projections 2019

2.3.1    External assumptions
Incoming data confirm a softening of external demand since around the summer of last year, with the
pace of growth in Ireland’s main export markets losing momentum. Several factors appear to be at
work and near-term prospects have been revised downwards accordingly (table 2).

Table 2: external assumptions, per cent change (unless stated)

                                             2018        2019        2020        2021        2022        2023

External GDP growth
United States                                 2.9         2.3         1.9         1.8         1.6        1.6
Euro area                                     1.8         1.3         1.5         1.5         1.4        1.4
United Kingdom                                1.4         1.2         1.4         1.5         1.6        1.6

Technical assumptions
Euro-sterling exchange rate (€1=)            0.88        0.86        0.86        0.86        0.86        0.86
Euro-dollar exchange rate (€1=)              1.18        1.13        1.13        1.13        1.13        1.13
Brent crude (dollars per barrel)             71.6        65.3        64.2        62.5        62.5        62.5

Oil prices (futures) in 2019 – 2023 are calculated on the basis of futures markets as of end-March 2019. Oil price
futures are available until 2021 and, thereafter, oil prices are held constant.
Exchange rate outturns as of end-March 2019 and unchanged thereafter.
Source: IMF World Economic Outlook Database (April 2019 Update) 2019-2023.

Real income growth in the UK (a key source of demand for Irish exports, being the destination for
around 15 per cent of total Irish exports) slowed over the course of last year, as investment stalled
due to heightened uncertainty associated with ‘Brexit’. The lack of clarity about the UK’s exit from the
EU is affecting consumers also, with some evidence that the household sector is building up
precautionary savings. As a result, domestic demand in the UK has slowed, weighing on overall
output growth which slowed to just 0.2 per cent in the final quarter of last year. Having said that,
slowing output growth has not yet resulted in any deterioration in the UK labour market, where the
employment rate continues to rise and the unemployment rate has fallen below 4 per cent for the first
time since the mid-1970s, though in part this is driven by firm’s holding off on investment and, as a
result, substituting labour for capital. For this year, growth in the UK is projected at just 1.5 per cent
for this year.

The economic cycle in the euro area (the destination for nearly one-third Irish exports) has peaked
sooner-than-expected. Part of this reflects sector-specific issues, such as car production in Germany.
More generally, the more modest pace of growth internationally has weighed on the euro area
economy, denting both consumer and business confidence. In the fourth quarter of last year, the euro
area economy expanded at a quarterly pace of just 0.2 per cent and GDP growth is projected at 1.6
per cent this year.

Department of Finance | Ireland’s Stability Programme, April 2019 Update                                 Page | 7
In the US (the destination for nearly one-fifth of Irish exports), the economy is now in its second
12
longest continuous expansion ever. However, the pace of growth is set to slow in the short-term as
the impact of fiscal stimulus fades. The information content of the ‘yield curve’ appears to be
relatively high (see box 2) and these data are consistent with a maturing of the economic cycle in the
US. The latest data show a quarterly growth rate of 0.5 per cent in the final quarter of last year, and
high frequency data point to a further moderation in the first quarter of this year. A growth rate of 2.5
per cent is currently forecast for this year.
Elsewhere, the growth rate of the Chinese economy (not a particularly important export destination
for Irish goods and services – at least in aggregate terms – but, given its size, a key driver of global
growth) appears to have moderated, in part due to trade tensions weighing on production and
exports. For this year, GDP growth is projected at 6.2 per cent. While still relatively strong, this would
be the slowest pace of growth since 1990.
Figure 1: change in external assumptions relative to autumn 2018 forecasts
70 0,95
65
0,90
60
Brent Crude oil (€)
55
0,85
£ = 1€
50
45 0,80
40
0,75
35 Budget 2019 SPU 2019 Budget 2019 SPU 2019
30 0,70
Q1 Q3 Q1 Q3 Q1 Q3 Q1 Q3 Q1 Q3 Q1 Q3 Q1 Q3 Q1 Q3 Q1 Q3 Q1 Q3 Q1 Q3 Q1 Q3
2016 2017 2018 2019 2020 2021 2016 2017 2018 2019 2020 2021
The Department’s Autumn forecasts were set out in the Economic and Fiscal Outlook, October 2018.
In relation to exchange rates, the standard approach is to hold these constant at rates prevailing at a certain cut-
off point (end-March for the Department’s spring forecasts and end-September for the Department’s autumn
forecasts).
Source: Macrobond (for oil prices) and Central Bank of Ireland (for exchange rate data).
Oil prices are currently lower relative to the Department’s autumn forecasts inter alia reflecting lower-
than-assumed demand arising from the more modest pace of global expansion. Futures markets
currently suggest oil prices averaging $65.3 (€57.6) per barrel this year and $64.2 (€56.8) per barrel
next year.
In terms of exchange rates, the euro-sterling bilateral rate was around €1 = stg£0.86 at end-March;
on the basis of the purely technical assumption of no further change, this would imply a euro
depreciation of just under 3 per cent this year relative to last year. The euro-dollar bilateral rate was
12
National Bureau of Economic Research (NBER) data show that if the expansion in the US was to continue until
the summer, the current cycle would be the longest continuous expansion ever.
Department of Finance | Ireland’s Stability Programme, April 2019 Update Page | 8€1 = $1.13; again on the basis of the purely technical assumption of no further change, this would
imply a euro depreciation of around 4 per cent this year relative to last year.
Box 1: The ‘yield curve’ in the US – information content
The US economy is currently in its longest continuous expansion since the 1991-2001 cycle, with growth
recorded in every quarter since June 2009. Other indicators confirm the progress since the global financial crisis:
the unemployment rate, for instance, is at its lowest level since 2000 (although it is important to highlight that
participation rates – including those for prime-age workers – have not yet returned to their pre-crisis peaks).
It is, of course, impossible to say how long this will continue. However, given the importance of the US economy
for Ireland and, indeed, for the global economy, it is worthwhile probing a little deeper into financial market
variables, in order to gauge the expectations of market participants.
The theory underlying this approach is that forward-looking market participants have important information
regarding the future direction of the economy and this is reflected in the price of financial assets. In practice,
however, this is a somewhat heroic assumption and several commentators have referenced Nobel laureate Paul
Samuelson’s observation that equity markets have predicted “9 of the past 5 recessions.”
While the track-record of equity markets in predicting recession may not be great, the opposite is true in the case
of bond markets which, at least in the US, appear to have some leading-indicator properties. The graph below
charts the US yield curve since 1980; the yield-curve is defined here as the interest rate at which the US
government can borrow for 10 years less the interest rate at which the government can borrow for 2 years. In
‘normal’ times, the cost of borrowing for longer period should be higher than borrowing for shorter periods in
order to compensate lenders for higher risks (e.g. the risk of inflation). This means that the yield curve typically
has a positive slope.
On occasion, however, the US yield curve has ‘inverted’ – a negative slope. This arises when short-term
borrowing is more expensive than long-term borrowing, a situation which has arisen in the US on a number of
occasions since 1980. On each occasion, the US economy subsequently moved into recession (shaded area in
graph), with an average lead-in time, i.e. time between inversion and recession, of 4/5 quarters. Importantly, the
chart shows that there have been no type I errors (false-positives) over this period.
The yield curve in the US has flattened over the past year or so and has come close to inverting (10yr-2yr) at
end-March (cut-off point for this document). Bond markets, therefore, appear to be suggesting that a recession in
the US over the next year or so cannot be ruled out. Of course, past performance is no guarantee of future
performance and it is possible that the adoption of non-standard monetary policies in the US (quantitative easing)
or indeed other factors may have reduced the information content of this variable.
US yield curve (10-year minus 2-year), percentage points
4 1
3
2
1
0
-1 US recessions
-2 10Yr-2Yr Yield Spread
-3 0
1980
1987
1994
2001
1981
1982
1983
1984
1985
1986
1988
1989
1990
1991
1992
1993
1995
1996
1997
1998
1999
2000
2002
2003
2004
2005
2006
2007
2008
2009
2010
2011
2012
2013
2014
2015
2016
2017
2018
2019
Source: Macrobond, Department of Finance.
Department of Finance | Ireland’s Stability Programme, April 2019 Update Page | 92.3.2 The Irish economy in 2019 Against a backdrop of slowing external demand, Irish exports are forecast to grow by 5.2 per cent this year. Exports associated with ‘contract manufacturing’ are assumed to make no contribution to this figure; in any event, to the extent that there is any contribution (positive or negative) from this source, the impact on employment or modified domestic demand is virtually zero, given that actual production takes place elsewhere. As set out in table 2, the forecasts are based on the technical assumption of unchanged exchange rates from those prevailing at end-March; a ‘harder’ UK exit from the EU than is currently assumed could have implications for the evolution of the euro-sterling bilateral exchange rate. Modified domestic demand – that is domestic demand excluding the volatile components of investment spending – is projected to increase by 4.0 per cent this year. Continued employment and earnings growth should support increases in household income, as will still-modest price increases. On the other hand, consumer confidence has faltered somewhat and, while not the baseline scenario, a disorderly Brexit could prompt an additional increase in precautionary savings. Overall, it is assumed that consumer spending increases by 2.7 per cent this year, which would be consistent with an increase in the household savings rate. Available data – albeit limited at this stage – support this assessment, with ‘core’ retail sales reasonably solid in the opening months of this year and taxation receipts related to personal consumption, such as VAT and excise duties, robust in the first quarter. Modified investment is set to increase by 7.2 per cent this year, with positive contributions expected from all sub-components. Building and construction spending is forecast to increase by 8 per cent, with contributions from both residential and commercial investment. Investment in machinery and equipment is forecast at 4 per cent this year; however, ongoing uncertainty regarding Brexit may prompt some firms to postpone their investment decisions. The forecasts for investment assume positive contributions from business expenditure on intangible assets and aircraft this year; again, any contribution (positive or negative) does not impact on aggregate demand, given that investment in these assets is assumed to be sourced from abroad (an import). Total investment, therefore, is projected to increase by just under 7 per cent this year. Imports of goods and services are expected to grow by 5.9 per cent this year, reflecting a slowdown in the main components of final demand. Overall, therefore, GDP is forecast to increase by 3.9 per cent this year. Of this, modified domestic demand and modified net exports, are expected to contribute 2.2 and 1.7 percentage points to overall GDP growth. Department of Finance | Ireland’s Stability Programme, April 2019 Update Page | 10
Table 3: macroeconomic prospects

                                              2018         2019       2020        2021        2022      2023

                                                         year-on-year per cent change
real GDP                                       6.7          3.9        3.3         2.4         2.5       2.6
nominal GDP                                    8.3          5.5        5.1         4.1         4.1       4.3
real GNP                                       5.9          3.7        3.1         2.2         2.3       2.4

Components of GDP                                      year-on-year per cent change (real)
personal consumption                           3.0          2.7        2.5         2.1         2.3       2.5
government consumption                         6.4          3.9        2.7         2.0         2.0       2.0
investment                                     9.8          6.9        5.5         4.2         4.1       4.1
stock changes^                                 -0.7         0.0        0.0         0.0         0.0       0.0
exports                                        8.9          5.2        4.5         3.7         3.6       3.5
imports                                        7.0          5.9        5.0         4.4         4.2       4.1

Contributions to GDP growth                            annual percentage point contribution
domestic demand (excl. stocks)                 3.9          3.0        2.5         2.0         2.0       2.2
net exports                                    4.3          1.0        0.8         0.4         0.5       0.5
modified domestic demand (excl. stocks)        2.6          2.3        1.9         1.5         1.6       1.7
modified net exports                           5.7          1.6        1.5         0.9         0.9       0.9
stock changes                                  -0.7         0.0        0.0         0.0         0.0       0.0
statistical discrepancy                        -0.9         0.0        0.0         0.0         0.0       0.0

Current prices                                                      € millions
GDP (nearest €25m)                           318,450     335,825    352,850      367,300     382,525   399,050
GNP (nearest €25m)                           251,825     265,350    278,400      289,400     301,000   313,400
GNI* (nearest €25m)^^                        192,212     201,677    211,490      219,667     228,309   237,623

Rounding can affect totals.
^ contribution to GDP growth.
^^ technical assumption that its growth rate moves in line with nominal GNP growth.
Source: 2018 - CSO; 2019 to 2023 - Department of Finance.

Department of Finance | Ireland’s Stability Programme, April 2019 Update                                Page | 11
Box 2: Possibility of a disorderly Brexit
Notwithstanding some de-coupling in recent decades, Ireland’s economic relationship – trade, investment, labour
market, etc. – with the UK remains very strong. A disorderly exit of the UK from the EU would involve inter alia
tariff and non-tariff barriers to goods trade, a loss of market access for services trade, and substantial short-run
disruption due to uncertainty. While Ireland would be expected to benefit from additional foreign direct investment
(FDI) through the relocation of existing investment from the UK and the displacement of new investment that
would otherwise go to the UK in a no exit scenario, this will not compensate for the losses arising from lower
levels of trade between the two jurisdictions.
In order to quantify the costs of a disorderly exit, the Department and ESRI recently published an updated model-
13
based assessment of the economic and budgetary impacts. This assessment includes a ‘deal’ scenario, upon
which the main macroeconomic projections in this document are based, and a disorderly ‘no-deal’ scenario.
Previous work by the Department and the ESRI in 2016 had quantified the impact of WTO tariffs, and the latest
analysis updates this impact while also explicitly accounting for:
short-run disruptive impacts (such as disruption at ports);
non-tariff barriers to trade (using new microeconomic research);
updated assessments by the UK Government on the likely impact on the UK economy; and,
additional inward investment to Ireland (FDI).
In aggregate terms, a disorderly exit would reduce the level of GDP by around 3¼ per cent after 5 years, and 5
per cent after 10 years, relative to a hypothetical scenario in which the UK did not exit the EU. Reduced output
results in lower labour demand, which has knock-on impacts for employment and the unemployment rate: after 5
years the level of employment would be around 2 percentage points below what it otherwise would be and the
unemployment rate around 1.2 percentage points higher. With both output and employment below what they
otherwise would be, government revenue will worsen, and the increase in the unemployment rate would lead to
higher government spending on welfare payments. The net effect is a reduction in the general government
balance of a ½ of a percentage point of GDP worse.
Despite these impacts, it should still be noted that the Irish economy will continue to grow but at a slower pace as
a consequence of Brexit. Over the long-run (i.e. 10 years) it is estimated that the growth rate will be around ½ of
a percentage point below the long-run growth rate of around 3 per cent. Model results generated using structural
models are insightful and very useful assessing the medium- and long-term impact of various shocks. They are,
however, less well suited to calibrating the short-term impact. Of necessity, this requires an element of
judgement. Nevertheless, based on the model results, growth in the first year following a disorderly Brexit could
be close to 3 percentage points below what it otherwise would be.
14
As noted in a number of Department of Finance publications, the negative impacts from Brexit will be most
keenly felt in those sectors with strong export ties to the UK market – such as the agri-food, manufacturing and
tourism sectors and also SMEs generally – along with their suppliers. The impact will be particularly noticeable in
the regions.
Summary of macro-fiscal impacts under a disorderly scenario
Level differences versus no-Brexit scenario 2 years* 5 years 10 years
GDP
Deal -0.6 -1.9 -2.6
Disorderly -3.0 -3.3 -5.0
Unemployment rate
Deal 0.1 0.5 1.0
Disorderly 0.7 1.2 2.0
General Government Balance
Deal 0.0 -0.3 -0.5
Disorderly -0.4 -0.5 -0.9
13
See Bergin et al (2019): Ireland and Brexit: modelling the impact of deal and no-deal scenarios. Available at:
https://assets.gov.ie/7229/43fbeb9ba6404433be5cfd78fe5f0357.pdf
14
See Brexit: Analysis of Import Exposures in an EU Context, UK EU Exit: Trade Exposures of Sectors of the
Irish Economy in a European Context and UK EU Exit – An Exposure Analysis of Sectors of the Irish Economy.
Department of Finance | Ireland’s Stability Programme, April 2019 Update Page | 12Source: ESRI/Department of Finance. * The 2 year impact assumes no upside in FDI.
Box 3: Underlying measures of economic activity
In recent years, it has become increasingly difficult to distil the underlying health of the Irish economy, as well as
its position in the cycle, from the headline GDP statistics. Phenomena such as contract manufacturing, on-
shoring of intellectual property (IP), the capitalisation of leased aircraft, and the dominance of certain high-
technology sectors, have significantly increased the noise-to-signal ratio in the headline statistics and,
accordingly, reduced the information content.^ This was, once again, the case in 2018, with GDP growing in
excess of 9 per cent in the first half of the year, before decelerating sharply in the second half, primarily on the
back of volatility in the external (and foreign-dominated) sectors of the economy.
To address this, the CSO produces additional annual information, namely modified GNI (GNI*), as well as a
measure of gross value added for the sectors of the economy not dominated by foreign-owned multinationals. In
the quarterly accounts, several indicators provide useful real-time information about the economy. Modified
domestic demand (MDD) – that is domestic demand excluding investment in foreign-owned IP and leased
aircraft – increased by 4.5 per cent in 2018. A related measure is underlying domestic demand – which excludes
all investments in IP and aircraft, including by Irish owned entities – and this increased by 5.7 per cent last year.
A third alternative – though not a measure published by the CSO – uses sectoral data published in the quarterly
15
national accounts to create a quarterly proxy for the CSO’s annual series for non-foreign dominated GVA. This
involves excluding value added generated in manufacturing and information and communication services from
the quarterly GDP series; this proxy increased by 5.4 per cent in 2018. Taking the average of these three
underlying measures would give an underlying growth rate of just over 5 per cent for 2018. The average and
range for these three measures is set out in the first figure below.
Range of proxies for underlying economic activity, per cent
10 Indicator of MDD vs Actual MDD
Underlying Annual Growth Indicator
8
10
6
4
5
2
0 0
-2
-5 -4
-6
-10 -8 MDD indicator
Indicator Range Indicator Midpoint
-10 MDD (outturn)
-15 -12
2001
2003
2005
2007
2009
2011
2013
2015
2017
2002
2004
2006
2008
2010
2012
2014
2016
2018
Source: CSO, Department of Finance
More sophisticated statistical techniques can also be used to generate real-time estimates of underlying
economic activity using a range of higher frequency data. These statistical approaches can be used to ‘now
cast’ MDD and have significant informational power, particularly the capacity to detect underlying trends in real
time. The Department’s toolkit has expanded to incorporate a similar ‘now-casting’ approach – generated using
Principal Component Analysis – for MDD. The work-in-progress results are presented in the second figure
above, indicating a very close fit with MDD. The analysis underpinning this will be published over the summer.
^ see Department of Finance note on GDP and Modified GNI. Available at:
https://www.gov.ie/en/publication/498058-gdp-and-modified-gni-explanatory-note-may-2018/
15
See Table 1 of the quarterly national accounts.
Department of Finance | Ireland’s Stability Programme, April 2019 Update Page | 132.4 Balance of Payments
A current account surplus amounting to 9.1 per cent of GDP was recorded last year. A trade surplus
amounting to 31 per cent of GDP more than offset a factor income deficit of 22 per cent of GDP.
As highlighted previously, the current account balance in Ireland is inflated by a variety of statistical
factors which emanate from the internationalisation of the economy, including so-called ‘contract
manufacturing’, re-domiciled PLC’s and the depreciation of Irish-based, foreign-owned capital assets.
The modified current account – which adjusts for some of these factors – will be published by the
16
CSO over the summer and will provide a better insight into the underlying trends. The Department’s
estimate is that a modified surplus of around 2 per cent of GDP was recorded last year (although
there is considerably uncertainty surrounding this estimate given the volatility in the input variables).
A modest deterioration in the trade balance (goods and services) is forecast for this year, as further
expansion of domestic demand should give rise to additional imports. More modest export growth is
assumed, mainly on foot of the slowdown in external demand. Exchange rate developments suggest
a very modest deterioration in the terms of trade. Accordingly, the trade surplus is expected to
contract slightly. With a modest deterioration in the income balance in prospect – as export growth is
assumed to be concentrated in the foreign-owned sectors – a current account surplus of 8.4 per cent
of GDP is projected for this year.
Table 4: savings, investment and the balance of payments, per cent of GDP
2018 2019 2020 2021 2022 2023
Gross Savings 35.1 35.3 35.6 35.5 35.3 35.0
of which:
- households 3.8 4.5 4.4 4.3 4.2 3.9
- corporate 28.7 28.1 27.9 27.5 27.0 26.6
- government 2.6 2.8 3.3 3.7 4.1 4.5
Investment^ 24.9 25.9 26.6 27.1 27.6 28.0
of which:
- building and construction 8.5 9.2 9.6 9.9 10.2 10.6
- other investment 16.4 16.8 17.0 17.2 17.4 17.5
: investment in tangible assets 7.7 7.6 7.6 7.6 7.6 7.6
: investment in intangible assets 8.8 9.1 9.4 9.6 9.8 9.9
- change in stocks 0.5 0.5 0.5 0.4 0.4 0.4
- statistical discrepancy 0.6 0.5 0.5 0.5 0.5 0.4
Current account 9.1 8.4 8.0 7.5 7.0 6.3
of which:
- trade balance 31.2 30.7 30.4 30.1 29.6 29.1
- income balance -22.1 -22.2 -22.4 -22.5 -22.6 -22.8
Modified current account (per cent GNI*) 1.8 0.7 0.5 -0.1 -0.8 -1.8
Rounding can affect totals.
^ More specifically, Gross Capital Formation which is the sum of gross domestic fixed capital formation, changes
in stocks and the statistical discrepancy.
16
The Department will publish a detailed analysis of Balance of Payments developments shortly.
Department of Finance | Ireland’s Stability Programme, April 2019 Update Page | 14Source: 2018 - CSO; 2019 to 2023 - Department of Finance.
2.5 The Labour Market
Further gains in employment are in prospect this year, with the number in employment expected to
increase by 50,000 (2.2 per cent). Most of these are expected to be in full-time employment. On a
sectoral basis, employment gains should be broadly-based with most, though perhaps not all, sectors
assumed to post job-gains.
Figure 2: employment and the Philips curve
2,6
10
Total Employment
[CELLRAN
2,5 Non-Construction Employment GE]
[CELLRAN
8
GE]
2,4
6
nominal wage growth (%)
2,3 [CELLRAN
Pre-crisis peak GE] [CELLRAN
Millions
2,2 4 [CELLRAN GE]
GE]
[CELLRAN [CELLRAN [CELLRAN
2,1 GE]
[CELLRAN GE] GE]
Pre-crisis peak 2 [CELLRAN
GE] GE] [CELLRAN
2,0 GE]
0 [CELLRAN
1,9 [CELLRAN
GE]
GE]
1,8 -2
[CELLRAN
1,7 GE]
-4
2007
2008
2009
2010
2011
2012
2013
2014
2015
2016
2017
2018
2019
2020
2021
2022
2023
2 4 6 8 10 12 14 16
unemployment rate (%)
Source: CSO, Department of Finance.
One of the stand-out features of the labour market has been the dramatic fall in unemployment since
its peak of 16 per cent in 2012. More recently, however, there is mounting evidence that the pace of
decline has slowed, an inevitable feature given that the economy is closing-in on full employment.
Over the course of last year, for instance, the unemployment rate was relatively stable. In part, this
reflects increased labour supply due to demographic factors (age structure of the population, inward
migration). This year, further increases in labour supply are anticipated; however, the growth is likely
to be slightly less than employment growth, so that the unemployment rate is projected to fall to 5.4
per cent.
After a number of years of modest earnings growth (at least at an aggregate level), available evidence
points to an acceleration in wage inflation in recent quarters. The continued tightening in the labour
market is likely to be associated with an increase in pay per employee to 3 per cent for 2019 as a
whole, predominantly driven by growth in hourly pay rather than growth in hours worked.
Department of Finance | Ireland’s Stability Programme, April 2019 Update Page | 15Table 5: labour market developments, per cent change (unless stated)
2018 2019 2020 2021 2022 2023
Employment 2.9 2.2 2.1 1.5 1.6 1.7
Unemployment rate (per cent) 5.7 5.4 5.2 5.3 5.2 5.1
Labour productivity^ 3.1 1.5 1.0 0.7 0.7 0.8
Compensation of employees* 6.6 6.4 5.6 4.9 5.2 5.6
Compensation per employee* 2.5 3.0 3.2 3.3 3.5 3.8
^ GDP per hour worked.
*Non-agricultural sector.
Source: 2018 - CSO; 2019 to 2023 - Department of Finance. The wage bill and pay figures for 2018 are
Department of Finance estimates pending publication of the 2018 National Income and Expenditure data.
2.6 Price Developments
In the euro area, inflationary pressures remain subdued, with ‘core’ inflation (the harmonised measure
excluding the volatile components of unprocessed food and energy) of just 1.2 per cent last year. In
Ireland the equivalent figure was 0.2 per cent.
These broad trends look set to continue this year. In the euro area, the slowdown in the growth rate
should limit ‘demand-pull’ inflation and figures for the first quarter of the year – where inflation
averaged 1.1 per cent – support this assessment. For the year as a whole, HICP inflation in the euro
area is forecast at 1.4 per cent.
In Ireland, energy price inflation is likely to be decline this year, given developments in wholesale
markets. The moderate depreciation of the euro-sterling bilateral exchange rate may result in a slight
increase in import prices. On the domestic front, some pick-up in services price inflation is expected,
inter alia reflecting reasonably strong domestic demand as well as evidence that wage inflation – and
hence production costs – has accelerated somewhat. For the year as a whole, inflation in Ireland is
forecast at 0.9 per cent; ‘core’ inflation is projected at 1.1 per cent.
Table 6: price developments, per cent change
2018 2019 2020 2021 2022 2023
GDP deflator 1.5 1.5 1.7 1.7 1.6 1.6
Personal consumption deflator 1.4 1.5 1.6 1.7 2.0 2.3
Harmonised index of consumer prices (HICP) 0.7 0.9 1.1 1.6 2.0 2.3
Core HICP inflation^ 0.2 1.1 1.5 1.8 2.0 2.3
Export price deflator (goods and services) 0.0 0.9 1.5 1.5 1.4 1.3
Import price deflator (goods and services) 0.9 1.1 1.5 1.5 1.5 1.5
Terms-of-trade (good and services) -0.9 -0.2 0.0 0.0 -0.1 -0.1
^ core inflation is HICP inflation excluding the most volatile components, namely energy and unprocessed food.
Source: 2018 - CSO; 2019 to 2023 - Department of Finance.
The GDP deflator – a wider measure of the price changes in the economy – is forecast to increase by
1.5 per cent this year, driven by price increases in the domestic components of demand. On the other
hand, a modest deterioration in the terms-of-trade is projected for this year.
Department of Finance | Ireland’s Stability Programme, April 2019 Update Page | 16Box 4: Residential Property Prices
Incoming data suggest a moderation in the pace of house price inflation. The figure below shows that this time
last year, the annual rate of house price inflation was at around 13 per cent both nationally and in Dublin; the
annual rate is currently 5.6 per cent nationally and 1.9 per cent in Dublin.
Several factors appear to be at work. Firstly, on the supply side, the number of new dwelling completions has
increased in recent years, albeit from a very low base. In addition, the increase in supply remains below
estimated demand for housing, the latter determined on the basis of demographic factors and a likely return to
the long-term trend of increasing headship rates (fewer people per household).
Residential price inflation, nationally and Dublin, Jan ’18 – Jan ’19
14
12
10
8
6
4
2
0
Jan Feb Mar Apr May Jun Jul Aug Sep Oct Nov Dec Jan '19
National Dublin
Source: CSO
On the demand side, it appears that the Central Bank of Ireland’s macro prudential mortgage measures are
having an impact on price dynamics. Residential estate agents such as the Sherry Fitzgerald have suggested
that, by the second half of last year, individual banks had exhausted their allowable exemptions to the Loan-to-
Income (LTI) and Loan-to-Value (LTV) limits. The market impact of this process was likely a factor in price
moderation post-April.
More broadly, the Central Bank’s mortgage measures impose a natural brake on price inflation, particularly at the
upper-end of the market and in areas with higher values. As median prices rise, the number of mortgaged
purchasers with the ability to bid-up prices reduces, lowering inflationary pressures.
Finally, it cannot be ruled out that prospective buyers are temporarily holding off their purchase given the
uncertainty associated with the UK’s exit from the EU.
2.7 Medium-Term Growth Prospects 2020 to 2023
2.7.1 The Irish economy in 2020
The external environment will have a key bearing on the Irish economic situation next year. On the
assumption that the current slowdown in key export markets is short-lived, external demand should
stabilise next year. On this basis, Irish exports are projected at 4.5 per cent in 2020, down just over a
quarter of a percentage point from the projections last Autumn. Modified domestic demand is
projected to increase by 3 per cent, with modified net exports (excluding leased aircraft and foreign
Department of Finance | Ireland’s Stability Programme, April 2019 Update Page | 17You can also read