Low-cost and Traditional Airlines: Ratio Analysis and Equity Valuation by the Residual Earnings Model Master Thesis Spring Semester 2007 ...
←
→
Page content transcription
If your browser does not render page correctly, please read the page content below
Low-cost and Traditional Airlines:
Ratio Analysis and Equity Valuation by the Residual Earnings Model

Master Thesis

Spring Semester 2007

Supervisor:   Stefan Sundgren

Author:       Saijai Hanpobamorn
ACKNOWLEDGEMENT

Firstly, I would like to express my gratitude to Umeå University and the teacher team for
providing me the valuable knowledge in a peaceful environment.

I deeply thank my supervisor Professor Stefan Sundgren, who kindly supervises and gives me the
excellent suggestion, guidance, and encouragement all the times during my thesis writing. I
cannot complete this thesis without his consistent advice.

I appreciate any help of the staffs at student office and at library during my study in the
university.

I also appreciate the Company’s management I have been working for giving me an opportunity
to continue my study abroad. I also thank all my friends who always being beside and encourage
me.

Lastly, the special thanks go to my family for your unconditional support continuously in
whatever I do, and wherever I stay.

Umeå
25 May 2007

                                              ii
ABSTRACT
Fundamental analysts use basic fundamentals, which generally based on available public
information, to determine a firm’s intrinsic value. Forecasting future performance is one of the
key elements for doing fundamental analysis, and historical results are the foundation for future
forecast.
The analysis of this study is conducted into two sections with case studies in the airline business.
Firstly, financial ratios are analyzed to examine whether low-cost or traditional airlines better
perform their operations during a certain period. The other section is undertaking fundamental
analysis of the case studies to evaluate current stock prices of representative airlines based on the
potential future forecast. The model using for this valuation is the Residual Earnings Model. Key
assumptions of future forecasts are mainly based on their historical ratios. Other related factor
such as the gross domestic product (GDP) is included in forecasting sales growth rate because it
is one of the key influences in the airline business.
For ratio analysis, the findings suggest that low-cost airlines perform better operations based on
five years average. However, the traditional airlines improve their performances significantly in
the latest fiscal year. For equity valuation, the findings show that estimates of equity values of the
airlines yield inconsistent results comparing to their stock prices. Possible reasons of the
difference might be the improvement in key financial ratios of the airlines.
Key words: Fundamental analysis, ratio analysis, equity valuation, residual earnings, airline
industry, low-cost airline, traditional airline
iiiChapter 1 Introduction
1.1 Problem Background………………………………………..……………... 4
1.2 Research Questions……………..…………………………………………. 5
1.3 Purpose of Study…………………………..………………………………. 5
1.4 Perspective………………………………………..……………………….. 5
1.5 Delimitations………………………………………………..…………….. 6
1.6 Preconceptions……………………………………………….…….……… 6
1.7 Disposition…………………………………………………….…………... 7
Chapter 2 Research Methodology
2.1 Choice of subject…………………………………………….…………….. 8
2.2 Research Philosophy……………………………………….……………… 8
2.3 Research Approach…………………………………………….………….. 8
2.4 Research Method……………………………………….………….……… 9
2.5 Data collection……………………………………………….…….……… 9
Chapter 3 Theoretical Framework
3.1 Market Efficiency…………………………………………….……………. 11
3.2 Investment Strategy………………………………………….…….………. 13
3.2.1 Active and Passive Strategies…………………………….………... 14
3.3 Financial Statement Analysis………………………………….…………… 14
3.3.1 Strategy Analysis…………………………….…………….………. 15
3.3.2 Accounting Analysis………………………………….……………. 15
3.3.3 Financial Analysis…………………………………….…………….16
3.3.3.1 Ratio Analysis………………………………….…………... 16
3.3.4 Prospective Analysis: Forecasting…………………….…………… 20
3.3.5 Prospective Analysis: Valuation Analysis………….……………… 20
3.3.5.1 Residual Earnings Model………….……………….……….22
3.3.5.2 Residual Earnings Model and Dividend
Discount Model…………………………….………………. 24
3.3.5.3 Disadvantage of Residual Earnings Model……..…………. 24
3.3.6 From Ratio Analysis to Equity Valuation………………..………....25
3.4 Empirical Evidence…………………………………………….…………... 26
Chapter 4 Literature Review of the Airline Industry
4.1 Industry Overview…………………………………….…………………… 28
4.2 Competitive Issues…………………………………………..……………... 30
4.2.1 Deregulation……………………………………….……….……….30
4.2.2 Cost Operation…………………………….……………….………. 31
4.2.3 Loyalty Schemes……………………………….…………………... 33
4.3 Financial Performance………………………………….………….………. 34
4.4 Future Growth………………………………………………….…………... 38
Chapter 5 Analysis and Results
5.1 Airline Overview………………………………………….……….………. 43
5.2 Strategy Analysis……………………………………………….….………. 46
5.3 Accounting Analysis………………………………………….……………. 47
15.4 Analysis and Results: Ratio Analysis……………………….……………... 48
5.5 Equity Valuation……………………………………………….…………... 59
5.5.1 Key Assumptions of Forecasting…………………………..………. 59
5.5.2 Analysis and Results: Equity Valuation………………….………... 61
Chapter 6 Discussion and Conclusions
6.1 Conclusion on Ratio Analysis………………………………………………63
6.2 Conclusion on Equity Valuation…………………………………………… 63
6.3 Recommendations for further Researches…………………………………. 63
6.4 Reliability, Validity and Degree of Generalization………………………... 64
References…………………………………………………………………………………. 65
List of Figures
Figure 1: Information Relationship of Weak-form, Semistrong-form and
and Strong-form……………………………………………………………. 12
Figure 2: Sustainable Growth Rate Framework……………………………………… 17
Figure 3: Growth in World Passengers Carried During 1990-2006…………………. 28
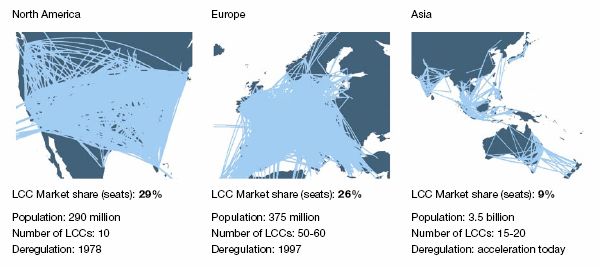
Figure 4: Great Opportunities for Low-cost Airlines in Asia…………….………….. 31
Figure 5: Unit Cost per Available Seat Mile of the U.S. Low-cost and
Traditional (Legacy) Airlines 1998-2004………………………………….. 32
Figure 6: ROIC and Cost of Capital of the Representative Airlines 1996-2004……... 35
Figure 7: Different ROIC in the Aviation Industry in 2004………………………….. 36
Figure 8: International Passenger Growth and Global GDP Growth 1995-2010……..39
Figure 9: World Air Traffic 2005 VS 2025…………………………………….…….. 39
Figure 10: Airline Revenue Growth & Global Economic Growth
During 1996-2008………………………………………………………….. 40
Figure 11: Operating Profit and Net Profitability/Losses During 1998-2008…………. 40
Figure 12: Forecasting GDP Growth and Real Consumer Spending
Growth 2005-2010…………………………………………………………. 41
Figure 13: Comparison of Operating ROA 2002- 2006……………………………….. 49
Figure 14: Comparison of NOPAT Margin 2002-2006……………………………….. 50
Figure 15: Comparison of Operating Asset Turnover 2002-2006…………………….. 53
Figure 16: Comparison of Spread 2002-2006…………………………………………. 54
Figure 17: Comparison of Net Financial Leverage 2002-2006…………………….….. 55
Figure 18: Comparison of ROE 2002-2006…………………………………………… 56
Figure 19: Comparison of Sustainable Growth Rate 2002-2006……………………… 57
2List of Tables
Table 1: Traditional Airlines and their related Low-cost Airlines……………….….. 29
Table 2: Key Features of Low-cost Airlines and Traditional Airlines…………….…30
Table 3: 20 Most Profitable Airlines in 2005………………………………………...37
Table 4: 20 Most Heaviest Losses Airlines in 2005………………………………… 38
Table 5: Aircraft Fleet of the Airlines in 2006………………………………………. 48
Table 6: Operating ROA 2006 VS 5 Years Average (2002-2006)………………….. 49
Table 7: NOPAT Margin 2006 VS of 5 Years Average (2002-2006)………………. 50
Table 8: Unit Cost of European Airlines within European Markets in 2005... ………51
Table 9: Unit Cost of U.S. Airlines in Domestic Markets in 2005………………….. 52
Table 10: Operating Asset Turnover 2006 VS 5 Years Average (2002-2006)……….. 53
Table 11: Spread 2006 VS 5 Years Average (2002-2006)…………………………….54
Table 12: Net Financial Leverage 2006 VS 5 Years Average (2002-2006)………….. 55
Table 13: Return on Equity 2006 VS 5 Years Average (2002-2006)………………… 56
Table 14: Sustainable Growth Rate of 5 Years Average (2002-2006) VS 2006……... 57
Table 15: Comparison of Key Financial Ratios of 5 Years Average…………………. 58
Table 16: Comparison of Key Financial Ratios of 2006………………………………58
Table 17: Trading Stock Exchange and Currency of Representative Airlines……….. 60
Table 18: Key Assumptions of Representative Airlines……………………………… 61
Table 19: Comparison of Equity Value Per Share and Trading Price………………... 62
3Chapter 1 Introduction
1.1 Problem Background
Fundamental analysis or intrinsic value analysis uses financial and other economic information to
determine the firm’s value. Analysts use basic fundamentals, which generally based on publicly
available information, such as accounting earnings, dividends, growth factors or leverage ratios,
etc. to infer the intrinsic value and compare whether it is over or under the firm’s stock price
(Lee, 1987).
Fundamental analysis in accounting researches mostly has been done in cross-sectional approach.
The study tended to investigate large firms in various industries, which are problematic and not in
line with the investment analysts who likely focus on one industry or one sector (Quirin et al.,
2000). In addition, each industry has typical characteristics, for instance accounting methods,
nature of expenses or tax features, etc. There are not many researches performed on industry-
based analysis. Examples of industry-based study include the analysis of U.S. oil and gas
industry (Quirin et al., 2000) and the analysis of the U.S. airline industry (Behn and Riley, 1999),
etc.
Forecast of future payoff is the most important process of fundamental analysis because it is
considered as one of the key elements to determine the firm’s value. According to Palepu et al.
(2000), ratio analysis of past operating behavior could be the foundation of future forecast.
Possible and reliable assumptions are the key concerns when performing the forecast, which
deals with uncertainty in the future.
To determining the firm’s value, there are several valuation models to be employed such as asset-
based valuation model, discounted cash flow model and abnormal earnings (residual earnings)
model (White et al., 1998). The Residual Earnings Model is the accounting-based approach,
using accounting variables to define the equity value. From the linear relations of the model, it is
implied that the stock price of the firm relates to current book value, current earnings and future
earnings. Unlike other models that tend to connect future earnings with cash flow or relate to
dividend policies, this model is based on clean surplus relation instead. However, only clean
surplus is not sufficient for residual earnings valuation. The most important linkage between
accounting numbers and the future residual earnings is fundamental analysis or information
dynamics mentioned by Ohlson (1995). Since Ohlson (1995) proposed the model, there are
numbers of empirical study validate the model as well as compare it against the discount cash
flow and dividend discount model. Due to deriving from the same assumption, the residual
earnings model yields identical results as the discounted cash flow and dividend discount models
(Ohlson, 1995, and Feltham and Ohlson, 1995).
Dechow et al. (1999) performed the empirical assessment on the Ohlson (1995) model and the
result of the study supported the model. The study provided explanation of use of simple
accounting variables to predict abnormal earnings, current price and future stock returns (Beaver,
1999). On the other hand, Myers (1999) discouraged the Ohlson (1995) model according to
failure presenting true stochastic relationship of accounting numbers.
4Fundamental analysts use fundamental analysis to define the firm’s intrinsic value and this value
should represent in the firm’s stock price. But, according to the market efficiency under semi-
strong form hypothesis, which generally appears in most stock markets, the stock prices reflect
all available public information and fundamental analysis is not useful.
In September 2001, the airline industry was attacked by the tragedy event and consequently,
affected to the airlines’ financial performances. Some traditional airlines, especially the U.S. flag
airlines, had a big lost from the tragedy and have taken years to recover the financial status.
However, some of U.S. and European low-cost airlines have grown in profitability and new low-
cost airlines have continued entering to the industry. According to the interesting contradiction,
the study tends to focus on financial ratios and equity values of low-cost and traditional airlines
after the 9/11 crisis.
This study mainly discusses in two connecting parts. The first section performs a part of
fundamental analysis, ratio analysis, in the industry-based. Ratio analysis is undertaken in the
airline industry by comparing the key financial ratios among low-cost and traditional airlines for
a certain periods. Three low-cost and three traditional airlines are selected as the case study. The
second section examines equity values of the same airlines by using the residual earnings model
accompanied by the forecast of accounting variables based on historical performances to compare
with the stock prices of those airlines.
1.2 Research Questions
• Based on the ratio analysis, do low-cost airlines perform better financial results than
traditional airlines?
• Based on the residual earnings model, how do estimates of equity values of the
representative airlines illustrate, comparing to their current stock prices?
1.3 Purpose of Study
The purpose of this study is to analyze the financial ratios of representative low-cost airlines and
traditional airlines to examine how different between their operating performances.
This study also uses the same case studies to conduct fundamental analysis. The purpose is to
illustrate the process of doing fundamental analysis and attempt to evaluate current stock prices
of representative airlines based on the potential future forecast. The valuation model using for
estimate equity values of the airlines is the Residual Earnings Model.
1.4 Perspective
The perspective on this study is considered in an investor’s view. Low-cost airlines have become
the new trend of global air transportation in the last decade and continued growing both in
number of carriers and travelers. Traditional airlines may lose their market shares to the fierce
competition, and cannot maintain the growth in the long run.
The result of this study, based on number of case studies selected, shows the actual performance
of both low-cost and traditional airlines to compare how well they perform their operations
5during current years. In addition, how the equity values of low-cost and traditional airlines would
be illustrated, comparing to their stock prices.
1.5 Delimitations
This case study research is limited to six airlines, which their stocks are traded on the U.S. or
European stock exchanges. For the comparable purpose, the selected airlines present their
financial statements according to the IFRS (International Financial Reporting Standards) or the
U.S. GAAP (Generally Accepted Accounting Principles in the United States). The data collection
is discussed in Chapter 2.
For time period, the calculations are based on the airlines’ annual reports published online
covered the years from 1996 to 2006.
1.6 Preconceptions
Preconception is an idea form in advance of enough knowledge and may lead to bias judgement.
People hold individual preconceptions, according to personal background, personal experiences,
or prestudy beliefs, so individual preconceptions may have an impact on scientific researches.
Even though the author of this thesis has background on finance and accounting areas, the
individual preconceptions would not influence the outcome of the study. This reason is that
interpretation and analysis of case study are based on real figures, which is free of conflict of
interest, or preconceptions of individual analyst.
61.7 Disposition
Chapter Title Contents
1 Introduction The introductory chapter discusses about
problem background as well as purpose of the
study.
2 Research Methodology This chapter presents the research methods
using in the empirical study, including the
collection of data.
3 Theoretical Framework This chapter presents theoretical framework
relating to this study, including related
previous researches.
4 Literature Review of the This chapter provides grounded information of
Airline Industry the airline industry and its future.
5 Analysis and Results This chapter presents analysis of outcomes
based on the given theoretical framework.
6 Discussion and The final chapter concludes the findings and
Conclusion suggests further researches to be conducted in
the future.
7Chapter 2 Research Methodology
This chapter describes the methodology using for the study. The chapter organizes as choice of
subject, research philosophy, research approach, research method, and data collection.
2.1 Choice of Subject
Finding the topic for master thesis is not an easy task. The topic should be matched to a
researcher’s interest, academic knowledge, working background or career goal. Within the
limited time of the course, the researcher needs to have a well plan for the achievable topic.
I have been working in an airline company and have an academic background in accounting area.
Air transportation is considered as a key element in travel industry and there is one-ninth labor
force in the global working in this industry (Hanlon, 2007). The industry is more sensitive to
variable effects than others, for example; fuel prices, economy recession, traveling season,
weather, war or terrorists, which is the most concern nowadays. I also invest some of my money
in a stock market and have questions why some stocks look expensive and what is the true value
of those stocks. Therefore, I refine my ideas with working and studying experiences to a topic
relating to the airline industry combining with theories of fundamental analysis.
2.2 Research Philosophy
Research philosophy depends on what the author want to develop the knowledge (Saunders et al.,
2000). Understanding of the research philosophy is important to research methodology,
according to the following reasons (Easterby-Smith et al., 1997; cited by Crossan, 2003):
- Help the author to clarify the research strategy and the research method.
- Help the author to avoid useless works with clarification of certain methods at the early
stage.
- Help the author to select or adapt the methods, which previously are out of the experience.
Using theories of ratio analysis and Residual Earnings Model for empirical tests on low-cost and
traditional airlines can imply that the study lies on positivism philosophy.
Positivism deals with scientific knowledge, which is measurable. Positivism philosophy of the
study is the work concerning the observable social reality and the results can be considered as
those produced by the physical and natural scientists (Remenyi et al., 1998:32; cited by Saunders
et al., 2000).
2.3 Research Approach
Basically, there are two broad research approaches: deductive and inductive. Deductive or top-
down approach begins with the interesting theory and works through observations to find the
results, which do or do not align with the hypotheses. In contrast, inductive or bottom up
approach works from particular observations, which are more open-ended, to develop a new
theory (Trochim, 2006).
8Deductive approach emphasizes scientific principle and concentrates on quantitative and valid
data to explain causal relationship between variables while inductive approach considers the
meaning of human relating to events with a close understand of the research context, involves
qualitative data and less concerns with the need to generalize (Saunders et al., 2000).
When applied to this study, from the theories and move to testing of quantitative data to find out
the results that can prove hypothesis, the deductive approach is compatible for the research.
2.4 Research Method
Qualitative or quantitative methods are choices for analysis of a study, depending upon the
research objective. Data collection is one of the differences to categorize qualitative and
quantitative methods. It is simply to say that qualitative data contains words while quantitative
data contains numbers. Rather than the data, the other difference is assumption of the research.
Qualitative method deals with exploratory and inductive approach while quantitative method
involves confirmatory and deductive approach (Trochim, 2006).
List (2006) addresses some useful conditions to differentiate qualitative and quantitative
methods. Qualitative method’s conditions are non-existing topic research, uncertainty of the
measurement, non-clear assessment concept and exploring of something. On the other hand,
quantitative method’s conditions are confirmatory research topic, trend measurement, clear
assessment concept and using of ratio or ordinary scale.
To answer the research questions of the study, data gathering mostly deals with numbers, and
analysis sections are based on the existing theories. Therefore, according to conditions above, it
can say that quantitative method is used for this paper. The case study is applied for the research.
According to Yin (1989), the unique strength of case study is its ability to deal with various kinds
of evidence, and the case study is preferred investigating contemporary events of which the
relating behaviors cannot be manipulated.
2.5 Data Collection
Selection of the case study starts at what regions of the airline industry are chosen. Europe and
the U.S. are the results of the selection because the European and the U.S. air transport markets
are mature. There are numbers of low-cost and traditional airlines operated for certain periods,
and their stocks trade on the markets. For other regions in the global, low-cost markets have just
started and even though there are number of operating low-cost airlines, the airlines’ own to
entrepreneurs and seldom traded on the stock markets. In addition, for comparable purpose, the
European and the U.S. financial reports are compatible in term of accounting methods.
The case study limits to six airlines due to time constrain of the study period. The six airlines,
dividing into two groups: low-cost and traditional airlines, are selected based on the profitability
and passengers traffics, according to the statistical numbers shown in the book “Global Airlines”
(Hanlon, 2007). Two low-cost and two traditional airlines selected operate in Europe while one
low-cost and one traditional airline selected operates in the U.S. Details of the case study selected
are summarized below.
9Type Airline Headquarter Based
Traditional Airline British Airways Europe
Traditional Airline Continental Airlines The United States
Traditional Airline Lufthansa Europe
Low-cost Airline EasyJet Europe
Low-cost Airline JetBlue Airways The United States
Low-cost Airline Ryanair Europe
For sources of evidence, Yin (1989) categorized six sources for data collection of the case studies
as documentation, archival records, interviews, direct observations, participant-observation, and
physical artifacts. Multiple sources of data are considered to this study, which consist of
documentation and archival records. The documentary information includes related books and
articles while the archival records include service records, organizational records, maps and
charts, survey data, etc.
All books and articles relating to accounting and financial theories, including literatures of the
airline industry are available on the internet, and at the Umeå University’s library as well as the
library’s database.
The financial information of six airlines are extracted from the annual reports of individual airline
published on the airline’s website from the year 1996 to 2006, which the length of years varied
depending on individual airline. Additional financial data and the stock prices are taken from
several websites, i.e. yahoo finance, MSN money, advfn, Reuters and google finance. Statistical
financial data, i.e. risk-free rate or market returns, is gathered from Datastream Advance.
Furthermore, to perform ratio analysis and equity valuation, the author uses the software
application called Business Analysis & Valuation Model (BAV Model) developed by Professor
Paul Healy and Professor Krishna Palepu, copyright of Harvard Business School.
10Chapter 3 Theoretical Framework
This chapter presents different theories relating to investment and fundamental analysis. Brief
background of market efficiency and investment style are determined, including the relations of
market efficiency and fundamental analysis. Then, conceptual framework of financial statement
analysis, as part of fundamental analysis, is addressed and stated details and relations in ratio
analysis and valuation analysis. Some empirical study linking to the mentioned theories are
included accordingly.
3.1 Market Efficiency
In a stock market, an investor would like to earn not only normal returns, but also abnormal
profits or beating the market. Refer to the efficient market hypothesis (EMH), the stock is traded
at its fair value, and this implies no abnormal profits opportunity offered.
The EMH can be categorized into three types when considers in term of available information
affect the stock prices (Bodie et al., 2005). Details are stated as follows.
The weak form hypothesis describes that the stock prices reflect all historical prices and other
security market data, i.e. trading volume and historical rate of return, etc. This hypothesis implies
that the technical analysis is not useful for beating the market (LeBaron, 1999). But, the weak
form efficiency theoretically supports that fundamental analysis can be used to identify
undervalued/overvalued stocks and provides abnormal returns (Janssen et al., n.d.). The technical
analysis and the fundamental analysis are briefly summarized below.
Under the semi-strong from hypothesis, the stock prices reflect all available public information.
For this hypothesis, neither technical analysis nor fundamental analysis is useful for beating the
market.
The strong form hypothesis describes that the stock prices reflect all information, both public and
inside, relating to the firm. With this hypothesis, the inside information is not useful for beating
the market.
For different forms of information regarding the above hypotheses, figure 1 shows relationship
among the weak form, the semi-strong form and the strong form.
11Figure 1: Information Relationship of Weak-form, Semistrong-form and Strong-form
All information relevant to the stock
(strong-form)
Information set of publicly
available information
(semistrong-form)
Information
set of
past price
(weak-form)
Source: Ross et al. 2005, 356
In the market efficiency, the stock price should follow random walk, and change unpredictable. If
the stock price is predictable, the market becomes inefficient because the price will not reflect
available information (Ross et al., 2005).
Technical Analysis
Technical analysts believe there are systematic statistics concerning the stock prices, or the
history tends to repeat itself, so they study the past prices and look for the pattern including
possible correlations in order to predict the stock prices (Bodie et al., 2005).
There are several methods to perform technical analysis such as market timing, filter rules,
relative strength, line and bar charts, and moving average of stock prices over the past periods,
etc (LeBaron, 1999).
Even though the technical analysts realize that information regarding future economic possibility
of the firm is valuable, they believe the stock price is more sensible to psychological factors than
fundamental factors. This can say as the key success of the technical analysis (Bodie et al., 2005).
The Dow Theory, by Charles Dow (who established The Wall Street Journal), developed in the
late nineteenth, is the famous technical analysis study. The theory uses to identify long-term trend
of the stock prices, which key indicators of the theory are the Dow Jones Industrial Average
(DJIA) and the Dow Jones Transportation Average (DJTA) (Bodie et al., 2005).
If investors find that the stock price follows the trend predicted by the Dow theory, they will buy
the stock at low prices and sell it when the prices increase. If most investors perform in the same
12way, the pattern of the prices will be self-destruction and the theory will be invalid (Bodie et al.,
2005).
There are number of studies relating to technical analysis and most of them shown that technical
analysis is useless for predicting the stock prices, however, some of the studies mentioned
technical anomalies, which may give a hope for technicians even though disadvantage of
transaction costs remains the issue.
Fundamental Analysis
Fundamental analysts use the fundamental analysis as a tool to recommend investors to buy or
sell the stock based on comparing value of the firm to its stock price. Financial statements
supplemented with future economic prospect of the firm are the sources using for the
fundamental analysis.
As fundamental factors consist of quantitative and qualitative information, the analysts should
conduct both quantitative and qualitative analyses to complete the fundamental analysis for any
stocks. Quantitative information relates to numerical data, which can be found in the financial
statements, so quantitative analysis can be done precisely. On the other hand, it is more difficult
to extract qualitative factors because the information is less tangible or relates to quality things
such as quality of the management or brand-name recognition. Therefore, doing qualitative
analysis is more difficult but considers important not less than doing the quantitative analysis
(Janssen et al., n.d.).
Janssen et al. (n.d.) refer the good example for importance of qualitative analysis, represents with
the Coca-Cola Company. For Coke’s stock valuation, doing only the quantitative analysis cannot
be complete because the qualitative analysis on Coke’s brand recognition is a must to undertake.
If investors would like to have superior rate of returns by using fundamental analysis, they need
to find firms not only are good, but also better than everyone else’s estimate. Investors in the
market generally can find good firms, but discovering better firms are the challenge. This is the
difficulty of fundamental analysis. Investors can make superior returns when their analyses are
better than others according to the same public available information (Bodie et al., 2005). Warren
Buffett, as the famous example, has been successful for years by using fundamental analysis to
pick up right stocks and earn abnormal returns (Janssen et al., n.d.).
3.2 Investment Strategy
There are many factors affect to individual’s investment such as income, age, risk tolerance,
financial goal, or tax bracket (Palepu et al., 2000). Investors who expect high rate of returns
should have higher risk tolerance degree than ones who expect lesser returns.
Investors can manage their portfolios by themselves or choose another way of investment.
Mutual funds are other popular choices for the investors who would like to have professional
teams managed their money instead. There are wide ranges of fund types that the investors can
select in order to match their investment objectives. Major investments of mutual funds are
included in money market, debt instruments, equity market, mixture of money market, debt
instruments and equity market (Palepu et al., 2000).
13All investment relates to the risk. The investment with higher risk is potential to have a higher
return. Investors may protect themselves from the risk by using the diversification strategy. It is
important for the investors to know degree of risk tolerance they can afford to avoid the trouble
by investing with over degree of risk.
The two most important factors concerning risk are time horizon and investor’s discipline.
According to Rowland (n.d.), the suitable time horizon is ten years and if the investor leaves the
money in the stock alone for such period, the money will grow in the best return.
3.2.1 Active and Passive Strategies
Investors who use the active strategy on the investment believe that they can seek for superior
rather than average returns in the markets. Active investors search out relating information they
think it is valuable, and use various methods including fundamental analysis, technical analysis,
and macroeconomic analysis in order to obtain such superior profits on investment (Evanson,
n.d.).
The passive investors choose buy-and-hold strategy rather than look for undervalued stocks to
make superior profits. Advocates of passive strategy believe in the EMH, which stocks are traded
at the fair values and with all available information, it is not useful to buy and sell stocks
frequently because high brokerage fees will decrease returns on the portfolio (Bodie et al., 2005).
Lower costs on trading frequency are the substantial advantage of the passive strategy over the
active strategy.
3.3 Financial Statement Analysis
Financial statements provide primary information of economic consequences of the firm’s
business activities (Palepu et al., 2000). From economic factors transformed into accounting
numbers, financial statements report data of assets, liabilities, income and cash flow that are
useful to all users (White et al., 1998). Even though major users of financial statements are
investors that a firm seeks for its capital, the financial statement are also used for other purposes
from analysts inside to outside the firm including governments that use the financial statements in
social and economic policy-making (Penman, 2007).
Users of financial statements should concern not only business activities affect the financial
reports, but also accounting system plays the important role on this published information. Palepu
et al. (2000) summarize three features of accounting systems influenced the financial statements;
accrual accounting basis, accounting standard and auditing and the last feature, managers’
reporting strategy, which can be an important tool to manipulate investors’ perceptions.
The analysis of financial statement will help investors and other stakeholders understand the
firm’s business and make better economic decisions (White et al., 1998). Penman (2007: 2)
defines financial statement analysis as:
‘Financial statement analysis is the method by which users extract information to answer their
questions about the firm.’
14The framework of fundamental analysis using financial statements consists of four related steps:
business strategy analysis, accounting analysis, financial analysis and prospective analysis
(Palepu et al., 2000). The most important part of fundamental analysis is developing forecast of
future payoff (earnings) or the step of prospective analysis because future earnings are one of the
key elements to find the firm’s value (Penman, 2007).
3.3.1 Strategy Analysis
Refer to Palepu et al (2000), strategy relates to how a firm’s managers can create ideas to
increase profits or financial performance with sustainability. The ideas may be development on
new products/services, new distribution channels or improving competitive advantage. Strategy
analysis, therefore, is evaluation of such ideas and is the first step of financial statement analysis.
The purpose of business strategy analysis involves qualitative analysis of the firm’s key profit
drivers and business risk in order to assess the firm’s current performance and its sustainability
for forecasting future performance. Strategy analysis relates to analyzing in three factors: industry
analysis, competitive analysis and corporate analysis.
Industry analysis involves key drivers of the industry’s profitability and forecasts the possible
change in the future. The said profitability is influenced from existing competitors, barriers of
new entrants, substitute products, and power of buyers/suppliers.
For competitive analysis, there are two strategies that the firm may use for competing in the
industry, which are cost leadership or differentiation.
Analysts perform corporate analysis by examining how well the firm can create value through
doing several businesses at the same time. If the firm runs multiple businesses efficiently, its
value will be created by cost reduction or revenue increase. The key feature for analysts to
perform strategy analysis is to assess the sustainability of the firm’s strategies.
Strategy analysis is useful for further financial statement analysis. For accounting analysis, the
firm’s accounting policies and estimates should be in line with its strategy, for instance, the firm
sells products to low-income customers should have high allowance for bad debt expenses. For
financial analysis, the cost leadership firms expect to have lower gross margin and higher asset
turnover, comparing to differentiation strategic firms. For prospective analysis and valuation,
strategy analysis helps to assess how long the difference of performance between the firm and the
industry exists, and helps to forecast the firm’s investment in order to maintain its competitive
advantage.
3.3.2 Accounting Analysis
The purpose of accounting analysis is to evaluate the firm’s accounting quality, and assess the
distortion level according to accounting numbers. Refer to Palepu et al. (2000), doing accounting
analysis consists of six key steps as follows:
- Identify and evaluate key accounting policies and estimates to measure the firm’s key
success factor and risk in accordance with the firm’s strategy, for instance how accurate a
leasing company estimates the residual values of leased equipment.
15- Assess degree accounting flexibility. For example, the firm has choices for inventory
accounting policies of LIFO, FIFO or average cost. Managers may use policy, resulting in
good operating performance but not suitable to business characteristics.
- Evaluate accounting strategy. Analysts may use the following questions to evaluate the
firm’s accounting strategies:
o Are accounting policies similar to others in the same industry?
o Does management use accounting policies or estimates to hide some information,
i.e. management stock option, violation of bond covenants?
o Does the firm change accounting policies or estimates, and are they reliable, and
what is the impact?
- Evaluate the quality of disclosure. Generally there are minimum disclosures required for
the financial statements but the choices to provide adequate information to assess the
firm’s business strategies and its economic consequences are in the consideration of the
firm.
- Identify potential red flags of questionable accounting quality. These indications helps
analysts to investigate such items closely, for instance unexplained transactions that boost
profits, unusual increase in account receivables and sales, etc.
- Undo accounting distortion. If the financial numbers are misleading, analysts should
adjust the numbers to reduce the distortion. The cash flow statement and financial
footnotes are the guidance to restate the financial numbers.
Performing accounting analysis is useful in perspective of reliable conclusion from the financial
analysis, the next step of financial statement analysis (Palepu et al., 2000).
3.3.3 Financial Analysis
Continue to the third step of financial statement analysis: financial analysis. The traditional
analysis to see how efficient a firm engages the operation is to analyze its financial statements.
Two major tools using for this analysis are ratio analysis and cash flow analysis (Palepu et al.,
2000). This research will focus on ratio analysis and cash flow analysis will not be discussed.
3.3.3.1 Ratio Analysis
Basically, an investor would like to see the profitability and growth of a firm through the period
of investment. Assessment of the firm’s profitability and growth by ratio analysis will help the
investor to get wider pictures on measurement of the firm’s value. Ratio analysis can be used by
(Palepu et al., 2000):
- comparison actual with historical ratio
- comparison of the firm’s ratio with to others’
- comparison with the benchmark ratio
Ratio analysis is also useful when financial analysts would like to work from historical ratio to
forecast future performance and determine the firm valuation.
Ratio analysis concerning the firm’s sustainable growth is shown in the following framework.
16Figure 2: Sustainable Growth Rate Framework
SUSTAINABLE
GROWTH RATE
Dividend Payout
ROE
Operating ROA Financial
Leverage Effect
Net Operating Operating Asset Spread Net Financial
Profit Margin Turnover Leverage
Gross profit margin Operating working Net effective interest Debt/Equity
SG&A/Sales capital turnover rate Cash and marketable
R&D/Sales Operating long-term Interest income/Cash securities/Equity
Effective tax rate on asset turnover and marketable Interest coverage
operating profits Receivables turnover securities - earnings basis
Inventory turnover Interest expenses/Total - cash basis
Payables turnover debt
PP&E turnover
Source: Palepu et al. 2000, 9-21
Key financial ratios to be discussed in this research are:
- Return on equity
- Operating return on assets
- Net operating profit after tax
- Operating asset turnover
- Spread
- Net financial leverage
- Sustainable growth rate
Return on Equity (ROE)
ROE = Net Income e
Shareholder’s equity
Return on equity is the comprehensive ratio of the firm because it shows how well managers use
the firm’s asset to create returns to shareholders. ROE of the firm generally relates to the cost of
17capital. In the competition market, ROE should not be significantly higher than the cost of
capital. The attractive high ROE over the cost of capital will bring competitors into the industry
and consequently, ROE will be down to the normal level: its cost of capital. On the other hand,
ROE is driven by two main factors: return on net assets (ROA) and financial leverage, which can
be derived in details as (Palepu et al., 2000):
ROE = ROA x Financial leverage
or = Net income x Assets s
Assets Shareholders’ equity
where ROA = Net income x Sales s
Sales Assets
So we can say that the profitability earned by the firm’s assets and assets generated from
shareholders’ investment are the main composition of ROE.
Operating Return on Assets (Operating ROA)
Operating ROA = NOPAT x Sales s
Sales Net assets
As we can see on the above diagram, ROA is one of the drivers on ROE. ROA is measured with
net income divided by total assets. Net income includes interest income net of interest expenses
while total assets include operating assets and financing assets. Amount relating to financial
activities will be consequences of financing decision, therefore, in practical way operating ROA
is widely used to measure operating profit of the firm acquired by its operating assets. Operating
ROA usually is compared with the firm’s weighted average cost of debt and equity capital
(WACC). In the long run and in the competitive market, operating ROA will lie on the same
level of WACC, which is lower than ROE (Palepu et al., 2000).
Net Operating Profit after Tax (NOPAT)
NOPAT margin = NOPAT
Sales
where NOPAT = Net income + Net interest expenses after tax
NOPAT margin drives operating ROA, and NOPAT margin is the profitability excluding interest
income and interest expenses derived from sales. NOPAT margin shows the firm’s operating
results without consideration in debt lines, similarly to EBITDA margin (earnings before interest,
taxes, depreciation and amortization divided by sales), which EBITDA intends to focus on cash
operating transactions. But, EBITDA may mislead with depreciation because depreciation is
perceived as the real operating expense (Palepu et al., 2000).
18Operating Asset Turnover (ATO)
ATO = Sales s
Net assets
The other driver of operating ROA is operating asset turnover. The ratio represents how the firm
can generate sales with its operating assets. The operating asset turnover ratios of some firms are
dramatically higher than others in the same industry because rather invest in property, plant and
equipment, they rent their fixed assets (Palepu et al., 2000). The better ratio in operating asset
turnover yields the better operating ROA, if NOPAT margin of compared firms are similar, and
yields better ROE.
Spread
Spread = Operating ROA – Net interest expense after tax
Debt – (Cash + Short-term investments)
Net interest expense after tax = (Interest expense – Interest income) x (1 –Tax rate)
The financial management is the other key to drive ROE if the firm has cost of liabilities less than
earnings from investment. Financial management affected to ROE consists of spread and net
financial leverage. If the firm has debt in its capital structure, they need to pay cost of
borrowings, and to get the positive spread the cost of borrowings must be less than the operating
ROA. If the firm cannot earn operating returns over its interest expenses, ROE of the firm will
decrease by the negative spread.
Net Financial Leverage
Debt-to-equity ratio = Short-term debt + Long-term debt
Shareholders’ equity
Net financial leverage = Interest-bearing debt – (Cash + Short-term investments)
Equity
The firm can create shareholder value through the high net financial leverage. High level on debt
will increase the net financial leverage ratio and when multiply the financial leverage to the
positive spread, the firm will get the high ROE. However, too much debt may cause the firm into
the business risk. The firm needs to bear not only a large amount of interest expenses, but also the
risk on financial distress, or restriction on its operations required by borrowers (Palepu et al.,
2000). Once the firm has cost of borrowings greater than the operating ROA, spread will result a
negative value and ROE will decrease accordingly.
19Sustainable Growth Rate
Sustainable growth rate = ROE x (1 – Dividend payout ratio)
Dividend payout ratio = Cash dividend paid
Net income
The sustainable growth rate, linked by all the above discussed ratios, is the comprehensive ratio
that analysts use to assess the firm (Palepu et al., 2000). There are several key drivers impacted
the sustainable growth rate. The firm may focus on its operating ROA, or use the financial
policies to drive the sustainable growth. The firm may have zero payout to maintain its
sustainable growth rather than distribute dividends to shareholders.
3.3.4 Prospective Analysis: Forecasting
To conduct forecasting of the firm’s future performance, analysts use historical and current data
in financial statements along with setting possible and reliable assumptions to convert projected
financial statements. Forecasting is considered as the most important process of fundamental
analysis. As forecasting involves uncertain estimation in the future, analysts practically forecast
the firm’s performance not for long-term (Penman, 2007).
According to Palepu et al. (2000), the best way for future forecast is to do it in a comprehensive
approach. Generally only few key drivers, for instance sales and profit margin, drive forecasting
numbers in most cases. Behaviors of the key accounting numbers are the good starting points for
checking reasonable and complete forecast, which consist of:
- The behavior of sales growth
- The behavior of earnings
- The behavior of return on equity and its components
The average financial statistic should take into a consideration in the forecasting process (Palepu
et al., 2000). The financial information may be forecasted with deviation from the average,
depending on the reasons driven.
Reasonable assumptions are important for undertaking forecast in order to produce reliable future
payoffs. Too optimistic forecast will lead to overstate earnings and result in superior valuation,
which may be unreliable for investors.
3.3.5 Prospective Analysis: Valuation Analysis
The final step of prospect analysis is valuation, which the forecast is converted into estimated
value of the firm. Generally business decisions, either inside or outside the firm, involve
valuation analysis (Palepu et al., 2000). For instance decision on capital budgeting or strategic
planning within the firm will affect the value. Analysts outside the firm undertake the firm’s
valuation analysis to recommend buy or sell decisions.
20You can also read


