Technological Disruptiveness and the Evolution of IPOs and Sell-Outs - Events
←
→
Page content transcription
If your browser does not render page correctly, please read the page content below
Technological Disruptiveness and the Evolution of
                      IPOs and Sell-Outs
                Donald Bowen, Laurent Frésard, and Gerard Hoberg∗

                                       September 19, 2018

                                             ABSTRACT

             We show that the recent decline in IPOs in U.S. markets is explained by changes
         in the technological disruptiveness of startups, which we measure using textual
         analysis of patents from 1930 to 2010. We focus on startups backed by venture
         capital and show that startups with disruptive technologies are more likely to exit
         via IPO and are less likely to exit via sell-out. This is consistent with IPOs being
         favored by firms with the potential to carve out independent market positions with
         strong defenses against rivals. We document an economy-wide trend of declining
         technological disruptiveness since World War II that accelerated since the late 1990s.
         These trends predict fewer IPOs and more sell-outs, and we find that 20% to 60%
         of the recent dearth of IPOs, and 55% of the surge in sell-outs, can be attributed
         to changes in firms’ technological characteristics.

       Key words: Initial Public Offerings (IPOs), Acquisitions, Sell-Outs, Technology,

        Disruptiveness, Venture Capital

       JEL classification: G32, G34, G24

   ∗
    Virginia Tech, the University of Lugano, Swiss Finance Institute, and University of Maryland, and the
University of Southern California respectively. Bowen can be reached at donbowen@vt.edu, Frésard can
be reached at laurent.fresard@usi.ch, and Hoberg can be reached at hoberg@marshall.usc.edu. We thank
Sunil Muralidhara and Lauren Phillips for excellent research assistance. For helpful comments, we thank
Adrien Matray, Francesco D’Acunto, Francois Degeorge, Francois Derrien, Francesco Franzoni, Xuan
Tian and seminar participants at Bocconi University, the CCF conference in Bergen, the SFI Research
days, Universita Cattolica, Texas Christian University, Tsinghua University, CKGSB, the University of
Lugano, the University of Zurich, and Virginia Tech. All errors are the authors’ alone. All rights reserved
by Donald Bowen, Laurent Frésard, and Gerard Hoberg.
I Introduction
Since the late 1990s, the number of initial public offerings (IPOs) in U.S. markets has
sharply declined. Over the same period, the number of private firms exiting via acquisi-
tions (i.e., trade sales) has soared. Successful startups are nowadays more likely to sell
out to other (public or private) companies than seek independent public listings. Many
observers in the media and policy circles worry that these trends reflect a general erosion
in the ability of U.S. financial markets to spur economic growth and spread its benefits
across the general public.1 Recent studies indicate, however, that the dearth of IPOs is
unlikely due to regulatory changes affecting public firms (Gao, Ritter, and Zhu (2013)
and Doidge, Karolyi, and Stulz (2013)) and is partly explained by changes in regulations
affecting the financing ability of private firms (Ewens and Farre-Mensa (2018)). Under-
standing the underlying mechanisms driving the decline in IPOs remains of paramount
importance as the assessment of competing policy responses depends critically on this
microfoundation.
In contrast to existing regulation-based explanations, we show that the recent shift
from IPOs to trade sales is strongly related to a decline in firms’ technological disruptive-
ness. Our analysis builds on the long-standing idea that exiting through an IPO or by
selling out to another firm depends on which exit type enhances the growth potential of
successful private firms (Bayar and Chemmanur (2011) or Gao, Ritter, and Zhu (2013)).
Accordingly, we predict that private firms that can develop an independent market pres-
ence by creating new markets or disrupting existing ones with patented technologies are
more likely to exit and scale up through a public listing.2 In contrast, firms with less
disruptive technology, such as technology that can improve existing products, are more
likely to sell out and thus expand within the boundaries of existing firms that can more
efficiently scale these technologies. We show that the overall technological disruptiveness
1
See for instance “The endangered public company: The big engine that couldn’t,” The Economist
(May 19, 2012) or “US stock markets seek depth in IPO pool,” Financial Times (January 9, 2018).
2
Consistent with this idea, Darby and Zucker (2018) show that biotechnology firms go public when
they have a science base that can be successfully commercialized, Chemmanur, He, He, and Nandy
(2018) report that manufacturing firms are more likely to go public than sell out when they already have
a strong product market presence (i.e., market share), Poulsen and Stegemoller (2008) and Cumming
and Macintosh (2003) show that firms with more growth potential favor exit through IPOs.
1of U.S. firms has significantly decreased in recent years, leading to fewer IPOs and more
trade sales.
We study the exit strategies of a large sample of U.S. startups backed by venture
capitalists (VCs), because detailed data enables us to precisely link startups’ choice of
exits (i.e., IPO or sell-out) to the patents they file with the U.S. Patent and Trademark
Office (USPTO).3 We use the text in patents to develop a novel measure of technolog-
ical disruptiveness, that is, a patent’s ability to create new markets or generate radical
changes in existing ones (Abernathy and Utterback (1978)). Specifically, we define the
technological disruptiveness of a given patent by the intensity with which its text contains
vocabulary that is new and fast-growing compared to existing knowledge. For example,
genetics-related words such as “peptide”, “clone”, or “recombinant” are newly and in-
creasingly appearing in patents in 1995. We thus define patents that extensively employ
such words in 1995 as more disruptive.4 As they contain pioneering and fast growing ideas
that are legally protected, firms holding more disruptive patents are likely to radically
change markets and capture valuable competitive advantages.5 We posit that these firms
are more likely to go public.
Consistent with recent evidence suggesting that new innovative ideas are getting harder
to discover and develop (Jones (2009) and Bloom, Jones, Reenen, and Webb (2017)), the
average disruptiveness of U.S. patents has markedly declined since 1950, except for tem-
porary spikes during the 1970s (i.e., computer revolution) and the 1990s (i.e., the internet
revolution). A simple comparison of the aggregate evolution of our measure of technolog-
ical disruptiveness against that of private firms’ exits over the last four decades strongly
suggests that IPOs are more prevalent when innovation is more disruptive, whereas trade
sales prevail when innovation is less disruptive.
We confirm this interpretation at the micro-level by exploring whether the technolog-
3
In addition, VC-backed startups account for a large fraction of the IPO and acquisition market (Ritter
(2017)) and produce a substantial share of innovation in the economy (Gornall and Strebulaev (2015)).
4
With our text-based approach, we classify unambiguously important inventions such as the jet engine,
transistor, laser, satellite, or more recently PageRank (Google) as highly disruptive.
5
In line with this conjecture, we show that disruptive patents attract significantly more citations and
higher stock market valuation upon publication by the USPTO.
2ical disruptiveness of VC-backed startups explains the choice of exit. We focus on VC-
backed startups that receive at least one patent over the 1980-2010 period and compute
the technological disruptiveness for each startup-quarter based on all patents received in
the previous five years. We thus obtain a large panel of 561,982 startup-quarter observa-
tions representing 13,679 distinct startups and 506,096 patents. Using a competing risks
regression model that accounts for possible interdependences between exits (i.e., IPO or
sale), we find strong evidence that startups with more disruptive patents are significantly
more likely to go public and less likely to sell out. The link between technological disrup-
tiveness and startup exits is economically large, as a one standard deviation increase in a
startup’s technological disruptiveness is associated with a 21.8% increase in its IPO rate
and a 17.9% decrease in its rate of exit through trade sales.
These results remain after controlling for startups’ age, size, existing characteristics
of patent portfolios (e.g. citations and originality), financing rounds, and overall finan-
cial market conditions. They also hold in specifications with fixed effects that absorb
variation within startup cohorts, geographic locations, and technological expertise.6 Fur-
thermore, we provide additional evidence supporting the validity of our new measure of
startup technological disruptiveness and its role in explaining IPO rates. For example,
we delineate each startup’s product market based on the textual similarity between its
business description and the 10-K business descriptions of publicly traded firms. As direct
validation of our measure, we find that the publicly traded firms that are most similar to
a given startup discuss market disruption significantly more when that startup displays
high level of technological disruptiveness. Alternatively, we show that among startups
exiting through IPOs, those with more disruptive technologies exit into less stable and
more competitive markets that intuitively offer greater opportunities for disruption.
We also find that startups’ exit choices are related to other novel text-based techno-
logical measures. For instance, we define the technological “breadth” of each patent as
the intensity with which its text combines vocabulary from diverse bodies of knowledge
6
Our results are also robust to changes in econometric specifications that vary the horizon over which
we measure exits (ranging from the next quarter to the next five years), and to focusing on the early part
of the sample to limit potential truncation bias relating to startup resolution and patent grants (Lerner
and Seru (2017)).
3(as opposed to specialized knowledge). Startups with more technological breadth are
more likely to exit via IPO and less likely to sell out, consistent with the idea that less
specialized technology is less redeployable toward other uses. We also construct various
measures of technological “similarity” by directly comparing a patent’s vocabulary to the
vocabulary used by different groups of firms. In line with Phillips and Zhdanov (2013)
and Wang (2017), we show that startups with patents that are more similar to that of
lead innovators (e.g., IBM, Microsoft, or Intel in the 2000s) are more likely to sell out. In
contrast, sell-outs are less likely for startups having patents that are more similar to that
of other private or foreign firms, consistent with the notion that a firm is less likely to be
an acquisition target when there are more alternative targets.
Given our finding that technological traits such as disruptiveness explain the choice of
exit as IPO or trade sale in the cross-section, it is natural to examine the economy-wide
time-series properties of these variables. The central question is whether dramatic changes
in technological traits can help to explain the dearth of IPOs and the surge in trade sales
observed in recent years. We thus proceed with a two step procedure inspired by the
disappearing dividends literature.7 We first estimate our cross-sectional exit models over
an initial period 1980-1995 and predict average IPO and sell-out incidence rates over the
1996-2010 period. Second, we compute average predicted values from this model in an
out-of-sample period (1996-2010) and compare the average model’s predicted rate of IPO
exits to the average actual rate of IPO exits in this later period.
When our technological characteristic variables are excluded from the model, the aver-
age predicted IPO incidence is 0.63% per quarter, whereas the actual IPO incidence rate
is 0.34%, confirming the existence of the disappearing IPOs anomaly. When we including
our technological characteristics, the predicted IPO incidence rate decreases materially
to 0.57%. Furthermore, the explanatory power of these technological changes is not sen-
sitive to the periods used to estimate and predict the models, or the lags between the
measurement of startup technological traits and predicted exits. We conclude, across sev-
7
This methodology was used by Fama and French (2001) and Hoberg and Prabhala (2009) to explain
disappearing dividends, and more recently by Bates, Kahle, and Stulz (2009) to explain increasing cash
holdings.
4eral specifications, that changes in technological characteristics explain roughly 20% of
the overall decline in IPO rates. A similar analysis reveals that changes in technological
traits explain roughly 55% of the recent rise of trade sales.
We further propose that the ability to create disruptive technologies is not uniform
across industries, as the difficulty of creating disruptive inventions is likely convex as
industries mature.8 A consequence is that any residual ability to create new inventions
should vanish at increasing rates as industries mature, and initial industry conditions
regarding the product life cycle become crucial in predicting the future IPO rate. We
consider the product life cycle in Abernathy and Utterback (1978) and posit that markets
in transition or those reaching maturity (e.g., markets that have reached a dominant
product design) are likely to experience the most extreme decline in IPO rates. On the
other hand, very young “fluid” markets are more likely to have high IPO rates that likely
grow during the earliest years as competing disruptive product designs and inventions
require some initial “time to build”.
We follow Hoberg, Phillips, and Prabhala (2014) and compute the degree of product
market fluidity in each firm’s product market. For our VC-backed startups, we use the
business description text, which is observable at the time of “first money”. We find strong
evidence that IPO rates do decline faster as product markets mature as our technological
characteristics explain an economically large 60% of the decline in IPOs in markets with
below median product stability. In contrast, we only explain 10% of the decline in fluid
product markets. Looking to the future, the IPO rate will likely depend critically on the
extent to which new fluid industries emerge (such as those based on artificial intelligence,
fintech, and other new technologies) and the extent to which existing industries stabilize.
Established industries, in particular, should experience persistently declining IPO rates.
Our analysis adds to a growing literature that considers changing market conditions
and the link to the disappearance of IPOs and the rise of trade sales.9 Ewens and Farre-
8
The intuition for this assumption is that the most logical inventions are discovered first. As industries
mature, the best ideas become “picked over” and later inventions arise only with very high search costs.
9
Ritter and Welch (2002) and Lowry, Michaely, and Volkova (2017) provide comprehensive surveys of
the literature on IPOs.
5Mensa (2018) suggest that the IPO decline results from the increased bargaining power
of founders (over investors), their preference for control, and inexpensive capital in the
private market. Gao, Ritter, and Zhu (2013) suggest that the decline in IPO originates
from changes in market structure that favor selling out to realize economies of scope.
Doidge, Kahle, Karolyi, and Stulz (2018) argue that an increased focus on intangibles also
plays an important role. Our paper shows that changes in technological traits (especially
disruptiveness), which strongly explain exit methods in cross section, can also explain the
decline in IPOs and the rise of trade sales in time series. To our knowledge, our paper
is the first to quantify how much of the observed trends are attributable to changes in
firms’ technological characteristics. Although more work is needed to draw clear policy
recommendations, our findings suggest that the decline in IPOs might be particularly
unresponsive to policy changes, with subsidies to innovative entrepreneurs being perhaps
a possible exception.
Our findings also add to the literature studying the determinants of startup exits. Ex-
isting research indicates that the exit choice of startups depends on founders’ private ben-
efits of control, product market presence, and growth potential (Cumming and Macintosh
(2003), Bayar and Chemmanur (2011), Poulsen and Stegemoller (2008) or, Chemmanur,
He, He, and Nandy (2018)). Our analysis emphasizes the importance of technological
characteristics including disruptiveness, breadth, and similarity to economically relevant
firms.
II Text-based Technological Characteristics
In this section, we describe the patent data and explain the construction of our new
measures of technological characteristics based on patent text.
A Patent Text
We use a web-crawling algorithm to gather information from Google Patents for all
6,850,075 patents that were applied for between 1930 and 2010 and granted by 2013.
For each patent, we gather the publication date, application date, names of inventor(s),
and initial assignee(s). We also collect the full patent text and information on the tech-
6nology classification of the patents by converting the U.S. Patent Classification (USPC)
into the two-digit NBER technology codes created in Hall, Jaffe, and Trajtenberg (2001).
Since we are interested in measuring the technological changes pertaining to the corporate
sector, we categorize each patent into groups based on four types of applicants: U.S. pub-
lic firms, U.S private firms, foreign (private or public) firms, or others (e.g., universities
or foundations). For brevity, we describe this classification method in Appendix A.
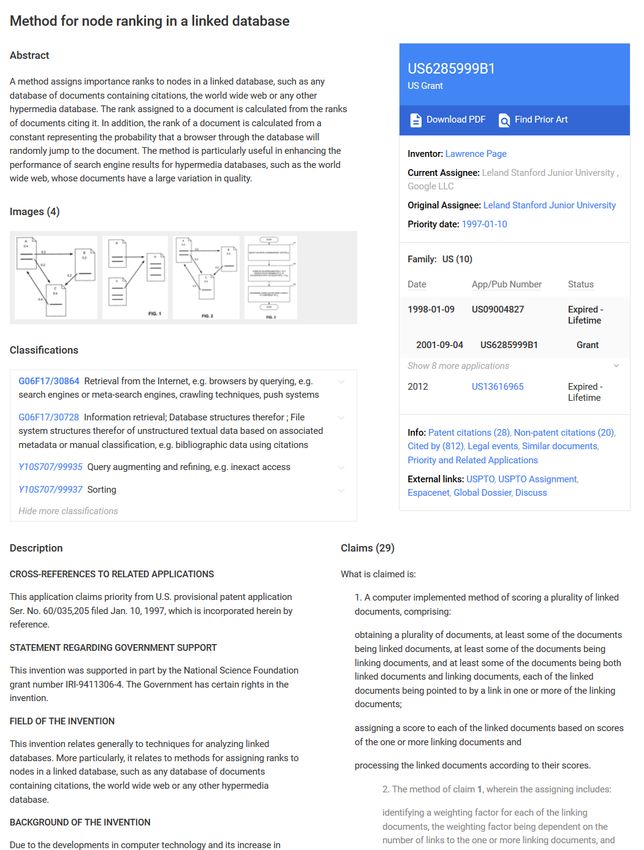
[Insert Figure I about here]
The full text of each patent consists of three distinct sections: abstract, claims, and
patent description. The claims section defines the scope of legal protection granted. The
description section explicitly describes the characteristics of the invention/innovation.
It typically includes a title, technical field, background art, specification example, and
industrial applicability. The abstract contains a summary of the disclosure contained in
the description and claims sections. Figure I presents an example of a typical patent
textual structure (#6285999, “A method for node ranking in a linked database”, assigned
to Google in 1998.). We append all three sections into a unified body of text because
earlier patents do not include all sections, and because the organization of patent text into
the three sections may have changed over time (Kelly, Papanikolaou, Seru, and Taddy
(2018) and Packalen and Bhattacharya (2018)).10
Following earlier studies constructing variables from text (e.g., Hanley and Hoberg
(2010) or Hoberg and Phillips (2016)), we represent the text of each patent as a numerical
vector with a length equal to the number of distinct words in the union of all patent
applications in a given year t. We denote this length Nt .11 Following the convention in
the literature, we eliminate commonly-used words (words appearing in more than 25%
10
These papers also use patent text to identify major ideas from each historical year based on each new
word’s intensity of use in future patents, and use these major ideas to determine whether patents use old
or new technologies. Our text-based measures differ in two important ways. First, we propose measures
capturing distinct (and complementary) dimensions of patents’ technological characteristics. Second, our
measures can be measured ex-ante, that is, using only past and current-year patents. This distinction
is important as our goal is to predict future outcomes (i.e., startups’ exits) using initial technological
characteristics without look-ahead bias.
11
We organize patents based on their application year rather than the year of the patent grant, as this
more accurately reflects the timing of innovation.
7of all patents in a given year) and rare words (words appearing only in one patent in a
given year).12 Each patent j applied for in year t is then represented by a vector Vj,t (of
length Nt ) in which each element corresponds to the number of times patent j employs
one of the unique Nt words used in year t. If patent j does not use a given word, the
corresponding element of Vj,t is set to zero. This vectorization procedure insures that all
patent applications in a given year are represented by a collection of vectors that are in
the same space (of dimension Nt ).
Due to the large number of words used across all patents in a given year, the vectors
Vj,t are quite sparse with most elements being zero. For instance, in 1980, the number
of distinct words used in an average patent is 352, and the median is 300, while there
are 400,097 distinct words used across all patent applications. In 2000, the average and
median are 453 and 338, and the total across all applications is 1,358,694.
B Technological Disruptiveness
To capture the technological disruptiveness of a given patent, we focus on the extent to
which a patent uses vocabulary that is new or experiencing rapid growth compared to
existing knowledge. Intuitively, disruptive patents are based on ideas that radically change
an industry or business strategy (e.g., new products or processes), either by creating a
whole new market or by disrupting an existing one. We thus posit that disruptive patents
use novel words that are fast-growing in the universe of patents.
To quantify disruptiveness, we rely on the rate of change in the use of each word
among all patent applications during the current and prior year. As our goal is to link
technological disruptiveness to future outcomes (i.e., startups’ exits), we construct techno-
logical disruptiveness using only text contained in all past and contemporaneous patents.
This alleviates forward-looking bias in our measure. We define an aggregate vector Zt (of
length Nt ) in each year as having elements containing the number of times a given word
is used across all patent applications in year t. This vector thus represents the aggregate
12
Given the highly technical and rapidly evolving nature of text in the patent corpus, we do not
implement additional filters (e.g. nouns only). While this choice might potentially introduce noise into
our measurements, it maintains power.
8frequency of word usage in a given year t. We then define the vector Dt as the annual
rate of change in the usage of each word (from t − 1 to t) as:13
Zt − Z̃t−1
Dt = , (1)
Zt + Z̃t−1
where division is element-by-element.
The set of annual vectors Dt thus tracks the appearance, disappearance, and growth
of specific technological vocabulary over time. Elements of Dt are positive if the usage of
the corresponding words increases from year t − 1 to t, and negative if it decreases (e.g.,
words becoming obsolete).
[Insert Table I about here]
As an illustration, Table I displays the ten words experiencing the largest increases
and decreases in use across all patent applications in specific years. For instance, in 1995,
we detect an acceleration of terms related to genetics, such as “polypeptides”, “clones”,
“recombinant” and “nucleic”, following rapid progress in genome sequencing. In that
year, use of terms such as “cassette,” “ultrasonic,” and “tape” are sharply decreasing. In
2005, the most rapidly growing words are related to the internet and include terms such
as “broadband”, “click”, “configurable”, or “telecommunications”.
To obtain the level of technological disruptiveness for a given patent j, we take the
frequency-weighted average of the vector Dt based on the words that patent j uses as
follows:
Vj,t
Tech Disruptivenessj,t = · Dt × 100, (2)
Vj,t · 1
where the operator “·” denotes the scalar product between two vectors, and “1” is a
unit vector of dimension Nt . Intuitively, patents using words whose usage surges across
all patent applications (i.e., have positive entries in the vector Dt ) have higher levels of
disruptiveness. This is the case for patents that either employ words that appear in the
13
To ensure Zt and Zt−1 are in the same space, we modify Zt−1 by adding zero elements for words
that newly appeared in year t (as they were not originally in the t − 1 space). Analogously, we modify
Zt by adding zero elements for words that appeared in year t − 1 but not year t.
9patent space for the first time, or that use words whose usage experiences fast growth
across all patents. Hence, a patent using words such as “polypeptides”, “clones”, and
“recombinant” would be classified as disruptive if its application year is 1995, but not in
2005. Symmetrically, patents relying on words whose usage decreases across all patents
(i.e., using relatively older vocabulary such as “cassette,” or “tape” in 1995) have lower
(and possibly negative) levels of disruptiveness.
C Technological Breadth and Similarities
We also develop text-based measures capturing the technological breadth of each patent,
as well as their similarities with other patents of economically linked firms. We posit that
these characteristics are also relevant in predicting startup exits.
To measure the technological breadth of a patent, we first identify words that are
strongly associated with a specific technological field using the six broad technological
fields (f ) defined by the first digit of the NBER technical classification.14 Specifically, we
count how often a given word (in Nt ) is used by patents classified into each field in each
year, and keep the two fields with the highest usage of the given word. We define a word as
“specialized” (and associated with a field f ) if its use in its most popular field is more than
150% that of its second most popular field. Each word is thus classified into one of the six
fields of specialization or it is deemed an “unspecialized” word. For instance, words such
as “bluetooth” and “wifi” are in the “Computer and Communication” field, and “acid”
and “solvent” are in the “Chemicals” field. Second, we define as wj,t,f the fraction of
patent j’s specialized words that are classified into each field f . By construction, each
wj,t,f lies in the [0,1] interval, and they sum to one for each patent j. We then define
technological breadth as:
6
X
2
Tech Breadthj,t = 1 − wj,t,f . (3)
f =1
This measure is one minus the technological concentration of the patent’s vocabulary.
Patents have higher technological breadth if they amalgamate vocabularies from different
14
“Chemicals”, “Computer and Communication”, “Drugs and Medicine”, Electricity”, “Mechanics”,
and “Others”.
10specialized technological fields and for which a wide range of knowledge is needed to
develop and understand the invention.15 In contrast, patents with lower breadth use
vocabulary that primarily concentrates on one specialized technological field.
Next, we define three measures of technological similarity by directly comparing the
vocabulary of a given patent to that of patents assigned to three specific groups: lead
innovators, private U.S. firms, and foreign firms. To do so, we rely on the concept of
cosine similarity (see Sebastiani (2002)), which is defined as the scalar product between
each patent j’s normalized word distribution vector Vi,t and a normalized word vector
aggregating the vocabulary specific to a given group of patents.16
To capture the similarity of a given patent j with patents of “Lead Innovators” (hence-
forth LI), we define LIs annually as the ten U.S. public firms with the most patent ap-
plications. This set varies over time as the importance of sectors and firms changes. LIs
include Microsoft and Intel in 2005, IBM and Motorola in 1995, General Electric and Dow
Chemical in 1985, and General Electric, Bell Telephone, and General Motors in 1935. For
each set of LIs in year t, we first identify the set of patents applied for by the LIs over
the past three years (i.e., from year t − 2 to t). The aggregate LI word vector in year t
corresponds to the equally-weighted average of the resulting normalized patent vectors.
We then compute the similarity of any given patent to those of the LIs as:
Vj,t VLI,t
LI Similarityj,t = · . (4)
kVj,t k kVLI,t k
Because the word vector VLI,t aggregates word usage across patents of lead innovators
in the last three years, patents exhibiting higher levels of LI similarity contain technologies
that are textually close to those of lead innovators. In contrast, patents with low levels
of LI similarity use text that is unrelated to that used in the patents of lead innovators,
and thus are more distant technologies.
We use similar methods to compute the similarity between the text in each patent j
and the overall text of patents assigned to private U.S. firms or to foreign firms. Specif-
15
An illustrative example of a high technological breadth patent is the satellite (patent #2835548 from
1957), which required both mechanical and electronic technologies among others.
16
The result is bounded in [0,1] and values close to one indicate closer textual similarity.
11ically, we form the aggregate private firm (foreign firm) word vectors VP,t (VF,t ) as the
equally-weighted average of the normalized vectors V of patent applications by private
(or foreign) firms in year t.17 We then define the similarity between each patent j and
the contemporaneous patent applications of all private U.S. firms as:
Vj,t VP,t
Private Similarityj,t = · . (5)
kVj,t k kVP,t k
Analogously, the similarity between patent j and those of foreign firms is:
Vj,t VF,t
Foreign Similarityj,t = · . (6)
kVj,t k kVF,t k
These measures are high for patents whose vocabulary is technologically close to that
of patents assigned to private U.S. firms or to foreign firms, respectively. As proximity to
private and foreign firms indicates more contested markets for innovation, these variables
allow us to examine competitive effects in exit choices.
D Descriptive Statistics, Comparisons, and Examples
Table II presents descriptive statistics for our new text-based technological characteris-
tics as well as existing patent variables from the literature for the full sample of patents
(1930-2010). All variables are defined in Appendix B. We first focus on patents’ techno-
logical disruptiveness. Across all patents between 1930 and 2010, we note that empirical
distribution of technological disruptiveness is highly skewed. The first row of Panel A
indicates that the average disruptiveness of patents is 1.69, the median is 1.27, and the
75th percentile is 2.34. The observed asymmetry indicates that while the vast majority
of patents contain incremental inventions, a smaller set of patents appear to be highly
disruptive.
[Insert Table II about here]
We corroborate this intuition by comparing patents’ technological disruptiveness with
17
Because these groups contain very large numbers of patents, we aggregate over just the single year
t. We also note that when a patent j belongs to a private U.S. firm or a foreign firm, we exclude it from
the set of patents used to compute VP,t and VF,t , respectively.
12two variables commonly used to describe patent quality and economic value. First, we
collect all citations for each patent as of early 2014 from Google Patents.18 Second, for the
set of patents assigned to public firms, we use their estimated value as measured by Kogan,
Papanikolaou, Seru, and Stoffman (2016) using stock return changes around patent grants’
announcements (henceforth KPSS). Panel B reveals positive and significant correlations,
indicating that patent applications exhibiting higher levels of technological disruptiveness
attract more ex post citations, and have larger economic values when granted. These
positive relationships remain highly significant in regressions with fixed effects for appli-
cation year, grant year, and technology category (and clustering standard errors by grant
years).
Although a patent’s technological disruptiveness is significantly related to future cita-
tions and economic value, the reported correlations range between 0.03 and 0.10, suggest-
ing important differences across these measures, and especially between disruptiveness and
future citations.19 To better understand this difference, we study in detail the 25 patent
applications occurring between 1980 and 2010 that have attracted the largest number of
citations in the first five years following their grant. We display in Panel A of Table III
the percentile of each such patent in the distribution of technological disruptiveness. Al-
though citations are clear indications that patents are widely used ex-post, technological
disruptiveness is specifically designed to capture new and fast-growing ideas ex-ante. This
is evident in Panel A, where patents with high levels of disruptiveness tend to build-out
novel ideas (e.g., the use of HTML in the mid-nineties), rather than refinements or syn-
thesis of existing ideas (e.g., the iPhone or semiconductor advances in the mid-2000s).
Indeed, the average percentile of technological disruptiveness for these 25 patents is 57,
as the most disruptive patents refer to more nascent and viral technologies.
[Insert Table III about here]
Panel B displays similar figures for a collection of twelve unambiguous breakthrough
18
We eliminate patents granted in early 2014 to avoid having a partial year of data.
19
Unlike citations, our measure of technological fluidity is less exposed to truncation (e.g. Lerner and
Seru (2017)) and it uses ex-ante information. Additionally, our measure can be computed for all patents,
whereas economic value can only be computed for public firm patents (which represent only 28% of all
patents).
13patents, as identified by the USPTO.20 The average technological disruptiveness of these
patents is very high (84th percentile). The most disruptive patents in this set are “Com-
plex computer” in 1944 (#2668661) and DNA modifications in 1980 (#4399216), both
of which virtually created new industries. Other key inventions, such as the satellite,
laser, and PageRank, use vocabulary that is new and rapidly growing around the time of
their application. Interestingly, some of these breakthrough inventions are barely cited.
For instance, the patents related to the invention of the “television” (#1773980) and the
“helicopter” (#1848389) are in the lowest percentile of the cohort-adjusted distribution
of citations. Yet, our new measure classifies these patents as highly disruptive.
Tables II and III also provide statistics for the other text-based measures. Un-
like patents’ technological disruptiveness, patent breadth is evenly centered around its
average value of 0.42, indicating less skew specializations across patents. Remarkably,
Table III indicates that patents’ technological breadth and their originality (as defined by
Trajtenberg, Henderson, and Jaffe (1997)) are largely unrelated.21 For instance, software-
related patents (e.g., #6964374, #7630986, or #7356679) display low levels of technologi-
cal breadth, as they rely on a relatively narrow vocabularies. Yet, they rank high in terms
of their originality. In contrast, breakthrough inventions display above-median levels of
technological breadth. For example, the invention of the satellite, computer, and the jet
engine combine broad scientific language.
Finally, we observe some variation in similarity across patents, but the overall levels
are low, which is not surprising given the large range and diversity in the vocabulary used
across all patents. Panel C of Table II further indicates that the text-based measures
capture distinct dimensions of the technological nature of patents. Patents with higher
20
Listed patents applied before 1960 come from a list of historical patents at
http://www.uspat.com/historical/. More recent patents are noted for the revenue they generated.
21
The construction of our complexity measure is somewhat similar, but we measure concentration based
on the assignment of words to technology areas rather than citations. This has several advantages. First,
our measure of complexity is well defined even for patents with zero or one backward citations. Second,
technology links revealed by vocabularies are not influenced by strategic avoidance of citations and do
not rely on patent examiners having a complete knowledge of the patent space. Third, our measure of
complexity can pick up a reliance on a technology area even if no specific citation to that area is given.
For example, a patent might use “textbook” information about chemistry to describe a portion of the
invention without needing to cite a “Chemical” patent.
14levels of disruptiveness tend to display lower breadth. They are also located nearer to
patents of lead innovators than to patents assigned to private or foreign firms. We also
note that patents nearer to lead innovators tend have lower technological breadth, while
those most similar to private and foreign firms display higher breadth.
III The Decline in Technological Disruptiveness
In this section, we document the aggregate time-series properties of our text-based tech-
nological characteristics between 1930 and 2010. We then contrast these technological
changes with aggregate changes in IPO and acquisition activities occurring between 1980
and 2010.
A Technological Changes in the Last Century
To track the evolution of technological disruptiveness in time series, we compute the
aggregate stock of Tech Disruptiveness.22 Figure II displays the time series from 1930
and 2010, smoothed using a four-quarters moving average. Several interesting patterns
emerge, suggesting important changes were occurring in the technological characteristics
of U.S. innovation. Although there is considerable fluctuation, the time series neatly
maps the history of U.S. innovation. We easily detect periods of sharply increasing dis-
ruptiveness. The first peak occurs around 1950 with an average level of disruptiveness
that is almost double the level of 1930. The period around 1950 is often considered a
time of radical innovation in manufacturing technologies, featuring the invention of the
television, transistor, jet engine, nylon, and xerography. A second peak occurs in the
mid-seventies, corresponding to innovation related to the computer. The last two peaks
of technological disruption appear in the late eighties and mid-nineties, reflecting waves
of inventions related to genetics (e.g., methods of recombination) and the mass adoption
of the Internet.
[Insert Figure II about here]
22
To compute the aggregate stock of any patent variable, we first compute the sum of Tech Disrup-
tiveness for patents applied for in a given quarter. We then compute a rolling depreciated sum of the
prior 20 quarters, using a 5% quarterly rate of depreciation. Finally, we normalize the rolling stock by
the number of patents applied for in the 20 prior quarters.
15Despite these periodic surges in disruption, the 1930-2010 period is characterized by
a protracted and steady long-term decline in the disruptiveness of U.S. patents. Between
1950 and 2010, the average level of technological disruptiveness has significantly decreased,
with levels in 2010 being roughly one quarter that of 1950. Importantly, this decline is
not due to changes in the composition of patents (e.g., shifts across technology classes) as
we continue to observe a similar trend after we account for broad technology and location
fixed effects. Rather, the decline in measured technological disruptiveness indicates a
widespread deceleration in vocabulary usage growth rates among U.S. patents. This trend
echoes recent research highlighting the increasing difficulty to generate new innovative
ideas (e.g., Jones (2009) and Bloom, Jones, Reenen, and Webb (2017)).
Figure II also reveals important changes in the technological breadth of U.S. patents.
The overall level of breadth steadily increases between 1930 to 1970. Beginning in the
mid-seventies, there is a twenty-year period of growth in overall patent breadth which
reaches a peak in the mid-nineties that was 20% above the 1970 level. In the most recent
years, however, there is a large decline in the breadth of U.S. patents, dropping by about
25% between the mid-nineties and 2010.
Finally, we find an inverse U-shaped pattern in patent similarities over the last century.
All three measures steadily increase until the eighties, as the text in the average U.S.
patent during this period became increasingly similar to patents assigned to private U.S.
firms, foreign firms, and lead innovators. Beginning in the eighties, however, these trends
reversed, leading to marked declines in the similarity measures. The recent period is
thus characterized by patents becoming both more specialized (i.e., lower technological
breadth) and more distinct across firms.
B Technology, IPO, and Acquisitions (1980-2010)
We next examine the time series properties of IPOs and acquisitions. We obtain data on
IPOs from Jay Ritter’s website, and exclude non-operating companies, as well as IPOs
with an offer price lower than $5 per share, unit offers, small best effort offers, bank and
savings and loans IPOs, natural resource limited partnerships, companies not listed in
CRSP within 6 month of their IPO, and foreign firms’ IPOs. Data on acquisitions are
16from the Thomson Reuters SDC Platinum Database, and include all domestic completed
acquisitions (of private or public firms) coded as a merger, acquisition of majority interest,
or acquisition of assets giving the acquirer a majority stake.
[Insert Figure III about here]
Panel A of Figure III plots the number of IPOs for each quarter between 1980 and
2010. The patterns are similar to those reported by Gao, Ritter, and Zhu (2013), Doidge,
Karolyi, and Stulz (2017), and Ewens and Farre-Mensa (2018). Remarkably, the evolution
of IPO activity rather closely maps the aggregate dynamics of technological disruptiveness
during this thirty-year period. The number of IPOs drops around 1990, coinciding with a
decline in disruptiveness that follows the earlier surge in genetic science in the mid-1980s.
There were more IPOs as the nineties progressed, when technological disruptiveness expe-
rienced a very large increase. The decline in IPO intensity then began in the early 2000s,
when the average technological disruptiveness of U.S. patents also started to plummet. In
the aggregate, the intensity of new public listings is substantially higher at times where
the average technological disruptiveness of U.S. patent applications is elevated.
Panel B of Figure III plots the evolution of the number of acquisitions, both in total
and separately for private firms. The number of acquisitions has increased since 1980,
with a strong acceleration in the mid-nineties. We note subsequent declines in acquisitions
in the aftermath of the tech bubble and the financial crisis. Yet, the number of acquisi-
tions remains significantly higher since the mid-nineties when compared to the 1980-1995
period. This suggests a relationship between the surge in aggregate acquisitions and the
decline in technological disruptiveness of U.S. patents. Although the pattern for trade
sales is less striking than that for IPOs, the patterns suggest that acquisitions tend to be
high when overall technological disruptiveness is lower.
IV Technological Disruptiveness and Startups’ Exits
To better understand the interplay between technological changes and exits, we explore
the cross-sectional relationship between our text-based technological characteristics and
the decision of private firms to exit by going public or through trade sales. Ideally, we
17would study the exit strategy of all private firms that are plausible candidates for IPOs
or acquisitions. Because data limitations preclude this, we focus on a large sample of
venture-backed private firms, for which we observe both their technological characteristics
and their exit choices.
A Sample of VC-backed Startups
We obtain data on VC-backed U.S. firms from Thomson Reuters’s VentureXpert (Kaplan,
Stromberg, and Sensoy (2002)), which contains detailed information about private star-
tups including the dates of financing rounds and their ultimate exit (e.g., IPO, acquisition,
or failure). We focus on the period 1980-2010 and restrict our attention to VC-backed
firms that are granted at least one patent during the sample period. To assign patents
to VC-backed firms, we follow Bernstein, Giroud, and Townsend (2016) and develop a
fuzzy matching algorithm that matches the names of firms in VentureXpert to patent
assignees obtained from Google Patents (see Appendix C for details). The result is an
unbalanced panel of firm-quarter observations.23 A firm enters our sample in the quarter
it is founded (based on founding dates in VentureXpert) and exits the sample when its
final outcome (IPO, acquisition, or failure) is observed based on the resolve date in Ven-
tureXpert. Firms still active as of November 2017 remain unresolved. We exclude firms
if their founding date is missing or if it is later than the resolve date. The sample begins
in 1980 to guarantee reliable data on outcomes and ends in 2010 because this is when
the link to publicly traded firms created by Kogan, Papanikolaou, Seru, and Stoffman
(2016) ends. Our final sample contains 561,982 firm-quarter observations, corresponding
to 13,679 unique firms and 506,096 patent applications.
We obtain the technological characteristics for each firm-quarter by aggregating each
patent-level variable (text-based and others) using their depreciated sums over the past
20 quarters using a quarterly depreciation rate of 5%. For example, the technological dis-
ruptiveness of firm i in quarter q corresponds to the depreciated sum of the disruptiveness
23
Lerner and Seru (2017) note that bias can occur in matching patent assignments to firms because
patents can be assigned to subsidiaries with different names than their parent corporations. However,
this issue is limited in our sample as VC-backed startups are small and are unlikely to have complex
corporate structures.
18of all its patent applications in the past five years, normalized by the number of patents
i applied for over that period.24 We define the exit variables (IPO or sell-out) as binary
variables equal to one if firm i experiences a given exit in quarter q. The construction of
all variables is explained in detail in Appendix B.
[Insert Table IV about here]
As we found for the overall statistics reported in Table II, we find in Table IV a sub-
stantial asymmetry in the distribution of technological disruptiveness among VC-backed
firms despite the aggregation of their patents. The other variables are overall in line
with their aggregate counterparts, indicating that the technological characteristics of VC-
backed firms are roughly representative of those in the economy at large. Table IV further
indicates that the quarterly IPO rate (i.e. the number of IPOs in a quarter divided by
the number of active firms in that quarter) is 0.38%, and the quarterly sell-out rate is
0.54%.25
[Insert Figure IV and Figure V about here]
Figure IV plots the time series of technological characteristics for all unresolved VC-
backed firms in each quarter. For the sake of comparison, we compute the aggregate stock
of each variable for the set of patents granted to VC-backed firms as in Figure II. The
trends closely map those of the aggregate dynamics presented in Figure II, indicating that
the technological changes occurring among VC-backed firms is mirroring economy-wide
changes. In Figure V, we compare the evolution of IPO and sell-out rates for VC-backed
firms to the aggregate patterns. We scale the aggregate patterns, i.e. the quarterly
number of IPOs and acquisitions, by lagged real GDP to obtain exit rates. The upper
figure shows that the evolution of IPO rates for VC-backed firms between 1980 and 2010
24
Because Foreign Similarity and LI Similarity are non-trivially correlated (60% and 45%) with Private
Similarity, we orthogonalize Foreign Similarity and LI Similarity by subtracting Private Similarity.
25
We report additional information about the sample firms in Appendix D in Table A1. Relative to the
founding date, IPOs and acquisitions play out over time. Of these, IPOs occur fastest on average, while
failure (when explicitly listed by SDC) takes the longest. The average firm applies for its first patent after
4.78 years, and receives its first round of VC funding 6.64 years after its founding. All of these numbers
are mechanistically shorter when measured relative to the first patent instead of the founding year.
19closely follows aggregate IPO rates, especially the decreased IPO rates after 2000. The
lower figure also shows agreement between the sell-out rates observed for VC-backed firms
and the aggregate trend. In particular, we observe growth in acquisition activity in the
latter part of the sample.
Although our sample of VC-backed firms does not include all firms that have the
potential to go public or get acquired, our sample of VC-backed firms nevertheless rep-
resents a useful laboratory to study the interplay between technological changes and the
evolution of IPOs and acquisitions. First, these firms account for a large share of the IPO
market (Ritter (2017)) and the production of innovation (Gornall and Strebulaev (2015)).
Second, their IPO and acquisition rates from the last thirty years appear comparable to
the economy-wide patterns, as shown in the figures above.
B Validation
Our analysis rests on the ability of our measure of disruptiveness to identify startups
that can create new markets or disrupt existing ones. To corroborate this interpretation,
we examine whether the startups that we classify as technologically disruptive (based on
their patents) do in fact operate in product markets that display higher risk of disruption.
First, for each startup, we identify public firms offering similar products and services,
following an approach similar to Hoberg and Phillips (2016). We obtain product descrip-
tions of startups from VentureXpert as reported in the year of their first round of funding.
We then compute the (cosine) similarity between the text in each startup’s product de-
scription (in year t) and that of all public firms, obtained from the product description
section of their 10-K report (also in year t). Since 10-Ks became available in electronic
format in 1997, we focus on 8,771 startups whose first funding round occurred after 1996.
To identify the public firms operating in a given startup’s market (in year t), we identify
the 25 public firms that have the most similar product descriptions relative to the startup.
This is done by measuring the cosine similarity between the startup’s business description
and public firm 10-K business descriptions and taking the 25 public firms with the highest
cosine similarity.
20Next, for each startup, we measure whether its 25 public firm peers are actually at
risk of disruption. This is done by computing the fraction of paragraphs in each public
firm’s 10-K that mentions words related to technology-based disruption. In particular,
we consider three measures. First, we search for paragraphs that contain words having
the root “technol” and also a word having the root “change”. Intuitively, these public
firms peers are discussing exposures to technological change, a direct form of market
disruption. Second, we identify paragraphs having the words with the root “technol” and
also the word root “compet”. Such firms are explicitly discussing competition on the
margin of technological expertise. Third, we consider the more strict set of paragraphs
containing at least one word with the roots “disrupt”, “technol”, and “compet”. In order
to be counted as a hit, a paragraph must contain all three. Table V reveals a positive
association between the technological disruptiveness of startups (using our text-based
patent measure) and these ex-post mentions of market disruption by related public firms.
This strong positive relationship holds across specifications that include either year fixed
effects or a more complete set set of fixed effects including year, technology, location, firm
age, and firm cohort fixed effects.
[Insert Table V about here]
In a separate set of validation tests, we examine the product market characteristics
of 1,579 startups in our sample that go public after 1997. Because these startups gain
public status when they IPO, we are able to link their ex-ante patent-based technologi-
cal disruptiveness measure to product market attributes that are only measurable when
firms are publicly traded. For each IPO firm, we thus consider validation tests based
on three characteristics of their post-IPO market (measured in the year of their initial
listing): product market concentration (HHI), the total similarity to publicly traded peers
(TSimm), and product market fluidity. These three measures are specific to each IPO
firm and these tests are thus direct. This data is available since 1997 (see Hoberg and
Phillips (2016) for competitiveness measures and Hoberg, Phillips, and Prabhala (2014)
for fluidity measures). Our validation tests obtain from life cycle theory (Abernathy and
Utterback (1978)), and we thus predict that disruptable markets are those for which su-
21perior new technologies are more likely to be discovered by competing early stage firms.
For validation, we thus expect that IPO firms having higher values of our patent-based
disruption measure should exit into more competitive, less differentiated and more fluid
product markets.
[Insert Table VI about here]
Based on these direct firm-specific measures, Table VI confirms this ex post prediction.
Newly-public firms with more technologically disruptive patents indeed exit into markets
that are more fluid, contested, and thus disruptable. In contrast, IPO firms with less
disruptive technology operate in more stable markets with less competition and more
product differentiation. Put together, the results in Table V and Table VI confirm that
our patent-based measure of technological disruptiveness is indeed strongly associated
with ex-post predictions regarding product markets indeed being less stable and thus
greater at risk of disruption.
C The Determinants of Startups’ Exit Types
We now examine the relationship between startups’ technological traits and their propen-
sity to exit via IPO or sell-out.26 Our central hypothesis is that firms with more disruptive
technologies will be more likely to seek a public listing and less likely to sell out.
Our baseline specification relies on the competing risks regression approach of Fine
and Gray (1999) that explicitly models the “risk” of choosing a particular exit in quarter q
given that the firm is still unresolved at that time.27 Firms enter the sample (i.e., become
at risk of exiting) when they are founded. Their exit is modeled using competing hazards
to reflect multiple potential exit strategies that are mutually exclusive. This approach
allows us to estimate the relationships between startups’ text-based technological traits
and the full set of potential exits. In addition to the five text-based technology variables,
26
As mentioned in Section IV.A, VentureXpert frequently fails to code firms as failed when they stop
operations. Given this data limitation, we do not directly report tests relating to failure outcomes.
27
The use of a competing risk model is relatively rare in finance. One recent exception is Avdjiev,
Bogdanova, Bolton, Jiang, and Kartasheva (2017), who examine the determinants of convertible capital
choice by banks.
22we also include controls for the log number of patent applications in the past five years
and a dummy indicating firms with no applications in the past five years.
To ensure that our text-based variables are not capturing the effects of known patent
variables from the existing literature, we further include the originality of startups’ patents
as well as their citations (both aggregated for each startup-quarter as is the case for our
text-based variables). We also note that these existing citation measures are not ex-ante
measurable, which is in contrast to our text-based measures (which we designed to avoid
any possibility of look-ahead bias). Following the literature on IPOs and acquisitions, we
also control for overall market activity using market relative valuation and stock returns
as well as an identifier for the last quarter of the year (Lowry (2003) and Pastor and
Veronesi (2005)). We cluster the standard errors by startup to account for any potential
within-startup dependencies over time.
[Insert Table VII about here]
The first two columns of Table VII confirm the key role played by technological dis-
ruptiveness in startups’ exit choices. In the first column, we observe a strong positive link
between startups’ technological disruptiveness and their likelihood of exiting through an
IPO in the next quarter. The point estimate is 0.218 with a t-statistic of 11.47. This
indicates that a one standard deviation increase in startups’ technological disruptiveness
is associated with a 21.8% increase in the quarterly rate of IPOs.28 On the other hand,
column (2) reveals that the odds of exiting via a trade sale are negatively related to
technological disruptiveness. Indeed, the estimated coefficient is negative (-0.179) and
statistically significant with a t-statistic of -7.86. Hence a one standard deviation increase
in disruptiveness indicates a 17.9% decrease in the sell-out rate. In addition to being
statistically significant, the baseline estimates reveal economically large relationships.
Table VII further reveals that the other text-based technological characteristics are
also important determinants of startups’ exits. We observe for instance that firms’ tech-
28
As explained in Fine and Gray (1999), regression coefficients from a sub-distribution hazard model
denote the magnitude of the relative change in the sub-distribution hazard function associated with a
one-unit change in the given covariate. Therefore, estimated coefficients reflect the relative change in the
instantaneous rate of the occurrence of the event in those subjects who are event-free.
23You can also read