Technological Disruptiveness and the Evolution of IPOs and Sell-Outs
←
→
Page content transcription
If your browser does not render page correctly, please read the page content below
Technological Disruptiveness and the Evolution of
                      IPOs and Sell-Outs
                Donald Bowen, Laurent Frésard, and Gerard Hoberg∗

                                         January 28, 2019

                                             ABSTRACT

             We show that the recent decline in IPOs on U.S. markets is related to changes in
         the technological disruptiveness of startups, which we measure using textual anal-
         ysis of patents from 1930 to 2010. We focus on VC-backed startups and show that
         those with ex-ante disruptive technologies are more likely to exit via IPO and less
         likely to exit via sell-out. This is consistent with IPOs being favored by firms with
         the potential to carve out independent market positions with strong defenses against
         rivals. We document an economy-wide trend of declining technological disruptive-
         ness since World War II that accelerated since the late 1990s. This trend predicts
         fewer IPOs and more sell-outs, and we find that roughly 20% of the recent dearth
         of IPOs, and 49% of the surge in sell-outs, can be attributed to changes in firms’
         technological characteristics.

       Key words: Initial Public Offerings (IPOs), Acquisitions, Sell-Outs, Technology,

        Disruptiveness, Venture Capital

       JEL classification: G32, G34, G24

   ∗
    Virginia Tech, the University of Lugano, Swiss Finance Institute, and the University of Southern
California respectively. Bowen can be reached at donbowen@vt.edu, Frésard can be reached at lau-
rent.fresard@usi.ch, and Hoberg can be reached at hoberg@marshall.usc.edu. We thank Sunil Muralid-
hara and Lauren Phillips for excellent research assistance. We also thank Jay Ritter on sales data for IPO
firms. For helpful comments, we thank Song Ma, Adrien Matray, Francesco D’Acunto, Francois Degeorge,
Francois Derrien, Francesco Franzoni, Michelle Lowry, Shawn Thomas, Xuan Tian and seminar partic-
ipants at American University, Arizona State Univesity, Bocconi University, Dauphine University, the
CCF conference in Bergen, the FRA conference in Las Vegas, Georgetown University, HEC Paris, Johns
Hopkins University, the SFI Research days, Stockholm School of Economics, Universita Cattolica, Uni-
versity of Virginia, Texas Christian University, Tsinghua University, CKGSB, the University of Lugano,
the University of Maryland, the University of Zurich, and Virginia Tech. All errors are the authors’ alone.
All rights reserved by Donald Bowen, Laurent Frésard, and Gerard Hoberg.
I Introduction
Since the late 1990s, the number of initial public offerings (IPOs) in U.S. markets has
sharply declined. Over the same period, the number of private firms exiting via acquisi-
tions (i.e., trade sales) has soared. Successful startups are nowadays more likely to sell
out to other (public or private) companies than seek independent public listings. Many
observers in the media and policy circles worry that these trends reflect a general erosion
in the ability of U.S. financial markets to spur economic growth and spread its benefits
across the general public.1 Recent studies indicate, however, that the dearth of IPOs is
unlikely due to regulatory changes affecting public firms (Gao, Ritter, and Zhu (2013) and
Doidge, Karolyi, and Stulz (2013)) and is partly explained by regulatory changes affect-
ing the financing ability of private firms (Ewens and Farre-Mensa (2018)). In contrast to
existing regulation-based explanations, we show that the recent shift from IPOs to trade
sales is related to changes in the technological disruptiveness of U.S. startups.
Our analysis builds on the long-standing idea that exiting through an IPO or by selling
out to another firm depends on which exit type enhances the growth potential of successful
private firms (Bayar and Chemmanur (2011) or Gao, Ritter, and Zhu (2013)). Accord-
ingly, we predict and find that private firms that can develop an independent market
presence by creating new markets or disrupting existing ones with patented technologies
are more likely to exit and scale up through a public listing.2 This is optimal as such firms
do not have to share the gains to achieving scale with an acquirer. In contrast, firms with
less disruptive innovation, such as technology that can improve existing products, are
more likely to sell out to existing firms that can more efficiently scale their technologies.
Studying the exits of a large sample of U.S. startups backed by venture capitalists (VCs),
we find that startups’ technological disruptiveness has significantly decreased in recent
1
See for instance “The endangered public company: The big engine that couldn’t,” The Economist
(May 19, 2012) or “US stock markets seek depth in IPO pool,” Financial Times (January 9, 2018).
2
Consistent with this idea, Darby and Zucker (2018) show that biotechnology firms go public when
they have a science base that can be successfully commercialized, Chemmanur, He, He, and Nandy
(2018) report that manufacturing firms are more likely to go public than sell out when they already have
a strong product market presence (i.e., market share), Poulsen and Stegemoller (2008) and Cumming
and Macintosh (2003) show that firms with more growth potential favor exit through IPOs.
1years, and this trend can partially explain the decline in IPOs and soaring trade sales.3
We define a technology (patent) as ex ante disruptive if it is newly gaining traction
and has the potential to rapidly change the technological path followed by a large number
of firms. Technological disruptiveness is thus distinct from the concept of innovativeness
used in the literature, which is based either on patents’ use of new or unique vocabu-
lary, or various measures based on patents’ citations (e.g., Packalen and Bhattacharya
(2018)). We measure the technological disruptiveness of the 6.6 million patents filed with
the U.S. Patent Office (USPTO) between 1930 and 2010 as the extent to which their
text contains vocabulary that is fast-growing across all patent applications in the same
year. For example, genetics-related words such as ‘peptide’, ‘clone’, or ‘recombinant’ were
rapidly growing across a host of patents in 1995, and thus our measure would tag patents
extensively employing such words in 1995 as disruptive.
Because our goal is to estimate predictive models of startups’ exits, we measure the
technological disruptiveness of patents at the time of their application, using only text
contained in all past and contemporaneous patents.4 We confirm empirically that dis-
ruptiveness is distinct from existing measures of innovativeness and that it identifies the
breakthrough inventions of the last century that radically altered the course of technolog-
ical evolution (e.g., jet engine, transistor, laser, satellite, DNA recombination, or Google’s
PageRank algorithm).5 Furthermore, we find strong validation of our ex ante measure of
disruptiveness, which predicts ex post changes in the trajectory of future inventions as
indicated by high levels of ex post citations and estimated economic values.
3
We focus on VC-backed startups because detailed data enables us to precisely link their choice and
timing of exits (i.e., IPO or sell-out) to the patents they file with the U.S. Patent and Trademark Office
(USPTO). This is a useful and relevant sample, as VC-backed startups account for a large fraction of the
IPO and acquisition market (Ritter (2017)), produce a substantial share of innovation in the economy
(Gornall and Strebulaev (2015)), and face exits due to the limited lives of VC funds.
4
See Dahlin and Behrens (2005) for a detailed discussion of the distinction between ex ante and ex post
disruptiveness. The ex-ante feature of our measure also eliminates look-ahead bias, reduces truncation
bias (Lerner and Seru (2017)), and increases the measure’s utility to practitioners (e.g., who can use it
to predict outcomes and investor returns) and regulators (e.g., who can examine the impact of policies
in real time).
5
For instance, using a list of 101 historically important patents based on the USPTO’s “Significant
Historical Patents of the United States” list, we estimate that the average patent in this list of radical
inventions ranks in the 77th percentile of our disruptiveness measure.
2Consistent with recent evidence suggesting that new ideas are getting harder to dis-
cover and develop (Jones (2009) and Bloom, Jones, Reenen, and Webb (2017)), the aver-
age disruptiveness of U.S. patents has markedly declined since 1950, except for temporary
spikes during the 1970s (i.e., computers), the 1980s (i.e., genetics), and the 1990s (i.e., the
internet). As they contain pioneering and fast growing ideas that are legally protected,
startups holding more disruptive patents are likely to radically change markets and cap-
ture valuable competitive advantages. We posit that these startups are more likely to go
public and less likely to sell out. A comparison of aggregate technological disruptiveness
versus private firm exits suggests that IPOs are indeed more prevalent during disruptive
periods, whereas trade sales prevail in less disruptive times.
We confirm this interpretation at the micro-level by examining the link between the
technological disruptiveness of 9,167 VC-backed startups (94,703 patents) and their exits
over the 1980-2010 period. We find strong evidence that startups with more disruptive
patents are significantly more likely to go public and less likely to sell out. The link
between technological disruptiveness and startup exits is economically large, as a one
standard deviation increase in a startup’s technological disruptiveness is associated with
a 25.2% increase in its IPO rate and a 18.8% decrease in its rate of exit through trade
sales. The role of disruptiveness in startups’ exits remains after controlling for startups’
age, size, financing rounds, overall financial market conditions, and other technological
characteristics, such as their technological “breadth” (based on the intensity with which
patent text combines vocabulary from diverse bodies of knowledge), similarity to other
firms, patent citations, average word age, and originality. They also hold in specifications
with fixed effects for startup cohorts, geographic locations, and technological areas.6
We provide additional evidence supporting the validity of our new measure of techno-
logical disruptiveness and its role in explaining startups’ exits. For example, we delineate
each startup’s product market based on the textual similarity between its business de-
scription and the 10-K business descriptions of publicly-traded firms. As direct validation,
6
Our results are also robust to changes in econometric specifications that vary the horizon over which
we measure exits (ranging from the next quarter to the next five years), and to focusing on the early part
of the sample to limit potential truncation bias relating to startup resolution and patent grants (Lerner
and Seru (2017)).
3we find that the publicly-traded firms that are most similar to a given startup discuss mar-
ket disruption significantly more when that startup displays a high level of technological
disruptiveness. Alternatively, we show that among startups exiting through IPOs, those
with more disruptive technologies exit into less stable and more competitive markets that
intuitively offer greater opportunities for disruption (Abernathy and Utterback (1978)).
Given our finding that startups’ ex-ante technological disruptiveness is strongly related
to their ex-post choice of exit, we next examine whether the aforementioned aggregate
decline in disruptiveness in recent years can help to explain disappearing IPOs and the
surge in trade sales in the time-series. Inspired by the disappearing dividends literature,7
we first estimate quarterly cross-sectional exit models with different sets of explanatory
variables over an initial period (1980-1995), and use the fitted model to predict quarterly
IPO and sell-out rates in the subsequent out-of-sample years (1996-2010) given the char-
acteristics of firms in the latter period. We then compare the models’ predictions to the
actual exit rates in the out-of-sample period.
The actual probability that a VC-backed startup will experience an IPO in a given
quarter is 0.33 percentage points in the out-of-sample period. When we fit the predictive
model without our text-based technological characteristics, the predicted IPO rate is 0.84
percentage points per quarter. Because the actual rate is 0.51 percentage points lower
than the predicted rate, we thus confirm the disappearing IPOs “anomaly” over the 1996-
2010 period. Notably, when we include the text-based technological characteristics the
gap declines from 0.50 to 0.42 percentage points. Our text-based variables thus explain
roughly 16% of the disappearing IPOs anomaly, which rises to 20% when we train our
model to look at longer predictive horizons. A similar analysis reveals that changes in
technological traits account for roughly 50% of the recent rise of trade sales. These findings
are robust to changes in the specifications and timing.
We further show that the role of startups’ technological characteristics in the recent
decline of IPOs varies significantly across IPO size and product markets. In particular,
7
We use methodology used in Fama and French (2001) and Hoberg and Prabhala (2009) to explain
disappearing dividends, and more recently used by Bates, Kahle, and Stulz (2009) to explain increasing
cash holdings.
4we find that technological disruptiveness is a strong determinant of the decline of “small”
IPOs (defined as IPOs with pre-IPO sales below the median). This is the segment of
the IPO market displaying the sharpest decline in recent years (Gao, Ritter, and Zhu
(2013)). Startups’ technological traits and disruptiveness appear unrelated to the decline
of large IPOs, but they explain about 40% of the decline in small IPOs. The stability of
the product market is also important, as we predict that disruption will become harder
in more stable markets.8 Following Hoberg, Phillips, and Prabhala (2014) we compute
the degree of product market stability for each startup using their business description
text, which is observable at the time of initial VC funding. Technological traits explain
25% of the decline in startups’ IPOs in more stable markets, compared to just 3% in fluid
markets.
Our analysis adds to the recent literature examining potential explanations of the re-
cent disappearance of IPOs, and the contemporaneous rise of trade sales.9 Ewens and
Farre-Mensa (2018) indicate that part of the IPO decline results from the increased bar-
gaining power of founders (relative to investors), their preference for control, and inex-
pensive capital in the private market. Gao, Ritter, and Zhu (2013) suggest that the
decline in IPOs originates from changes in market structure that favor selling out to real-
ize economies of scope. Doidge, Kahle, Karolyi, and Stulz (2018) argue that an increased
focus on intangibles also likely plays an important role. Our paper shows that changes in
firms’ technological traits (especially disruptiveness) also account for part of the decline in
IPOs and the rise of trade sales in the recent period. Unlike existing papers, our analysis
considers the margins of startups’ exits jointly and quantifies how much of the observed
trends are attributable to changes in firms’ technological characteristics. Although more
work is needed to draw clear policy recommendations, our findings suggest that the decline
in IPOs might be particularly unresponsive to policy changes, although funding subsidies
to disruptive entrepreneurs might be a possible exception.
8
The intuition for this hypothesis is that the most logical inventions are discovered first. As industries
mature, the best ideas become “picked over” and later inventions arise only with very high search costs,
as in Abernathy and Utterback (1978).
9
Ritter and Welch (2002) and Lowry, Michaely, and Volkova (2017) provide comprehensive surveys of
the literature on IPOs.
5Our findings also add to the literature studying the determinants of startup exits.
While the vast majority of existing research studies IPOs or trade sales in isolation, a small
number of papers examines these exit choices jointly and indicate that they depend on
founders’ private benefits of control, product market presence, and firms’ growth potential
(Cumming and Macintosh (2003), Bayar and Chemmanur (2011), Poulsen and Stegemoller
(2008) or, Chemmanur, He, He, and Nandy (2018)). Our analysis emphasizes the pivotal
role of technological characteristics in understanding startups’ exits and growth patterns.
Finally, our paper adds to a collection of recent studies using patent text to mea-
sure and characterize the nature of technology. Packalen and Bhattacharya (2018) and
Balsmeier, Assaf, Chesebro, Fierro, Johnson, Johnson, Li, Luck, OReagan, Yeh, Zang,
and Fleming (2018) use patent text to identify new ideas based on the first appearance of
words (or sequences of words) in the patent corpus, and analyze their propagation. Closest
to our paper, Kelly, Papanikolaou, Seru, and Taddy (2018) construct a measure of patent
“significance” based on the textual similarity with prior and future patents to analyze
technological change over the last centuries. While their measure of technological change
also considers changes in textual similarity, it relies on ex-post information (i.e., the text
of future patents). The intentional absence of look-ahead bias in our measure is impor-
tant specifically for what we study since our goal is to explain startups’ decisions based
on timely patent information, thereby limiting endogeneity or truncation concerns.10
II Text-based Technological Characteristics
In this section, we describe the patent data and explain the construction of our new
measures of technological characteristics based on patent text.
A Patent Text
We use a web-crawling algorithm to gather information from Google Patents for all
6,595,226 patents that were applied for between 1930 and 2010 and granted by 2013.
10
Indeed, similar to future patent citations, the textual similarity measure based on future patents
could be affected by the very decisions we are attempting to analyze such as exit mechanisms (e.g.,
through investors interest in the developed technology upon getting VC funding, going public, or being
acquired). Although measures using future information are excellent for some purposes, we believe ex-ante
measurable variables are important in our context.
6For each patent, we gather the publication date, application date, names of inventor(s),
and initial assignee(s). We also collect the full patent text and information on the tech-
nology classification of the patents by converting the U.S. Patent Classification (USPC)
into the two-digit NBER technology codes created in Hall, Jaffe, and Trajtenberg (2001).
Since we are interested in measuring the technological changes pertaining to the corporate
sector, we categorize each patent into groups based on four types of applicants: U.S. pub-
lic firms, U.S private firms, foreign (private or public) firms, or others (e.g., universities
or foundations). For brevity, we describe this classification method in Appendix A.
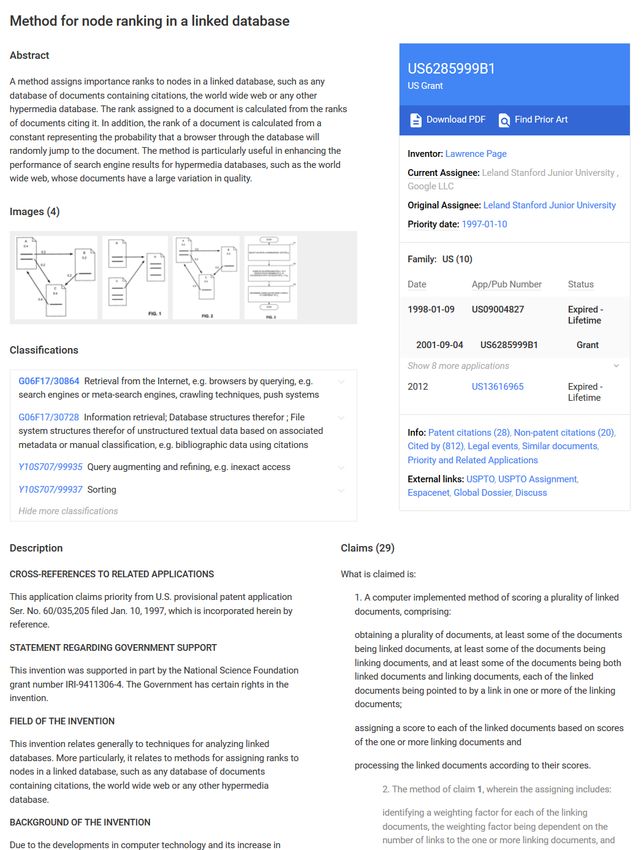
[Insert Figure I about here]
The full text of each patent consists of three distinct sections: abstract, claims, and
patent description. The claims section defines the scope of legal protection granted. The
description section explicitly describes the characteristics of the invention/innovation.
It typically includes a title, technical field, background art, specification example, and
industrial applicability. The abstract contains a summary of the disclosure contained in
the description and claims sections. Figure I presents an example of a typical patent
textual structure (#6285999, “A method for node ranking in a linked database”, assigned
to Google in 1998). We append all three sections into a unified body of text because earlier
patents do not include all sections, and because the organization of patent text into the
three sections may have changed over time (Kelly, Papanikolaou, Seru, and Taddy (2018)
and Packalen and Bhattacharya (2018)).
Following earlier studies constructing variables from text (e.g., Hanley and Hoberg
(2010) or Hoberg and Phillips (2016)), we represent the text of each patent as a numerical
vector with a length equal to the number of distinct words in the union of all patent
applications in a given year t. We denote this length Nt .11 Following the convention in
the literature, we eliminate commonly-used words (words appearing in more than 25%
of all patents in a given year) and rare words (words appearing only in one patent in a
11
We organize patents based on their application year rather than the year of the patent grant, as this
more accurately reflects the timing of innovation.
7given year).12 Each patent j applied for in year t is then represented by a vector Vj,t (of
length Nt ) in which each element corresponds to the number of times patent j employs
one of the unique Nt words used in year t. If patent j does not use a given word, the
corresponding element of Vj,t is set to zero. This vectorization procedure insures that all
patent applications in a given year are represented by a collection of vectors that are in
the same space (of dimension Nt ).
Due to the large number of words used across all patents in a given year, the vectors
Vj,t are quite sparse with most elements being zero. For instance, in 1980, the number
of distinct words used in an average patent is 352, and the median is 300, while there
are 400,097 distinct words used across all patent applications. In 2000, the average and
median are 453 and 338, and the total across all applications is 1,358,694.
B Technological Disruptiveness
We define a technology (patent) as ex ante “disruptive” if it is (1) newly gaining traction,
and (2) has the potential to change the technological path followed by other firms (see for
instance Dahlin and Behrens (2005)).13 This definition relates a patent to the activities
around it in the technology space. To capture the level of disruptiveness of a given patent,
we focus on the extent to which it uses vocabulary that is new and is experiencing rapid
growth across all patents compared to existing knowledge. Intuitively, disruptive patents
are based on new ideas that have the potential to radically change an industry or business
strategies either by creating whole new markets or by disrupting existing ones. We thus
posit that disruptive patents use novel vocabularies that are fast-growing in the universe
of patents.
To quantify disruptiveness, we rely on the rate of change in the use of each word
among all patent applications during the current and prior year. As our goal is to link
12
Given the highly technical and rapidly evolving nature of text in the patent corpus, we do not
implement additional filters (e.g. nouns only). While this choice might potentially introduce noise into
our measurements, it maintains power.
13
The notion that inventions could be either “incremental” (i.e., run-of-the-mill inventions) or “disrup-
tive” has a long tradition in the literature studying technological changes. Besides “disruptive”, existing
research in different fields employs various terminologies to label inventions that break with traditions,
such “radical”, “discontinuous”, “generational”, or “breakthrough” (Dahlin and Behrens (2005)).
8technological disruptiveness to future outcomes (i.e., startups’ exits), we construct tech-
nological disruptiveness as an ex-ante measure, using only text contained in all past and
contemporaneous patents. As highlighted by Christensen (1997), disruptive inventions do
not always lead to direct commercial success, so we propose to measure the technological
disruptiveness of patents at the time of their application (i.e., before it has reached the
market). As we note in later validation tests, disruptive patents do indeed influence the
content of future inventions ex post, as measured by their citation path or economic value
(see Section II.D). Our focus on ex ante measurement also alleviates any look-ahead bias
and truncation in our measure, which is necessary given our objective to estimate predic-
tive models of startup exit and to examine disappearing IPOs while avoiding endogeneity
arising from the interplay of corporate decisions and future outcomes.
We define an aggregate vector Zt (of length Nt ) in each year t with elements containing
the number of times a given word is used across all patent applications in year t. This
vector thus represents the aggregate frequency of word usage in the patent corpus in a
given year. We then compute the annual rate of change in the usage of each word (from
t − 1 to t) by defining the (annual) vector Dt as:
Zt − Zt−1
Dt = , (1)
Zt + Zt−1
where division is element-by-element.14 The set of annual vectors Dt thus tracks the
appearance, disappearance, and growth of specific technological vocabulary across all
patents over time. Elements of Dt are positive if the usage of the corresponding words
increases from year t − 1 to t, and negative if it decreases (e.g., words becoming obsolete).
[Insert Table I about here]
As an illustration, Table I displays the ten words experiencing the largest increases and
decreases in usage across all patent applications in specific years. For instance, in 1995,
we detect an acceleration of terms related to genetics, such as “polypeptides”, “clones”,
14
To ensure Zt and Zt−1 are in the same space (i.e., the union of Nt and Nt−1 ), we modify Zt−1 by
adding zero elements for words that newly appeared in year t (as they were not originally in the t − 1
space). Analogously, we modify Zt by adding zero elements for words that appeared in year t − 1 but
not year t.
9“recombinant” and “nucleic”, following rapid progress in genome sequencing. In that
year, use of terms such as “cassette,” “ultrasonic,” and “tape” are sharply decreasing. In
2005, the most rapidly growing words are related to the internet and include terms such
as “broadband”, “click”, “configurable”, or “telecommunications”.
To obtain the level of technological disruptiveness for a given patent j, we take the
frequency-weighted average of the vector Dt based on the words that patent j uses as
follows:
Vj,t
Tech Disruptivenessj,t = · Dt × 100, (2)
Vj,t · 1
where the operator “·” denotes the scalar product between two vectors, and “1” is a
unit vector of dimension Nt . Intuitively, patents using words whose usage surges across
all patent applications (i.e., have positive entries in the vector Dt ) have higher levels of
disruptiveness. This is the case for patents that either employ words that appear in the
patent space for the first time, or that use words whose usage experiences fast growth
across all patents. Hence, a patent using words such as “polypeptides”, “clones”, and
“recombinant” is classified as disruptive if its application year is 1995, but not in 2005.
Symmetrically, patents relying on words whose usage decreases across all patents (i.e.,
using obsolete vocabulary such as “cassette,” or “tape” in 1995) have lower (and possibly
negative) levels of disruptiveness.
C Technological Breadth and Similarities
We also develop text-based measures capturing the technological breadth of each patent,
as well as their similarities with other patents of economically linked firms. We posit
that these characteristics are also relevant in predicting startup exits. To measure the
technological breadth of a patent, we first identify words that are strongly associated
with a specific technological field using the six broad technological fields (f ) defined by
the first digit of the NBER technical classification.15 Specifically, we count how often a
given word (in Nt ) is used by patents classified into each field in each year, and keep the
two fields with the highest usage of the given word. We define a word as “specialized”
15
“Chemicals”, “Computer and Communication”, “Drugs and Medicine”, Electricity”, “Mechanics”,
and “Others”.
10(and associated with a field f ) if its use in its most popular field is more than 150% that
of its second most popular field. Each word is thus classified into one of the six fields
of specialization or it is deemed an “unspecialized” word. For instance, words such as
“bluetooth” and “wifi” are in the “Computer and Communication” field, and “acid” and
“solvent” are in the “Chemicals” field. Second, we define as wj,t,f the fraction of patent
j’s specialized words that are classified into each field f . By construction, each wj,t,f lies
in the [0,1] interval, and they sum to one for each patent j. We then define technological
breadth as:
6
X
2
Tech Breadthj,t = 1 − wj,t,f . (3)
f =1
This measure is one minus the technological concentration of the patent’s vocabulary.
Patents have higher technological breadth if they amalgamate vocabularies from different
specialized technological fields and for which a wide range of knowledge is needed to
develop and understand the invention.16 In contrast, patents with lower breadth use
vocabulary that primarily concentrates on one specialized technological field.
Next, we define three measures of technological similarity by directly comparing the
vocabulary of a given patent to that of patents assigned to three specific groups: lead
innovators, private U.S. firms, and foreign firms. To do so, we rely on the concept of
cosine similarity (see Sebastiani (2002)), which is defined as the scalar product between
each patent j’s normalized word distribution vector Vi,t and a normalized word vector
aggregating the vocabulary specific to a given group of patents.17 To capture the similarity
of a given patent j with patents of “Lead Innovators” (henceforth LI), we define LIs
annually as the ten U.S. public firms with the most patent applications. This set varies
over time as the importance of sectors and firms changes. LIs include Microsoft and Intel
in 2005, IBM and Motorola in 1995, General Electric and Dow Chemical in 1985, and
General Electric, Bell Telephone, and General Motors in 1935. For each set of LIs in
year t, we first identify the set of patents applied for by the LIs over the past three years
(i.e., from year t − 2 to t). The aggregate LI word vector in year t corresponds to the
16
An illustrative example of a high technological breadth patent is the satellite (patent #2835548 from
1957), which required both mechanical and electronic technologies among others.
17
The result is bounded in [0,1] and values close to one indicate closer textual similarity.
11equally-weighted average of the resulting normalized patent vectors. We then compute
the similarity of any given patent to those of the LIs as:
Vj,t VLI,t
LI Similarityj,t = · . (4)
kVj,t k kVLI,t k
Because the word vector VLI,t aggregates word usage across patents of lead innovators
in the last three years, patents exhibiting higher levels of LI similarity contain technologies
that are textually close to those of lead innovators. In contrast, patents with low levels
of LI similarity use text that is unrelated to that used in the patents of lead innovators,
and thus are more distant technologies.
We use similar methods to compute the similarity between the text in each patent j
and the overall text of patents assigned to private U.S. firms or to foreign firms. Specif-
ically, we form the aggregate private firm (foreign firm) word vectors VP,t (VF,t ) as the
equally-weighted average of the normalized vectors V of patent applications by private
(or foreign) firms in year t.18 We then define the similarity between each patent j and
the contemporaneous patent applications of all private U.S. firms as:
Vj,t VP,t
Private Similarityj,t = · . (5)
kVj,t k kVP,t k
Analogously, the similarity between patent j and those of foreign firms is:
Vj,t VF,t
Foreign Similarityj,t = · . (6)
kVj,t k kVF,t k
These measures are high for patents whose vocabulary is technologically close to that
of patents assigned to private U.S. firms or to foreign firms, respectively. As proximity to
private and foreign firms indicates more contested markets for innovation, these variables
allow us to examine competitive effects in exit choices.
18
Because these groups contain very large numbers of patents, we aggregate over just the single year
t. We also note that when a patent j belongs to a private U.S. firm or a foreign firm, we exclude it from
the set of patents used to compute VP,t and VF,t , respectively.
12D Descriptive Statistics, Comparisons, and Examples
Table II presents descriptive statistics for our new text-based technological characteristics
as well as existing patent variables from the literature for the full sample of patents (1930-
2010). All variables are defined in Appendix B. We first focus on our central new variable:
patents’ technological disruptiveness. Across all patent applications between 1930 and
2010, we note that the empirical distribution of technological disruptiveness is highly
skewed. The first row of Panel A indicates that the average disruptiveness of patents is
1.64, the median is 1.27, and the 75th percentile is 2.34. The observed asymmetry indicates
that while the vast majority of patents contain incremental inventions, a smaller set of
patents appear to be highly disruptive.
[Insert Table II about here]
Our ex ante measure of disruptiveness is designed to capture the potential of a patent
to alter the technological path followed by other firms and to create high-value economic
opportunities. To assess whether this ex ante potential is realized ex post, we examine
the association between our ex ante measure of patent disruptiveness, the ex post citation
path, and the patent’s economic value. To do so, we collect accumulated citations for
each patent as of early 2014 from Google Patents.19 For the subset of patents assigned to
publicly-listed firms, we also use the implied economic value as measured using stock re-
turns around patent grant announcements (see Kogan, Papanikolaou, Seru, and Stoffman
(2016), henceforth KPSS).
Panel B of Table II reveals significant and positive correlations, indicating that patent
applications exhibiting higher levels of ex ante technological disruptiveness attract sig-
nificantly more citations ex-post, and have larger economic values when granted. These
positive relationships remain highly significant in regressions including fixed effects for
the application year, grant year, and technology categories, as well as clustering standard
errors by grant years. While the technological disruptiveness of a patent significantly
predicts its future citations, it is constructed solely based on prior information. Disrup-
19
We eliminate patents granted in early 2014 to avoid having a partial year of data.
13tiveness therefore provides a more timely characterization of patents’ disruption potential
than any measure based on citation counts.20
Although a patent’s technological disruptiveness is significantly related to future cita-
tions and economic value, the reported correlations range between 0.04 and 0.06, suggest-
ing that not all patents with an ex ante potential to disrupt materially influence the path
of future inventions or are valued highly upon being granted (consistent with Christensen
(1997) and Christensen and Rosenbloom (1995) ). To better understand this difference
between these metrics, we study in detail the 25 patent applications occurring between
1980 and 2010 that have attracted the largest number of citations in the first five years
following their grant. We display in Panel A of Table III the percentile of each such patent
in the (cohort-adjusted) distribution of technological disruptiveness. Although citations
are clear indications that patents are widely used ex-post, technological disruptiveness is
specifically designed to capture new and fast-growing ideas ex-ante. This distinction is
evident in Panel A, where patents displaying high levels of disruptiveness tend to build-
out novel ideas (e.g., the use of HTML in the mid-nineties), rather than refinements or
synthesis of existing ideas (e.g., the iPhone or semiconductor advances in the mid-2000s).
Indeed, the average percentile of technological disruptiveness for these 25 patents is 57,
as the most disruptive patents refer to more nascent technologies.
[Insert Table III about here]
Panel B displays similar figures for a collection of twelve unambiguous breakthrough
patents, as identified by the USPTO’s “Significant Historical Patents of the United
States”.21 The average percentile of technological disruptiveness of these patents is very
high (84th percentile). The most disruptive patents in this set are “Complex computer”
in 1944 (#2668661) and DNA modifications in 1980 (#4399216), both of which virtually
created new industries. Other key inventions, such as the satellite, laser, and PageRank,
20
Additionally, our measure can be computed for all patents, whereas economic value (which may not
necessarily coincide with scientific value) can only be computed for public firm patents (which represent
only 28% of all patents).
21
Listed patents applied before 1960 come from a list of historical patents at
http://www.uspat.com/historical/. More recent patents are noted for the revenue they generated.
14use vocabulary that is new and rapidly growing across many patents around the time of
their application. Interestingly, some of these breakthrough inventions are barely cited.
For instance, the patents related to the invention of the “television” (#1773980) and the
“helicopter” (#1848389) are in the lowest percentile of the cohort-adjusted distribution
of citations. Yet, our new measure classifies these patents as highly disruptive.22 In the
Appendix (Table A1), we consider a more comprehensive list of 101 important patents
between 1930 and 2010 identified by Kelly, Papanikolaou, Seru, and Taddy (2018), which
encompasses indisputably important and radical inventions (see their Table A.6). We
again consider the percentiles of the distributions of technological disruptiveness and ci-
tations, and report that the average patent in this set of breakthrough inventions is in
the 77th percentile of disruptiveness, but only in the 64th percentile of citations.23
Tables II and III also provide statistics for the other text-based measures. Unlike
patents’ technological disruptiveness, patent breadth is evenly centered around its av-
erage value of 0.42, indicating less skew in specializations across patents. Remarkably,
Table III indicates that patents’ technological breadth and their originality (as defined by
Trajtenberg, Henderson, and Jaffe (1997)) are largely unrelated.24 For instance, software-
related patents (e.g., #6964374, #7630986, or #7356679) display low levels of technologi-
cal breadth, as they rely on a relatively narrow vocabularies. Yet, they rank high in terms
of their originality. In contrast, breakthrough inventions display above-median levels of
technological breadth. For example, the invention of the satellite, computer, and the jet
engine combine broad scientific language.
22
Kelly, Papanikolaou, Seru, and Taddy (2018) similarly note that some patents classified as significant
based on their measure attract few citations, and provide illustrative examples, such as patent #174465
issued to Graham Bell for the telephone in 1876 having received only 10 citations until March 2018.
23
For comparison, Kelly, Papanikolaou, Seru, and Taddy (2018) report that the average patent is this
same set is in the 73th percentile of the distribution of their patent significance measure, and the average
percentile for the KPSS measure for this set of patents is 64.
24
The construction of our breadth measure is somewhat similar to that of originality, but we measure
concentration based on the assignment of words to technology areas rather than citations. This has several
advantages. First, our measure of breadth is well defined even for patents with zero or one backward
citations. Second, technology links revealed by vocabularies are not influenced by strategic avoidance of
citations and do not rely on patent examiners having a complete knowledge of the patent space. Third,
our measure of breadth can pick up a reliance on a technology area even if no specific citation to that
area is given. For example, a patent might use “textbook” information about chemistry to describe a
portion of the invention without needing to cite a “Chemical” patent.
15Finally, we observe some variation in similarity across patents, but the overall levels
are low, which is not surprising given the large range and diversity in the vocabulary used
across all patents. Panel C of Table II further indicates that the text-based measures
capture distinct dimensions of the technological nature of patents. Patents with higher
levels of disruptiveness tend to display lower breadth. They are also located nearer to
patents of lead innovators than to patents assigned to private or foreign firms. We also
note that patents nearer to lead innovators tend have lower technological breadth, while
those most similar to private and foreign firms display higher breadth.
III The Decline in Technological Disruptiveness
In this section, we document the aggregate time-series properties of our text-based tech-
nological characteristics between 1930 and 2010. We then contrast these technological
changes with aggregate changes in IPO and acquisition activities occurring between 1980
and 2010.
A Technological Changes in the Last Century
To track the evolution of technological disruptiveness over time, we compute the aggre-
gate stock of technological disruptiveness.25 Figure II displays the time-series from 1930
and 2010, smoothed using a four-quarters moving average. Several interesting patterns
emerge, suggesting important changes in the technological characteristics of U.S. innova-
tion. Although there is considerable fluctuation, the evolution closely maps the history of
U.S. innovation. We easily detect periods of sharply increasing disruptiveness. The first
peak occurs around 1950 with an average level of disruptiveness that is almost double the
level of 1930. The period around 1950 is often considered a time of radical innovation
in manufacturing technologies, featuring the invention of the television, transistor, jet
engine, nylon, and xerography. A second peak occurs in the mid-seventies, corresponding
to innovation related to the computer. The last two peaks of technological disruption ap-
25
To compute the aggregate stock of any patent variable, we first compute the sum of Tech Disrup-
tiveness for patents applied for in a given quarter. We then compute a rolling depreciated sum of the
prior 20 quarters, using a 5% quarterly rate of depreciation. Finally, we normalize the rolling stock by
the number of patents applied for in the 20 prior quarters.
16pear in the late eighties and mid-nineties, reflecting waves of inventions related to genetics
(e.g., methods of recombination) and the mass adoption of the Internet.
[Insert Figure II about here]
Despite these periodic surges in disruption, the 1930-2010 period is characterized by
a protracted and steady long-term decline in the disruptiveness of U.S. patents. Between
1950 and 2010, the average level of technological disruptiveness has significantly decreased,
with levels in 2010 being roughly one quarter that of 1950. Importantly, this decline is
not due to changes in the composition of patents (e.g., shifts across technology classes) as
we continue to observe a similar trend after we account for broad technology and location
fixed effects. Rather, the decline in technological disruptiveness indicates a widespread
deceleration in vocabulary usage growth rates among U.S. patents. This trend echoes
recent research highlighting the increasing difficulty to generate new innovative ideas
(e.g., Jones (2009) and Bloom, Jones, Reenen, and Webb (2017)).
Figure II also reveals important changes in the technological breadth of U.S. patents.
The overall level of breadth steadily increases between 1930 to 1970. Beginning in the
mid-seventies, there is a twenty-year period of growth in overall patent breadth which
reaches a peak in the mid-nineties that was 20% above the 1970 level. In the most recent
years, however, there is a large decline in the breadth of U.S. patents, dropping by about
25% between the mid-nineties and 2010. We also find an inverse U-shaped pattern in
patent similarities over the last century. All three measures steadily increase until the
eighties, as the text in the average U.S. patent during this period became increasingly
similar to patents assigned to private U.S. firms, foreign firms, and lead innovators. Be-
ginning in the eighties, however, these trends reversed, leading to marked declines in the
similarity measures. The recent period is thus characterized by patents becoming both
more specialized (i.e., lower technological breadth) and more distinct across firms.
B Technology, IPO, and Acquisitions (1980-2010)
We next examine the aggregate time-series properties of IPOs and acquisitions. We obtain
data on IPOs from Jay Ritter’s website, and exclude non-operating companies, as well as
17IPOs with an offer price lower than $5 per share, unit offers, small best effort offers, bank
and savings and loans IPOs, natural resource limited partnerships, companies not listed
in CRSP within 6 month of their IPO, and foreign firms’ IPOs. Data on acquisitions are
from the Thomson Reuters SDC Platinum Database, and include all domestic completed
acquisitions (of private or public firms) coded as a merger, acquisition of majority interest,
or acquisition of assets giving the acquirer a majority stake.
[Insert Figure III about here]
Panel A of Figure III plots the number of IPOs for each quarter between 1980 and
2010. The patterns are similar to those reported by Gao, Ritter, and Zhu (2013), Doidge,
Karolyi, and Stulz (2017), and Ewens and Farre-Mensa (2018). Remarkably, the evolution
of IPO activity rather closely maps the aggregate dynamics of technological disruptiveness
during this thirty-year period. The number of IPOs drops around 1990, coinciding with a
decline in disruptiveness that follows the earlier surge in genetic science in the mid-1980s.
There were more IPOs as the nineties progressed, when technological disruptiveness expe-
rienced a very large increase. The decline in IPO intensity then began in the early 2000s,
when the average technological disruptiveness of U.S. patents also started to plummet. In
the aggregate, the intensity of new public listings is substantially higher at times where
the average technological disruptiveness of U.S. patent applications is elevated.
Panel B of Figure III plots the evolution of the number of acquisitions, both in total
and separately for private firms. The number of acquisitions has increased since 1980, with
a strong acceleration in the mid-nineties. We note subsequent declines in acquisitions in
the aftermath of the tech bubble and the financial crisis. Yet, the number of acquisitions
remains significantly higher since the mid-nineties when compared to the 1980-1995 pe-
riod, suggesting a relationship between the surge in aggregate acquisitions and the decline
in technological disruptiveness of U.S. patents. Although the aggregate pattern for trade
sales is less striking than that for IPOs, the patterns suggest that acquisitions tend to be
high when overall technological disruptiveness is lower.
18IV Technological Disruptiveness and Startups’ Exits
To better understand the interplay between technological changes and exits, we explore
the cross-sectional relationship between our text-based technological characteristics and
the decision of private firms to exit by going public or through trade sales. Ideally, we
would study the exit strategy of all private firms that are plausible candidates for IPOs
or acquisitions. Because data limitations preclude this, we focus on a large sample of
venture-backed private firms, for which we observe both their technological characteristics
and their exit choices.
A Sample of VC-backed Startups
We obtain data on VC-backed U.S. firms from Thomson Reuters’s VentureXpert (Ka-
plan, Stromberg, and Sensoy (2002)), which contains detailed information about private
startups including the dates of financing rounds and their ultimate exit (e.g., IPO, ac-
quisition, or failure). We focus on the period 1980-2010 and restrict our attention to
VC-backed companies (henceforth startups) that are granted at least one patent during
the sample period. To assign patents to VC-backed startups, we follow Bernstein, Giroud,
and Townsend (2016) and develop a fuzzy matching algorithm that matches the names of
firms in VentureXpert to patent assignees obtained from Google Patents (see Appendix C
for details). The result is an unbalanced panel of startups-quarter observations.26 A
startup enters our sample in the quarter it is founded (based on founding dates in Ven-
tureXpert) and exits the sample when its final outcome (IPO, acquisition, or failure) is
observed based on the ”resolve date” variable in VentureXpert. Startups still active as of
November 2017 remain unresolved.27 We exclude startups if their founding date is missing
or if it is later than the resolve date. The sample begins in 1980 to guarantee reliable
data on outcomes and ends in 2010 because this is when the link to publicly traded firms
created by Kogan, Papanikolaou, Seru, and Stoffman (2016) ends. Our final sample con-
26
Lerner and Seru (2017) note that bias can occur in matching patent assignments to startups because
patents can be assigned to subsidiaries with different names than their parent corporations. However,
this issue is limited in our sample as VC-backed startups are small and are unlikely to have complex
corporate structures.
27
Ewens and Farre-Mensa (2018) note that unresolved firms can result from stale data collection. Thus,
we code firms as failed if it has been seven years since their last funding round.
19tains 347,929 startup-quarter observations, corresponding to 9,167 unique startups and
94,703 patent applications.
We obtain the technological characteristics for each startup-quarter by aggregating
each patent-level variable (text-based and others) using their depreciated sums over the
past 20 quarters using a quarterly depreciation rate of 5%. For example, the technological
disruptiveness of startup i in quarter q corresponds to the depreciated sum of the disrup-
tiveness of all its patent applications in the past five years, normalized by the number of
patents i applied for over that period.28 We define the exit variables (IPO or sell-out)
as binary variables equal to one if startup i experiences a given exit in quarter q. The
construction of all variables is explained in detail in Appendix B.
[Insert Table IV about here]
As we found for the overall statistics reported in Table II, we find in Table IV a sub-
stantial asymmetry in the distribution of technological disruptiveness among VC-backed
startups despite the aggregation of their patents. The other variables are overall in line
with their aggregate counterparts, indicating that the technological characteristics of VC-
backed startups are roughly representative of those in the economy at large. Table IV
further indicates that the quarterly IPO rate (i.e. the number of IPOs in a quarter di-
vided by the number of active startups in that quarter) is 0.38 percentage points, and the
quarterly sell-out rate is 0.54 percentage points.29
[Insert Figure IV and Figure V about here]
Figure IV plots the time-series of technological characteristics for all unresolved VC-
backed startups in each quarter. For the sake of comparison, we compute the aggregate
28
Because Foreign Similarity and LI Similarity are non-trivially correlated (60% and 45%) with Private
Similarity, in regressions, we orthogonalize Foreign Similarity and LI Similarity by subtracting Private
Similarity.
29
We report additional information about the sample firms in Appendix D in Table A2. Relative to
the founding date, IPOs and acquisitions play out over time. Of these, IPOs occur fastest on average.
The average firm applies for its first patent after 4.42 years, and receives its first round of VC funding
5.29 years after its founding. All of these numbers are mechanistically shorter when measured relative to
the first patent instead of the founding year.
20stock of each variable for the set of patents granted to VC-backed startups as in Figure II.
The trends closely map those of the aggregate dynamics presented in Figure II, indicat-
ing that the technological changes occurring among startups is mirroring economy-wide
changes. In Figure V, we compare the evolution of IPO and sell-out rates for VC-backed
startups to the aggregate patterns. We scale the quarterly number of IPOs and acqui-
sitions by lagged real GDP to obtain aggregate exit rates. The upper figure shows that
the evolution of IPO rates for VC-backed startups between 1980 and 2010 closely follows
aggregate IPO rates, especially the decreased IPO rates after 2000. The lower figure also
shows agreement between the sell-out rates observed for VC-backed startups and the ag-
gregate trend. In particular, we observe growth in acquisition activity in the latter part
of the sample.
Although our sample does not include all firms that have the potential to go public or
get acquired, VC-backed startups nevertheless represents a useful laboratory to study the
interplay between technological changes and the evolution of IPOs and acquisitions. First,
these firms account for a large share of the IPO market (Ritter (2017)) and the production
of innovation (Gornall and Strebulaev (2015)). Second, their IPO and acquisition rates
from the last thirty years appear comparable to the economy-wide patterns, as shown in
the figures above. Third, they are (almost) automatically facing exit choices due to the
limited lives of most venture capital funds.
B Startups’ Disruptiveness: Validation Tests
Our analysis rests on the ability of our measure of patents’ disruptiveness to identify
(in a timely manner) startups that can create new markets or disrupt existing ones.
To corroborate this interpretation, we examine whether the startups that we classify as
technologically disruptive (based on their patents) do in fact operate in product markets
that display higher risk of disruption.
First, for each startup, we identify public firms offering similar products and services,
following an approach similar to Hoberg and Phillips (2016). We obtain product descrip-
tions of startups from VentureXpert as reported in the year of their first round of funding.
We then compute the (cosine) similarity between the text in each startup’s product de-
21scription (in year t) and that of all public firms, obtained from the product description
section of their 10-K report (also in year t). Since 10-Ks became available in electronic
format in 1997, we focus on 5,417 startups whose first funding round occurred after 1996.
To identify the public firms operating in a given startup’s market (in year t), we retain
the 25 public firms that have the most similar product descriptions relative to the startup.
This is done by measuring the cosine similarity between the startup’s business description
and public firm 10-K business descriptions and taking the 25 public firms with the highest
cosine similarity.
Next, for each startup, we measure whether its 25 public “peers” are actually at
risk of disruption. We do so by computing the fraction of paragraphs in each public
firm’s 10-K that mentions words related to technology-based disruption, considering three
measures. First, we search for paragraphs that contain words having the root “technol”
and also a word having the root “change” to measure whether public peers are discussing
exposures to technological change, a direct form of market disruption. Second, we identify
paragraphs having the words with the root “technol” and also the word root “compet”
to identify firms that are explicitly discussing competition on the margin of technological
expertise. Third, we consider the more strict set of paragraphs containing at least one
word with the roots “disrupt”, “technol”, and “compet”. In order to be counted as a
hit, a paragraph must contain all three. Table V reveals a positive association between
the technological disruptiveness of startups (using our text-based patent measure) and
these ex-post mentions of market disruption by related public firms. This strong positive
relationship holds across specifications that include either year fixed effects or a more
complete set including year, technology, location, age, and cohort fixed effects.
[Insert Table V about here]
In a separate set of validation tests, we examine the product market characteristics of
848 startups in our sample that go public after 1997. Because these startups gain public
status, we are able to link their ex-ante technological disruptiveness to the product market
attributes that are only measurable when firms are publicly traded. For each IPO firm,
we thus consider three characteristics of their post-IPO market (measured in the year of
22You can also read