STATE PERSPECTIVE AND STRATEGIC PLAN (SPSP) OF NAGALAND - STATE LEVEL NODAL AGENCY FOR IWMP DEPARTMENT OF LAND RESOURCES GOVERNMENT OF NAGALAND
←
→
Page content transcription
If your browser does not render page correctly, please read the page content below
INTEGRATED WATERSHED
MANAGEMENT PROGRAMME (IWMP)

      STATE PERSPECTIVE
             AND
    STRATEGIC PLAN (SPSP)
              OF
         NAGALAND

 STATE LEVEL NODAL AGENCY FOR IWMP
   DEPARTMENT OF LAND RESOURCES
     GOVERNMENT OF NAGALAND

                -1-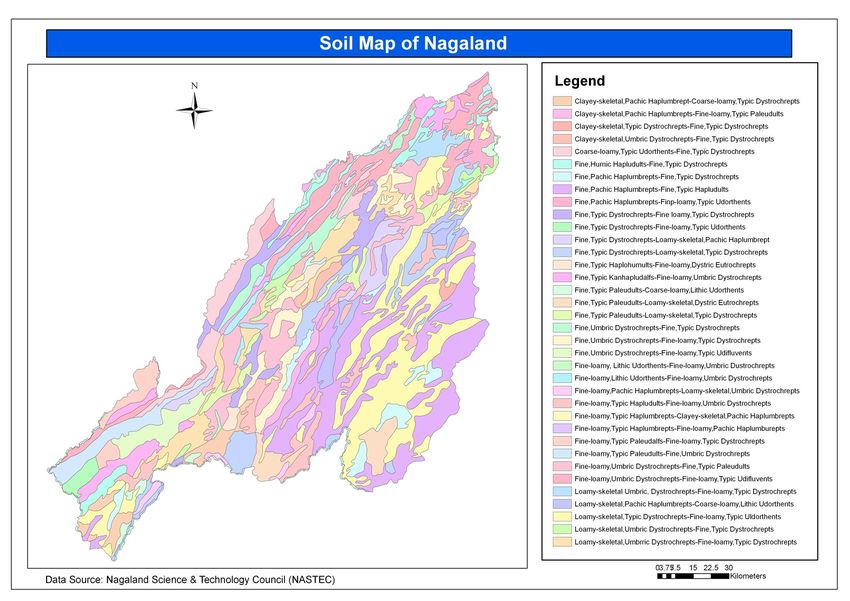
CONTENT

Chapter                                     PARTICULAR
          Introduction
          Drainage system & river basins
  1       Table 1: Overview of State profile
          Economic development
          Role of watershed management in the state
          Agro-climatic zones
          Table 2: Details of Agro-climatic zones in the state
          Rainfall
          Table 3: Details of average rainfall and altitude recorded at the district
  2
          headquarters
          Drought and flood in the state
          Table 4: Details of drought and flood affected districts, blocks and villages in the
          state during last 10 years
          Demography & Land Distribution
          Land reform measures and operational land holdings
          Table 5: Details of district-wise land holding pattern in the state
  3
          Table 6: Share of Agriculture sector to state income/National income at current
          prices and total workforce in the state and India
          Table 7: Sectoral composition of Net State Domestic Product in state
          Land Use Pattern
          Table 8: Land use status in the state
          Irrigated areas
  4       Table 9: Irrigation status
          Table 10: Source-wise area irrigated
          Common Property Resource
          Table 11: Details of common property resources in the state
          Trends in Agriculture & Food productivity
          Table 12: Crop production and productivity as per Agriculture Statistics, 2008
  5
          Table 13: Comparative average yield of major crops of the state and India during
          triennia 1972-73 to 1974-75 and 1992-93 to 1994-95
          Implementation of Watershed Programmes in the state at present
          Table 14: Status of District-wise area covered under the watershed programme
          Table 15: Details regarding the watershed projects sanctioned by DoLR in the
          state
  6
          Table 16: Details of watershed projects implemented in the state with the financial
          assistance other than DoLR
          Table 17: Details of pending UCs
          Table 18: Details of unspent balance

                                            -2-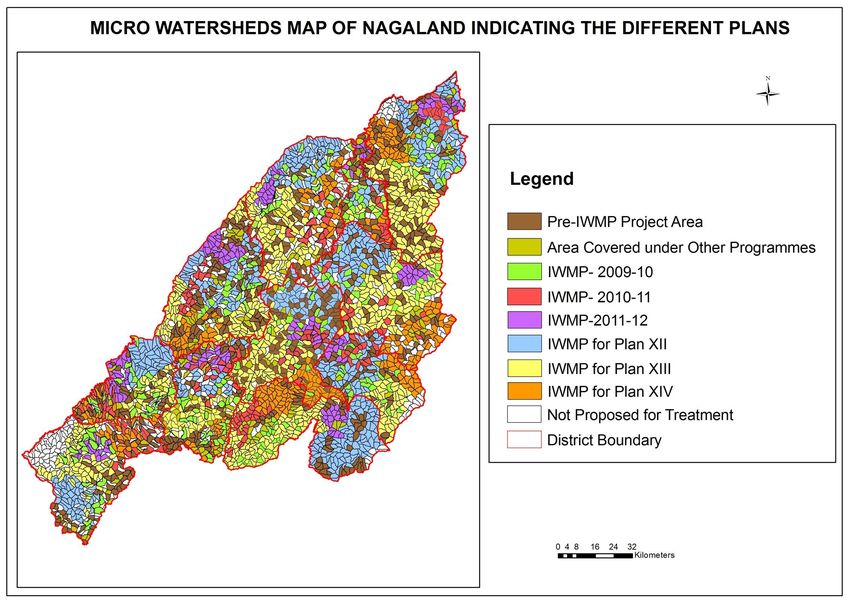
Strategy for implementation of IWMP
Table 19: Plan-wise phasing of physical and financial target of IWMP for next 18
years
Table 20: Year-wise phasing of physical and financial targets of IWMP for
remaining period of XI plan
7 Table 21: Details of district-wise and category-wise are proposed to be taken up
under IWMP during next 3 Years
Table 22: Details of Convergence of IWMP with other schemes
Public-private partnership
Table 23: Summary of Public-private partnership in the IWMP projects
Planning process- Details of scientific criteria/inputs used in planning
Livelihood Concerns
8 Table 24: Details of livelihoods created for landless people
Table 25: Details of other livelihoods created for farmers
Institutional Arrangements
Table 26: Details of SLNA
Table 27: Details of SLNA (Contd..)
9 Table 28: Details of functionaries in the SLNA
Table 29: Details of State Level Data Cell functionaries
State level monitoring/Evaluation
Table 30: Details of functionaries in DWDU
Capacity Building
10 Table 31: List of training Institutes identified for capacity building at state level
Table 32: Details of IEC activities
Monitoring and Evaluation
11
Table 33: List of Institutes identified for M & E at state level
Expected Outcomes
12
Table 34: Expected/Estimated outcomes
Enclosed: 1. GIS based Map of Nagaland
2. GIS based Rivers and Drainage Map of
Nagaland
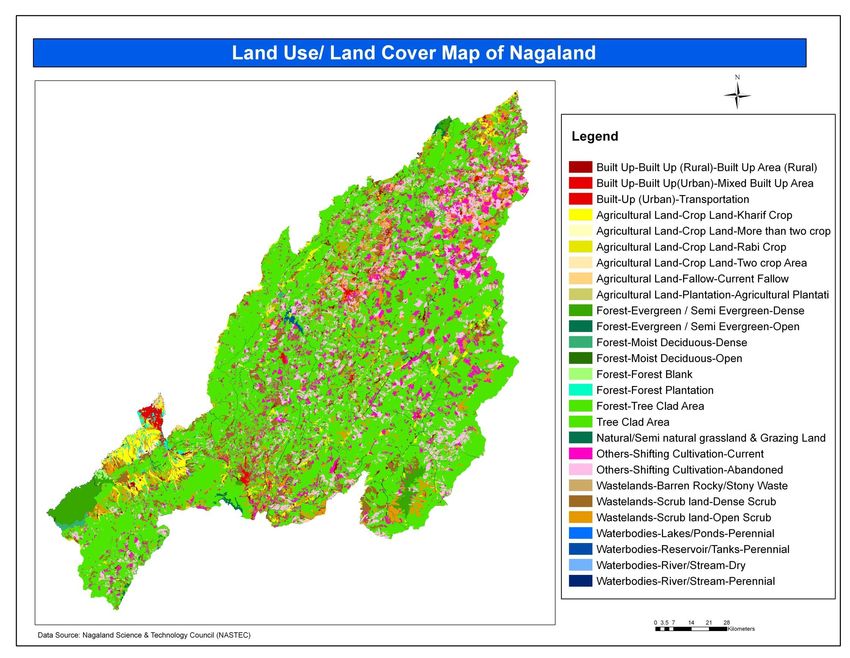
3. Land Use/Land Cover Map of Nagaland
13
4. Soil Map of Nagaland
5. Physiography Map of Nagaland
6. Micro Watershed Area Map of Nagaland depicting the
area to be treated for the next 18 years
-3-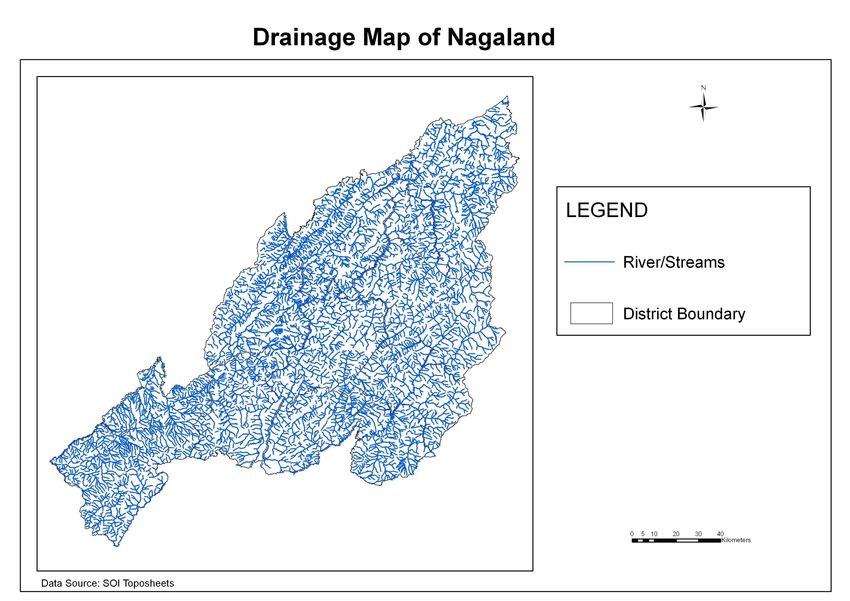
Chapter I
INTRODUCTION

      Nagaland, the 16th. State of the Indian Union, came into being on 1st. December, 1963.
Nagaland with a geographical area of about 16,579 Sq. Km. lies between 25°60‟ and 27°40‟
North latitude and 93°20‟ and 95°15‟ East longitude. The state is bounded by Assam in the
North and West, by Myanmar and Arunachal Pradesh in the East and by Manipur in the South.

       Nagaland, being one of the “eight Sisters” commonly called as the North-Eastern
Region including Sikkim*, is a land of lush green forests, rolling mountains, enchanting
valleys, swift flowing streams and of beautiful landscape.

       The inhabitants of Nagaland are almost entirely tribal with distinctive dialects and
cultural features. The state is predominantly rural with 82.26% of population living in villages.
The state comprises of 11 administrative headquarters with 52 blocks and 1278 inhabited
villages. Each district has generally predominance/concentration of one of the major/minor
tribe of the state, thereby making districts distinct in their linguistic, cultural, traditional and
socio-political characteristics.

       The topography of Nagaland is much dissected, full of hill ranges, which break into a
wide chaos of spurs and ridges. The terrain is mountainous covered by rich and varied
biodiversity of flora and fauna. It is one of the 25 hot spots of the world with respect to its
biological diversity, and hence can be termed as the state of true Mega bio-diversity. The state
houses the confluence of flora and fauna of the neighboring regions. Geographically, the state
largely has vast undulating terrain and hilly landscape and some low lying areas giving rise to
a very conducive climate with presence of perennial water and moisture for truly rich variety
of flora and fauna. The state also has abundant resources of mineral wealth in the form of
vast deposits of Oil, Coal, Peat, Limestone, Iron ores and various other minerals. The potential
of this state in terms of the sheer variety of Agro and Horticultural produce including Fiber,
Tea, Coffee, Pineapple, Orange etc. is also immense.

       In spite of this inherent potential, the state has not developed. The current practice of
agriculture is largely unsustainable owing to the traditional Jhum (Shifting cultivation) cycle
mode of operation. Though some dynamic initiatives (e.g., by various Govt. Depts. NGOs etc.)
are in action to mitigate the detrimental effects of Jhum, a lot still needs to be done on
various fronts including efforts on checking deforestation, control of wild fire, conservation of
biodiversity, proper water harvesting, use of non-conventional energy sources etc. The state
also lacks infrastructure development in terms of networking with the rest of the country, lack
of proper communication in terms of roads and information technology.

                                                -4-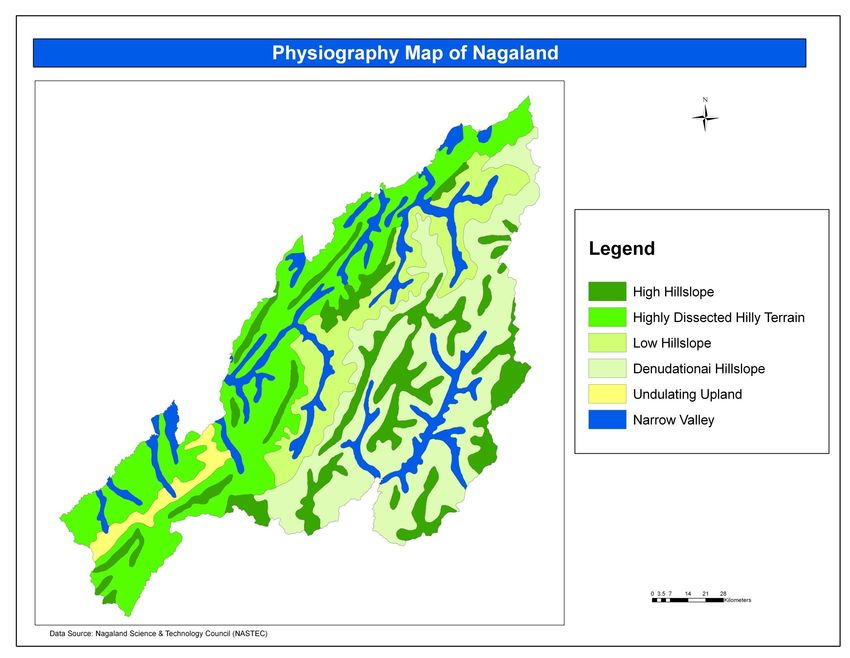
DRAINAGE SYSTEM AND RIVER BASINS

       Nagaland is dissected by a number of seasonal and perennial rivers and rivulets.
The major rivers of Nagaland are Doyang, Dikhu, Dhansiri, Tizu, Tsurong, Nanung,
Tsurang or Disai, Tsumok, Menung, Dzu, Langlong, Zunki,, Likimro, Lanye, Dzuza and
Manglu. All these rivers are dendritic in nature. Of the rivers, Dhansiri, Doyang and Dikhu
flows westward into the Brahmaputra. The Tizu river, on the other hand, flows towards
east and joins the Chindwin River in Burma.

Doyang: It is the longest river in the state originating from the Japfü Hill near the
southern slope of Mao in Manipur and moves in a south west direction passing through
Kohima district and flows northward into Zunheboto and Wokha District. It passes
through a great part of Wokha District and flows south westerly into Dhansiri in Sibsagar
District of Assam. The main tributaries of Doyang are Chubi river which flows southward
from Mokokchung District and Nzhu River, originating from Nerhema area of Kohima
district and flows through Miphong in Tseminyu area and finally pours itself to Doyang.

Dikhu: River Dikhu which has a total length of about 160 kms. originates from Nuroto
Hill area in Zunheboto district. The river traverses towards north along the border of
Mokokchung and Tuensang districts. The main tributaries of river Dikhu are Yangyu of
Tuensang district and Nanung in the Langpangkong range in Mokokchung district.. The
river flows further northward and leaves the hill near Naginimora and finally merges with
the Brahmaputra River in the plains of Assam.

Dhansiri: Dhansiri flows through the southwestern part of the state through
Rangapahar-Dimapur Plains of Dimapur District. This river receives almost all the western
and southern drainages of Nagaland. Its main tributaries are river Dzuza and Diphu. At
the extreme southwest of the state, it assumes a northwardly course forming a natural
boundary with North Cachar Hills of Assam which finally drains into the Brahmaputra.

Tizu: The Tizu River forms an important drainage system in the eastern part of the state.
It originates from the central part of the state and runs through a northeast direction
flows through Zunheboto, Phek district and empties itself in the Chindwin River of
Myanmar. The main tributaries of River Tizu are river Zunki, Lanye and Likimro.

Milak: Milak is another important river which flows through Mokokchung District. One of
its main tributary is Tsurong.

Zungki: The Zunki river which is the biggest tributary of Tizu, starts from the north-
eastern part of Changdong forest in the south of Teku and flows in southernly direction
towards Noklak, Shamator and Kiphire and finally joins Tizu below Kiphire.

                                    -5-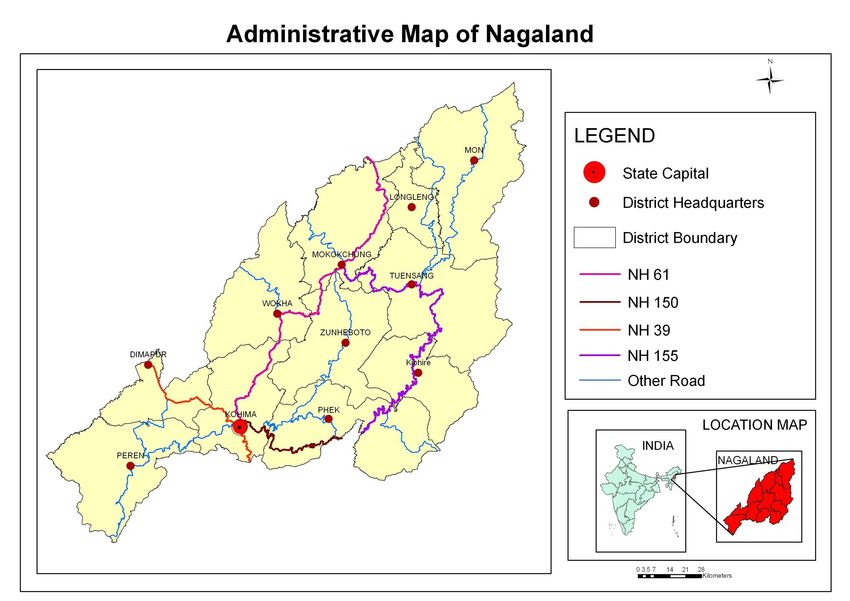
OVERVIEW OF THE STATE

      Table SPSP 1: State Profile

1              2             3           4              5               6                                                      7

                                                   Total no. of                                                Population (As per the 2001 Census)
Sl.                        No. of   Total no. of      Gram        Geogr-aphical           Male                    Female                             Total            % of BPL to
        Name of District
No.                        Blocks    villages        Panch-        area in Ha.                     Othe                        Oth                                    total popul-
                                                    ayats/VCs                     SC      ST              SC        ST                SC             ST      Others      ation
                                                                                                    rs                         ers
 1.    Dimapur               4          216            216             92700           1,66,335                  1,42,047                       3,08,382                 54.29
 2.    Wokha                 5          128            128            162800           83, 620                    77,478                        1,61,098                 79.78
 3.    Peren*                3                                        170150
                                        180            180                             1,61,701                  1,52,665                       3,14,366                 89.85
 4.    Kohima                4                                        141250
 5.    Zunheboto             6          187            187            125500            79,627                    75,282                        1,54,909                 85.07
 6.    Mon                   6          110            110            178600           1,38,005                  1,21,599                       2,59,604                 64.37
 7.    Tuensang              8                                        247894
 8.    Longleng*             2          251            251             58721           2,16,888                  1,97,913                       4,14,801                 64.45
 9.    Kiphire*              3                                        116185
10.    Mokok-chung           6         102            102             161500           1,18,428                  1,08,802                        2,27,230                57.84
11.    Phek                  5         104            104             202600            77,082                    71,164                         1,48,246                72.65
          NAGALAND          52         1278           1278        1657900              10,41,686                 9,46,950                       19,88,636                69.79

         * Peren, Longleng & Kiphire districts were created only in the year 2004 from Kohima & Tuensang districts.

         (Source: Directorate of Economics & Statistics & NASTEC, Nagaland)

                                                                                       -4-
ECONOMIC DEVELOPMENT

        The developmental experience of Nagaland has been full of challenges. Apart
from its late start, geographical remoteness and inaccessibility, hilly terrain, lack of
infrastructure, population composition, and scarce resource base, the State also had
to face continuous insurgency, spending much of its resources on administration and
related costs at the expense of development. Despite the progress made in a span of
45 years, Nagaland economy still confronts many developmental challenges.
Foremost among them are relative isolation, the difficult terrain, and inaccessibility to
the rest of the world and continued insurgency. These handicaps the State‟s
endeavors towards industrial and entrepreneurial development, private sector
partnership in spearheading development initiatives and all round regional planning.

       The Gross State Domestic Product for the year 2004-05 is estimated at Rs.
463769 lakhs with a per capita income of Rs. 19554. The infrastructure Development
Index (IDI) for the state stands at 71 against the all India average of 138. The state
of Nagaland continues to be confronted with many inadequacies in the areas of
physical and social infrastructure. For the development of such essential and critical
areas, the state is constantly faced with acute financial and resource problems. One
of the reasons for this state of affairs is the almost non-existent Tax base of the
state. The tribal traditions and customs of the inhabitants have also been protected
by special provisions in the constitution of India as a result of which, the state does
not own any land unless purchased from the people for specific purposes by the
government.

        Nagaland economy has grown but not at the rate that has been expected. The
state government is making an attempt to boost the economy by developing the
infrastructure and also by setting up new industries. With the state government
efforts, the economy of Nagaland is bound to rise in the near future.

Agriculture: Agriculture is one of the significant contributors to the Net State
Domestic Product and is the largest employer of the working force in the state.
Though the dependency of employment on agriculture has declined from as high as
96.50% in the 1950s to about 68% in 2000, it continues to be the main source of
livelihood. Shifting and terraced cultivations remains the dominant forms of land use
practice in the state. The traditional form of shifting cultivation i.e. jhum, is the
method of cultivation that is widely practiced across Nagaland. Jhum occupies about
90% of the area under agriculture. Terraced cultivation is confined largely to the
districts of Kohima, Dimapur, Tuensang, Peren, Phek and Wokha. The single
cropping system is prevalent in the state resulting in low cropping intensity. Multiple
cropping is yet to be practiced by farmers except in very small and negligible
pockets. During the last decade, the cropping intensity remained constant at about
110%. The cropping season which begins in March and continues upto August is
Kharif while the Rabi season starts in September and ends in December every year.
Rabi crops are mainly confined to vegetables. Rice is the staple food of the people,
hence paddy is the major crop in the state. Use of technological interventions in
terms of improved seeds, fertilizers and better implements has been limited. The
mechanization of agriculture has been poor because of the nature of the terrain in
the state and the low purchasing power of the farmers. The consumption of
fertilizers and pesticide has not been uniform and almost negligible until recently.
The state government is trying to turn this into an advantage by accessing markets
for „organic foods‟. The state department of agriculture has established a research
station at Mokokchung with three other sub-stations in the state to adopt
technological innovation for local use.
Power: The state still suffers from a shortfall in its generation of power. Against the
present requirement of 60 MW, the state‟s own generation is a mere 14.50 MW only.
This shortfall is presently met through purchases from other neighboring states like
Manipur, Assam and Meghalaya. The total number of villages electrified as on 2001-
2002 was 1216 constituting 95% of the inhabited villages. Per capita consumption of
electricity was 88 Kws during 1996-97, as compare to the minimum of 80.4 Kws by
Tripura and maximum of 192.80 Kws by Meghalaya among the north-eastern states.
Transport & Communication: During the year 2003-04, the total length of the
roads in the state of Nagaland was 13371 Km. Of this, the total length of surface
roads was 6225.62 Km and unsurfaced roads was 7145.83 Km constituting 46.56%
and 53.44% respectively of the total road length in the state. The road density per
thousand Sq. Km. of geographical area was 807 Km. The state has 248 Km. of
National Highways and 1033 Km. of State Highways. The current status of road
network in the state is very poor. As on 31st. March 2000 only 29.24% villages were
connected by pucca roads while the remaining 70.76% of the villages were still
connected only by kutcha roads. The only means of intra-state movement being
roads, paucity of all weather roads causes delay in supply of essential commodities
leading to cost escalation particularly during monsoon.
Irrigation: At present there are no medium or large irrigation projects in the state.
The potential for irrigation is estimated at 165000 Ha. against a net sown area of
312770 Ha. The irrigated area was 64,490 Ha. (2002-03). The districts with the large
area irrigation are Kohima, Dimapur, Phek, Wokha and Tuensang. However, barring
few pockets along the foothills, irrigation is by and large surface water which is fully
dependent on the monsoon rain, and thus the entire irrigated areas fall under the
category of rainfed.
Role of watershed management in the state
In Nagaland, the high prevalence of shifting cultivation, also known as Jhum,
forms the major cause of wastelands. With the rapid increase in population, the
jhum cycle has now been reduced to 5-8 years and the previously uncultivated and
steep land is being taken into the jhum system. This results in accelerating both on
site and off site degradation due to erosion, runoff, nutrient losses, siltation, loss of
bio-diversity and disruption in watershed hydrology.
-6-In spite of several attempts made in the past by the State Government to
wean people away from this practice, majority of the people continue to practice
jhum and the total area put under this system continue to increase rapidly, thereby
causing natural resource degradation.
Having realized the gravity of the problem of natural resource degradation
and the urgency of evolving a strategy for management of the land, various Centrally
Sponsored Schemes of Watershed Programmes have been taken up in the state.
With the implementation of Watershed Programmes, the vast jhum land which lies
barren, are being reclaimed for afforestation, horticulture, cash crop cultivation
thereby providing subsistence for the farmers and also various soil and moisture
conservation measures are being incorporated in the programme. The programme
being community-based, a sustained community action for operation and
maintenance of assets have been created and further development of the potential
of the natural resources in the watershed is encouraged. The poorer sections of the
society are also benefited by enrolling themselves as part of the Self Help Group,
whereby various income generating activities are taken up.
The department of Land Resources has been implementing Centrally
Sponsored Scheme of Integrated Wastelands Development Programme (IWDP) in
the state under which grant-in-aid is provided from the Ministry of Rural
Development, Department of Land Resources, for development of wastelands on
watershed basis. This is one of the major watershed programmes implemented in
the state.
A total of 42 projects have been sanctioned so far by the Government of India
covering 694 micro-watershed and a total watershed area of 3,76,806.50 ha. Out of
which, 38 projects have been completed and the remaining 4 are expected to be
completed during 2010-11.
The expected outcomes as a result of the implementation of the watershed
programmes are as follows:
1. Increase in productivity of the land.
2. Create employment opportunities
3. Raise rural incomes and living standard
4. Reduction in migration from rural areas
5. Increase in water table in the area
6. Restore ecological balance and overall environmental
improvement.
-7-Chapter 2
AGRO-CLIMATIC ZONES
The climate of Nagaland to a large extent is controlled by its undulating
topographical terrain features. It is hot to warm sub-tropical in area with elevation of
1000-1200m above MSL. The foothill plains, sheltered valleys and the ranges are
marked with climatic contrasts. The year is divided into four seasons viz., winter
(December-February), Pre-monsoon (March-April), Monsoon (May-September) and
retreating monsoon (October-November).
The beginning of winter is marked by a steep fall in temperature during
December. January is the coldest month. In February the temperature starts rising
gradually. The winter winds are generally weak and variable. The average annual
temperature ranges from 18°C-20°C to 23°C-25°C respectively in the higher and
lower elevation. The monsoon lasts for five months from May to September with
June, July and August being the wettest months. The following agro-climatic zones in
Nagaland are divided into four zones:
I. Hot per-humid climate
II. Hot moist sub-humid climate
III. Warm humid climate
IV. Warm per-humid climate
Soil: The soils of Nagaland are derived from tertiary rocks belonging to Barail and
Disang series. Though the state is small, due to large variation in topography and
climate, the following kinds of soils occur in the state:
(i) Alluvial soils-
a) Recent alluvium (Entisol),
b) Old alluvium (Oxizols and Ultisol) and
c) Mountain valley soil (Entisol)
(ii) Residual soils-
a) Laterite soils (Oxizols and Ultisol)
b) Brown forest soils (Mollisols and Inceptisols) and
c) Podzolic soils (Spodesols).
(i) Alluvial soils:
Recent alluvium which is also known as Entisol occurs mostly in the western
and southwestern part of the state whereas old alluvium is chiefly found in the
northwestern part of Nagaland bordering Sibsagar District of Assam. Mountain valley
soil (Entisol) with pH 4.4 - 4.6 covering about 224.8 sq. kms occurs mostly in the
valleys of the central and eastern part of the State. Though alluvial soils are more
fertile, their formations are mostly confined to the low-lying areas in the west and to
the banks of the rivers.
-8-(ii) Residual soils:
Residual soils which are generally porous and have light textures dominate a
major landscape of Nagaland. Laterite soil (Oxizol) is the most widespread and
occurs in the mid-southern part and the eastern part of the state. It has pH 4.2 -4.5
and covers 4,495.8 sq.kms of the total area of the State. Brown forest soil (Mollisol),
with a pH content of 5.3-5.8 is found mainly in the intermediate high hill ranges
covering a total area of 4,952.7 sq.kms. Podzolic soil (Spodosol) with pH 5.4 -6.0
covers an area of about 4,835.0 sq.kms and occurs at high altitude with humid and
temperate climate in the central, southern and eastern part of the state. Major part
of the Tuensang District is occupied by this type of soil.
Soils are generally fertile and responsive to application of fertilizer. Nagaland
soils are acidic, very rich in organic carbon but poor in available phosphate and
potash content. The pH value range between 4.80-6.80. While the organic carbon
content may be as high as 2.943%. The average available phosphate and potash
contents are 20 Kg/Ha and 120 Kg/Ha respectively.
The major crops in Nagaland are rice, corn, millets, pulses, oilseeds,
sugarcane, potato, banana, pineapple, orange, litchi, ginger, yams, cucumber and
arecanut. Rice is the dominant crop and also the staple diet of the people. Oil seeds
like rapeseed, mustard, and soyabean are grown in wide areas. Rubber,Coffee,
cardamom and tea are grown as plantation crops in Nagaland. The important
vegetables are gourds, spinach leaf, squash, mustard, onion, chillies, garlic, spring
onion, beans, carrots, tomatoes, brinjal etc., Cash crops like sugarcane, passion fruit
and potato are also becoming popular.
-9-Table SPSP 2: Details of Agro-climatic zones in the State
1 2 3 4 5 6 7
Average
Major crops
Major soil types rainfall in
Sl. Name of the Agro- Area in mm
No. climatic zone Ha. Names of the (preceding Area in
Type Area in
districts 5 years Ha.
Ha. average)
1 Dimapur, Peren, 1. Food grains
Hot per-humid climate 199500 Wokha,
i. Rice 164680
Alfisols 47800
2 Mokokchung, ii. Wheat 1500
Hot moist sub-humid climate 196400 Mon 1000
iii. Jowar
iv. Maize 64700
3 Warm humid climate 370200 Wokha,
Dimapur, Peren,
4 Warm per-humid climate 891800 Phek, Kiphire, 2. Pulses
Mokokchung, Entisols 121300 i. Tur 8500
Mon, Longleng, ii. Gram 1160
Tuensang, 1534.6 Iii. Naga dal 3600
Kohima iv. Beans 1700
v. Kolar 2640
Dimapur, Peren, (Rajmash)
Kohima, Phek,
Wokha, Mon, 3. Oil seeds
Mokokchung, i. Groundnut 950
Inceptisols 1094700 ii. Rapeseed/
Kiphire, 27500
Tuensang, Mustard
Longleng, iii. Soyabean 25480
Zunheboto v. Sunflower 1340Dimapur, Peren,
4. Other Cash
Kohima, Phek, crops 4790
Zunheboto, Ultisols 394100 i. Sugarcane 200
Wokha, ii. Cotton 2500
Tuensang, iii. Jute 3500
Mokokchung, iv. Potato 2600
Longleng, Mon v. Ginger 900
vi. Cardamom 1020
vii. Tea
(Source: 1. National Bureau of Soil Survey and Land use Planning (ICAR), Nagpur, in co-operation with Soil & Water Conservation
Department, Nagaland.
2. Statistical Atlas of Nagaland, Directorate of Economics & Statistics)
- 11 -Rainfall
The climate of the region is characterized by warm summers and cold winters
with seasonal dry spells extending from November to April. The length of growing
period ranges from 180 to 200 days and moisture index ranges from 40 to 60%.
Nagaland enjoys south-east monsoon with average annual rainfall in between 1500mm
to 1800mm occurring over about 6 months from May to October and the potential
evapo-transpiration is 1219 mm. This clearly indicates that there is a shortage of water
for a considerable period from November to April.
Table SPSP 3: Details of average rainfall and altitude recorded at the District
headquarters
1 2 3 4
Average rainfall in mm
Name of the Altitude
Sl. No. (preceding 5 years
District m, msl
average)
1 Kohima 1762.5 1444.12
2 Dimapur 1224.7 260.00
3 Peren 1339.4 1445.36
4 Wokha 2161.6 1313.69
5 Mokokchung 1930.5 1325.08
6 Phek 1527.7 1524.00
7 Kiphire 810.0 896.42
8 Tuensang 1395.1 1371.60
9 Zunheboto 1462.1 1874.22
10 Mon 1871.4 897.64
11 Longleng 1395.1 1066.30
1534.6
(Source: Directorate Soil & Water Conservation, Kohima)
- 12 -Droughts and floods
The state falls under high rainfall areas with average annual rainfall of 2500mm.
The state annually enjoys regular south-east monsoon with heavy rain from May to
August and occasional rain in the months of September and October. The state being
agrarian in nature all the agricultural activities depend on the south-east monsoon.
During the monsoon season there were occasional floods of mild nature affecting major
part of the plains and foothill areas of the state. Flood mainly causes damages to
agricultural crops, livestocks, transport and communication and degradation of soil
fertility.
The state had experienced drought like situations due to failure of south-east
monsoon rain during the monsoon season. The erratic rainfall caused complete failure
of agricultural crops due to delayed and inconsistent agricultural operations. Drought
like situations in the past had caused shortage in food crops productivity leading to
severe food crisis and famine like situations all over the state. However, due to peculiar
geographical location till date no official assessment for the entire state could be done.
- 13 -Table SPSP 4: Details of drought and flood affected districts, blocks and villages in the State during last 10 years
1 2 3 4 5 6 7
Periodicity
Sl. Name of the
Particulars Names of the Block Villages Any other (pl. Not affected
No Districts Annual
specify)
No. of villages NIL NIL ALL
Flood NIL
Name (s) of villages NIL NIL ALL
Kohima No. of villages NIL NIL ALL
1
Drought NIL Name(s)
NIL NIL ALL
of villages
Onpangkong (N), No. of villages NA NA NA
Onpangkong (S),
Flood Mangkolemba,
Name (s) of villages NA NA NA
Kubolong, Changtongya,
Mokokchung Longchem
2
Onpangkong (N), No. of villages NA NA NA
Onpangkong (S),
Drought Mangkolemba,
Name(s) of villages NA NA NA
Kubolong, Changtongya,
Longchem
NIL NIL ALL
No. of villages
Flood NIL
Zunheboto Name (s) of villages NIL NIL ALL
3 No. of villages NIL NIL ALL
Drought NIL Name(s)
NIL NIL ALL
of villages
No. of villages NIL NIL ALL
Flood NIL
Name (s) of villages NIL NIL ALL
4 Wokha
No. of villages NIL NIL ALL
Drought NIL
Name(s) of villages NIL NIL ALL
- 17 -No.of villages NIL NIL ALL
Flood NIL
Phek Name (s) of villages NIL NIL ALL
5
No.of villages NIL NIL ALL
Drought NIL
Name(s) of villages NIL NIL ALL
No.of villages NIL NIL ALL
Flood NIL
Mon Name (s) of villages NIL NIL ALL
6
No.of villages NIL NIL ALL
Drought NIL
Name(s) of villages NIL NIL ALL
No.of villages NIL NIL ALL
Flood NIL
Name (s) of villages NIL NIL ALL
7 Dimapur
No.of villages NIL NIL ALL
Drought NIL
Name(s) of villages NIL NIL ALL
No.of villages NIL NIL ALL
Flood NIL
Name (s) of villages NIL NIL ALL
Kiphire
8 No.of villages NIL NIL ALL
Drought NIL Name(s)
NIL NIL ALL
of villages
9 Peren Flood NIL No.of villages NIL NIL ALL
- 18 -Name (s) of villages NIL NIL ALL
6
No.of villages NA
Bongkolong 2007 Mild
Chalkot 2007 Moderate
Drought NIL Name
Inbung 2007 Moderate
(s) NA
Kejanglwa 2007 Moderate
of villages
Phaijol 2007 Mild
Dungki 2007 Moderatel
No.of villages NIL NIL ALL
Flood NIL
Name (s) of villages NIL NIL ALL
10 Tuensang No.of villages NIL NIL ALL
Drought NIL Name(s)
NIL NIL ALL
of villages
No.of villages NIL NIL ALL
Flood NIL
Name (s) of villages NIL NIL ALL
11 Longleng
No.of villages NIL NIL ALL
Drought NIL
Name(s) NIL NIL ALL
- 19 -of villages
Flood NA No. of villages NA NA NA
NAGALAND Name(s)
Drought NA NA NA NA
of villages
- 20 -Chapter 3
Demography and land distribution – An Overview
The population of Nagaland is 1.99 million according to 2001 census and is
scattered over 11 districts, 52 Blocks and 1278 villages. The State has the density of
120 persons per sq. km. The population of the State has highest decadal growth rate in
India by 64.53% over the period 1991-2001. The sex ratio of Nagaland at 909 females
to 1000 males is lower than the national average of 933. The literacy of the State rose
to 67.11% from 61.65% in 1991. The rural population constitutes about 82.3% in 2001,
against 90% in 1971. This is an indication of the migration that is taking place in the
state from rural to urban areas. The main reasons for migration are better job
opportunities and access to educational institutions and health care facilities. The total
work force in various categories in the state is about 8, 49,982. There are many distinct
tribes and a number of sub-tribes inhabiting the area such as Angamis, Chakhesangs,
Zeliangs, Rengmas, Phoms, Yimchungers, Semas, Aos, Lothas, Chang, Sangtam,
Konyaks, etc..
Sl. No. Demographical features
1981 7,74,930
1 Population 1991 12,09,546
2001 19,88,636
2 Per capita availability of land 6.8 Ha.
3 Sex Ratio 909
4 Population age group NA
5 Literacy 67.11
Migration 7.7% (1971-2001)
Cultivators 5,44,433
Work force available in different Household Industries 18,072
6
sectors of economy Agricultural Labourers 33,852
Other Workers 2,53,625
7 ST Population 19,88,636
8 BPL 69.79%
9 Landless families NIL
(Source: Directorate of Economics & Statistics, Nagaland)
- 18 -Land Reform Measures & Operational Land Holdings in the State
In Nagaland the problem of fragmentation of land holdings is not an issue on
account of the peculiar pattern of land-ownership, tenure and use prevalent in the state.
The only legal framework is the Jhum Land Regulation Act. 1970. The ownership of
land and the individual rights are governed by customary laws of the community. Due to
the unique ownership and management system of the Nagas, there is little or no
alienation of the people from their land and resources and therefore, even farmers,
despite their poor economic condition can be considered resource-rich. A comparatively
low population pressure, high regeneration rate of natural resources, community-based
natural resource management initiatives and projects like the watershed programmes
have all further created opportunities for other economic activities to take place and
contribute to the overall development of the state.
In Nagaland, cultivable land is the most valued form of property for its economic,
political and symbolic significance. It is a productive, wealth-creating and livelihood-
sustaining asset. It also provides a sense of identity and rootedness because it has
durability and permanence, which no other asset possesses. Over and above this, in
the Naga context, ancestral land has a symbolic meaning, which purchased land does
not. Moreover, there are different rules for devolution of ancestral and self-acquired
land. Naga society is based on patrilineal descent; hence children take their social
identity from their father and are placed in his agnatic group and familial unit. A female
child’s membership of her father’s agnatic unit is neither permanent nor complete.
Gender differences in group membership and social identity are closely connected with
the patterns of inheritance and resource distribution. In Naga societies, property is
inherited by the male heirs and transmitted through them. They have legal rights in
ancestral property. The women have no share in such inheritance although acquired
properties can be gifted to daughters also. It is widely believed that the daughters after
their marriage come under the care of the husband’s clan and family. Largely because
of this, in practice, no landed property was gifted to women although most of the work
on the land was done by the womenfolk. In recent times, through the pioneering
initiatives undertaken by few private and official, women are being allowed to own land.
Nagaland has an operational area of about 15, 85,525 hectares out of the total
geographical area of the state, and uniquely possess the highest operational holdings
size at 6.8 ha, which is higher than the Northeast regional average (1.59 ha) and also
the all-India level (1.6 ha).
- 19 -Table-DPSP-5: Details of District-wise land holding pattern in the district.
Type of Farmers (No of Household) Land Holding in Ha
No. of BPL
Sl. No Name of district Total No.
Large Medium Small Marginal Landless household Irrigated Rainfed Total
1 Wokha 1012 7671 1505 4124 0 14312 11217 2269.15 22425.78 24694.93
2 Longleng 1202 7415 1802 348 0 10767 5942 1337.00 12777.70 14114.70
3 Tuensang 2406 10734 2194 920 0 16254 15762 6476.49 42699.74 49176.23
4 Zunheboto 538 8062 1954 532 0 11086 7948 6120.50 25740.16 31860.66
5 Dimapur 1280 7967 1738 452 0 11437 4648 14635.23 32380.00 47015.23
6 Mon 1002 11726 3405 560 0 16693 11620 2332.30 75195.70 77528.00
7 Peren 660 8074 1377 329 0 10440 5875 4381.27 31365.60 35746.87
8 Mokokchung 1511 12078 1733 604 0 15926 13914 5601.69 44156.78 49758.47
9 Phek 1838 8742 1480 488 0 12548 11045 9441.95 45815.22 55257.17
10 Kiphire 1065 7329 1274 384 0 10052 8334 1500.00 10474.00 11974.00
11 Kohima 2005 14801 2290 572 0 19668 7809 7056.81 35790.63 42847.44
Total 14519 104599 20752 9313 0 149183 104114 61152.39 378821.31 439973.70
Source: State Focus Paper 2006-2007, Nagaland, NABARD-Nagaland and NASTEC.
- 19 -Table SPSP 6: Share of Agriculture Sector to State Income/National Income at Current Prices and Total Work Force
in the State and India
1 2 3
Percentage share of Agriculture in NSDP figure Percentage share of Agriculture in Total Workforce
Year
State All India State All India
1980-81 28.65 NA 80.28 68.80
1990-91 27.42 26.46 82.86 66.90
2000-01 27.42 22.98 68.03 NA
Source: (1). Directorate of Economics & Statistics, Nagaland.
(2). Central Statistical Organisation, Ministry of Statistical & Programme Implementation, GOI, New-Delhi.
Table SPSP 7: Sectoral Composition of Net State Domestic Product (NSDP) in State.
Years
Sector
1970-71 1980-81 1990-91 2000-01
Agriculture and allied
NA 3428 19267 106202
Sectors
Industrial Sector NA 2374 8047 39909
Service Sector NA 5806 38942 192491
(Source: Directorate of Economics & Statistics, Nagaland)
- 20 -Chapter 4
Land Use Pattern
The land ownership and management systems of the Nagas are unique and
different from the rest of the country, where local customary laws govern the land. Such
laws are tribe-specific where each tribe or even village has its own unique customary laws
and traditions. These customary laws are usually not codified but have the constitutional
sanction. The enforcement of these traditional laws and regulations rests on traditional
village institutions such as village councils, tribal chiefs or headmen.
In Nagaland, about 92% of the land is unclassified and are under the community
ownership, which may fall under any one of the recognized four categories- Private land,
Clan land, Morung land, and Common land. The state government owns just about 7% of
the total land area.
Depending upon the tribe, the land either belongs to the headmen, the community
or individual. Except for some tribes where the chief owns the land, the village councils
and headmen are generally mere custodians of the land. In most community land, all
members have a right to use it freely but with prior consent of the custodians. There are,
however, restrictions on transfer or even use of traditional land by outsiders. Outsiders are
people who do not belong to the community or clan, or in some cases, are not subject of
the same chief. Jhum lands are usually owned by the community but regulated by the
respective village councils. The respective village councils decide the areas to be cleared
for jhumming each year. Individual’s plots are allotted by draw of lots in most cases. A
very democratic system is adopted for the allotment of annual jhum plots. Long-term
holding of land for permanent cultivation, gardens and homesteads are usually undertaken
after prior consultation with village authorities, clan elders or with respective owners.
Increased privatization and individual ownership, especially of land under
permanent cultivation such as wet rice cultivation, terraced lands, orchards, gardens, tree
farming, bamboo grooves, etc., are recent noticeable trends in the state. These trends are
more so in valley areas and lowlands than in the foothills. However, the practices and
trends of land ownership differ from tribe to tribe, and these largely depend on existing
traditions, availability of land and interpersonal relationship with the traditional institutions
or the headmen.
- 21 -Table-SPSP 8: Land Use Status in the State (average of preceding 5 years)
(Area in Ha.)
Land
Rainfed area under Net area
Land under
Geogra- Tree Clad Perm- sown Gross
Sl. under miscellan- Current Other Net sown Net irrig-
Districts phical Area/Forest anent more cropped
No. Non- eous tree fallow fallow area ated area
Area Area pastures than area
Agril. use b)cultiva- crops and
a)cultivated once
ble waste groves
1 Wokha 162800 82980.58 4863.88 13134.33 9291.45 NA 11039.48 41490.28 13134.33 2269.15 13134.33
2 Longleng 58721 23721.40 2545.30 8908.10 3869.60 NA 7815.90 11860.70 8908.10 1337.00 8908.10
3 Tuensang 247894 125439.41 4043.96 23037.23 19662.51 NA 12991.18 62719.71 23037.23 6476.49 23037.23
4 Kiphire 116185 57352.00 2646.00 8960.00 1514.00 NA 17250.00 28463.00 8960.00 1500.00 8960.00
5 Phek 202600 91309.80 5497.14 17396.73 28418.49 NA 59.00 14263.94 45654.90 17396.73 9441.95 17396.73
6 Mon 178600 90788.30 5501.70 32519.10 42676.60 NA 3937.82 3176.48 32519.10 2332.30 32519.10
7 Zunheboto 125500 51035.53 4997.14 14178.62 11561.54 NA 18209.40 25517.77 14178.62 6120.50 14178.62
8 Mokokchung 161500 57067.11 8992.88 12597.94 31558.84 NA 22749.67 28533.56 12597.94 5601.69 12597.94
9 Dimapur 92700 42200.00 8200.00 18470.00 13910.00 NA 5850.00 1670.00 2400.00 18470.00 2234.00 14635.23 20704.00
10 Peren 179224 88715.04 3789.59 14399.79 16965.81 NA 2220.27 8775.98 44357.52 14399.79 54.00 4381.27 14453.79
11 Kohima 132176 57123.92 4944.02 13346.78 22443.85 NA 98.34 5657.14 28561.95 13346.78 7056.81 13346.78
Nagaland 1657900 767733.09 56021.61 176948.62 201872.69 NA 8227.61 124360.51 322735.87 176948.62 2288.00 61152.39 179236.62
* The entire area of Nagaland is under Rainfed excepting some pockets which are irrigated.
(Source: Nagaland Science & Technology Council (NASTEC)
- 22 -Irrigated Areas
Nagaland is basically an agricultural state, and all the resources depend
upon the agricultural output. Water is evidently the most vital element in the plant
life and is normally supplied to the plants by natural rain. However, the total rainfall
in a particular area may be either inadequate or is ill-timed. Therefore in order to
get the maximum yield from a crop, it is essential to supply optimum quantity of
water to the crop and to maintain correct timings of water. This is possible only
through a systematic irrigation system by collecting water during rainfall and from
natural sources and to release it to the crops as and when it is needed.
In Nagaland, State Government has made considerable investment in
irrigation. There is no major or medium irrigation project so far constructed in the
State. However, the State is in the process of taking up some medium irrigation
projects also. The department of Irrigation and Flood Control in the state has
undertaken the Minor Irrigation schemes which are most vital and very suitable for
the state. The total area in the state under irrigation is 61,152.39 hectares. The
irrigation works are mostly meant to divert small hill streamlets to irrigate valleys
used for rice cultivation. Most of the villages are scattered and perched on the hill-
top and the cultivators traditionally cultivate the hill slopes either by making terraces
or by jhumming. Irrigation is provided only in terraced fields wherever the facilities
exist to bring water from the sources by gravity system through M.I. Channels. Due
to non-availability of well organized irrigation system, a vast area of land both under
forest and jhumlands, which if brought under permanent irrigation, the food grain
production in the state could be raised enormously.
- 23 -Table-SPSP 9: Irrigation Status (Area in Ha.)
Rainfed
Sl. Gross Net cultivated Gross Net irrigated Net irrigated % of net
Districts
No. cultivated area area irrigated area area % Area cultivated
area
1 Wokha 13134.33 13134.33 3550.00 2269.15 63.92 22425.78 58.57
2 Longleng 8908.10 8908.10 1897.00 1337.00 70.48 12777.70 69.72
3 Tuensang 23037.23 23037.23 7200.00 6476.49 89.95 42699.74 53.95
4 Kiphire 8960.00 8960.00 2087.00 1500.00 71.87 10474.00 85.55
5 Phek 17396.73 17396.73 10162.00 9441.95 92.91 45815.22 37.97
6 Mon 32519.10 32519.10 4183.00 2332.30 55.76 75195.70 43.25
7 Zunheboto 14178.62 14178.62 7050.00 6120.50 86.82 25740.16 55.08
8 Mokokchung 12597.94 12597.94 6154.00 5601.69 91.03 44156.78 28.53
9 Dimapur 20704.00 18470.00 15400.00 14635.23 95.03 32380.00 57.04
10 Peren 14453.79 14399.79 5240.00 4381.27 83.61 31365.60 45.91
11 Kohima 13346.78 13346.78 11957.00 7056.81 59.02 35790.63 37.29
Nagaland 179236.62 176948.62 74880.00 61152.39 81.67 378821.31
(Source: Nagaland Basic Facts-2008, Directorate of Agriculture Department, Nagaland & NASTEC)
- 24 -Table-SPSP 10: Source-wise Area Irrigated (Area in Ha.)
Others (Pl.
Tanks Open wells Bore wells Lift irrigation Total
Sl. Canal
Districts specify)
No. (Area)
No Area No Area No Area No Area No Area No Area
1 Wokha 4054.50 NA NA NA NA NA NA 2 16 NA NA 2 4070.50
2 Longleng 792.78 NA NA NA NA NA NA NA NA NA NA NA 792.78
3 Tuensang 2465.00 NA NA NA NA NA NA NA NA NA NA NA 2465.00
4 Zunheboto 3559.00 NA NA NA NA NA NA NA NA NA NA NA 3559.00
5 Dimapur 12625.86 NA NA NA NA NA NA 10 69 NA NA 10 12694.86
6 Mon 1826.00 NA NA NA NA NA NA NA NA NA NA NA 1826.00
7 Peren 2445.00 NA NA NA NA NA NA NA NA NA NA NA 2445.00
8 Mokokchung 1879.00 NA NA NA NA NA NA 3 25 NA NA 3 1904.00
9 Phek 6345.25 NA NA NA NA NA NA NA NA NA NA NA 6345.25
10 Kiphire 257.89 NA NA NA NA NA NA NA NA NA NA NA 257.89
11 Kohima 5856.55 NA NA NA NA NA NA NA NA NA NA NA 5856.55
Nagaland 42106.83 15 110 15 42216.83
(Source: Report on Census of Minor Irrigation Schemes in Nagaland, 2000-01)
- 25 -Common Property Resources (CPR)
A major strength that contemporary Naga society has inherited is the 'social capital'
that has stemmed out of traditional institutions and practices. There is strong social bonding
and community spirit, and absence of caste and social discrimination. In Nagaland, there is
no landless household although the major proportion of land is held as common village land,
which is either jhum land or community forestland which is regulated by the village councils.
The Naga people have a strong bonding with the social institutions and resources which
occupies the centre-stage of their daily life. The community resources and institutions such
as forests, woodlots, ponds/tanks, community halls, churches, community grounds,
Schools, Healthcare units, power, etc., are maintained in each and every unit village. The
resources and institutions are managed by separate representative committees empowered
to lay down rules and regulations for effective management and development. The
resources and institutions are for common use and every individual has the liberty to use it
freely but with prior consent of the village council, tribal chief or headman within the ambit of
traditional laws and regulations of the respective village/tribe.
The Nagaland Village and Area Councils Act, 1978, also strived to exploit the
traditional administration abilities of Village Councils for decentralization of developmental
responsibilities to the local bodies. As envisaged in the Act, the constitution of Village
Development Boards (VDBs) to take on these responsibilities of the Village Council was
formalized through the Village Development Boards Rules notified in 1980. The Village
Development Board formulates development priorities for the village, prepares action plans
and executes them, using the village community or other funds. A VDB is managed by a
committee chosen by the Village Council and includes traditional leaders and twenty-five
percent of the membership is reserved for women. Government assistance to the VDBs
includes grants-in-aid, matching cash grants, Jawahar Rozgar Yojana, MGNREGA, and
other development and welfare programmes. The VDBs have become the cornerstone of
de-centralised planning and development in Nagaland. In many places, VDBs’ performance
has been exemplary. They have played a pivotal role in creation and maintenance of
infrastructure in the villages– community halls, village roads, schools, water tanks, toilets,
granaries, rice mills, community fishery ponds, community wells/tanks, culverts and
suspension bridges, etc. Many VDBs have purchased buses and ply them from the village
to the district headquarters, serving both as an income generating activity and facilitating
connectivity with other towns and villages. The State Government has been encouraging
internal resource mobilisation by the VDBs through different schemes. Building on the rich
social capital of the village communities and benefiting from this structural linkage, the
VDBs continue to pioneer micro-level development in imaginative, culturally appropriate and
resource-efficient ways.
- 26 -Table-SPSP 11: Details of Common Property Resources in the districts (Area in Ha.)
1 2 3 4 5
Sl. Name of CPR particulars Total area owned/in possession of Area available for treatment
No. District Pvt. persons Govt. PRI Community Pvt. PRI Community
Govt.
(specify persons (specify
dept.) dept.)
i. Wasteland/ 486726.81 162242.26 460226.81 139528.67
Degraded land
ii. Pastures
iii. Orchards 45148.37 521.00 2450.00
iv. Village woodlot 14155.07 16353.28 2710.00 1465.00
v.Tree clad/Forest 568144.93 4058.03 173190.39 449323.63 129553.76
vi. Village ponds/ tanks 301.50 182.57
vii. Community 580.19
Nagaland buildings
viii. Weekly markets 59.12
ix. Permanent markets 26.05
x. Temples/places of 603.07
worship
xi. Others 185607.36 3045.40
(Settlements/Cultivated
areas/etc)
TOTAL 1657900.00 1188303.27
(Source: Nagaland Science and Technology Council (NASTEC)
- 27 -Table-SPSP 11 (Contd): Details of Common Property Resources in the district (Area in Ha.)
1 2 3 4 5
Total area owned/in possession of Area available for treatment
Name Govt. Govt.
Sl. of Pvt. (specify Any other Pvt. (specify Any other
No. District CPR particulars persons dept.) PRI (pl. specify) persons dept.) PRI (pl. specify)
i. Wasteland/ Degraded
land 46365.91 15455.30 46365.91 15455.30
ii. Pastures
iii. Orchards 10087.00
iv. Village woodlot 10.00 27.88
v. Tree clad/Forest 64728.78 0.00 18213.92 39641.77 7737.02
vi. Village ponds/ tanks
1 Wokha vii. Community buildings
viii. Weekly markets 5.00
ix. Permanent markets 1.30
x. Temples/ places of
worship 56.00
xi. Others
(Settlements/Cultivated
areas/etc.) 7848.91
TOTAL
162800.00 109200.00
- 28 -Table-SPSP 11 (Contd): Details of Common Property Resources in the district (Area in Ha.)
1 2 3 4 5
Total area owned/in possession of Area available for treatment
Govt. Govt.
Sl. Name of Pvt. (specify Any other Pvt. (specify Any other
No. District CPR particulars persons dept.) PRI (pl. specify) persons dept.) PRI (pl. specify)
i. Wasteland/
Degraded land 17659.65 5886.55 17659.65 5886.55
ii. Pastures
iii. Orchards 3854.00 2450
iv. Village woodlot 2508 725 1560 515
v. Tree clad/Forest 12475.8 8012.6 12475.8 7158.6
vi. Village ponds/ tanks 35 17
2 Longleng vii. Community
buildings 59
viii. Weekly markets 6
ix. Permanent markets 3
x. Temples/ places of
worship 60.21
xi. Others
(Settlements/Cultivated
areas/etc.) 7419.19 3045.4
TOTAL 58721 50751
- 29 -Table-SPSP 11 (Contd): Details of Common Property Resources in the district (Area in Ha.)
1 2 3 4 5
Sl. Name of CPR particulars Total area owned/in possession of Area available for treatment
No. District Pvt. Govt. PRI Any other Pvt. Govt. PRI Any other
persons (specify (pl. persons (specify (pl.
dept.) specify) dept.) specify)
i. Wasteland/ 71530.05 23843.35 61530.05 13843.35
Degraded land
ii. Pastures
iii. Orchards 4601.00
iv. Village woodlot 1545.00 1995.00
v. Tree clad/Forest 92574.81 29324.60 77696.00 19324.60
vi. Village ponds/ tanks 38.00 27.00
vii. Community 61.00
3 Tuensang buildings
viii. Weekly markets 4.80
ix. Permanent markets 2.15
x. Temples/ places of 57.92
worship
22289.32
xi. Others
(Settlements/Cultivated
areas/etc.)
TOTAL
247894.00 172394.00
- 30 -Table-SPSP 11 (Contd): Details of Common Property Resources in the district (Area in Ha.)
1 2 3 4 5
Sl. Name of CPR particulars Total area owned/in possession of Area available for treatment
No. District Pvt. Govt. PRI Any Pvt. Govt. PRI Any
persons (specify other (pl. persons (specify other (pl.
dept.) specify) dept.) specify)
i. Wasteland/ 41466.53 13822.18 40466.53 10822.18
Degraded land
ii. Pastures
iii. Orchards 2521.00
iv. Village woodlot 1545.00 2100.00
v. Tree clad/Forest 36173.15 11217.38 22293.91 8217.38
vi. Village ponds/ tanks 52.00 15.00
vii. Community 62.00
4 Zunheboto
buildings
viii. Weekly markets 4.80
ix. Permanent markets 3.10
x. Temples/ places of 49.00
worship
16468.86
xi. Others
(Settlements/Cultivated
areas/etc.)
TOTAL
125500.00 81800.00
- 31 -Table-SPSP 11 (Contd): Details of Common Property Resources in the district (Area in Ha.)
1 2 3 4 5
Sl. Name of CPR particulars Total area owned/in possession of Area available for treatment
No. District Pvt. Govt. PRI Any Pvt. Govt. PRI Any
persons (specify other (pl. persons (specify other
dept.) specify) dept.) (pl.
specify)
i. Wasteland/
Degraded land 13485.00 4495.00 13485.00 4400.00
ii. Pastures
iii. Orchards 1294.27
iv. Village woodlot 322.00
v. Tree Clad
Areas/Forest 40144.00 7584.00 30064.77 5800.00
vi. Village ponds/ tanks 48.00
5 Dimapur vii. Community
buildings 61.00
viii. Weekly markets 7.80
ix. Permanent markets 4.10
x. Temples/ places of
worship 35.00
xi. Others
(Settlements/Cultivated
areas/etc) 25219.83
TOTAL
92700.00 53749.77
- 32 -Table-Table SPSP 11 (Contd.): Details of Common Property Resources in the district (Area in Ha.)
1 2 3 4 5
Sl. Name of CPR particulars Total area owned/in possession of Area available for treatment
No. District Pvt. persons Govt. PRI Any other Pvt. Govt. PRI Any other
(specify (pl. specify) persons (specify (pl.
dept.) dept.) specify)
i. Wasteland/ Degraded 37343.18 12447.72 37343.18 12447.72
land
ii. Pastures
iii. Orchards 4288.55
iv. Village woodlot 6540.40
v.Tree clad/Forest 64045.06 284.00 19918.84 59356.51 19452.59
vi. Village ponds/ tanks 18.00
6 Mon vii. Community buildings 61.02
viii. Weekly markets 4.64
ix. Permanent markets 1.60
x. Temples/ places of 58.00
worship
xi. Others 33588.99
(Settlements/Cultivated
area/etc)
TOTAL 178600.00 128600.00
- 33 -Table-SPSP 11 (Contd): Details of Common Property Resources in the district (Area in Ha.)
1 2 3 4 5
Sl. Name of CPR particulars Total area owned/in possession of Area available for treatment
No. District Pvt. Govt. PRI Any other Pvt. Govt. PRI Any other
persons (specify (pl. persons (specify (pl.
dept.) specify) dept.) specify)
i. Wasteland/
Degraded land 16524.83
52574.48 17524.83 51574.48
ii. Pastures
iii. Orchards 4696.00
iv. Village woodlot
v. Tree Clad
Areas/Forest 18266.84
67553.85 2428.85 20952.61 57857.85
vi. Village ponds/ tanks 22.00 30.00
7 Peren vii. Community
buildings 58.00
viii. Weekly markets
5.50
ix. Permanent markets 2.80
x. Temples/ places of
worship
59.82
xi. Others
(Settlements/Cultivated
areas/etc) 13315.26
TOTAL
179224.00 144224.00
- 34 -Table-SPSP 11 (Contd): Details of Common Property Resources in the district (Area in Ha.)
1 2 3 4 5
Sl. Name of District CPR particulars Total area owned/in possession of Area available for treatment
No. Pvt. Govt. PRI Any other Pvt. Govt. PRI Any other
persons (specify (pl. persons (specify (pl.
dept.) specify) dept.) specify)
i. Wasteland/ Degraded 62131.55 20710.52 56631.55 17272.79
land
ii. Pastures
iii. Orchards 4521.00
iv. Village woodlot 2105.45 945.00
v.Tree Clad Area/ 41642.75 12373.91 29121.75 8373.91
Forest
vi. Village ponds/ tanks 38.00 8.00
8 Mokokchung vii. Community 57.09
buildings
viii. Weekly markets 4.84
ix. Permanent markets 2.80
x. Temples/ places of 61.00
worship
xi. Others 16898.09
(Settlements/Cultivated
area/etc)
TOTAL
161500.00 111400.00
- 35 -Table-SPSP 11 (Contd): Details of Common Property Resources in the district (Area in Ha.)
1 2 3 4 5
Total area owned/in possession of Area available for treatment
Sl. Name of Govt. Any other Govt.
CPR particulars Pvt. Pvt. Any other (pl.
No. District (specify PRI (pl. (specify PRI
persons persons specify)
dept.) specify) dept.)
i. Wasteland/
66253.00 22084.33 64253.00 20084.33
Degraded land
ii. Pastures
iii. Orchards 2743.00
iv. Village woodlot 1445.00 2600.00
v. Tree clad/Forest 66134.35 0.00 21130.45 57002.22 0.00 18130.45
vi. Village ponds/ tanks 52.00 13.00
9 Phek vii. Community
63.00
buildings
viii. Weekly markets 5.00
ix. Permanent markets 1.80
x. Temples/ places of
57.00
worship
xi. Others
(Settlements/Cultivated 20018.07
areas/etc.)
TOTAL
202600.00 159470.00
- 36 -Table-SPSP 11 (Contd): Details of Common Property Resources in the district (Area in Ha.)
1 2 3 4 5
Total area owned/in possession of Area available for treatment
Sl. Name of Govt. Any Govt. Any
CPR particulars
No. District Pvt. persons (specify PRI other (pl. Pvt. persons (specify PRI other (pl.
dept.) specify) dept.) specify)
i. Wasteland/
35420.25 11806.75 35420.25 11625.89
Degraded land
ii. Pastures
iii. Orchards 3521.00
iv. Village woodlot 1512.00 1420.00 1150.00 950
v. Tree clad/Forest 41695.25 740.86 11983.89 41378.47 11983.89
vi. Village ponds/ tanks 42.27
10 Kiphire vii. Community
53.58
buildings
viii. Weekly markets 6.10
ix. Permanent markets 0.80
x. Temples/ places of
48.00
worship
xi. Others
(Settlements/Cultivated 7934.25
areas/etc.)
TOTAL
116185.00 102508.50
- 37 -Table-SPSP 11 (Contd): Details of Common Property Resources in the district (Area in Ha.)
1 2 3 4 5
Total area owned/in possession of Area available for treatment
Sl. Name of Govt. Govt. Any other
CPR particulars Pvt. Any other Pvt.
No. District (specify PRI (specify PRI (pl.
persons (pl. specify) persons
dept.) dept.) specify)
i. Wasteland/ Degraded
42497.21 14165.73 35497.21 11165.73
land
ii. Pastures
iii. Orchards 3021.55 521.00
iv. Village woodlot 3162.62
v. Forest 40977.13 604.32 12478.19 22434.58 5108.48
vi. Village ponds/ tanks 16.50 12.30
11 Kohima vii. Community buildings 44.50
viii. Weekly markets 4.64
ix. Permanent markets 2.60
x. Temples/ places of
61.12
worship
xi. Others
(Settlements/Cultivated 14606.59
areas/etc)
TOTAL
132176.00 74206.00
- 38 -Chapter 5
Trends in Agriculture and Food Productivity
Nagaland is predominantly an agricultural state. The reason is not far to seek.
Agriculture falls in the priority sector in Nagaland. Agriculture has traditionally been
and continues to be the mainstay of Naga life. The numerous festivals are centered
around agriculture and have their roots in cultivation practices. Seventy-three percent
of the people in Nagaland are engaged in agriculture. Rice is the staple food. It
occupies about 70 percent of the total cultivated area and constitutes about 75
percent of the total food grain production in the State. Other crops include maize,
linseed, potato, pulses, soyabean, sugarcane, jute, gram, cotton, castor, etc.
However, the state is not self-sufficient in food and still depends on the import of food
supplies from other states.
Agriculture is one of the significant contributors to the net state domestic
product and is the largest employer of the workforce in the State. It was the mainstay
of the people of Nagaland during 1950s, when almost 96.5 percent of the population
was dependent on agriculture. Though the dependency for employment on
agriculture has declined to 70 percent in the 1970s and further to 65 percent by 2000,
it continues to be the main source of livelihood. Shifting and terrace cultivations
remain the dominant forms of land use practice in the State.
The widespread practice of Shifting/Jhum cultivation have caused the fallow,
or idle, period to be cut to a couple of years which has led to soil erosion and loss of
soil fertility. Shifting cultivation covers over 73 percent of the total arable area of the
State. It is concentrated in all the districts of Mokokchung, Tuensang, Longleng,
Kiphire, Peren Wokha, Zunheboto,Phek,Kohima, Dimapur and Mon. Terraced rice
cultivation (TRC) or combined Jhum and TRC are practiced in a limited scale. During
the last four decades, the food grain production in Nagaland has shown an upward
trend from 62,000 metric tonnes in 1964–65 to 386,390 tonnes in 2001–02. The
productivity increased from 700 kg per hectare to 1300 kg per hectare over the
period. Non-traditional crops such as wheat, barley, spices, rubber and sugarcane
are also gaining popularity in recent years, promising to convert agriculture from
subsistence farming to commercially viable activity.
The land is extremely fertile and can produce the best quality of agro-based,
horticulture and floriculture products through organic farming. The potential of
Nagaland becoming an ‘organic state’, and for exports and foreign exchange, is real.
Strategic initiatives in the fields of animal husbandry, fishery and sericulture could
result in generation of resources and overall development of the rural economy.
The major cash crops in Nagaland are Sugarcane, potato, ginger, Naga chilly,
etc. covering an area of about 5510 Ha.
The total food-grain production in 2007-2008 is about 4,79,720 MT as per the
Directorate of Economics & Statistics, Govt. of Nagaland.
The marketing of the cash crops are through local markets, entrepreneurs and
APMCs in the state. The estimated average income of all the above mentioned cash
crops is Rs.55,000 /Ha. (Rupees fifty five thousand per hectare)
- 39 -You can also read